standard #4 - measurement and analysis of student … #4 - measurement and analysis of student...
TRANSCRIPT

Standard #4 - Measurement and Analysis of Student Learning and Performance
a. Program Outcomes
List outcomes, by accredited program. Many of the program outcomes should be used as part of a student learning assessment plan and
be measurable.
Standard #4 Measurement and Analysis of Student Learning and Performance
b. Program Outcomes
List outcomes, by accredited program. Many of the program outcomes should be used as part of a student learning assessment plan and
be measurable.
B.S. Accounting; Finance; Management Information Systems; Organizational Management B.B.A. Business Administration with Emphasis in: Health Care Administration, Management, Marketing
Graduates of the Department of Business and Information Systems will satisfy the following learning outcomes:
1. Demonstrate effective technological and communication skills
2. Gain proficiency in written and oral presentations
3. Develop knowledge and skills for business decisions
4. Apply the principles of financial analysis for business
5. Practice and apply interpersonal skills in group settings
6. Be aware of the social and ethical responsibilities of business

Standard #4 Measurement and Analysis of Student Learning and Performance - 4 b. Performance Results
ANALYSIS OF RESULTS
Performance Measure
(Competency)
Description of Measurement
Instrument
Areas of Success
(Results)
Analysis and
Action Taken
(Improvement)
Results of Action Taken
(occurs in the
following year)
Graphs or Tables of Resulting Trends for 3-5 Years
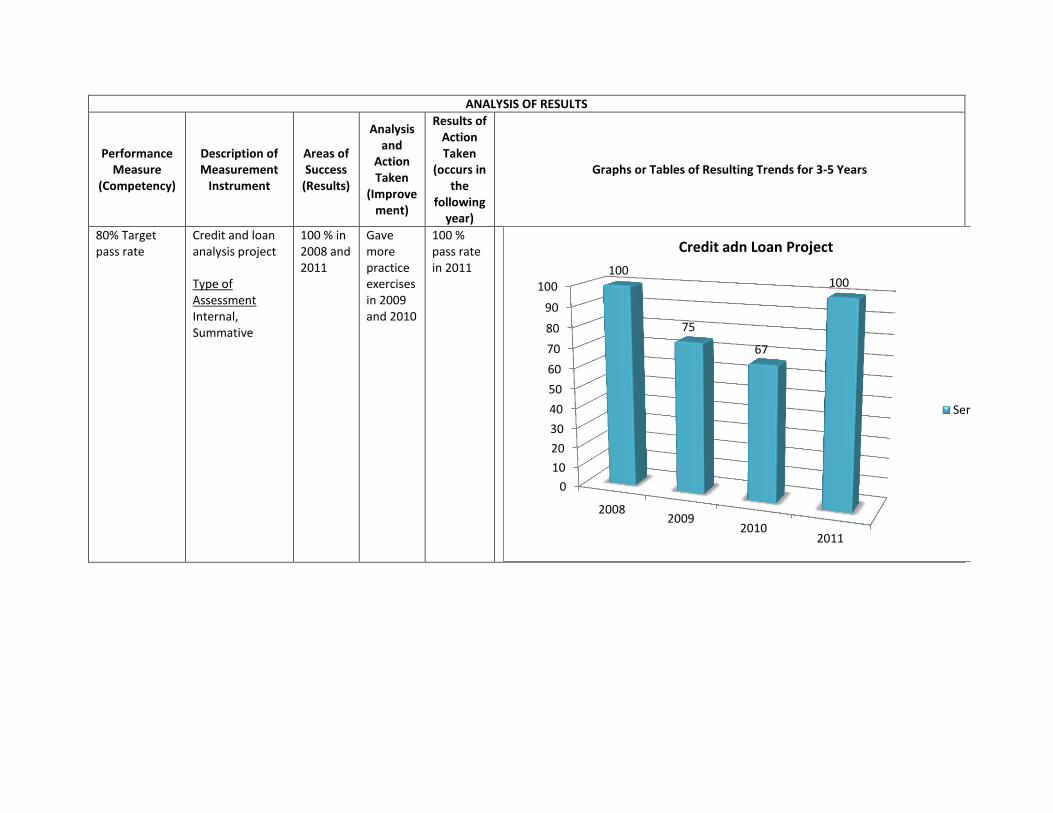
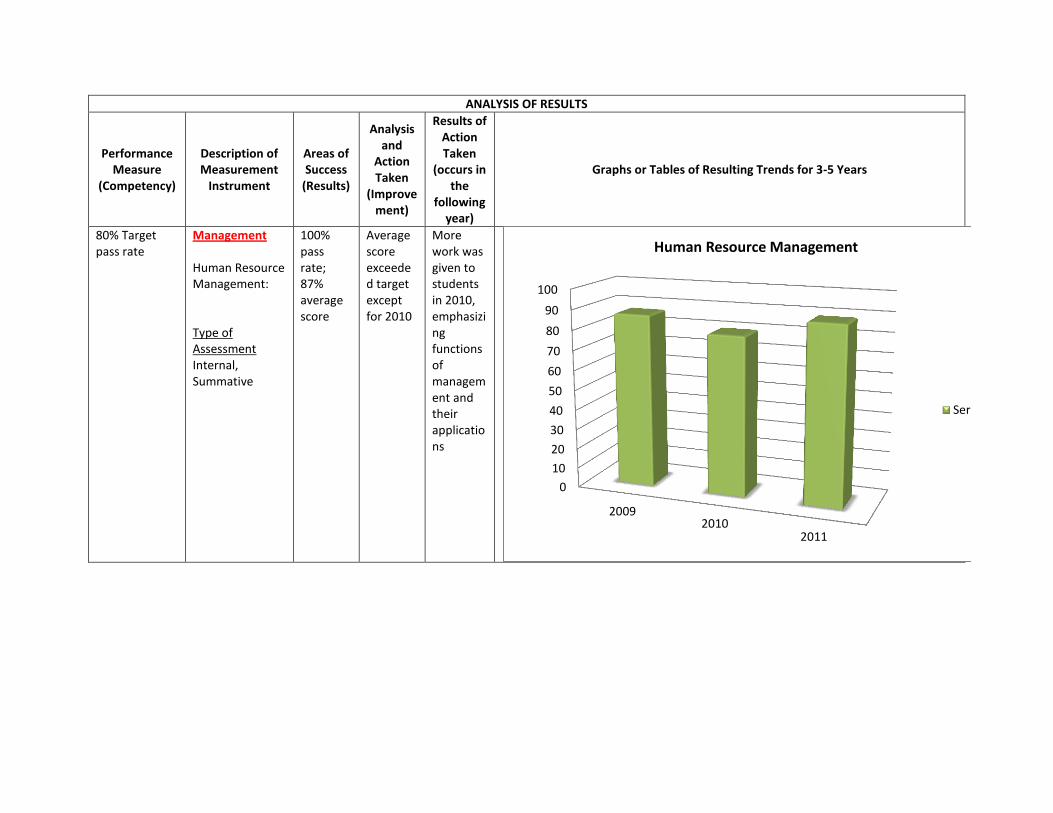
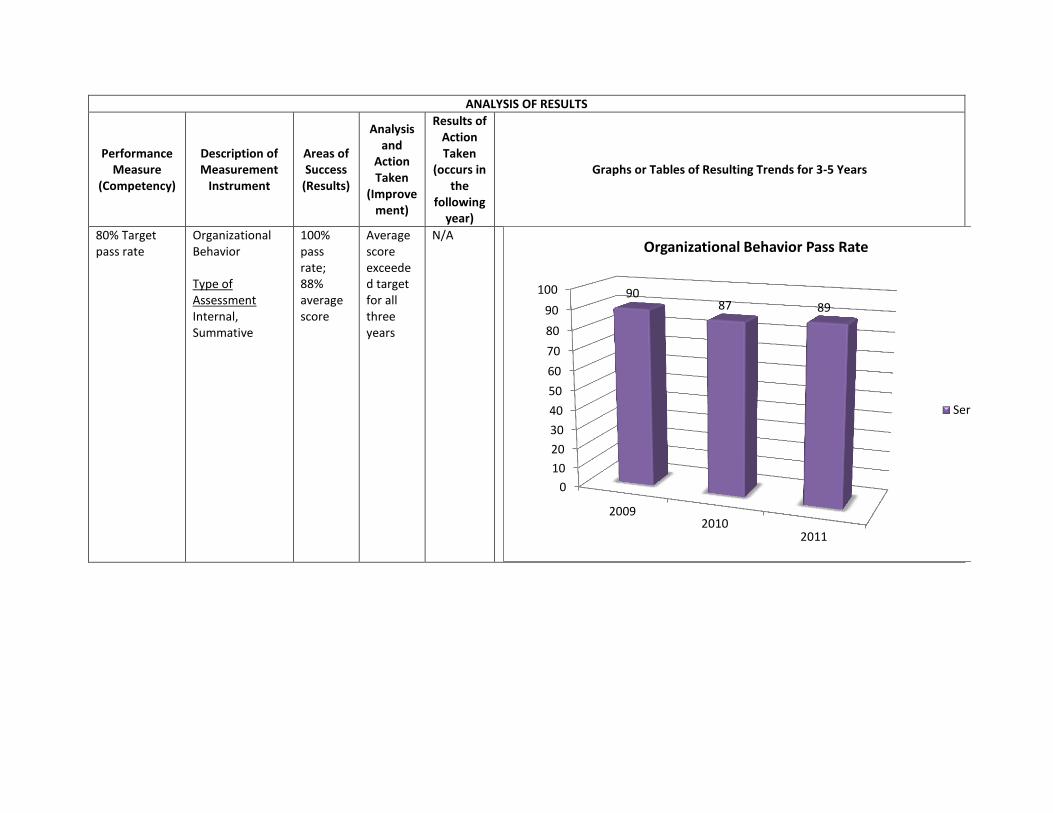
80% Target pass rate
BS Accounting AC 431 Auditing I Project Type of Assessment Internal; Summative
Average class score exceeded target rate except for 2010.
Continue same classroom techniques until 2009. Introduced Auditing for Fraud in 2010 to extend the planning and control features
N/A
0
10
20
30
40
50
60
70
80
90
100
20072008
20092010
100
86
100
78
Auditing I Project
Series 1

ANALYSIS OF RESULTS
Performance Measure
(Competency)
Description of Measurement
Instrument
Areas of Success
(Results)
Analysis and
Action Taken
(Improvement)
Results of Action Taken
(occurs in the
following year)
Graphs or Tables of Resulting Trends for 3-5 Years
80% Target pass rate
AC 350 Turbo Tax and Comprehensive Problem Type of Assessment Internal; Summative
Pass rate was below target for 2009 and 2010
Replaced Turbo with H&R Block software in 2010
Students performance to be evaluated beginning 2012
0
10
20
30
40
50
60
70
80
90
100
20082009
2010
93
66
78
Tarbo Tax Comprehensive Project
Column1
ANALYSIS OF RESULTS
Performance Measure
(Competency)
Description of Measurement
Instrument
Areas of Success
(Results)
Analysis and
Action Taken
(Improvement)
Results of Action Taken
(occurs in the
following year)
Graphs or Tables of Resulting Trends for 3-5 Years
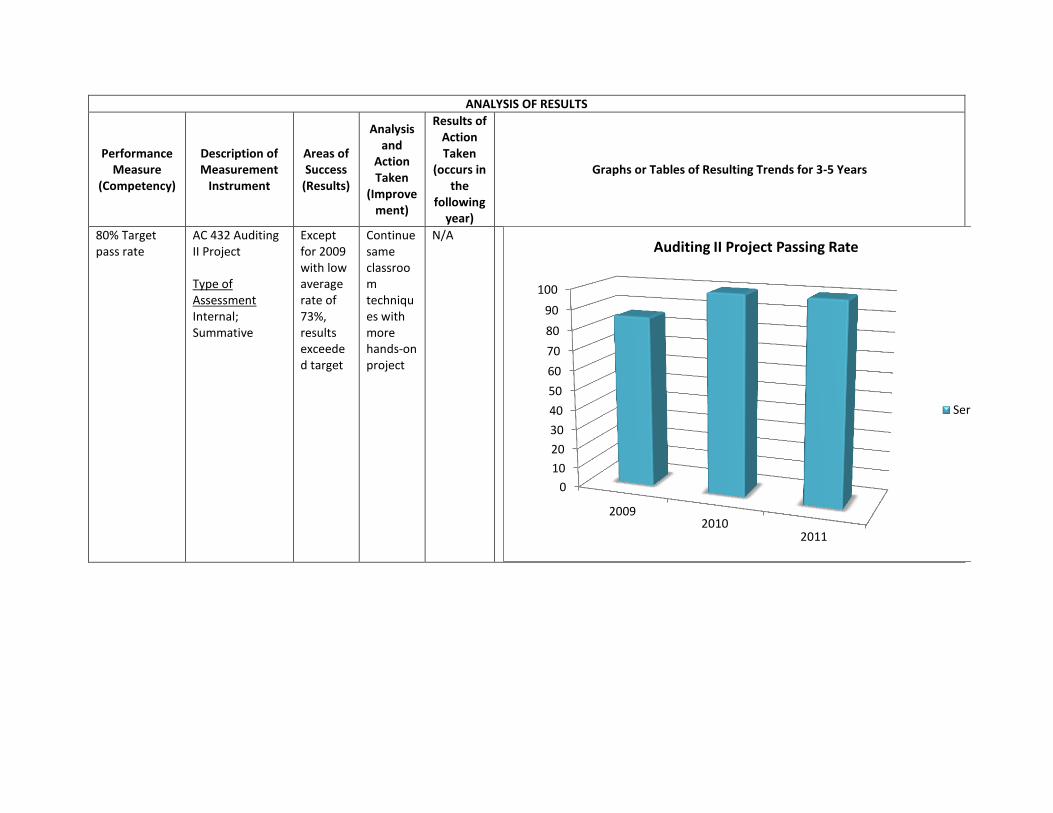
80% Target pass rate
AC 432 Auditing II Project Type of Assessment Internal; Summative
Except for 2009 with low average rate of 73%, results exceeded target
Continue same classroom techniques with more hands-on project
N/A
0
10
20
30
40
50
60
70
80
90
100
20092010
2011
Auditing II Project Passing Rate
Series 1
ANALYSIS OF RESULTS
Performance Measure
(Competency)
Description of Measurement
Instrument
Areas of Success
(Results)
Analysis and
Action Taken
(Improvement)
Results of Action Taken
(occurs in the
following year)
Graphs or Tables of Resulting Trends for 3-5 Years
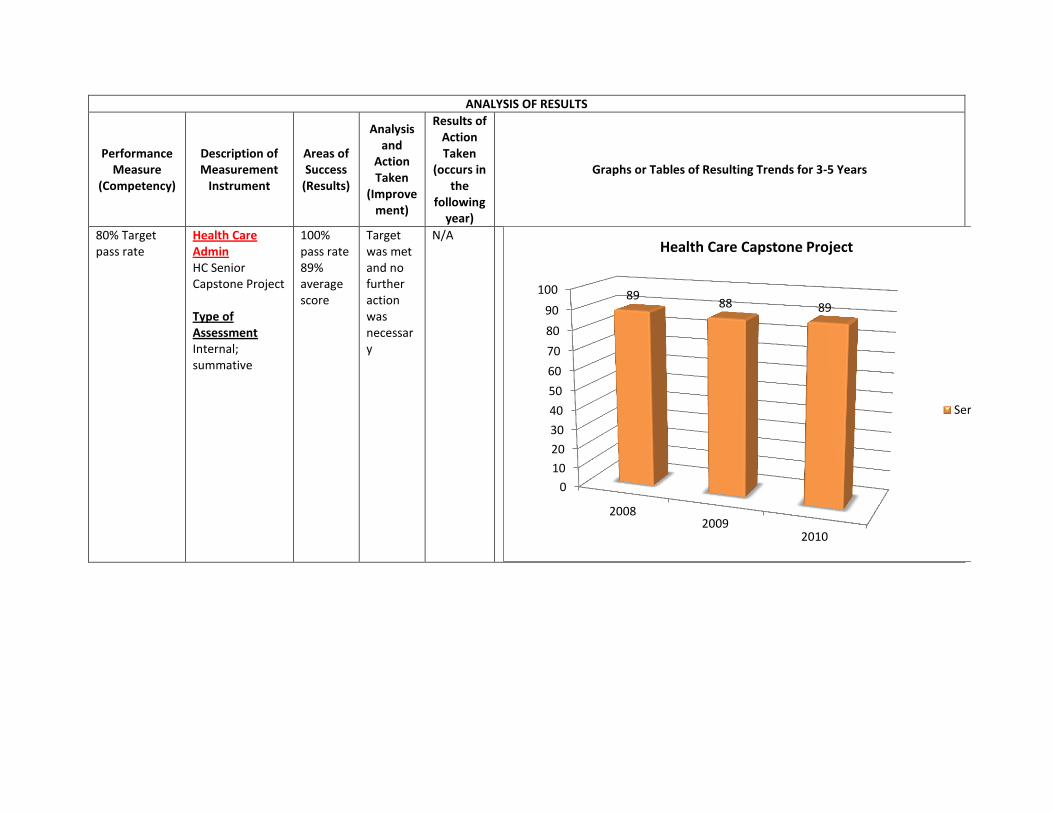
80% Target pass rate
Health Care Admin HC Senior Capstone Project Type of Assessment Internal; summative
100% pass rate 89% average score
Target was met and no further action was necessary
N/A
0
10
20
30
40
50
60
70
80
90
100
20082009
2010
89 88 89
Health Care Capstone Project
Series 1

ANALYSIS OF RESULTS
Performance Measure
(Competency)
Description of Measurement
Instrument
Areas of Success
(Results)
Analysis and
Action Taken
(Improvement)
Results of Action Taken
(occurs in the
following year)
Graphs or Tables of Resulting Trends for 3-5 Years
80% Target pass rate
Practicum Portfolio Type of Assessment Internal, summative
100% pass rate; 92% average score
Target was met and no further action was necessary
N/A
0
10
20
30
40
50
60
70
80
90
100
20082009
2010
94 91 93
Health Care Practicum Portfolio
Series 1
ANALYSIS OF RESULTS
Performance Measure
(Competency)
Description of Measurement
Instrument
Areas of Success
(Results)
Analysis and
Action Taken
(Improvement)
Results of Action Taken
(occurs in the
following year)
Graphs or Tables of Resulting Trends for 3-5 Years
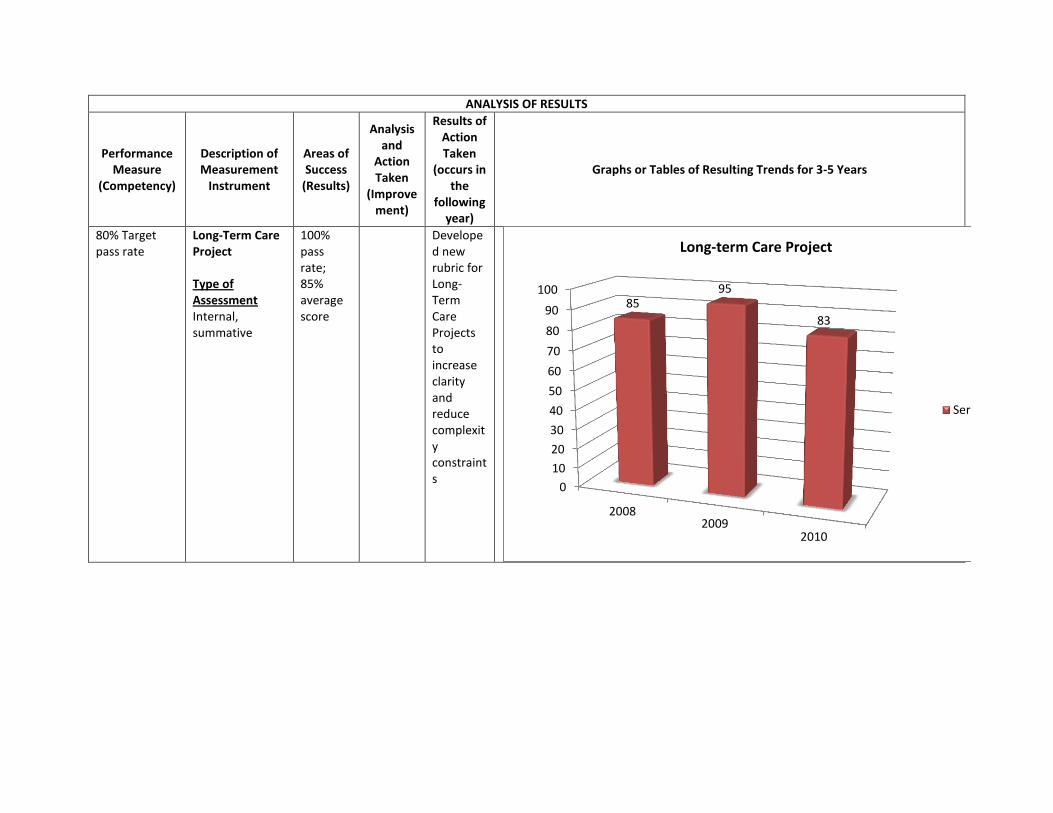
80% Target pass rate
Long-Term Care Project Type of Assessment Internal, summative
100% pass rate; 85% average score
Developed new rubric for Long-Term Care Projects to increase clarity and reduce complexity constraints
0
10
20
30
40
50
60
70
80
90
100
20082009
2010
85 95
83
Long-term Care Project
Series 1
ANALYSIS OF RESULTS
Performance Measure
(Competency)
Description of Measurement
Instrument
Areas of Success
(Results)
Analysis and
Action Taken
(Improvement)
Results of Action Taken
(occurs in the
following year)
Graphs or Tables of Resulting Trends for 3-5 Years
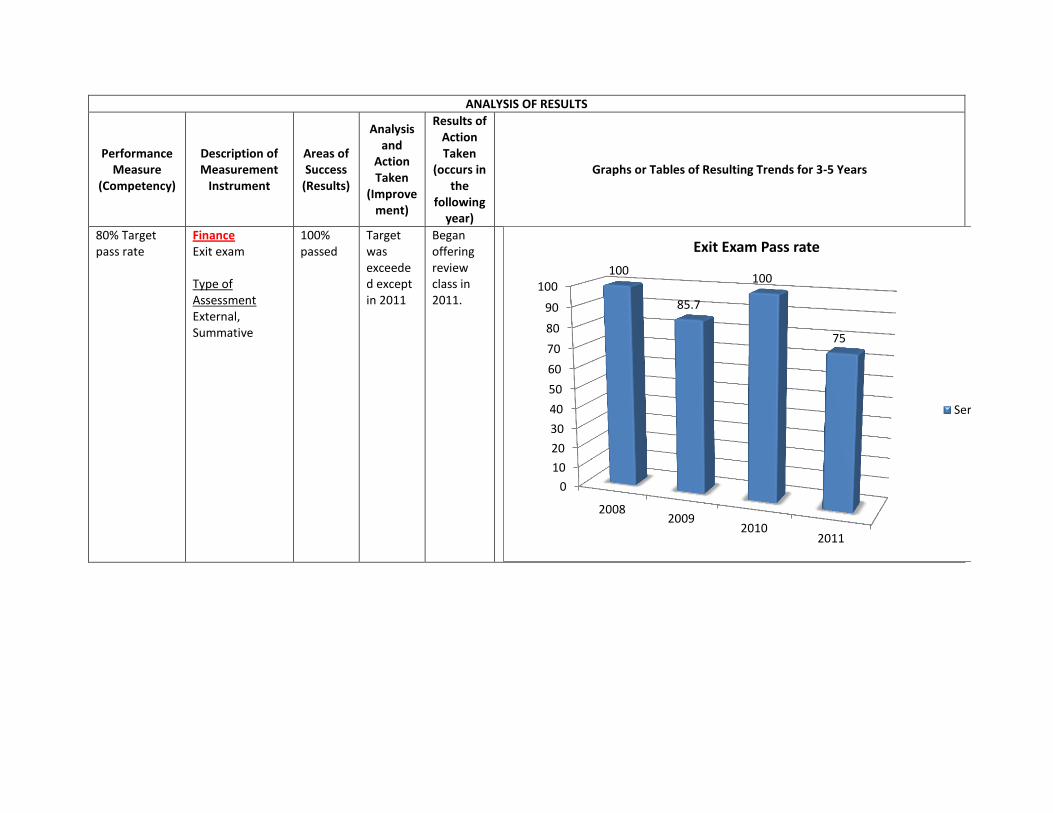
80% Target pass rate
Finance Exit exam Type of Assessment External, Summative
100% passed
Target was exceeded except in 2011
Began offering review class in 2011.
0
10
20
30
40
50
60
70
80
90
100
20082009
20102011
100
85.7
100
75
Exit Exam Pass rate
Series 1
ANALYSIS OF RESULTS
Performance Measure
(Competency)
Description of Measurement
Instrument
Areas of Success
(Results)
Analysis and
Action Taken
(Improvement)
Results of Action Taken
(occurs in the
following year)
Graphs or Tables of Resulting Trends for 3-5 Years
80% Target pass rate
Credit and loan analysis project Type of Assessment Internal, Summative
100 % in 2008 and 2011
Gave more practice exercises in 2009 and 2010
100 % pass rate in 2011
0
10
20
30
40
50
60
70
80
90
100
20082009
20102011
100
75
67
100
Credit adn Loan Project
Series 1

ANALYSIS OF RESULTS
Performance Measure
(Competency)
Description of Measurement
Instrument
Areas of Success
(Results)
Analysis and
Action Taken
(Improvement)
Results of Action Taken
(occurs in the
following year)
Graphs or Tables of Resulting Trends for 3-5 Years
80% Target pass rate
Investment portfolio project Type of Assessment Internal, Summative
Average score exceeded target for all three years
N/A
0
10
20
30
40
50
60
70
80
90
100
20092010
2011
100
85
100
Investment Portfolio Project
Series 1
ANALYSIS OF RESULTS
Performance Measure
(Competency)
Description of Measurement
Instrument
Areas of Success
(Results)
Analysis and
Action Taken
(Improvement)
Results of Action Taken
(occurs in the
following year)
Graphs or Tables of Resulting Trends for 3-5 Years
80% Target pass rate
Management Human Resource Management: Type of Assessment Internal, Summative
100% pass rate; 87% average score
Average score exceeded target except for 2010
More work was given to students in 2010, emphasizing functions of management and their applications
0
10
20
30
40
50
60
70
80
90
100
20092010
2011
Human Resource Management
Series 1
ANALYSIS OF RESULTS
Performance Measure
(Competency)
Description of Measurement
Instrument
Areas of Success
(Results)
Analysis and
Action Taken
(Improvement)
Results of Action Taken
(occurs in the
following year)
Graphs or Tables of Resulting Trends for 3-5 Years
80% Target pass rate
Organizational Behavior Type of Assessment Internal, Summative
100% pass rate; 88% average score
Average score exceeded target for all three years
N/A
0
10
20
30
40
50
60
70
80
90
100
20092010
2011
90 87 89
Organizational Behavior Pass Rate
Series 1

ANALYSIS OF RESULTS
Performance Measure
(Competency)
Description of Measurement
Instrument
Areas of Success
(Results)
Analysis and
Action Taken
(Improvement)
Results of Action Taken
(occurs in the
following year)
Graphs or Tables of Resulting Trends for 3-5 Years
90% Target pass rate
Organizational Management OM304 Prepare written reports and business correspondence Type of Assessment Internal, Summative
92% pass rate
Target exceeded
Encouraged students with English errors to attend free tutorial class
0
10
20
30
40
50
60
70
80
90
100
2010
2011
92 100
Written Reports and Correspondence Project
Series 1

ANALYSIS OF RESULTS
Performance Measure
(Competency)
Description of Measurement
Instrument
Areas of Success
(Results)
Analysis and
Action Taken
(Improvement)
Results of Action Taken
(occurs in the
following year)
Graphs or Tables of Resulting Trends for 3-5 Years
90% Target pass rate
OM 308 and OM430 Conduct basic research. Type of Assessment Internal, Summative
90% pass rate
Target met one year
Instituted a procedure that reviewed and edited all written reports so students could profit from documented feedback
0
10
20
30
40
50
60
70
80
90
100
2010
2011
90 89
Basic Research Project
ANALYSIS OF RESULTS
Performance Measure
(Competency)
Description of Measurement
Instrument
Areas of Success
(Results)
Analysis and
Action Taken
(Improvement)
Results of Action Taken
(occurs in the
following year)
Graphs or Tables of Resulting Trends for 3-5 Years
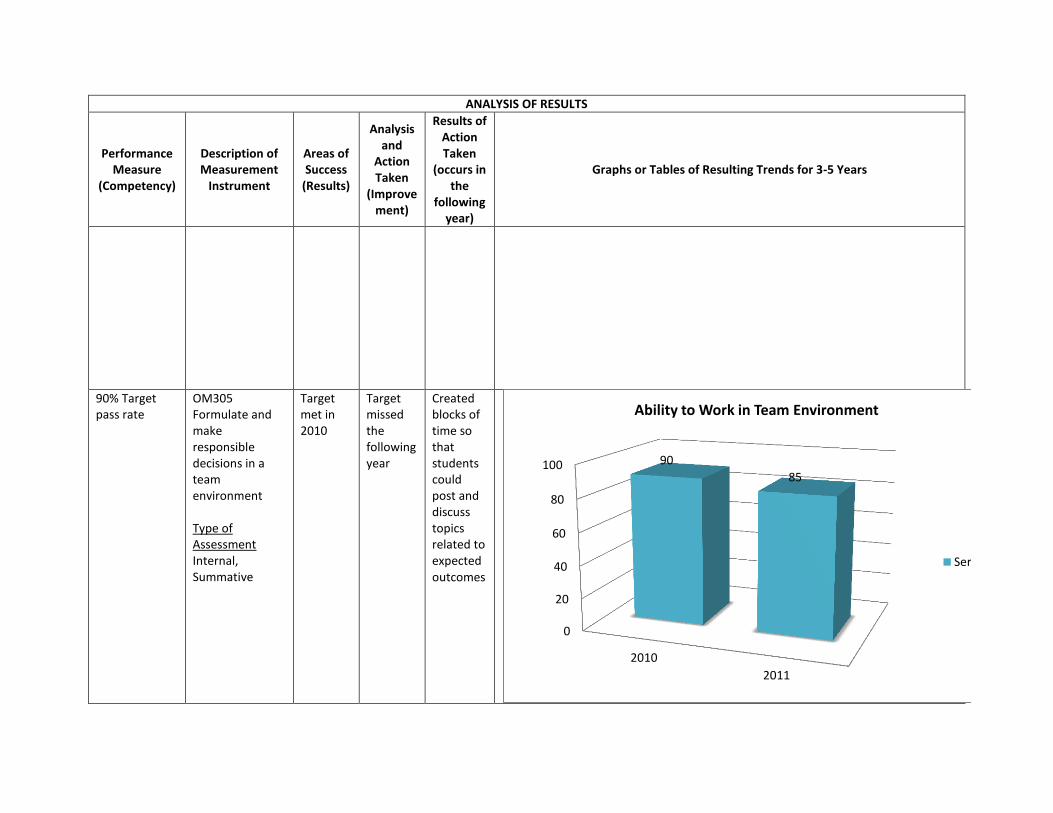
90% Target pass rate
OM305 Formulate and make responsible decisions in a team environment Type of Assessment Internal, Summative
Target met in 2010
Target missed the following year
Created blocks of time so that students could post and discuss topics related to expected outcomes
0
20
40
60
80
100
2010
2011
90
85
Ability to Work in Team Environment
Series 1
ANALYSIS OF RESULTS
Performance Measure
(Competency)
Description of Measurement
Instrument
Areas of Success
(Results)
Analysis and
Action Taken
(Improvement)
Results of Action Taken
(occurs in the
following year)
Graphs or Tables of Resulting Trends for 3-5 Years
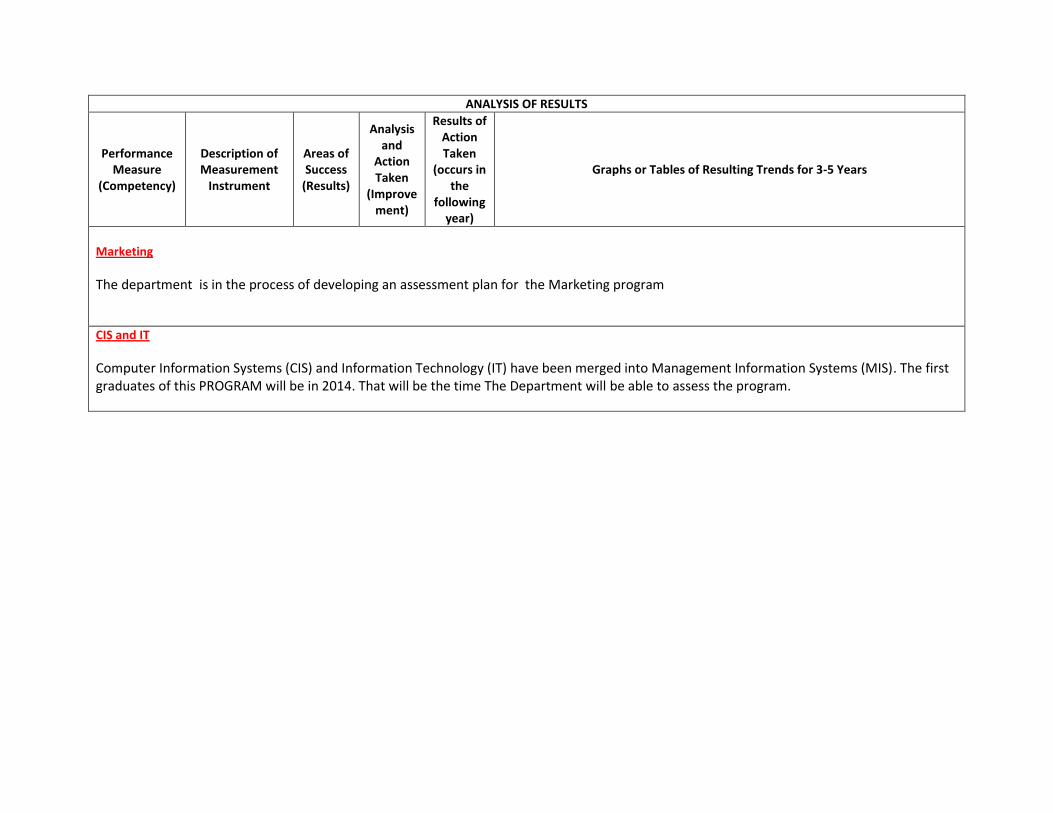
Marketing
The department is in the process of developing an assessment plan for the Marketing program
CIS and IT
Computer Information Systems (CIS) and Information Technology (IT) have been merged into Management Information Systems (MIS). The first graduates of this PROGRAM will be in 2014. That will be the time The Department will be able to assess the program.