stag appraisal appendix 2 - part 1
TRANSCRIPT

EDINBURGH TRAM NETWORK
Edinburgh Tram Network STAG 2 Appraisal
Report
December 2006
Prepared for: Prepared by:
tie Limited City Point 65 Haymarket Terrace Edinburgh EH12 5BH
Steer Davies Gleave 28-32 Upper Ground London SE1 9PD +44 (0)20 7919 8500 www.steerdaviesgleave.com
Colin Buchanan 4 St Colme Street Edinburgh EH3 6AA +44 (0)131 226 4693 www.cbuchanan.co.uk


Edinburgh Tram Network STAG 2 Appraisal
C:\Documents and Settings\rfineman\My Documents\Edinburgh Tram STAG 2 compilation MASTER v7 (2).doc
Contents
Contents Page
1. INTRODUCTION 1
Background 1
The STAG appraisal process and this report 2
Structure of this report 3
2. PROBLEMS AND OPPORTUNITIES 5
Socio-Economic Characteristics 5
Employment 9
Socio-Economic Characteristics in North Edinburgh 10
Environment 17
Transport 21
Private Transport 25
Opportunities 27
3. TRANSPORT PLANNING OBJECTIVES 31
STAG Requirements 31
Planning and Policy Framework 32
Developing Transport Planning Objectives 45
4. SCHEME HISTORY: OPTION GENERATION, OPTION SIFTING AND STAG APPRAISAL 47
Introduction 47
North Edinburgh route – Line 1 47
West of city route - Line 2 49
5. DEVELOPMENT OF EDINBURGH TRAM DURING THE PARLIAMENTARY PROCESS 53
Project Phasing 53
Transport Edinburgh Limited 54
6. CONSULTATION 57
Objectives and consultation process 57
Results of the consultation for Line 1 58
Results of the consultation for Line 2 59
Parliamentary Process 62
Update on consultation – recent developments 65
7. DESCRIPTION OF PROPOSED SCHEME 69
Introduction 69
Route Alignment 69

Edinburgh Tram Network STAG 2 Appraisal
C:\Documents and Settings\rfineman\My Documents\Edinburgh Tram STAG 2 compilation MASTER v7 (2).doc
Contents
Tram Infrastructure 74
Vehicle specification 77
Tram operations 82
Capital and operating costs 92
Bus Network Changes 94
8. THE DO-MINIMUM AND REFERENCE CASE 101
Introduction 101
Edinburgh Tram 101
Do-Minimum definition 102
Reference Case definition 103
TEE appraisals 104
Summary 106
9. STAG PART 2 APPRAISAL 107
Planning assumptions 107
Transport Impacts 108
Assessment against the Planning Objectives 121
Environment 129
Safety 154
Economy 158
Integration 171
Accessibility 178
Cost to Government 207
STAG2 Appraisal Summary Tables 210
10. RISK AND UNCERTAINTY 229
Introduction 229
Risk Management Process 229
Derivation of Costs and Cost Benchmarking 233
Demand and Revenue Benchmarking 235
Risk Allowance 236
Current Risk Status 238
Sensitivity Analysis 242
Ongoing Risk Management Process 244
11. MONITORING AND EVALUATION 245
Introduction 245

Edinburgh Tram Network STAG 2 Appraisal
C:\Documents and Settings\rfineman\My Documents\Edinburgh Tram STAG 2 compilation MASTER v7 (2).doc
Contents
Objectives 245
Base Case 247
Project Development, Procurement and Construction 248
Operations 249
Conclusion 254
12. GLOSSARY OF TERMS 255
13. EXECUTVE SUMMARY 263
FIGURES
Figure S.1.1 Edinburgh Tram Network Phasing 1
Figure 1.1 Edinburgh Tram Network Phasing 2
Figure 2.1 Population Density 7
Figure 2.2 Households with No Car Available 8
Figure 2.3 Percentage of Unemployment 11
Figure 2.4 Income Levels 12
Figure 2.5 Index of Multiple Deprivation 13
Figure 2.6 2004 Education Deprivation Domain Ranking 14
Figure 7.1 Phase 1a+1b 2011 AM Peak Eastbound Flow 84
Figure 7.2 Phase 1a+1b 2011 AM Peak Westbound Flow 84
Figure 7.3 Tram operating pattern in 2011 85
Figure 7.4 Phase 1a+1b 2031 AM Peak Eastbound Flow 86
Figure 7.5 Phase 1a+1b 2031 AM Peak Westbound Flow 86
Figure 7.6 2015 to 2027 service patterns 87
Figure 7.7 2028 onwards tram service patterns 88
Figure 9.1 Phase 1a 2011 AM Peak Eastbound Flow 111
Figure 9.2 Phase 1a 2011 AM Peak Westbound Flow 111
Figure 9.3 Phase 1a 2011 Interpeak Eastbound Flow 112
Figure 9.4 Phase 1a 2011 Interpeak Westbound Flow 112

Edinburgh Tram Network STAG 2 Appraisal
C:\Documents and Settings\rfineman\My Documents\Edinburgh Tram STAG 2 compilation MASTER v7 (2).doc
Contents
Figure 9.5 Phase 1a 2031 AM Peak Eastbound Flow 113
Figure 9.6 Phase 1a 2031 AM Peak Westbound Flow 113
Figure 9.7 Phase 1a 2031 Interpeak Eastbound Flow 114
Figure 9.8 Phase 1a 2031 Interpeak Westbound Flow 114
Figure 9.9 Phase 1a+1b 2011 AM Peak Eastbound Flow 117
Figure 9.10 Phase 1a+1b 2011 AM Peak Westbound Flow 117
Figure 9.11 Phase 1a+1b 2011 Interpeak Eastbound Flow 118
Figure 9.12 Phase 1a+1b 2011 Interpeak Westbound Flow 118
Figure 9.13 Phase 1a+1b 2031 AM Peak Eastbound Flow 119
Figure 9.14 Phase 1a+1b 2031 AM Peak Westbound Flow 119
Figure 9.15 Phase 1a+1b 2031 Interpeak Eastbound Flow 120
Figure 9.16 Phase 1a+1b 2031 Interpeak Westbound Flow 120
Figure 9.17 Change in public transport Mode Share with Tram Phase 1a+1b (2031 Morning Peak) 123
Figure 9.18 Change in accessibility to George Street (Phase 1a) 181
Figure 9.19 Change in accessibility to Haymarket (Phase 1a) 182
Figure 9.20 Change in accessibility to foot of Leith Walk (Phase 1a) 183
Figure 9.21 Change in accessibility to Crewe Toll (Phase 1a) 184
Figure 9.22 Change in accessibility to Ocean Terminal (Phase 1a) 185
Figure 9.23 Change in accessibility to Granton (Phase 1a) 186
Figure 9.24 Change in accessibility to Napier University (Phase 1a) 187
Figure 9.25 Change in accessibility to Sighthill Industiral Estate (Phase 1a) 188
Figure 9.26 Change in accessibility to Edinburgh Park (Phase 1a) 189
Figure 9.27 Change in accessibility to Gyle Centre (Phase 1a) 190
Figure 9.28 Change in accessibility to Edinburgh Airport (Phase 1a) 191
Figure 9.29 Change in accessibility to George Street (Phase 1a+1b) 192
Figure 9.30 Change in accessibility to Haymarket (Phase 1a+1b) 193
Edinburgh Tram Network STAG 2 Appraisal
C:\Documents and Settings\rfineman\My Documents\Edinburgh Tram STAG 2 compilation MASTER v7 (2).doc
Contents
Figure 9.31 Change in accessibility to foot of Leith Walk (Phase 1a+1b) 194
Figure 9.32 Change in accessibility to Crewe Toll (Phase 1a+1b) 195
Figure 9.33 Change in accessibility to Ocean Terminal (Phase 1a+1b) 196
Figure 9.34 Change in accessibility to Granton (Phase 1a+1b) 197
Figure 9.35 Change in accessibility to Napier University (Phase 1a+1b) 198
Figure 9.36 Change in accessibility to Sighthill Industiral Estate (Phase 1a+1b) 199
Figure 9.37 Change in accessibility to Edinburgh Park (Phase 1a+1b) 200
Figure 9.38 Change in accessibility to Gyle Centre (Phase 1a+1b) 201
Figure 9.39 Change in accessibility to Edinburgh Airport (Phase 1a+1b) 202
Figure 10.1 Optimism Bias 237
Figure 13.1 Edinburgh Tram Network Phasing 263
TABLES
Table S.1.1 Tram Capital Cost Expenditure phase 1a and 1b 3
Table S.1.2 Edinburgh Tram Phase 1A Demand (Trips per 2-Hr Period) 4
Table S.1.3 Edinburgh Tram Phase 1A+1b Demand (Trips per 2-Hr Period) 4
Table S.1.4 Summary Appraisal Results over 60 years 5
Table 2.1 Central Edinburgh Development 27
Table 2.2 North Edinburgh Development 28
Table 2.3 West Edinburgh Development 28
Table 2.4 Additional Development Potential arising from Maximum Development 29
Table 6.1 Consultation to date 58
Table 6.2 Stakeholder Consultation Results for Line 2 60
Table 6.3 Objection Management 65
Table 7.1 Ride Comfort Levels 80
Table 7.2 Tram Performance 80
Edinburgh Tram Network STAG 2 Appraisal
C:\Documents and Settings\rfineman\My Documents\Edinburgh Tram STAG 2 compilation MASTER v7 (2).doc
Contents
Table 7.3 Tram Braking Performance 81
Table 7.4 First & last tram services and frequencies for 6 & 12 tram per hour scenario 90
Table 7.5 First & last tram services and frequencies for 8 & 16 tram per hour scenario 91
Table 7.6 Edinburgh Tram Capital Costs (2006 Prices) 92
Table 7.7 Edinburgh Tram - Operating Costs 2012 (out-turn) 94
Table 7.8 Leith Walk Bus and Tram Hourly Frequencies 96
Table 7.9 Bus Network Changes 98
Table 8.1 Appraisal of Edinburgh Tram (for 1a+1b case unless otherwise stated) 105
Table 9.1 Travel demand by Public and Private Transport (Phase 1a) 109
Table 9.2 Edinburgh Tram Phase 1a demand 109
Table 9.3 Impact of Edinburgh Tram on Demand, by Mode (Phase 1a) 110
Table 9.4 Travel demand by Public and Private Transport (Phase 1a+1b) 115
Table 9.5 Edinburgh Tram Phase 1a+1b demand 115
Table 9.6 Sources of demand for Edinburgh Tram (Phase 1a+1b) 116
Table 9.7 Travel demand by Public and Private Transport (Phase 1a) 122
Table 9.8 Travel demand by Public and Private Transport (Phase 1a+1b) 122
Table 9.9 Travel demand by Private Transport (Phase 1a) 125
Table 9.10 Travel demand by Private Transport (Phase 1a+1b) 125
Table 9.11 Changes in Traffic Flows (2011 AM) 126
Table 9.12 Change in Annual Number of accidents by severity level 127
Table 9.13 Estimated Changes in the Number of Residents Annoyed by Noise 131
Table 9.14 Estimated Number of Residents Experiencing Significant Changes in Noise 131
Table 9.15 Residents impacted by tram noise 132
Table 9.16 Air Quality Standards 133
Edinburgh Tram Network STAG 2 Appraisal
C:\Documents and Settings\rfineman\My Documents\Edinburgh Tram STAG 2 compilation MASTER v7 (2).doc
Contents
Table 9.17 Weighted Number of People Experiencing Changes in Air Quality 134
Table 9.18 Number of People Subject to Changes in Compliance with Air Quality Standards 134
Table 9.19 Air Quality Indices 135
Table 9.20 Total Changes in annual Carbon Dioxide Emissions 135
Table 9.21 Summary of Landscape Impacts (Phase 1a) 144
Table 9.22 Summary of Landscape Impacts (Phase 1b) 145
Table 9.23 Visual Amenity Impacts (Phase 1a) 147
Table 9.24 Visual Amenity Impacts (Phase 1b) 149
Table 9.25 Impacts & mitigation of tram impacts on land 150
Table 9.26 Change in Vehicle-Kms (Million p.a. Change Dm to Ds) 154
Table 9.27 Change in Annual Number of accidents by severity level 155
Table 9.28 Monetised accident savings (£000s) 155
Table 9.29 Security Impacts 157
Table 9.30 Phase 1a TEE analysis 159
Table 9.31 Phase 1a+1b TEE analysis 161
Table 9.32 Property Development Profiles (m2 of development) 163
Table 9.33 Additional Residential Units due to the Tram 164
Table 9.34 Displacement Factors for New Employment 165
Table 9.35 development and employment with tram: areas where regeneration area residents enjoy better access 169
Table 9.36 Granton Ward residents share of employment in Leith and North Edinburgh Parliamentary Constituency employment by category 170
Table 9.37 Phase 1a Accessibility Impacts by Population and Households 203
Table 9.38 Phase 1a+1b Accessibility Impacts by Population and Households 205
Table 9.39 Phase 1a Cost to Government 208
Table 9.40 Phase 1a + 1B Cost to Government 209
Table 9.41 Summary Economic Appraisal Results Over 60 years 210

Edinburgh Tram Network STAG 2 Appraisal
C:\Documents and Settings\rfineman\My Documents\Edinburgh Tram STAG 2 compilation MASTER v7 (2).doc
Contents
Table 9.42 Edinburgh Tram Phase 1a STAG Part 2 appraisal 211
Table 9.43 Edinburgh Tram Phase 1a+1b STAG Part 2 appraisal 219
Table 10.1 Demand and revenue benchmarking 235
Table 10.2 Confidence Probabilities 236
Table 10.3 Risk Significance Matrix 240
Table 10.4 Significance of Risk 240
Table 10.5 Sensitivity Tests (for 1a+1b case) 242
Table 11.1 Evaluation Performance Indicators 250
Table 11.2 Monitoring Performance Indicators 253
Table 13.1 Tram Capital Cost Expenditure phase 1a and 1b 265
Table 13.2 Edinburgh Tram Phase 1A Demand (Trips per 2-Hr Period) 266
Table 13.3 Edinburgh Tram Phase 1A+1b Demand (Trips per 2-Hr Period) 266
Table 13.4 Summary Appraisal Results over 60 years 267
APPENDICES
A LINE 1 APPRAISAL SUMMARY TABLES
B LINE 2 APPRAISAL SUMMARY TABLES
C EXTRACT FROM DRAFT CEC LOCAL TRANSPORT STRATEGY ON BUS PRIORITIES

Edinburgh Tram Network STAG 2 Appraisal
C:\Documents and Settings\rfineman\My Documents\Edinburgh Tram STAG 2 compilation MASTER v7 (2).doc
Summary
SUMMARY
1. This STAG2 report represents a comprehensive assessment of the appraisal case to construct and operate phases 1a and 1b of the Edinburgh Tram network. Figure S1 below shows the full planned network. Given that Phase 1 comprises two sections 1a (Newhaven to Edinburgh Airport) and 1b (Newhaven to Granton via the Roseburn corridor), a STAG2 appraisal has been undertaken for the core route (1a) alone and for Phase 1 in its entirety (1a+1b).
FIGURE S.1.1 EDINBURGH TRAM NETWORK PHASING
2. The proposed phased implementation was assessed by Transport Edinburgh Limited (TEL) following the successful acquisition of powers to construct the project, recognising current affordability constraints
3. The route choice and phasing has been guided by the need to address the socio-economic, environmental and transport problems and opportunities and, in line with STAG guidance, to meet the Transport Planning Objectives for the proposal.
4. Analysis of the current socio-economic characteristics of Edinburgh revealed that the recent strength of the regional economy, with corresponding increase in population and jobs, is set to continue in future. Opportunities for growth exist in particular along Edinburgh’s waterfront at Leith, Newhaven and Granton.
5. The lively economy is likely to result in both considerable inward migration and an associated increase in commuting. As a result the capacity and range of Edinburgh’s public transport system will be required to increase to encourage growth and development opportunities to be met sustainably.
6. Mapping of the levels of economic deprivation, employment levels and levels of educational attainment show a considerable variance across the city. A number of trends are evident which make it possible to identify a range of pockets and corridors of deprivation. Areas of Granton and Pilton to the north, and a zone around Leith Walk, as well as around Saughton and Balgreen in the west are identified as areas where socio economic status is considerably less affluent than surrounding areas. Employment, income levels and car ownership tend to be comparatively low in these areas which result in a notably higher index of multiple deprivation.

Edinburgh Tram Network STAG 2 Appraisal
C:\Documents and Settings\rfineman\My Documents\Edinburgh Tram STAG 2 compilation MASTER v7 (2).doc
Summary
7. Direct connection to the city centre and other employment areas which would be facilitated by the proposals would undoubtedly improve the situation for these areas. Despite the high levels of car ownership at the city wide level, similar pockets of low car ownership exist, broadly correlated to areas of high population density. The proposals would offer an attractive service to those areas which include Granton, Newhaven, Leith and Leith Walk, as well as Haymarket and Gorgie near the city centre and Saughton and Balgreen in the west.
8. Assessment of the environmental aspects of the proposal show that it would make a positive contribution towards objectives of reducing emissions and improving air quality in the Air Quality Management Area (AQMA) set up by City of Edinburgh Council (CEC). The proposal passes through the heart of the city centre would specifically contribute to these issues in the AQMA. Its contribution to mode shift would enable further progress towards objectives set in the Air Quality (Scotland) Amendment Regulations 2002 and to national objectives to reduce emissions of greenhouse gases. CEC have identified air quality issues in the western corridor of the city leading to the airport area, with a particular focus on Corstophine Road, St Johns Road and Drumbrae Roundabout, monitoring of this is being carried out with a view to determining it a second AQMA. The proposal would pass directly through this corridor, as a result contributing to air quality improvements in the area.
9. The public transport infrastructure in Edinburgh is currently reliant upon buses – primarily operated by Lothian Buses and First Edinburgh. Implementation of a wide range of bus priority measures has improved the bus service but the bus services remain vulnerable to the effects of increasing congestion across the city. In this regard the proposals would enhance the public transport ‘offer’ of the city, making contributions to mode shift and air quality objectives in the process.
10. Development of planning objectives is fundamental to development and appraisal of transport proposals. Planning objectives were developed taking cognisance of the Scottish Executive’s national objectives and to incorporate the relevant policies in local planning documents. They were based significantly on the opportunities, problems and constraints in the waterfront – city centre – airport corridor.
11. The planning and policy context at national, regional and local levels was used as the basis to develop the following Transport Planning Objectives:
• To support the local economy by improving accessibility; • To promote sustainability and reduce environmental damage caused by traffic; • To reduce traffic congestion; • To make the transport system safer and more secure; and • To promote social benefits.
12. Scheme development and acquisition of parliamentary powers was undertaken in parallel for the northern loop route (formerly Line 1: Granton, Roseburn corridor, city centre, Leith) and the former line 2 between St Andrews Square and Newbridge/Edinburgh Airport. Each route went through a detailed route and option development process, including full STAG2 appraisals.
Edinburgh Tram Network STAG 2 Appraisal
C:\Documents and Settings\rfineman\My Documents\Edinburgh Tram STAG 2 compilation MASTER v7 (2).doc
Summary
13. Extensive consultation was undertaken during the development of Lines 1 and 2. This continued through the Parliamentary process, notably the management of and negotiation with objectors to the Bill. A separate strand during this time and subsequently has been the creation of Community Liaison Groups to inform further development of the scheme. A Business Liaison Group has been set up for traders on Leith Walk and Constitution Street.
14. The proposed service pattern for Phase 1 is as follows:
• 2011 opening date 6 trams per hour Edinburgh Airport to Newhaven via Princes Street (Phase 1a), combined with 6 trams per hour Granton to Newhaven via the Roseburn corridor and Princes Street: combined 5 minute frequency between Haymarket and Newhaven (Phase 1b), rising to:
• 2031 8 trams per hour on each leg: combined frequency of a tram every 3 ¾ minutes.
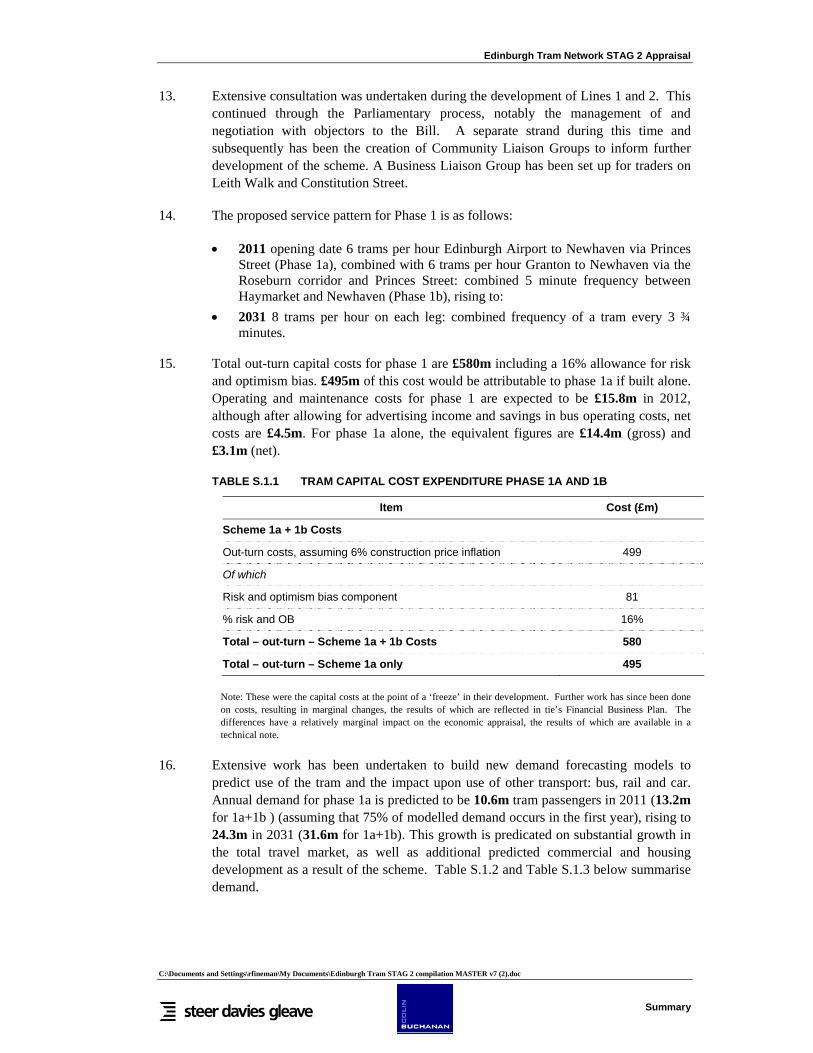
15. Total out-turn capital costs for phase 1 are £580m including a 16% allowance for risk and optimism bias. £495m of this cost would be attributable to phase 1a if built alone. Operating and maintenance costs for phase 1 are expected to be £15.8m in 2012, although after allowing for advertising income and savings in bus operating costs, net costs are £4.5m. For phase 1a alone, the equivalent figures are £14.4m (gross) and £3.1m (net).
TABLE S.1.1 TRAM CAPITAL COST EXPENDITURE PHASE 1A AND 1B
Item Cost (£m)
Scheme 1a + 1b Costs
Out-turn costs, assuming 6% construction price inflation 499
Of which
Risk and optimism bias component 81
% risk and OB 16%
Total – out-turn – Scheme 1a + 1b Costs 580
Total – out-turn – Scheme 1a only 495
Note: These were the capital costs at the point of a ‘freeze’ in their development. Further work has since been done on costs, resulting in marginal changes, the results of which are reflected in tie’s Financial Business Plan. The differences have a relatively marginal impact on the economic appraisal, the results of which are available in a technical note.
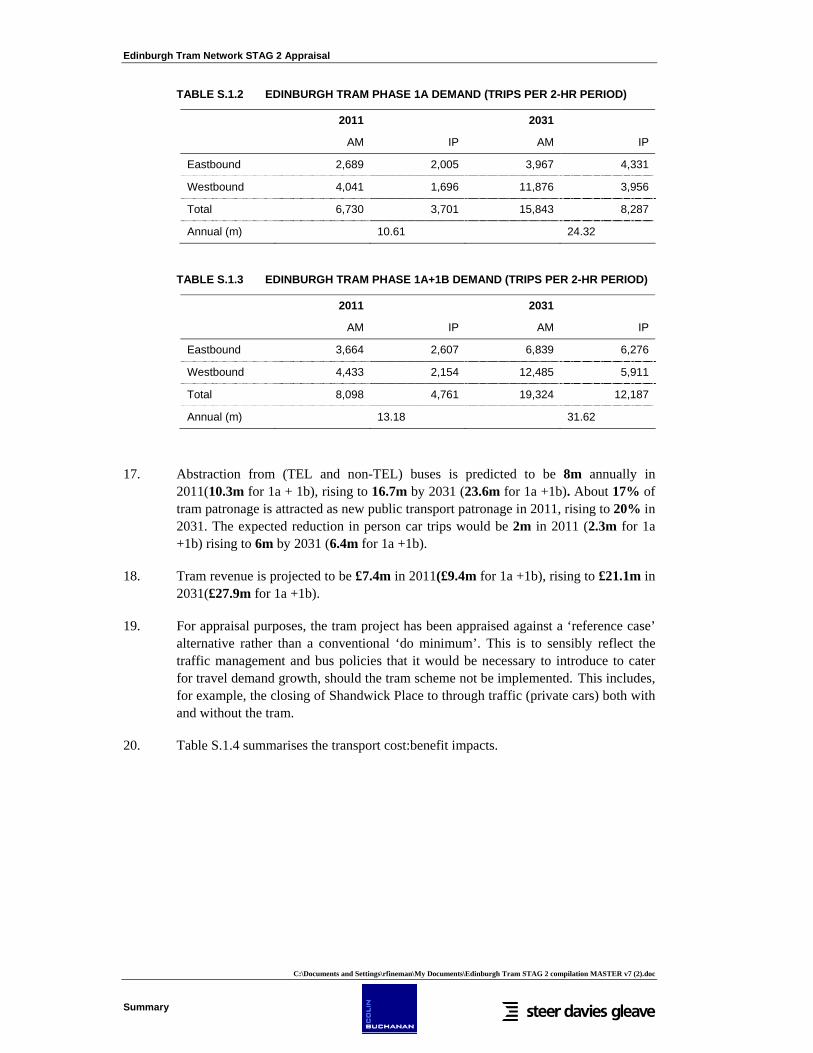
16. Extensive work has been undertaken to build new demand forecasting models to predict use of the tram and the impact upon use of other transport: bus, rail and car. Annual demand for phase 1a is predicted to be 10.6m tram passengers in 2011 (13.2m for 1a+1b ) (assuming that 75% of modelled demand occurs in the first year), rising to 24.3m in 2031 (31.6m for 1a+1b). This growth is predicated on substantial growth in the total travel market, as well as additional predicted commercial and housing development as a result of the scheme. Table S.1.2 and Table S.1.3 below summarise demand.
Edinburgh Tram Network STAG 2 Appraisal
C:\Documents and Settings\rfineman\My Documents\Edinburgh Tram STAG 2 compilation MASTER v7 (2).doc
Summary
TABLE S.1.2 EDINBURGH TRAM PHASE 1A DEMAND (TRIPS PER 2-HR PERIOD)
2011 2031
AM IP AM IP
Eastbound 2,689 2,005 3,967 4,331
Westbound 4,041 1,696 11,876 3,956
Total 6,730 3,701 15,843 8,287
Annual (m) 10.61 24.32
TABLE S.1.3 EDINBURGH TRAM PHASE 1A+1B DEMAND (TRIPS PER 2-HR PERIOD)
2011 2031
AM IP AM IP
Eastbound 3,664 2,607 6,839 6,276
Westbound 4,433 2,154 12,485 5,911
Total 8,098 4,761 19,324 12,187
Annual (m) 13.18 31.62
17. Abstraction from (TEL and non-TEL) buses is predicted to be 8m annually in 2011(10.3m for 1a + 1b), rising to 16.7m by 2031 (23.6m for 1a +1b). About 17% of tram patronage is attracted as new public transport patronage in 2011, rising to 20% in 2031. The expected reduction in person car trips would be 2m in 2011 (2.3m for 1a +1b) rising to 6m by 2031 (6.4m for 1a +1b).
18. Tram revenue is projected to be £7.4m in 2011(£9.4m for 1a +1b), rising to £21.1m in 2031(£27.9m for 1a +1b).
19. For appraisal purposes, the tram project has been appraised against a ‘reference case’ alternative rather than a conventional ‘do minimum’. This is to sensibly reflect the traffic management and bus policies that it would be necessary to introduce to cater for travel demand growth, should the tram scheme not be implemented. This includes, for example, the closing of Shandwick Place to through traffic (private cars) both with and without the tram.
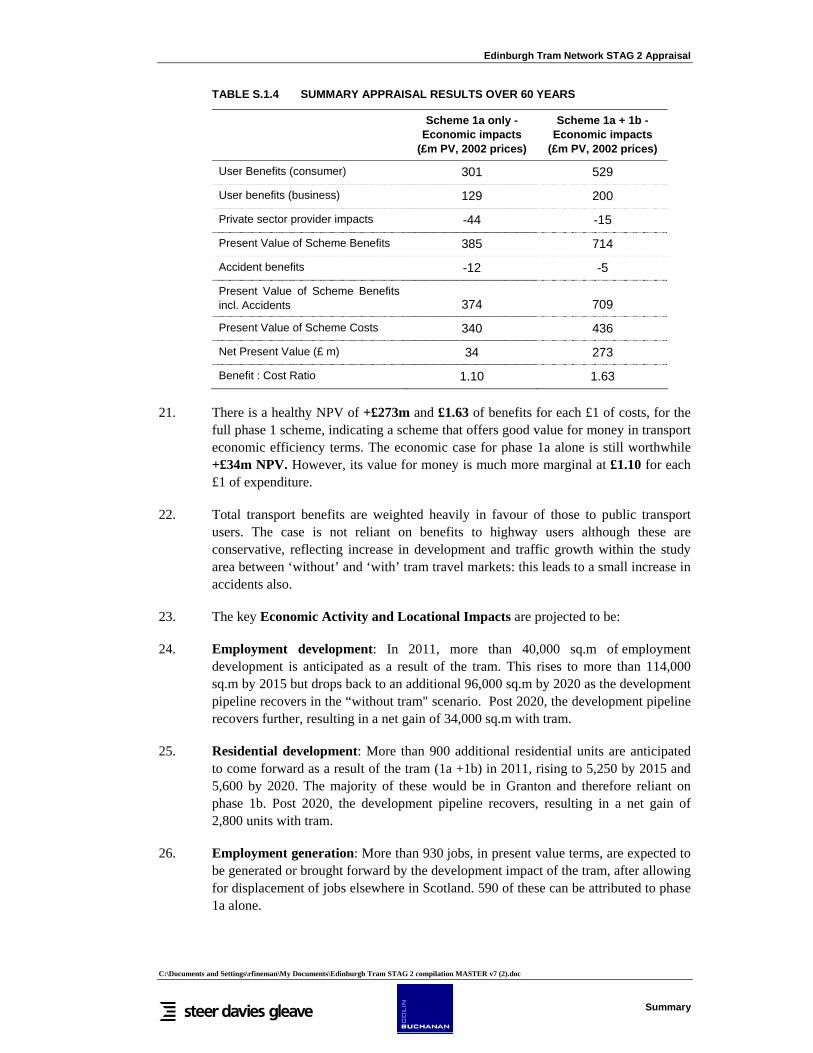
20. Table S.1.4 summarises the transport cost:benefit impacts.
Edinburgh Tram Network STAG 2 Appraisal
C:\Documents and Settings\rfineman\My Documents\Edinburgh Tram STAG 2 compilation MASTER v7 (2).doc
Summary
TABLE S.1.4 SUMMARY APPRAISAL RESULTS OVER 60 YEARS
Scheme 1a only -
Economic impacts (£m PV, 2002 prices)
Scheme 1a + 1b - Economic impacts
(£m PV, 2002 prices)
User Benefits (consumer) 301 529
User benefits (business) 129 200
Private sector provider impacts -44 -15
Present Value of Scheme Benefits 385 714
Accident benefits -12 -5
Present Value of Scheme Benefits incl. Accidents 374 709
Present Value of Scheme Costs 340 436
Net Present Value (£ m) 34 273
Benefit : Cost Ratio 1.10 1.63
21. There is a healthy NPV of +£273m and £1.63 of benefits for each £1 of costs, for the full phase 1 scheme, indicating a scheme that offers good value for money in transport economic efficiency terms. The economic case for phase 1a alone is still worthwhile +£34m NPV. However, its value for money is much more marginal at £1.10 for each £1 of expenditure.
22. Total transport benefits are weighted heavily in favour of those to public transport users. The case is not reliant on benefits to highway users although these are conservative, reflecting increase in development and traffic growth within the study area between ‘without’ and ‘with’ tram travel markets: this leads to a small increase in accidents also.
23. The key Economic Activity and Locational Impacts are projected to be:
24. Employment development: In 2011, more than 40,000 sq.m of employment development is anticipated as a result of the tram. This rises to more than 114,000 sq.m by 2015 but drops back to an additional 96,000 sq.m by 2020 as the development pipeline recovers in the “without tram" scenario. Post 2020, the development pipeline recovers further, resulting in a net gain of 34,000 sq.m with tram.
25. Residential development: More than 900 additional residential units are anticipated to come forward as a result of the tram (1a +1b) in 2011, rising to 5,250 by 2015 and 5,600 by 2020. The majority of these would be in Granton and therefore reliant on phase 1b. Post 2020, the development pipeline recovers, resulting in a net gain of 2,800 units with tram.
26. Employment generation: More than 930 jobs, in present value terms, are expected to be generated or brought forward by the development impact of the tram, after allowing for displacement of jobs elsewhere in Scotland. 590 of these can be attributed to phase 1a alone.

Edinburgh Tram Network STAG 2 Appraisal
C:\Documents and Settings\rfineman\My Documents\Edinburgh Tram STAG 2 compilation MASTER v7 (2).doc
Summary
27. There is also evidence that residents of the regeneration area of Granton will have improved access to more and better jobs and this will lead to greater inclusion within the labour market: this again is dependent on Phase 1b.
28. The key Environmental impacts are:
• Improvement in air quality, traffic noise and C02 emissions resulting from the transfer of car trips to public transport
• Cultural Heritage (Moderate Negative impact) relating to alignment through World Heritage Site and demolition/relocation of listed buildings
• Landscape (Major Negative impact) relating to World Heritage Site impacts, impact on open Greenbelt landscape and significant vegetation removal along railway corridors
29. Mitigation of environmental impacts would be maximised through sensitive design and construction practices.
30. In relation to the Safety objective, a very small increase in highway accidents is projected, reflecting an increase in the size of the travel market and vehicle kms in the “with-tram” scenario. Personal security will improve (moderate beneficial assessment) reflecting tram design elements (CCTV and help points at all stops and vehicles) and designed access arrangements aimed at enhancing security. The planned high use of inspectors on vehicles will assist this objective.
31. There are two key aspects to the Integration objective. The tram scheme will enhance the opportunity to make journeys on the Public Transport network through bus-tram service integration plans and ticketing arrangements, reflecting specifically designed stops and interchange facilities for effective integration with the bus and rail networks, most notably at:
• Edinburgh Airport • Waverley, Haymarket and Edinburgh Park rail stations • St Andrews Bus Station and the bus hubs at Ocean Terminal, Gyle Shopping
Centre and Crewe Toll • Expanded Park & Ride at Ingliston and potentially other locations
32. In relation to land-use policy and proposal integration, the scheme integrates positively with land-use policies and proposals as detailed in:
• National Policy – National Planning Framework (NPF) and Scottish Planning Policy (SPP17)
• Regional Policy – Developing SESTRANS Regional Transport Strategy and Edinburgh and Lothians Structure Plan 2015
• Local Policy – Edinburgh Local Plans and associated development proposals, most notably Leith Docks Western Harbour development, Granton Waterfront and Haymarket-Airport including Edinburgh Park/Gyle.
33. In relation to Accessibility, the tram scheme improves accessibility to identified key trip attractions/destinations from a substantial portion of Edinburgh e.g:

Edinburgh Tram Network STAG 2 Appraisal
C:\Documents and Settings\rfineman\My Documents\Edinburgh Tram STAG 2 compilation MASTER v7 (2).doc
Summary
• George Street / Frederick Street junction – representing the focal point of the city centre (employment, shopping, leisure and access to Waverley rail station with integration with bus and rail) in terms of overall public transport accessibility;
• Haymarket rail station (integration, interchange with bus and rail) • Leith Ocean Terminal (employment) • Edinburgh Airport (employment, transport interchange) • Gyle Centre / Edinburgh Park (Shopping / Employment).
34. Level boarding on all tram vehicles will enhance accessibility for the mobility impaired.
35. The formal Appraisal Summary Tables are included within Chapter 9 of the main report.
36. The Revenue and Risk Analysis indicates that:
• Healthy tram patronage and revenue can be generated and a positive TEL net revenue situation can be maintained
• Key revenue risks centre on development/planning growth, economic outlook and performance and public perception
• Some key levers are available to help mitigate risks on TEL revenue, most notably fares strategy, tram design and service integration refinements.
37. In Conclusion, a “reference case” Economic Appraisal suggests that the 1A+1B scheme offers good economic value for money with a BCR of 1.6:1
38. Scenario and sensitivity testing suggests that:
• 1A alone is a significantly poorer performing scheme but achieves BCR parity • Planned economic/development growth being achieved is central to maximising
benefits and patronage • Tram design will need to deliver on quality/runtime if benefits are to be realised
39. EALI analysis indicates that net wider economic impacts will accrue from the tram scheme having taken account of economic impacts that might accrue in any case and displacement of these benefits from elsewhere in Scotland.


Edinburgh Tram Network STAG 2 Appraisal
C:\Documents and Settings\rfineman\My Documents\Edinburgh Tram STAG 2 compilation MASTER v7 (2).doc
1
1. INTRODUCTION
Background
1.1 As a key component of the strategy of public transport investment in Edinburgh, CEC is seeking to develop a modern tram network. The tram system is being developed in stages and will focus on the major city transport corridors including links to Park and Ride sites and a number of significant committed development nodes.
1.2 The City of Edinburgh Council (CEC) has established a company, tie, which is responsible for the delivery of a number of major public transport schemes in the next 10 to 15 years, including the proposed tram network. During the period 2002-2004, tie developed proposals for three tramlines, comprising the following:
• Line 1, the Northern Loop, linking the City Centre with Granton and Leith; • Line 2, west from the City Centre to serve Edinburgh Park and the Airport, with
Park and Ride at its western extremities: this Line was intended ultimately to continue to Newbridge; and
• Line 3, connecting the City Centre with the south-east area of Edinburgh.
1.3 Each line was developed independently, with a separate, but parallel, network study providing the overarching framework for the development of trams in Edinburgh. On this basis, separate STAG (Scottish Transport Appraisal Guidance) appraisals and Parliamentary Bills were to be submitted for each line.
1.4 Development of Line 3 was suspended in 2004 and efforts focused on Lines 1 and 2. Parliamentary Bills, with associated STAG appraisals1, were deposited for the two lines separately in December 2003 and following the standard objection period, Parliamentary inquires were held during 2004 and 2005. The respective Committees endorsed the Bills and these were subsequently passed in Parliament in Spring 2006.
1.5 In January 2006, CEC decided that the tram scheme should be implemented in phases, as shown in Figure 1.1. Phase 1 will involve development of the tram between the Airport and Leith Waterfront (Phase 1a) and also a section between Roseburn and Granton Square (Phase 1b). Phase 2 will complete the link between Leith and Granton in order to create a loop. The section between the Airport and Newbridge is Phase 3. This phasing reflects the contribution each makes to achieving long term
1 STAG Appraisal: Line 1, tie/Mott MacDonald et al, 10th September 2004 and Edinburgh Tram Line 2 STAG report, tie/Faber Maunsell et al, 10th September 2004
This report sets out a STAG Part 2 appraisal for Edinburgh Tram. Following Parliamentary approval for each of Lines 1 and 2, further scheme development has identified the need for phasing of scheme implementation. Phase 1, the subject of this appraisal, comprises a trunk section from Newhaven to the Airport via the City Centre (Phase 1a), with a connection to Granton via the Roseburn corridor (Phase 1b).

Edinburgh Tram Network STAG 2 Appraisal
C:\Documents and Settings\rfineman\My Documents\Edinburgh Tram STAG 2 compilation MASTER v7 (2).doc
2
objectives and the fit with Structure and Local Plans.
1.6 To maximise the benefits flowing from the tram, CEC have established Transport Edinburgh Limited (TEL) to take on the responsibility for coordinating the services of Lothian Buses, which is majority owned by CEC, and the tram. TEL has played a leading role in developing the phasing of Edinburgh Tram and in developing associated integrated bus networks.
1.7 As part of the phased development of this Tram network for Edinburgh, a Final Business Case (FBC), including a STAG2 appraisal, is to be presented to CEC and Transport Scotland (SE) for approval of Phase 1 in the first instance.
FIGURE 1.1 EDINBURGH TRAM NETWORK PHASING
The STAG appraisal process and this report
1.8 Scottish Transport Appraisal Guidance (STAG) is the official appraisal framework to aid transport planners and decision-makers in the development of transport policies, plans, programmes and projects in Scotland.
1.9 STAG has two parts:
• STAG1: initial appraisal and broad assessment of impacts, designed to decide whether a proposal should proceed, subject to meeting the planning objectives and fitting with relevant policies; and
• STAG2: detailed appraisal against the scheme and Government’s objectives.
1.10 As previously noted, scheme development was taken forward in parallel for Lines 1 and 2, with full STAG2 appraisals being prepared for each line. These were used in the Parliamentary process, along with other material, to set out the rationale and case for the respective lines.
1.11 This report sets out the STAG2 appraisal of Phase 1 of the Edinburgh Tram network. Given that this is essentially a hybrid of Lines 1 and 2, the appraisal has built upon the work undertaken on the appraisals for these individual lines, with much of the existing material updated and reconfigured for the appraisal of Phase 1. Where the appraisal is based on the use of transport modelling outputs, such appraisal has been reworked from first principles. This applied to the following sub-objectives:
Edinburgh Tram Network STAG 2 Appraisal
C:\Documents and Settings\rfineman\My Documents\Edinburgh Tram STAG 2 compilation MASTER v7 (2).doc
3
• Environment: Noise and vibration, and air quality • Safety: Accidents (road traffic) • Economy: TEE analysis • Accessibility: Community accessibility and comparative accessibility
1.12 The sections setting out the development of Edinburgh Tram have been précised from the original STAG2 appraisals, with additional material added to bring the story up to date.
1.13 Given that Phase 1 comprises two sections 1a (Leith to Airport) and 1b (Roseburn to Granton), a STAG2 appraisal has been undertaken for the core route (1a) alone and for Phase 1 in its entirety (1a+1b). Where the appraisal is largely qualitative, the incremental impact of Phase 1b follows the appraisal of Phase 1a; where the analysis is largely quantitative, the appraisal is presented for the network in its entirety ie 1a or 1a+1b. Appraisal Summary Tables are presented in full for 1a and for 1a+1b.
Structure of this report
1.14 This report describes the various processes, issues and results from the STAG appraisal for the Edinburgh Tram scheme. This is set out in the following chapters:
• Planning objectives (Chapter 2); • Problems and opportunities in Edinburgh (Chapter 3); • Scheme History and STAG Part 1 appraisal (Chapter 4); • The Edinburgh Tram network (Chapter 5) • Consultation (Chapter 6); • Scheme description (Chapter 7); • The Do Minimum and Reference Case (Chapter 8); • STAG2 appraisal (Chapter 9); • Risk and Uncertainty (Chapter 10); • Monitoring and evaluation (Chapter 11); and • Conclusions (Chapter 12).

Edinburgh Tram Network STAG 2 Appraisal
C:\Documents and Settings\rfineman\My Documents\Edinburgh Tram STAG 2 compilation MASTER v7 (2).doc
5
2. PROBLEMS AND OPPORTUNITIES
Socio-Economic Characteristics
2.1 The strength of Edinburgh’s regional economy, with corresponding growth in population and jobs, is expected to continue. Economic growth is closely related to future labour supply and population growth, with a buoyant economy likely to result in both a high level of inward migration and a growth in commuting.
2.2 The following sections outline the socio-economic context for:
• Population; • Car ownership; • Employment; • Income; • Deprivation; and • Education.
Population
2.3 At the 2001 Census Edinburgh’s population was found to be 449,020. The consensus across sources of data on projected population is for a continued growth over the coming years. Capital Review Online2 estimates that the population will increase to 456,246 by 2012 and 463,238 by 2018. The General Register Office (Scotland) estimates that Edinburgh’s population will increase to 465,000 by 2011. The higher level of population growth appears to be more consistent with potential regional
2 Capital Review Online is an online source of statistical information relating to Edinburgh, provided by City of Edinburgh
Council. It is developed from data gathered in the 2001 Census: http://www.capitalreview.co.uk/economic_data.html
The view that there are problems with the transport system is the root of any transport proposal. The identification of such problems should include perceived problems as well as those that can be quantified through data analysis.
The purpose of this chapter is to set out the key problems and opportunities in Edinburgh. The main areas considered relate to:
• Socio-economic characteristics; • Environment; and • Transport.
The following sections deal with each in turn. An additional section sets out the potential opportunities that would accompany a transport scheme of this nature.
Edinburgh Tram Network STAG 2 Appraisal
C:\Documents and Settings\rfineman\My Documents\Edinburgh Tram STAG 2 compilation MASTER v7 (2).doc
6
economic performance: sustaining the growth of the economy will require access to labour and skills in increasing numbers.
2.4 Figure 2.1 illustrates the variation in population density levels within the study area at Output Area level from the 2001 Census. Regarding the northern section of Phase 1a of the tram route high population densities are found in Newhaven, Leith and along Leith Walk. The New Town area north of Princes Street is also of high density. Although population along the Phase 1b Tram route in the north of the city is generally ‘low’ to ‘medium’, there are notable pockets of high density in West Granton/Crewe Toll, Pilton and Muirhouse. The areas of Granton and Leith Docks, whilst currently having low population levels and density, are the subject of major development plans (These are detailed in full at the end of this Chapter).
2.5 The city centre, in its function as the city’s retail and business hub has, by its very nature, a low density. As the tram route moves west away from the city centre it passes the Haymarket and Gorgie areas which contain pockets of high population density as does the area around Saughton. The area beyond this to the west leading to the airport is, by its very nature of suburban outskirts/greenbelt land, of low density (0 to 30 people per hectare).
Car Ownership
2.6 At the end of the 1990s, Edinburgh experienced one of the fastest rates of growth in car ownership in Europe – the number of cars per 1000 population rose by 162% between 1971 and 1997. Comparing the results from the 1991 and 2001 census, the number of cars per 1000 population rose by nearly 20% in that period. However, 39.5% of households in Edinburgh do not own a car (according to the 2001 Census). By 2003 car ownership across the city had increased slightly, the figure for households with no access to a car fell to 37%.3
2.7 Figure 2.2 shows the distribution of non-car owning households for the study area (based on 2001 Census). Across most of the study area the areas of low car ownership are broadly correlated to higher population density. In part this reflects the compact nature of much of the City, which allied with the comprehensive bus system, makes car ownership less attractive than is the case elsewhere. However, it is also related to income and deprivation and this is covered below. As well as the city centre, areas where the proportion of households without access to a car are highest (over 50%) are concentrated along Leith Walk and throughout Leith, Newhaven and Granton. To the west of the city centre a corridor of low car ownership is noticeable to the immediate south of phase 1 of the Edinburgh Tram route, corresponding to areas of high population density including Haymarket and Gorgie (see paragraph 2.5). The corridor of low car ownership continues to the west encompassing the Saughton, and Balgreen areas which are subject to higher levels of unemployment and deprivation (see paragraphs 2.8 – 2.11).
3 Capital Review Online: http://www.capitalreview.co.uk/economic_data.html

‡ ‡ ‡ ‡ ‡ ‡ ‡‡ ‡ ‡ ‡ ‡ ‡ ‡‡ ‡ ‡ ‡ ‡ ‡ ‡‡ ‡ ‡ ‡ ‡ ‡‡ ‡ ‡ ‡ ‡ ‡ ‡‡ ‡ ‡ ‡ ‡ ‡ ‡‡ ‡ ‡ ‡ ‡ ‡ ‡‡
è è è è è è èè è è è è è èè è è è è è èè è è è è èè è è è è è èè è è è è è èè è è è è è èè
è è è è è è èè è è è è è èè è è è è è èè è è è è èè è è è è è èè è è è è è èè è è è è è èèè è è è è è èè è è è è è èè è è è è è èè è è è è èè è è è è è èè è è è è è èè è è è è è èè
è è è è è è èè è è è è è èè è è è è è èè è è è è èè è è è è è èè è è è è è èè è è è è è èè
è è è è è è èè è è è è è èè è è è è è èè è è è è èè è è è è è èè è è è è è èè è è è è è èè
è è è è è è èè è è è è è èè è è è è è èè è è è è èè è è è è è èè è è è è è èè è è è è è èè
EDIN
BURG
H ED
INBU
RGH
EDIN
BURG
H ED
INBU
RGH
EDIN
BURG
H ED
INBU
RGH
EDIN
BURG
H ED
INBU
RGH
EDIN
BURG
H A
IRPO
RTA
IRPO
RTA
IRPO
RTA
IRPO
RTA
IRPO
RTA
IRPO
RTA
IRPO
RTA
IRPO
RTA
IRPO
RT
Sout
h Gy
leSo
uth
Gyle
Sout
h Gy
leSo
uth
Gyle
Sout
h Gy
leSo
uth
Gyle
Sout
h Gy
leSo
uth
Gyle
Sout
h Gy
leEd
inbu
rgh
Park
Sta
tion
Edin
burg
h Pa
rk S
tatio
nEd
inbu
rgh
Park
Sta
tion
Edin
burg
h Pa
rk S
tatio
nEd
inbu
rgh
Park
Sta
tion
Edin
burg
h Pa
rk S
tatio
nEd
inbu
rgh
Park
Sta
tion
Edin
burg
h Pa
rk S
tatio
nEd
inbu
rgh
Park
Sta
tion
Shan
dwic
k Pl
ace
Shan
dwic
k Pl
ace
Shan
dwic
k Pl
ace
Shan
dwic
k Pl
ace
Shan
dwic
k Pl
ace
Shan
dwic
k Pl
ace
Shan
dwic
k Pl
ace
Shan
dwic
k Pl
ace
Shan
dwic
k Pl
ace
Haym
arke
tHa
ymar
ket
Haym
arke
tHa
ymar
ket
Haym
arke
tHa
ymar
ket
Haym
arke
tHa
ymar
ket
Haym
arke
t
Mur
rayf
ield
Mur
rayf
ield
Mur
rayf
ield
Mur
rayf
ield
Mur
rayf
ield
Mur
rayf
ield
Mur
rayf
ield
Mur
rayf
ield
Mur
rayf
ield
Rose
burn
Rose
burn
Rose
burn
Rose
burn
Rose
burn
Rose
burn
Rose
burn
Rose
burn
Rose
burn
Ocea
n Te
rmin
alOc
ean
Term
inal
Ocea
n Te
rmin
alOc
ean
Term
inal
Ocea
n Te
rmin
alOc
ean
Term
inal
Ocea
n Te
rmin
alOc
ean
Term
inal
Ocea
n Te
rmin
al
Cons
titut
ion
Stre
etCo
nstit
utio
n St
reet
Cons
titut
ion
Stre
etCo
nstit
utio
n St
reet
Cons
titut
ion
Stre
etCo
nstit
utio
n St
reet
Cons
titut
ion
Stre
etCo
nstit
utio
n St
reet
Cons
titut
ion
Stre
et
St A
ndre
w S
quar
eSt
And
rew
Squ
are
St A
ndre
w S
quar
eSt
And
rew
Squ
are
St A
ndre
w S
quar
eSt
And
rew
Squ
are
St A
ndre
w S
quar
eSt
And
rew
Squ
are
St A
ndre
w S
quar
e
Prin
ces
Stre
etPr
ince
s St
reet
Prin
ces
Stre
etPr
ince
s St
reet
Prin
ces
Stre
etPr
ince
s St
reet
Prin
ces
Stre
etPr
ince
s St
reet
Prin
ces
Stre
et
New
have
nN
ewha
ven
New
have
nN
ewha
ven
New
have
nN
ewha
ven
New
have
nN
ewha
ven
New
have
n
Gran
ton
Wat
erfro
ntGr
anto
n W
ater
front
Gran
ton
Wat
erfro
ntGr
anto
n W
ater
front
Gran
ton
Wat
erfro
ntGr
anto
n W
ater
front
Gran
ton
Wat
erfro
ntGr
anto
n W
ater
front
Gran
ton
Wat
erfro
nt
Caro
line
Park
Caro
line
Park
Caro
line
Park
Caro
line
Park
Caro
line
Park
Caro
line
Park
Caro
line
Park
Caro
line
Park
Caro
line
Park
Wes
t Gra
nton
Wes
t Gra
nton
Wes
t Gra
nton
Wes
t Gra
nton
Wes
t Gra
nton
Wes
t Gra
nton
Wes
t Gra
nton
Wes
t Gra
nton
Wes
t Gra
nton
Crew
e To
llCr
ewe
Toll
Crew
e To
llCr
ewe
Toll
Crew
e To
llCr
ewe
Toll
Crew
e To
llCr
ewe
Toll
Crew
e To
ll
Telfo
rd R
oad
Telfo
rd R
oad
Telfo
rd R
oad
Telfo
rd R
oad
Telfo
rd R
oad
Telfo
rd R
oad
Telfo
rd R
oad
Telfo
rd R
oad
Telfo
rd R
oad
Crai
glei
thCr
aigl
eith
Crai
glei
thCr
aigl
eith
Crai
glei
thCr
aigl
eith
Crai
glei
thCr
aigl
eith
Crai
glei
th
Rave
lsto
n Dy
kes
Rave
lsto
n Dy
kes
Rave
lsto
n Dy
kes
Rave
lsto
n Dy
kes
Rave
lsto
n Dy
kes
Rave
lsto
n Dy
kes
Rave
lsto
n Dy
kes
Rave
lsto
n Dy
kes
Rave
lsto
n Dy
kes
Balg
reen
Balg
reen
Balg
reen
Balg
reen
Balg
reen
Balg
reen
Balg
reen
Balg
reen
Balg
reen
Saug
hton
Saug
hton
Saug
hton
Saug
hton
Saug
hton
Saug
hton
Saug
hton
Saug
hton
Saug
hton
Goga
rbur
nGo
garb
urn
Goga
rbur
nGo
garb
urn
Goga
rbur
nGo
garb
urn
Goga
rbur
nGo
garb
urn
Goga
rbur
n
Ingl
isto
n Pa
rk &
Rid
eIn
glis
ton
Park
& R
ide
Ingl
isto
n Pa
rk &
Rid
eIn
glis
ton
Park
& R
ide
Ingl
isto
n Pa
rk &
Rid
eIn
glis
ton
Park
& R
ide
Ingl
isto
n Pa
rk &
Rid
eIn
glis
ton
Park
& R
ide
Ingl
isto
n Pa
rk &
Rid
e
Sout
h Gy
leSo
uth
Gyle
Sout
h Gy
leSo
uth
Gyle
Sout
h Gy
leSo
uth
Gyle
Sout
h Gy
leSo
uth
Gyle
Sout
h Gy
le
Slat
efor
dSl
atef
ord
Slat
efor
dSl
atef
ord
Slat
efor
dSl
atef
ord
Slat
efor
dSl
atef
ord
Slat
efor
d
King
skno
we
King
skno
we
King
skno
we
King
skno
we
King
skno
we
King
skno
we
King
skno
we
King
skno
we
King
skno
we
Edin
burg
hEd
inbu
rgh
Edin
burg
hEd
inbu
rgh
Edin
burg
hEd
inbu
rgh
Edin
burg
hEd
inbu
rgh
Edin
burg
h
Gran
ton
Squa
reGr
anto
n Sq
uare
Gran
ton
Squa
reGr
anto
n Sq
uare
Gran
ton
Squa
reGr
anto
n Sq
uare
Gran
ton
Squa
reGr
anto
n Sq
uare
Gran
ton
Squa
re
St A
ndre
w S
quar
eSt
And
rew
Squ
are
St A
ndre
w S
quar
eSt
And
rew
Squ
are
St A
ndre
w S
quar
eSt
And
rew
Squ
are
St A
ndre
w S
quar
eSt
And
rew
Squ
are
St A
ndre
w S
quar
e
Pica
rdy
Plac
ePi
card
y Pl
ace
Pica
rdy
Plac
ePi
card
y Pl
ace
Pica
rdy
Plac
ePi
card
y Pl
ace
Pica
rdy
Plac
ePi
card
y Pl
ace
Pica
rdy
Plac
e
McD
onal
d Ro
adM
cDon
ald
Road
McD
onal
d Ro
adM
cDon
ald
Road
McD
onal
d Ro
adM
cDon
ald
Road
McD
onal
d Ro
adM
cDon
ald
Road
McD
onal
d Ro
ad
Balfo
ur S
treet
Balfo
ur S
treet
Balfo
ur S
treet
Balfo
ur S
treet
Balfo
ur S
treet
Balfo
ur S
treet
Balfo
ur S
treet
Balfo
ur S
treet
Balfo
ur S
treet
Foot
of t
he W
alk
Foot
of t
he W
alk
Foot
of t
he W
alk
Foot
of t
he W
alk
Foot
of t
he W
alk
Foot
of t
he W
alk
Foot
of t
he W
alk
Foot
of t
he W
alk
Foot
of t
he W
alk
Cons
titut
ion
Stre
etCo
nstit
utio
n St
reet
Cons
titut
ion
Stre
etCo
nstit
utio
n St
reet
Cons
titut
ion
Stre
etCo
nstit
utio
n St
reet
Cons
titut
ion
Stre
etCo
nstit
utio
n St
reet
Cons
titut
ion
Stre
et
Ocea
n Dr
ive
Ocea
n Dr
ive
Ocea
n Dr
ive
Ocea
n Dr
ive
Ocea
n Dr
ive
Ocea
n Dr
ive
Ocea
n Dr
ive
Ocea
n Dr
ive
Ocea
n Dr
ive
Edin
burg
h Pa
rkEd
inbu
rgh
Park
Edin
burg
h Pa
rkEd
inbu
rgh
Park
Edin
burg
h Pa
rkEd
inbu
rgh
Park
Edin
burg
h Pa
rkEd
inbu
rgh
Park
Edin
burg
h Pa
rk
Gyle
Gyle
Gyle
Gyle
Gyle
Gyle
Gyle
Gyle
Gyle
Edin
burg
h Ai
rpor
tEd
inbu
rgh
Airp
ort
Edin
burg
h Ai
rpor
tEd
inbu
rgh
Airp
ort
Edin
burg
h Ai
rpor
tEd
inbu
rgh
Airp
ort
Edin
burg
h Ai
rpor
tEd
inbu
rgh
Airp
ort
Edin
burg
h Ai
rpor
t
stee
r da
vies
gle
ave
Edin
burg
h T
ram
STA
G 2
Appra
isal
Fig
ure
2.1
: 2
001 P
opula
tion D
ensi
ty in H
ecta
res
© © ©© ©© © ©©C
row
n C
op
yrig
ht R
eser
ved
Cro
wn
Co
pyr
ight
Res
erve
dC
row
n C
op
yrig
ht R
eser
ved
Cro
wn
Co
pyr
ight
Res
erve
dC
row
n C
op
yrig
ht R
eser
ved
Cro
wn
Co
pyr
ight
Res
erve
dC
row
n C
op
yrig
ht R
eser
ved
Cro
wn
Co
pyr
ight
Res
erve
dC
row
n C
op
yrig
ht R
eser
ved
Ord
nanc
e S
urve
yO
rdna
nce
Sur
vey
Ord
nanc
e S
urve
yO
rdna
nce
Sur
vey
Ord
nanc
e S
urve
yO
rdna
nce
Sur
vey
Ord
nanc
e S
urve
yO
rdna
nce
Sur
vey
Ord
nanc
e S
urve
y20
02 T
ele
Atla
s B
.v. '
s-H
erto
genb
osc
h. A
ll ri
ghts
res
erve
d.
2002
Tel
e A
tlas
B.v
. 's-
Her
toge
nbo
sch.
All
righ
ts r
eser
ved
.20
02 T
ele
Atla
s B
.v. '
s-H
erto
genb
osc
h. A
ll ri
ghts
res
erve
d.
2002
Tel
e A
tlas
B.v
. 's-
Her
toge
nbo
sch.
All
righ
ts r
eser
ved
.20
02 T
ele
Atla
s B
.v. '
s-H
erto
genb
osc
h. A
ll ri
ghts
res
erve
d.
2002
Tel
e A
tlas
B.v
. 's-
Her
toge
nbo
sch.
All
righ
ts r
eser
ved
.20
02 T
ele
Atla
s B
.v. '
s-H
erto
genb
osc
h. A
ll ri
ghts
res
erve
d.
2002
Tel
e A
tlas
B.v
. 's-
Her
toge
nbo
sch.
All
righ
ts r
eser
ved
.20
02 T
ele
Atla
s B
.v. '
s-H
erto
genb
osc
h. A
ll ri
ghts
res
erve
d.
2001
Cen
sus,
Out
put
Are
a B
oun
dar
ies.
2001
Cen
sus,
Out
put
Are
a B
oun
dar
ies.
2001
Cen
sus,
Out
put
Are
a B
oun
dar
ies.
2001
Cen
sus,
Out
put
Are
a B
oun
dar
ies.
2001
Cen
sus,
Out
put
Are
a B
oun
dar
ies.
2001
Cen
sus,
Out
put
Are
a B
oun
dar
ies.
2001
Cen
sus,
Out
put
Are
a B
oun
dar
ies.
2001
Cen
sus,
Out
put
Are
a B
oun
dar
ies.
2001
Cen
sus,
Out
put
Are
a B
oun
dar
ies.
Cro
wn
cop
yrig
ht m
ater
ial i
s re
pro
duc
ed
Cro
wn
cop
yrig
ht m
ater
ial i
s re
pro
duc
ed
Cro
wn
cop
yrig
ht m
ater
ial i
s re
pro
duc
ed
Cro
wn
cop
yrig
ht m
ater
ial i
s re
pro
duc
ed
Cro
wn
cop
yrig
ht m
ater
ial i
s re
pro
duc
ed
Cro
wn
cop
yrig
ht m
ater
ial i
s re
pro
duc
ed
Cro
wn
cop
yrig
ht m
ater
ial i
s re
pro
duc
ed
Cro
wn
cop
yrig
ht m
ater
ial i
s re
pro
duc
ed
Cro
wn
cop
yrig
ht m
ater
ial i
s re
pro
duc
ed
with
the
per
mis
sio
n o
f the
Co
ntro
ller
of H
MS
Ow
ith th
e p
erm
issi
on
of t
he C
ont
rolle
r o
f HM
SO
with
the
per
mis
sio
n o
f the
Co
ntro
ller
of H
MS
Ow
ith th
e p
erm
issi
on
of t
he C
ont
rolle
r o
f HM
SO
with
the
per
mis
sio
n o
f the
Co
ntro
ller
of H
MS
Ow
ith th
e p
erm
issi
on
of t
he C
ont
rolle
r o
f HM
SO
with
the
per
mis
sio
n o
f the
Co
ntro
ller
of H
MS
Ow
ith th
e p
erm
issi
on
of t
he C
ont
rolle
r o
f HM
SO
with
the
per
mis
sio
n o
f the
Co
ntro
ller
of H
MS
OS
cott
ish
Exe
cutiv
eS
cott
ish
Exe
cutiv
eS
cott
ish
Exe
cutiv
eS
cott
ish
Exe
cutiv
eS
cott
ish
Exe
cutiv
eS
cott
ish
Exe
cutiv
eS
cott
ish
Exe
cutiv
eS
cott
ish
Exe
cutiv
eS
cott
ish
Exe
cutiv
e
P:\
CG
G\G
IS\W
ork
\Pro
ject
s\69
00s\
6968
\Map
pin
g\M
apIn
fo\W
ork
spac
es\S
oci
oE
cono
mic
Ind
icat
ors
.wo
r
2001
Po
pul
atio
n D
ensi
ty in
Hec
tare
sS
our
ce:
200
1 C
ensu
s at
Out
put
Are
a Le
vel
Ove
r 20
010
0 to
200
50 to
100
30 to
50
0 to
30
Ed
inb
urgh
Tra
m P
hase
1a
Ed
inb
urgh
Tra
m P
hase
1b

‡ ‡ ‡ ‡ ‡ ‡ ‡‡ ‡ ‡ ‡ ‡ ‡ ‡‡ ‡ ‡ ‡ ‡ ‡ ‡‡ ‡ ‡ ‡ ‡ ‡‡ ‡ ‡ ‡ ‡ ‡ ‡‡ ‡ ‡ ‡ ‡ ‡ ‡‡ ‡ ‡ ‡ ‡ ‡ ‡‡
è è è è è è èè è è è è è èè è è è è è èè è è è è èè è è è è è èè è è è è è èè è è è è è èè
è è è è è è èè è è è è è èè è è è è è èè è è è è èè è è è è è èè è è è è è èè è è è è è èèè è è è è è èè è è è è è èè è è è è è èè è è è è èè è è è è è èè è è è è è èè è è è è è èè
è è è è è è èè è è è è è èè è è è è è èè è è è è èè è è è è è èè è è è è è èè è è è è è èè
è è è è è è èè è è è è è èè è è è è è èè è è è è èè è è è è è èè è è è è è èè è è è è è èè
è è è è è è èè è è è è è èè è è è è è èè è è è è èè è è è è è èè è è è è è èè è è è è è èè
EDIN
BURG
H ED
INBU
RGH
EDIN
BURG
H ED
INBU
RGH
EDIN
BURG
H ED
INBU
RGH
EDIN
BURG
H ED
INBU
RGH
EDIN
BURG
H A
IRPO
RTA
IRPO
RTA
IRPO
RTA
IRPO
RTA
IRPO
RTA
IRPO
RTA
IRPO
RTA
IRPO
RTA
IRPO
RT
Sout
h Gy
leSo
uth
Gyle
Sout
h Gy
leSo
uth
Gyle
Sout
h Gy
leSo
uth
Gyle
Sout
h Gy
leSo
uth
Gyle
Sout
h Gy
leEd
inbu
rgh
Park
Sta
tion
Edin
burg
h Pa
rk S
tatio
nEd
inbu
rgh
Park
Sta
tion
Edin
burg
h Pa
rk S
tatio
nEd
inbu
rgh
Park
Sta
tion
Edin
burg
h Pa
rk S
tatio
nEd
inbu
rgh
Park
Sta
tion
Edin
burg
h Pa
rk S
tatio
nEd
inbu
rgh
Park
Sta
tion
Shan
dwic
k Pl
ace
Shan
dwic
k Pl
ace
Shan
dwic
k Pl
ace
Shan
dwic
k Pl
ace
Shan
dwic
k Pl
ace
Shan
dwic
k Pl
ace
Shan
dwic
k Pl
ace
Shan
dwic
k Pl
ace
Shan
dwic
k Pl
ace
Haym
arke
tHa
ymar
ket
Haym
arke
tHa
ymar
ket
Haym
arke
tHa
ymar
ket
Haym
arke
tHa
ymar
ket
Haym
arke
t
Mur
rayf
ield
Mur
rayf
ield
Mur
rayf
ield
Mur
rayf
ield
Mur
rayf
ield
Mur
rayf
ield
Mur
rayf
ield
Mur
rayf
ield
Mur
rayf
ield
Rose
burn
Rose
burn
Rose
burn
Rose
burn
Rose
burn
Rose
burn
Rose
burn
Rose
burn
Rose
burn
Ocea
n Te
rmin
alOc
ean
Term
inal
Ocea
n Te
rmin
alOc
ean
Term
inal
Ocea
n Te
rmin
alOc
ean
Term
inal
Ocea
n Te
rmin
alOc
ean
Term
inal
Ocea
n Te
rmin
al
Cons
titut
ion
Stre
etCo
nstit
utio
n St
reet
Cons
titut
ion
Stre
etCo
nstit
utio
n St
reet
Cons
titut
ion
Stre
etCo
nstit
utio
n St
reet
Cons
titut
ion
Stre
etCo
nstit
utio
n St
reet
Cons
titut
ion
Stre
et
St A
ndre
w S
quar
eSt
And
rew
Squ
are
St A
ndre
w S
quar
eSt
And
rew
Squ
are
St A
ndre
w S
quar
eSt
And
rew
Squ
are
St A
ndre
w S
quar
eSt
And
rew
Squ
are
St A
ndre
w S
quar
e
Prin
ces
Stre
etPr
ince
s St
reet
Prin
ces
Stre
etPr
ince
s St
reet
Prin
ces
Stre
etPr
ince
s St
reet
Prin
ces
Stre
etPr
ince
s St
reet
Prin
ces
Stre
et
New
have
nN
ewha
ven
New
have
nN
ewha
ven
New
have
nN
ewha
ven
New
have
nN
ewha
ven
New
have
n
Gran
ton
Wat
erfro
ntGr
anto
n W
ater
front
Gran
ton
Wat
erfro
ntGr
anto
n W
ater
front
Gran
ton
Wat
erfro
ntGr
anto
n W
ater
front
Gran
ton
Wat
erfro
ntGr
anto
n W
ater
front
Gran
ton
Wat
erfro
nt
Caro
line
Park
Caro
line
Park
Caro
line
Park
Caro
line
Park
Caro
line
Park
Caro
line
Park
Caro
line
Park
Caro
line
Park
Caro
line
Park
Wes
t Gra
nton
Wes
t Gra
nton
Wes
t Gra
nton
Wes
t Gra
nton
Wes
t Gra
nton
Wes
t Gra
nton
Wes
t Gra
nton
Wes
t Gra
nton
Wes
t Gra
nton
Crew
e To
llCr
ewe
Toll
Crew
e To
llCr
ewe
Toll
Crew
e To
llCr
ewe
Toll
Crew
e To
llCr
ewe
Toll
Crew
e To
ll
Telfo
rd R
oad
Telfo
rd R
oad
Telfo
rd R
oad
Telfo
rd R
oad
Telfo
rd R
oad
Telfo
rd R
oad
Telfo
rd R
oad
Telfo
rd R
oad
Telfo
rd R
oad
Crai
glei
thCr
aigl
eith
Crai
glei
thCr
aigl
eith
Crai
glei
thCr
aigl
eith
Crai
glei
thCr
aigl
eith
Crai
glei
th
Rave
lsto
n Dy
kes
Rave
lsto
n Dy
kes
Rave
lsto
n Dy
kes
Rave
lsto
n Dy
kes
Rave
lsto
n Dy
kes
Rave
lsto
n Dy
kes
Rave
lsto
n Dy
kes
Rave
lsto
n Dy
kes
Rave
lsto
n Dy
kes
Balg
reen
Balg
reen
Balg
reen
Balg
reen
Balg
reen
Balg
reen
Balg
reen
Balg
reen
Balg
reen
Saug
hton
Saug
hton
Saug
hton
Saug
hton
Saug
hton
Saug
hton
Saug
hton
Saug
hton
Saug
hton
Goga
rbur
nGo
garb
urn
Goga
rbur
nGo
garb
urn
Goga
rbur
nGo
garb
urn
Goga
rbur
nGo
garb
urn
Goga
rbur
n
Ingl
isto
n Pa
rk &
Rid
eIn
glis
ton
Park
& R
ide
Ingl
isto
n Pa
rk &
Rid
eIn
glis
ton
Park
& R
ide
Ingl
isto
n Pa
rk &
Rid
eIn
glis
ton
Park
& R
ide
Ingl
isto
n Pa
rk &
Rid
eIn
glis
ton
Park
& R
ide
Ingl
isto
n Pa
rk &
Rid
e
Sout
h Gy
leSo
uth
Gyle
Sout
h Gy
leSo
uth
Gyle
Sout
h Gy
leSo
uth
Gyle
Sout
h Gy
leSo
uth
Gyle
Sout
h Gy
le
Slat
efor
dSl
atef
ord
Slat
efor
dSl
atef
ord
Slat
efor
dSl
atef
ord
Slat
efor
dSl
atef
ord
Slat
efor
d
King
skno
we
King
skno
we
King
skno
we
King
skno
we
King
skno
we
King
skno
we
King
skno
we
King
skno
we
King
skno
we
Edin
burg
hEd
inbu
rgh
Edin
burg
hEd
inbu
rgh
Edin
burg
hEd
inbu
rgh
Edin
burg
hEd
inbu
rgh
Edin
burg
h
Gran
ton
Squa
reGr
anto
n Sq
uare
Gran
ton
Squa
reGr
anto
n Sq
uare
Gran
ton
Squa
reGr
anto
n Sq
uare
Gran
ton
Squa
reGr
anto
n Sq
uare
Gran
ton
Squa
re
St A
ndre
w S
quar
eSt
And
rew
Squ
are
St A
ndre
w S
quar
eSt
And
rew
Squ
are
St A
ndre
w S
quar
eSt
And
rew
Squ
are
St A
ndre
w S
quar
eSt
And
rew
Squ
are
St A
ndre
w S
quar
e
Pica
rdy
Plac
ePi
card
y Pl
ace
Pica
rdy
Plac
ePi
card
y Pl
ace
Pica
rdy
Plac
ePi
card
y Pl
ace
Pica
rdy
Plac
ePi
card
y Pl
ace
Pica
rdy
Plac
e
McD
onal
d Ro
adM
cDon
ald
Road
McD
onal
d Ro
adM
cDon
ald
Road
McD
onal
d Ro
adM
cDon
ald
Road
McD
onal
d Ro
adM
cDon
ald
Road
McD
onal
d Ro
ad
Balfo
ur S
treet
Balfo
ur S
treet
Balfo
ur S
treet
Balfo
ur S
treet
Balfo
ur S
treet
Balfo
ur S
treet
Balfo
ur S
treet
Balfo
ur S
treet
Balfo
ur S
treet
Foot
of t
he W
alk
Foot
of t
he W
alk
Foot
of t
he W
alk
Foot
of t
he W
alk
Foot
of t
he W
alk
Foot
of t
he W
alk
Foot
of t
he W
alk
Foot
of t
he W
alk
Foot
of t
he W
alk
Cons
titut
ion
Stre
etCo
nstit
utio
n St
reet
Cons
titut
ion
Stre
etCo
nstit
utio
n St
reet
Cons
titut
ion
Stre
etCo
nstit
utio
n St
reet
Cons
titut
ion
Stre
etCo
nstit
utio
n St
reet
Cons
titut
ion
Stre
et
Ocea
n Dr
ive
Ocea
n Dr
ive
Ocea
n Dr
ive
Ocea
n Dr
ive
Ocea
n Dr
ive
Ocea
n Dr
ive
Ocea
n Dr
ive
Ocea
n Dr
ive
Ocea
n Dr
ive
Edin
burg
h Pa
rkEd
inbu
rgh
Park
Edin
burg
h Pa
rkEd
inbu
rgh
Park
Edin
burg
h Pa
rkEd
inbu
rgh
Park
Edin
burg
h Pa
rkEd
inbu
rgh
Park
Edin
burg
h Pa
rk
Gyle
Gyle
Gyle
Gyle
Gyle
Gyle
Gyle
Gyle
Gyle
Edin
burg
h Ai
rpor
tEd
inbu
rgh
Airp
ort
Edin
burg
h Ai
rpor
tEd
inbu
rgh
Airp
ort
Edin
burg
h Ai
rpor
tEd
inbu
rgh
Airp
ort
Edin
burg
h Ai
rpor
tEd
inbu
rgh
Airp
ort
Edin
burg
h Ai
rpor
t
stee
r da
vies
gle
ave
Edin
burg
h T
ram
STA
G 2
Appra
isal
Fig
ure
2.2
: P
erc
enta
ge o
f H
ouse
hold
s w
ith N
o C
ar
P:\
CG
G\G
IS\W
ork
\Pro
ject
s\69
00s\
6968
\Map
pin
g\M
apIn
fo\W
ork
spac
es\S
oci
oE
cono
mic
Ind
icat
ors
.wo
r
Per
cent
age
of H
ous
eho
lds
With
No
Car
So
urce
: 2
001
Cen
sus
at O
utp
ut A
rea
Leve
l
Ove
r 50
%40
% to
50%
30%
to 4
0%20
% to
30%
0 to
20%
© © ©© ©© © ©©C
row
n C
op
yrig
ht R
eser
ved
Cro
wn
Co
pyr
ight
Res
erve
dC
row
n C
op
yrig
ht R
eser
ved
Cro
wn
Co
pyr
ight
Res
erve
dC
row
n C
op
yrig
ht R
eser
ved
Cro
wn
Co
pyr
ight
Res
erve
dC
row
n C
op
yrig
ht R
eser
ved
Cro
wn
Co
pyr
ight
Res
erve
dC
row
n C
op
yrig
ht R
eser
ved
Ord
nanc
e S
urve
yO
rdna
nce
Sur
vey
Ord
nanc
e S
urve
yO
rdna
nce
Sur
vey
Ord
nanc
e S
urve
yO
rdna
nce
Sur
vey
Ord
nanc
e S
urve
yO
rdna
nce
Sur
vey
Ord
nanc
e S
urve
y20
02 T
ele
Atla
s B
.v. '
s-H
erto
genb
osc
h. A
ll ri
ghts
res
erve
d.
2002
Tel
e A
tlas
B.v
. 's-
Her
toge
nbo
sch.
All
righ
ts r
eser
ved
.20
02 T
ele
Atla
s B
.v. '
s-H
erto
genb
osc
h. A
ll ri
ghts
res
erve
d.
2002
Tel
e A
tlas
B.v
. 's-
Her
toge
nbo
sch.
All
righ
ts r
eser
ved
.20
02 T
ele
Atla
s B
.v. '
s-H
erto
genb
osc
h. A
ll ri
ghts
res
erve
d.
2002
Tel
e A
tlas
B.v
. 's-
Her
toge
nbo
sch.
All
righ
ts r
eser
ved
.20
02 T
ele
Atla
s B
.v. '
s-H
erto
genb
osc
h. A
ll ri
ghts
res
erve
d.
2002
Tel
e A
tlas
B.v
. 's-
Her
toge
nbo
sch.
All
righ
ts r
eser
ved
.20
02 T
ele
Atla
s B
.v. '
s-H
erto
genb
osc
h. A
ll ri
ghts
res
erve
d.
2001
Cen
sus,
Out
put
Are
a B
oun
dar
ies.
2001
Cen
sus,
Out
put
Are
a B
oun
dar
ies.
2001
Cen
sus,
Out
put
Are
a B
oun
dar
ies.
2001
Cen
sus,
Out
put
Are
a B
oun
dar
ies.
2001
Cen
sus,
Out
put
Are
a B
oun
dar
ies.
2001
Cen
sus,
Out
put
Are
a B
oun
dar
ies.
2001
Cen
sus,
Out
put
Are
a B
oun
dar
ies.
2001
Cen
sus,
Out
put
Are
a B
oun
dar
ies.
2001
Cen
sus,
Out
put
Are
a B
oun
dar
ies.
Cro
wn
cop
yrig
ht m
ater
ial i
s re
pro
duc
ed
Cro
wn
cop
yrig
ht m
ater
ial i
s re
pro
duc
ed
Cro
wn
cop
yrig
ht m
ater
ial i
s re
pro
duc
ed
Cro
wn
cop
yrig
ht m
ater
ial i
s re
pro
duc
ed
Cro
wn
cop
yrig
ht m
ater
ial i
s re
pro
duc
ed
Cro
wn
cop
yrig
ht m
ater
ial i
s re
pro
duc
ed
Cro
wn
cop
yrig
ht m
ater
ial i
s re
pro
duc
ed
Cro
wn
cop
yrig
ht m
ater
ial i
s re
pro
duc
ed
Cro
wn
cop
yrig
ht m
ater
ial i
s re
pro
duc
ed
with
the
per
mis
sio
n o
f the
Co
ntro
ller
of H
MS
Ow
ith th
e p
erm
issi
on
of t
he C
ont
rolle
r o
f HM
SO
with
the
per
mis
sio
n o
f the
Co
ntro
ller
of H
MS
Ow
ith th
e p
erm
issi
on
of t
he C
ont
rolle
r o
f HM
SO
with
the
per
mis
sio
n o
f the
Co
ntro
ller
of H
MS
Ow
ith th
e p
erm
issi
on
of t
he C
ont
rolle
r o
f HM
SO
with
the
per
mis
sio
n o
f the
Co
ntro
ller
of H
MS
Ow
ith th
e p
erm
issi
on
of t
he C
ont
rolle
r o
f HM
SO
with
the
per
mis
sio
n o
f the
Co
ntro
ller
of H
MS
OS
cott
ish
Exe
cutiv
eS
cott
ish
Exe
cutiv
eS
cott
ish
Exe
cutiv
eS
cott
ish
Exe
cutiv
eS
cott
ish
Exe
cutiv
eS
cott
ish
Exe
cutiv
eS
cott
ish
Exe
cutiv
eS
cott
ish
Exe
cutiv
eS
cott
ish
Exe
cutiv
e
Ed
inb
urgh
Tra
m P
hase
1a
Ed
inb
urgh
Tra
m P
hase
1b

Edinburgh Tram Network STAG 2 Appraisal
C:\Documents and Settings\rfineman\My Documents\Edinburgh Tram STAG 2 compilation MASTER v7 (2).doc
9
Employment
2.8 Unemployment is at a 25-year low and is expected to decline only slightly from its present level. In 2003 2% of Edinburgh’s resident adult population were unemployed and seeking work, with 57% in full or part time employment or self employed. In turn, growing output would support substantial growth in real income and spending, leading to effects on demand for services, such as shops, leisure, health, education and, particularly, travel.
2.9 Figure 2.3 illustrates unemployment levels (from the 2001 Census) and their distribution. There are significant spatial variations in unemployment with the key concentrations of unemployment in north Edinburgh in pockets of Leith and, with more widespread areas, in Granton, Pilton and Muirhouse. Areas with lowest unemployment (0 – 2.5%) are broadly focussed north of the city centre including the New Town, and in corridors south of the city centre including Slateford, Morningside, Newington and Kingsknowe. In West Edinburgh there are areas of significant unemployment located along the proposed route for Edinburgh Tram Phase 1a, centred around the Balgreen, Stenhouse and Saughton areas. Lower levels of unemployment to the north of the western section of the tram route are evident in the Gyle and Edinburgh Park areas.
Income
2.10 Figure 2.4 shows the distribution of income across the city. As would be expected, the areas of lower income are correlated with areas of low car ownership and high unemployment. The tram route in the north of the city passes through Granton (on the Phase 1b route) and Newhaven and Leith (on the Phase 1a route) which are all shown to be relatively high in terms of the proportion on low incomes. As well as linking these areas of low income in the north east to the city centre, the western section of Phase 1a of the Tram would also link Saughton, Stenhouse and Balgreen, where income is relatively low, to the city centre and other key employment sites.
Deprivation
2.11 The area covered by the Waterfront Regeneration Initiative and surrounding neighbourhoods, notably the Granton, Pilton and Muirhouse areas, has a history of social deprivation and exclusion. This is shown in Figure 2.5, which illustrates the deprivation level for wards in Edinburgh, based on the Index of Multiple Deprivation (IMD) per ward. In North Edinburgh, Granton and surrounding area, which would be served by Phase 1b of the Tram, again features as one of the most deprived areas in the city. Leith and the northern section of Leith Walk, which would be dissected by Phase 1a of the Tram, are relatively more deprived than the majority of the city as are the areas around Haymarket and Saughton which would also be passed through by the Phase 1a route.

Edinburgh Tram Network STAG 2 Appraisal
C:\Documents and Settings\rfineman\My Documents\Edinburgh Tram STAG 2 compilation MASTER v7 (2).doc
10
Education
2.12 Figure 2.6 illustrates the level of education in the study area. As with the other indicators, the areas of Granton, Pilton and Muirhouse show poor levels of educational achievement amongst their populace, with Leith and the area surrounding Leith Walk also performing poorly compared to the average. West of Haymarket, Phase 1a passes through areas (Saughton and South Gyle) which have comparatively higher levels of educational deprivation compared to the central, north-western and southern areas of the city.
Socio-Economic Characteristics in North Edinburgh
2.13 Parts of North Edinburgh have particularly challenging social inclusion issues in comparison to other areas of the city. These are long standing problems which have, to date, not been successfully rectified. The areas economic and social problems are a reflection of its traditional reliance upon industries which have since declined and have, as yet, not been replaced. As a result of the significance of the social problems in the North Edinburgh area, it has been the subject of a policy initiative, which seeks to address social derivation issues. As such, there is a rich stream of data that illustrates the area’s social deprivation compared with the rest of the City and Edinburgh. However, whilst the available research is quoted extensively below, it is important to note that social needs are not limited to the neighbourhoods covered by the data. Social deprivation spreads across much of the north of the City, including Leith, where, notwithstanding recent regeneration, social issues remain. The situation in the North Edinburgh Area Renewal (NEAR) area is typical of many parts of the north of the city.
2.14 As well as the areas covered by the Waterfront Regeneration Initiative, the surrounding neighbourhoods and North Edinburgh as a whole have a history of social deprivation and exclusion. As a result the redevelopment of the Waterfront area is intended to contribute to the regeneration of Granton and the surrounding areas. Granton, and its neighbouring areas of West Pilton, Muirhouse, Drylaw and Royston/Wardieburn suffer from significant levels of social deprivation. A 1999 study by Halcrow4 produced an updated Economic and Social Profile of the NEAR area, covering these five areas. Although this study could now be considered somewhat dated, its conclusions have been verbally verified by NEAR in August 2006 during the update of this STAG appraisal.
4 Halcrow Fox (1999) Review of the Economic and Social Profile of the NEAR Area – Final Report, and Technical Appendix: Survey Cross-Tabulations North Edinburgh Renewal. November 1999.
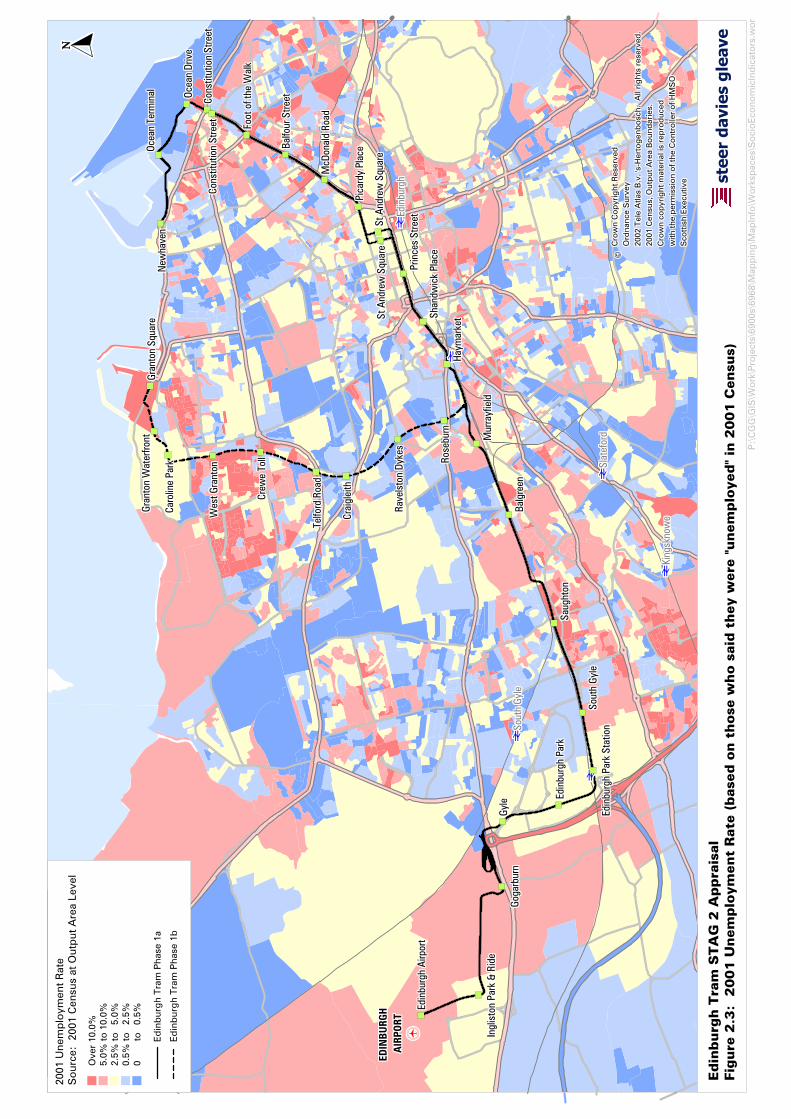
‡ ‡ ‡ ‡ ‡ ‡ ‡‡ ‡ ‡ ‡ ‡ ‡ ‡‡ ‡ ‡ ‡ ‡ ‡ ‡‡ ‡ ‡ ‡ ‡ ‡‡ ‡ ‡ ‡ ‡ ‡ ‡‡ ‡ ‡ ‡ ‡ ‡ ‡‡ ‡ ‡ ‡ ‡ ‡ ‡‡
è è è è è è èè è è è è è èè è è è è è èè è è è è èè è è è è è èè è è è è è èè è è è è è èè
è è è è è è èè è è è è è èè è è è è è èè è è è è èè è è è è è èè è è è è è èè è è è è è èèè è è è è è èè è è è è è èè è è è è è èè è è è è èè è è è è è èè è è è è è èè è è è è è èè
è è è è è è èè è è è è è èè è è è è è èè è è è è èè è è è è è èè è è è è è èè è è è è è èè
è è è è è è èè è è è è è èè è è è è è èè è è è è èè è è è è è èè è è è è è èè è è è è è èè
è è è è è è èè è è è è è èè è è è è è èè è è è è èè è è è è è èè è è è è è èè è è è è è èè
EDIN
BURG
H ED
INBU
RGH
EDIN
BURG
H ED
INBU
RGH
EDIN
BURG
H ED
INBU
RGH
EDIN
BURG
H ED
INBU
RGH
EDIN
BURG
H A
IRPO
RTA
IRPO
RTA
IRPO
RTA
IRPO
RTA
IRPO
RTA
IRPO
RTA
IRPO
RTA
IRPO
RTA
IRPO
RT
Sout
h Gy
leSo
uth
Gyle
Sout
h Gy
leSo
uth
Gyle
Sout
h Gy
leSo
uth
Gyle
Sout
h Gy
leSo
uth
Gyle
Sout
h Gy
leEd
inbu
rgh
Park
Sta
tion
Edin
burg
h Pa
rk S
tatio
nEd
inbu
rgh
Park
Sta
tion
Edin
burg
h Pa
rk S
tatio
nEd
inbu
rgh
Park
Sta
tion
Edin
burg
h Pa
rk S
tatio
nEd
inbu
rgh
Park
Sta
tion
Edin
burg
h Pa
rk S
tatio
nEd
inbu
rgh
Park
Sta
tion
Shan
dwic
k Pl
ace
Shan
dwic
k Pl
ace
Shan
dwic
k Pl
ace
Shan
dwic
k Pl
ace
Shan
dwic
k Pl
ace
Shan
dwic
k Pl
ace
Shan
dwic
k Pl
ace
Shan
dwic
k Pl
ace
Shan
dwic
k Pl
ace
Haym
arke
tHa
ymar
ket
Haym
arke
tHa
ymar
ket
Haym
arke
tHa
ymar
ket
Haym
arke
tHa
ymar
ket
Haym
arke
t
Mur
rayf
ield
Mur
rayf
ield
Mur
rayf
ield
Mur
rayf
ield
Mur
rayf
ield
Mur
rayf
ield
Mur
rayf
ield
Mur
rayf
ield
Mur
rayf
ield
Rose
burn
Rose
burn
Rose
burn
Rose
burn
Rose
burn
Rose
burn
Rose
burn
Rose
burn
Rose
burn
Ocea
n Te
rmin
alOc
ean
Term
inal
Ocea
n Te
rmin
alOc
ean
Term
inal
Ocea
n Te
rmin
alOc
ean
Term
inal
Ocea
n Te
rmin
alOc
ean
Term
inal
Ocea
n Te
rmin
al
Cons
titut
ion
Stre
etCo
nstit
utio
n St
reet
Cons
titut
ion
Stre
etCo
nstit
utio
n St
reet
Cons
titut
ion
Stre
etCo
nstit
utio
n St
reet
Cons
titut
ion
Stre
etCo
nstit
utio
n St
reet
Cons
titut
ion
Stre
et
St A
ndre
w S
quar
eSt
And
rew
Squ
are
St A
ndre
w S
quar
eSt
And
rew
Squ
are
St A
ndre
w S
quar
eSt
And
rew
Squ
are
St A
ndre
w S
quar
eSt
And
rew
Squ
are
St A
ndre
w S
quar
e
Prin
ces
Stre
etPr
ince
s St
reet
Prin
ces
Stre
etPr
ince
s St
reet
Prin
ces
Stre
etPr
ince
s St
reet
Prin
ces
Stre
etPr
ince
s St
reet
Prin
ces
Stre
et
New
have
nN
ewha
ven
New
have
nN
ewha
ven
New
have
nN
ewha
ven
New
have
nN
ewha
ven
New
have
n
Gran
ton
Wat
erfro
ntGr
anto
n W
ater
front
Gran
ton
Wat
erfro
ntGr
anto
n W
ater
front
Gran
ton
Wat
erfro
ntGr
anto
n W
ater
front
Gran
ton
Wat
erfro
ntGr
anto
n W
ater
front
Gran
ton
Wat
erfro
nt
Caro
line
Park
Caro
line
Park
Caro
line
Park
Caro
line
Park
Caro
line
Park
Caro
line
Park
Caro
line
Park
Caro
line
Park
Caro
line
Park
Wes
t Gra
nton
Wes
t Gra
nton
Wes
t Gra
nton
Wes
t Gra
nton
Wes
t Gra
nton
Wes
t Gra
nton
Wes
t Gra
nton
Wes
t Gra
nton
Wes
t Gra
nton
Crew
e To
llCr
ewe
Toll
Crew
e To
llCr
ewe
Toll
Crew
e To
llCr
ewe
Toll
Crew
e To
llCr
ewe
Toll
Crew
e To
ll
Telfo
rd R
oad
Telfo
rd R
oad
Telfo
rd R
oad
Telfo
rd R
oad
Telfo
rd R
oad
Telfo
rd R
oad
Telfo
rd R
oad
Telfo
rd R
oad
Telfo
rd R
oad
Crai
glei
thCr
aigl
eith
Crai
glei
thCr
aigl
eith
Crai
glei
thCr
aigl
eith
Crai
glei
thCr
aigl
eith
Crai
glei
th
Rave
lsto
n Dy
kes
Rave
lsto
n Dy
kes
Rave
lsto
n Dy
kes
Rave
lsto
n Dy
kes
Rave
lsto
n Dy
kes
Rave
lsto
n Dy
kes
Rave
lsto
n Dy
kes
Rave
lsto
n Dy
kes
Rave
lsto
n Dy
kes
Balg
reen
Balg
reen
Balg
reen
Balg
reen
Balg
reen
Balg
reen
Balg
reen
Balg
reen
Balg
reen
Saug
hton
Saug
hton
Saug
hton
Saug
hton
Saug
hton
Saug
hton
Saug
hton
Saug
hton
Saug
hton
Goga
rbur
nGo
garb
urn
Goga
rbur
nGo
garb
urn
Goga
rbur
nGo
garb
urn
Goga
rbur
nGo
garb
urn
Goga
rbur
n
Ingl
isto
n Pa
rk &
Rid
eIn
glis
ton
Park
& R
ide
Ingl
isto
n Pa
rk &
Rid
eIn
glis
ton
Park
& R
ide
Ingl
isto
n Pa
rk &
Rid
eIn
glis
ton
Park
& R
ide
Ingl
isto
n Pa
rk &
Rid
eIn
glis
ton
Park
& R
ide
Ingl
isto
n Pa
rk &
Rid
e
Sout
h Gy
leSo
uth
Gyle
Sout
h Gy
leSo
uth
Gyle
Sout
h Gy
leSo
uth
Gyle
Sout
h Gy
leSo
uth
Gyle
Sout
h Gy
le
Slat
efor
dSl
atef
ord
Slat
efor
dSl
atef
ord
Slat
efor
dSl
atef
ord
Slat
efor
dSl
atef
ord
Slat
efor
d
King
skno
we
King
skno
we
King
skno
we
King
skno
we
King
skno
we
King
skno
we
King
skno
we
King
skno
we
King
skno
we
Edin
burg
hEd
inbu
rgh
Edin
burg
hEd
inbu
rgh
Edin
burg
hEd
inbu
rgh
Edin
burg
hEd
inbu
rgh
Edin
burg
h
Gran
ton
Squa
reGr
anto
n Sq
uare
Gran
ton
Squa
reGr
anto
n Sq
uare
Gran
ton
Squa
reGr
anto
n Sq
uare
Gran
ton
Squa
reGr
anto
n Sq
uare
Gran
ton
Squa
re
St A
ndre
w S
quar
eSt
And
rew
Squ
are
St A
ndre
w S
quar
eSt
And
rew
Squ
are
St A
ndre
w S
quar
eSt
And
rew
Squ
are
St A
ndre
w S
quar
eSt
And
rew
Squ
are
St A
ndre
w S
quar
e
Pica
rdy
Plac
ePi
card
y Pl
ace
Pica
rdy
Plac
ePi
card
y Pl
ace
Pica
rdy
Plac
ePi
card
y Pl
ace
Pica
rdy
Plac
ePi
card
y Pl
ace
Pica
rdy
Plac
e
McD
onal
d Ro
adM
cDon
ald
Road
McD
onal
d Ro
adM
cDon
ald
Road
McD
onal
d Ro
adM
cDon
ald
Road
McD
onal
d Ro
adM
cDon
ald
Road
McD
onal
d Ro
ad
Balfo
ur S
treet
Balfo
ur S
treet
Balfo
ur S
treet
Balfo
ur S
treet
Balfo
ur S
treet
Balfo
ur S
treet
Balfo
ur S
treet
Balfo
ur S
treet
Balfo
ur S
treet
Foot
of t
he W
alk
Foot
of t
he W
alk
Foot
of t
he W
alk
Foot
of t
he W
alk
Foot
of t
he W
alk
Foot
of t
he W
alk
Foot
of t
he W
alk
Foot
of t
he W
alk
Foot
of t
he W
alk
Cons
titut
ion
Stre
etCo
nstit
utio
n St
reet
Cons
titut
ion
Stre
etCo
nstit
utio
n St
reet
Cons
titut
ion
Stre
etCo
nstit
utio
n St
reet
Cons
titut
ion
Stre
etCo
nstit
utio
n St
reet
Cons
titut
ion
Stre
et
Ocea
n Dr
ive
Ocea
n Dr
ive
Ocea
n Dr
ive
Ocea
n Dr
ive
Ocea
n Dr
ive
Ocea
n Dr
ive
Ocea
n Dr
ive
Ocea
n Dr
ive
Ocea
n Dr
ive
Edin
burg
h Pa
rkEd
inbu
rgh
Park
Edin
burg
h Pa
rkEd
inbu
rgh
Park
Edin
burg
h Pa
rkEd
inbu
rgh
Park
Edin
burg
h Pa
rkEd
inbu
rgh
Park
Edin
burg
h Pa
rk
Gyle
Gyle
Gyle
Gyle
Gyle
Gyle
Gyle
Gyle
Gyle
Edin
burg
h Ai
rpor
tEd
inbu
rgh
Airp
ort
Edin
burg
h Ai
rpor
tEd
inbu
rgh
Airp
ort
Edin
burg
h Ai
rpor
tEd
inbu
rgh
Airp
ort
Edin
burg
h Ai
rpor
tEd
inbu
rgh
Airp
ort
Edin
burg
h Ai
rpor
t
© © ©© ©© © ©©C
row
n C
op
yrig
ht R
eser
ved
Cro
wn
Co
pyr
ight
Res
erve
dC
row
n C
op
yrig
ht R
eser
ved
Cro
wn
Co
pyr
ight
Res
erve
dC
row
n C
op
yrig
ht R
eser
ved
Cro
wn
Co
pyr
ight
Res
erve
dC
row
n C
op
yrig
ht R
eser
ved
Cro
wn
Co
pyr
ight
Res
erve
dC
row
n C
op
yrig
ht R
eser
ved
Ord
nanc
e S
urve
yO
rdna
nce
Sur
vey
Ord
nanc
e S
urve
yO
rdna
nce
Sur
vey
Ord
nanc
e S
urve
yO
rdna
nce
Sur
vey
Ord
nanc
e S
urve
yO
rdna
nce
Sur
vey
Ord
nanc
e S
urve
y20
02 T
ele
Atla
s B
.v. '
s-H
erto
genb
osc
h. A
ll ri
ghts
res
erve
d.
2002
Tel
e A
tlas
B.v
. 's-
Her
toge
nbo
sch.
All
righ
ts r
eser
ved
.20
02 T
ele
Atla
s B
.v. '
s-H
erto
genb
osc
h. A
ll ri
ghts
res
erve
d.
2002
Tel
e A
tlas
B.v
. 's-
Her
toge
nbo
sch.
All
righ
ts r
eser
ved
.20
02 T
ele
Atla
s B
.v. '
s-H
erto
genb
osc
h. A
ll ri
ghts
res
erve
d.
2002
Tel
e A
tlas
B.v
. 's-
Her
toge
nbo
sch.
All
righ
ts r
eser
ved
.20
02 T
ele
Atla
s B
.v. '
s-H
erto
genb
osc
h. A
ll ri
ghts
res
erve
d.
2002
Tel
e A
tlas
B.v
. 's-
Her
toge
nbo
sch.
All
righ
ts r
eser
ved
.20
02 T
ele
Atla
s B
.v. '
s-H
erto
genb
osc
h. A
ll ri
ghts
res
erve
d.
2001
Cen
sus,
Out
put
Are
a B
oun
dar
ies.
2001
Cen
sus,
Out
put
Are
a B
oun
dar
ies.
2001
Cen
sus,
Out
put
Are
a B
oun
dar
ies.
2001
Cen
sus,
Out
put
Are
a B
oun
dar
ies.
2001
Cen
sus,
Out
put
Are
a B
oun
dar
ies.
2001
Cen
sus,
Out
put
Are
a B
oun
dar
ies.
2001
Cen
sus,
Out
put
Are
a B
oun
dar
ies.
2001
Cen
sus,
Out
put
Are
a B
oun
dar
ies.
2001
Cen
sus,
Out
put
Are
a B
oun
dar
ies.
Cro
wn
cop
yrig
ht m
ater
ial i
s re
pro
duc
ed
Cro
wn
cop
yrig
ht m
ater
ial i
s re
pro
duc
ed
Cro
wn
cop
yrig
ht m
ater
ial i
s re
pro
duc
ed
Cro
wn
cop
yrig
ht m
ater
ial i
s re
pro
duc
ed
Cro
wn
cop
yrig
ht m
ater
ial i
s re
pro
duc
ed
Cro
wn
cop
yrig
ht m
ater
ial i
s re
pro
duc
ed
Cro
wn
cop
yrig
ht m
ater
ial i
s re
pro
duc
ed
Cro
wn
cop
yrig
ht m
ater
ial i
s re
pro
duc
ed
Cro
wn
cop
yrig
ht m
ater
ial i
s re
pro
duc
ed
with
the
per
mis
sio
n o
f the
Co
ntro
ller
of H
MS
Ow
ith th
e p
erm
issi
on
of t
he C
ont
rolle
r o
f HM
SO
with
the
per
mis
sio
n o
f the
Co
ntro
ller
of H
MS
Ow
ith th
e p
erm
issi
on
of t
he C
ont
rolle
r o
f HM
SO
with
the
per
mis
sio
n o
f the
Co
ntro
ller
of H
MS
Ow
ith th
e p
erm
issi
on
of t
he C
ont
rolle
r o
f HM
SO
with
the
per
mis
sio
n o
f the
Co
ntro
ller
of H
MS
Ow
ith th
e p
erm
issi
on
of t
he C
ont
rolle
r o
f HM
SO
with
the
per
mis
sio
n o
f the
Co
ntro
ller
of H
MS
OS
cott
ish
Exe
cutiv
eS
cott
ish
Exe
cutiv
eS
cott
ish
Exe
cutiv
eS
cott
ish
Exe
cutiv
eS
cott
ish
Exe
cutiv
eS
cott
ish
Exe
cutiv
eS
cott
ish
Exe
cutiv
eS
cott
ish
Exe
cutiv
eS
cott
ish
Exe
cutiv
e stee
r da
vies
gle
ave
Edin
burg
h T
ram
STA
G 2
Appra
isal
Fig
ure
2.3
: 2
001 U
nem
plo
ym
ent
Rate
(base
d o
n t
hose
who s
aid
they w
ere
"unem
plo
yed"
in 2
001 C
ensu
s)
P:\
CG
G\G
IS\W
ork
\Pro
ject
s\69
00s\
6968
\Map
pin
g\M
apIn
fo\W
ork
spac
es\S
oci
oE
cono
mic
Ind
icat
ors
.wo
r
2001
Une
mp
loym
ent R
ate
So
urce
: 2
001
Cen
sus
at O
utp
ut A
rea
Leve
l
Ove
r 10
.0%
5.0%
to 1
0.0%
2.5%
to
5.0%
0.5%
to
2.5%
0 to
0.
5%
Ed
inb
urgh
Tra
m P
hase
1a
Ed
inb
urgh
Tra
m P
hase
1b

‡ ‡ ‡ ‡ ‡ ‡ ‡‡ ‡ ‡ ‡ ‡ ‡ ‡‡ ‡ ‡ ‡ ‡ ‡ ‡‡ ‡ ‡ ‡ ‡ ‡‡ ‡ ‡ ‡ ‡ ‡ ‡‡ ‡ ‡ ‡ ‡ ‡ ‡‡ ‡ ‡ ‡ ‡ ‡ ‡‡
è è è è è è èè è è è è è èè è è è è è èè è è è è èè è è è è è èè è è è è è èè è è è è è èè
è è è è è è èè è è è è è èè è è è è è èè è è è è èè è è è è è èè è è è è è èè è è è è è èèè è è è è è èè è è è è è èè è è è è è èè è è è è èè è è è è è èè è è è è è èè è è è è è èè
è è è è è è èè è è è è è èè è è è è è èè è è è è èè è è è è è èè è è è è è èè è è è è è èè
è è è è è è èè è è è è è èè è è è è è èè è è è è èè è è è è è èè è è è è è èè è è è è è èè
è è è è è è èè è è è è è èè è è è è è èè è è è è èè è è è è è èè è è è è è èè è è è è è èè
EDIN
BURG
H ED
INBU
RGH
EDIN
BURG
H ED
INBU
RGH
EDIN
BURG
H ED
INBU
RGH
EDIN
BURG
H ED
INBU
RGH
EDIN
BURG
H A
IRPO
RTA
IRPO
RTA
IRPO
RTA
IRPO
RTA
IRPO
RTA
IRPO
RTA
IRPO
RTA
IRPO
RTA
IRPO
RT
Sout
h Gy
leSo
uth
Gyle
Sout
h Gy
leSo
uth
Gyle
Sout
h Gy
leSo
uth
Gyle
Sout
h Gy
leSo
uth
Gyle
Sout
h Gy
leEd
inbu
rgh
Park
Sta
tion
Edin
burg
h Pa
rk S
tatio
nEd
inbu
rgh
Park
Sta
tion
Edin
burg
h Pa
rk S
tatio
nEd
inbu
rgh
Park
Sta
tion
Edin
burg
h Pa
rk S
tatio
nEd
inbu
rgh
Park
Sta
tion
Edin
burg
h Pa
rk S
tatio
nEd
inbu
rgh
Park
Sta
tion
Shan
dwic
k Pl
ace
Shan
dwic
k Pl
ace
Shan
dwic
k Pl
ace
Shan
dwic
k Pl
ace
Shan
dwic
k Pl
ace
Shan
dwic
k Pl
ace
Shan
dwic
k Pl
ace
Shan
dwic
k Pl
ace
Shan
dwic
k Pl
ace
Haym
arke
tHa
ymar
ket
Haym
arke
tHa
ymar
ket
Haym
arke
tHa
ymar
ket
Haym
arke
tHa
ymar
ket
Haym
arke
t
Mur
rayf
ield
Mur
rayf
ield
Mur
rayf
ield
Mur
rayf
ield
Mur
rayf
ield
Mur
rayf
ield
Mur
rayf
ield
Mur
rayf
ield
Mur
rayf
ield
Rose
burn
Rose
burn
Rose
burn
Rose
burn
Rose
burn
Rose
burn
Rose
burn
Rose
burn
Rose
burn
Ocea
n Te
rmin
alOc
ean
Term
inal
Ocea
n Te
rmin
alOc
ean
Term
inal
Ocea
n Te
rmin
alOc
ean
Term
inal
Ocea
n Te
rmin
alOc
ean
Term
inal
Ocea
n Te
rmin
al
Cons
titut
ion
Stre
etCo
nstit
utio
n St
reet
Cons
titut
ion
Stre
etCo
nstit
utio
n St
reet
Cons
titut
ion
Stre
etCo
nstit
utio
n St
reet
Cons
titut
ion
Stre
etCo
nstit
utio
n St
reet
Cons
titut
ion
Stre
et
St A
ndre
w S
quar
eSt
And
rew
Squ
are
St A
ndre
w S
quar
eSt
And
rew
Squ
are
St A
ndre
w S
quar
eSt
And
rew
Squ
are
St A
ndre
w S
quar
eSt
And
rew
Squ
are
St A
ndre
w S
quar
e
Prin
ces
Stre
etPr
ince
s St
reet
Prin
ces
Stre
etPr
ince
s St
reet
Prin
ces
Stre
etPr
ince
s St
reet
Prin
ces
Stre
etPr
ince
s St
reet
Prin
ces
Stre
et
New
have
nN
ewha
ven
New
have
nN
ewha
ven
New
have
nN
ewha
ven
New
have
nN
ewha
ven
New
have
n
Gran
ton
Wat
erfro
ntGr
anto
n W
ater
front
Gran
ton
Wat
erfro
ntGr
anto
n W
ater
front
Gran
ton
Wat
erfro
ntGr
anto
n W
ater
front
Gran
ton
Wat
erfro
ntGr
anto
n W
ater
front
Gran
ton
Wat
erfro
nt
Caro
line
Park
Caro
line
Park
Caro
line
Park
Caro
line
Park
Caro
line
Park
Caro
line
Park
Caro
line
Park
Caro
line
Park
Caro
line
Park
Wes
t Gra
nton
Wes
t Gra
nton
Wes
t Gra
nton
Wes
t Gra
nton
Wes
t Gra
nton
Wes
t Gra
nton
Wes
t Gra
nton
Wes
t Gra
nton
Wes
t Gra
nton
Crew
e To
llCr
ewe
Toll
Crew
e To
llCr
ewe
Toll
Crew
e To
llCr
ewe
Toll
Crew
e To
llCr
ewe
Toll
Crew
e To
ll
Telfo
rd R
oad
Telfo
rd R
oad
Telfo
rd R
oad
Telfo
rd R
oad
Telfo
rd R
oad
Telfo
rd R
oad
Telfo
rd R
oad
Telfo
rd R
oad
Telfo
rd R
oad
Crai
glei
thCr
aigl
eith
Crai
glei
thCr
aigl
eith
Crai
glei
thCr
aigl
eith
Crai
glei
thCr
aigl
eith
Crai
glei
th
Rave
lsto
n Dy
kes
Rave
lsto
n Dy
kes
Rave
lsto
n Dy
kes
Rave
lsto
n Dy
kes
Rave
lsto
n Dy
kes
Rave
lsto
n Dy
kes
Rave
lsto
n Dy
kes
Rave
lsto
n Dy
kes
Rave
lsto
n Dy
kes
Balg
reen
Balg
reen
Balg
reen
Balg
reen
Balg
reen
Balg
reen
Balg
reen
Balg
reen
Balg
reen
Saug
hton
Saug
hton
Saug
hton
Saug
hton
Saug
hton
Saug
hton
Saug
hton
Saug
hton
Saug
hton
Goga
rbur
nGo
garb
urn
Goga
rbur
nGo
garb
urn
Goga
rbur
nGo
garb
urn
Goga
rbur
nGo
garb
urn
Goga
rbur
n
Ingl
isto
n Pa
rk &
Rid
eIn
glis
ton
Park
& R
ide
Ingl
isto
n Pa
rk &
Rid
eIn
glis
ton
Park
& R
ide
Ingl
isto
n Pa
rk &
Rid
eIn
glis
ton
Park
& R
ide
Ingl
isto
n Pa
rk &
Rid
eIn
glis
ton
Park
& R
ide
Ingl
isto
n Pa
rk &
Rid
e
Sout
h Gy
leSo
uth
Gyle
Sout
h Gy
leSo
uth
Gyle
Sout
h Gy
leSo
uth
Gyle
Sout
h Gy
leSo
uth
Gyle
Sout
h Gy
le
Slat
efor
dSl
atef
ord
Slat
efor
dSl
atef
ord
Slat
efor
dSl
atef
ord
Slat
efor
dSl
atef
ord
Slat
efor
d
King
skno
we
King
skno
we
King
skno
we
King
skno
we
King
skno
we
King
skno
we
King
skno
we
King
skno
we
King
skno
we
Edin
burg
hEd
inbu
rgh
Edin
burg
hEd
inbu
rgh
Edin
burg
hEd
inbu
rgh
Edin
burg
hEd
inbu
rgh
Edin
burg
h
Gran
ton
Squa
reGr
anto
n Sq
uare
Gran
ton
Squa
reGr
anto
n Sq
uare
Gran
ton
Squa
reGr
anto
n Sq
uare
Gran
ton
Squa
reGr
anto
n Sq
uare
Gran
ton
Squa
re
St A
ndre
w S
quar
eSt
And
rew
Squ
are
St A
ndre
w S
quar
eSt
And
rew
Squ
are
St A
ndre
w S
quar
eSt
And
rew
Squ
are
St A
ndre
w S
quar
eSt
And
rew
Squ
are
St A
ndre
w S
quar
e
Pica
rdy
Plac
ePi
card
y Pl
ace
Pica
rdy
Plac
ePi
card
y Pl
ace
Pica
rdy
Plac
ePi
card
y Pl
ace
Pica
rdy
Plac
ePi
card
y Pl
ace
Pica
rdy
Plac
e
McD
onal
d Ro
adM
cDon
ald
Road
McD
onal
d Ro
adM
cDon
ald
Road
McD
onal
d Ro
adM
cDon
ald
Road
McD
onal
d Ro
adM
cDon
ald
Road
McD
onal
d Ro
ad
Balfo
ur S
treet
Balfo
ur S
treet
Balfo
ur S
treet
Balfo
ur S
treet
Balfo
ur S
treet
Balfo
ur S
treet
Balfo
ur S
treet
Balfo
ur S
treet
Balfo
ur S
treet
Foot
of t
he W
alk
Foot
of t
he W
alk
Foot
of t
he W
alk
Foot
of t
he W
alk
Foot
of t
he W
alk
Foot
of t
he W
alk
Foot
of t
he W
alk
Foot
of t
he W
alk
Foot
of t
he W
alk
Cons
titut
ion
Stre
etCo
nstit
utio
n St
reet
Cons
titut
ion
Stre
etCo
nstit
utio
n St
reet
Cons
titut
ion
Stre
etCo
nstit
utio
n St
reet
Cons
titut
ion
Stre
etCo
nstit
utio
n St
reet
Cons
titut
ion
Stre
et
Ocea
n Dr
ive
Ocea
n Dr
ive
Ocea
n Dr
ive
Ocea
n Dr
ive
Ocea
n Dr
ive
Ocea
n Dr
ive
Ocea
n Dr
ive
Ocea
n Dr
ive
Ocea
n Dr
ive
Edin
burg
h Pa
rkEd
inbu
rgh
Park
Edin
burg
h Pa
rkEd
inbu
rgh
Park
Edin
burg
h Pa
rkEd
inbu
rgh
Park
Edin
burg
h Pa
rkEd
inbu
rgh
Park
Edin
burg
h Pa
rk
Gyle
Gyle
Gyle
Gyle
Gyle
Gyle
Gyle
Gyle
Gyle
Edin
burg
h Ai
rpor
tEd
inbu
rgh
Airp
ort
Edin
burg
h Ai
rpor
tEd
inbu
rgh
Airp
ort
Edin
burg
h Ai
rpor
tEd
inbu
rgh
Airp
ort
Edin
burg
h Ai
rpor
tEd
inbu
rgh
Airp
ort
Edin
burg
h Ai
rpor
t
© © ©© ©© © ©©C
row
n C
op
yrig
ht R
eser
ved
Cro
wn
Co
pyr
ight
Res
erve
dC
row
n C
op
yrig
ht R
eser
ved
Cro
wn
Co
pyr
ight
Res
erve
dC
row
n C
op
yrig
ht R
eser
ved
Cro
wn
Co
pyr
ight
Res
erve
dC
row
n C
op
yrig
ht R
eser
ved
Cro
wn
Co
pyr
ight
Res
erve
dC
row
n C
op
yrig
ht R
eser
ved
Ord
nanc
e S
urve
yO
rdna
nce
Sur
vey
Ord
nanc
e S
urve
yO
rdna
nce
Sur
vey
Ord
nanc
e S
urve
yO
rdna
nce
Sur
vey
Ord
nanc
e S
urve
yO
rdna
nce
Sur
vey
Ord
nanc
e S
urve
y20
02 T
ele
Atla
s B
.v. '
s-H
erto
genb
osc
h. A
ll ri
ghts
res
erve
d.
2002
Tel
e A
tlas
B.v
. 's-
Her
toge
nbo
sch.
All
righ
ts r
eser
ved
.20
02 T
ele
Atla
s B
.v. '
s-H
erto
genb
osc
h. A
ll ri
ghts
res
erve
d.
2002
Tel
e A
tlas
B.v
. 's-
Her
toge
nbo
sch.
All
righ
ts r
eser
ved
.20
02 T
ele
Atla
s B
.v. '
s-H
erto
genb
osc
h. A
ll ri
ghts
res
erve
d.
2002
Tel
e A
tlas
B.v
. 's-
Her
toge
nbo
sch.
All
righ
ts r
eser
ved
.20
02 T
ele
Atla
s B
.v. '
s-H
erto
genb
osc
h. A
ll ri
ghts
res
erve
d.
2002
Tel
e A
tlas
B.v
. 's-
Her
toge
nbo
sch.
All
righ
ts r
eser
ved
.20
02 T
ele
Atla
s B
.v. '
s-H
erto
genb
osc
h. A
ll ri
ghts
res
erve
d.
2001
Cen
sus,
Out
put
Are
a B
oun
dar
ies.
2001
Cen
sus,
Out
put
Are
a B
oun
dar
ies.
2001
Cen
sus,
Out
put
Are
a B
oun
dar
ies.
2001
Cen
sus,
Out
put
Are
a B
oun
dar
ies.
2001
Cen
sus,
Out
put
Are
a B
oun
dar
ies.
2001
Cen
sus,
Out
put
Are
a B
oun
dar
ies.
2001
Cen
sus,
Out
put
Are
a B
oun
dar
ies.
2001
Cen
sus,
Out
put
Are
a B
oun
dar
ies.
2001
Cen
sus,
Out
put
Are
a B
oun
dar
ies.
Cro
wn
cop
yrig
ht m
ater
ial i
s re
pro
duc
ed
Cro
wn
cop
yrig
ht m
ater
ial i
s re
pro
duc
ed
Cro
wn
cop
yrig
ht m
ater
ial i
s re
pro
duc
ed
Cro
wn
cop
yrig
ht m
ater
ial i
s re
pro
duc
ed
Cro
wn
cop
yrig
ht m
ater
ial i
s re
pro
duc
ed
Cro
wn
cop
yrig
ht m
ater
ial i
s re
pro
duc
ed
Cro
wn
cop
yrig
ht m
ater
ial i
s re
pro
duc
ed
Cro
wn
cop
yrig
ht m
ater
ial i
s re
pro
duc
ed
Cro
wn
cop
yrig
ht m
ater
ial i
s re
pro
duc
ed
with
the
per
mis
sio
n o
f the
Co
ntro
ller
of H
MS
Ow
ith th
e p
erm
issi
on
of t
he C
ont
rolle
r o
f HM
SO
with
the
per
mis
sio
n o
f the
Co
ntro
ller
of H
MS
Ow
ith th
e p
erm
issi
on
of t
he C
ont
rolle
r o
f HM
SO
with
the
per
mis
sio
n o
f the
Co
ntro
ller
of H
MS
Ow
ith th
e p
erm
issi
on
of t
he C
ont
rolle
r o
f HM
SO
with
the
per
mis
sio
n o
f the
Co
ntro
ller
of H
MS
Ow
ith th
e p
erm
issi
on
of t
he C
ont
rolle
r o
f HM
SO
with
the
per
mis
sio
n o
f the
Co
ntro
ller
of H
MS
OS
cott
ish
Exe
cutiv
eS
cott
ish
Exe
cutiv
eS
cott
ish
Exe
cutiv
eS
cott
ish
Exe
cutiv
eS
cott
ish
Exe
cutiv
eS
cott
ish
Exe
cutiv
eS
cott
ish
Exe
cutiv
eS
cott
ish
Exe
cutiv
eS
cott
ish
Exe
cutiv
e stee
r da
vies
gle
ave
Edin
burg
h T
ram
STA
G 2
Appra
isal
Fig
ure
2.4
: 2
004 I
ncom
e D
epri
vati
on D
om
ain
Rankin
g
P:\
CG
G\G
IS\W
ork
\Pro
ject
s\69
00s\
6968
\Map
pin
g\M
apIn
fo\W
ork
spac
es\S
oci
oE
cono
mic
Ind
icat
ors
.wo
r
2004
Inco
me
Dep
riva
tion
Do
mai
n R
anki
ngS
our
ce:
Sco
ttis
h E
xecu
tive
at S
uper
Out
put
Are
a Le
vel
0.1%
to 5
% le
ast i
nco
me
5% to
10%
dep
rive
d10
% to
20%
dep
rive
d20
% to
30%
dep
rive
d30
% to
40%
dep
rive
d40
% to
50%
dep
rive
d50
% to
100
% m
ost
inco
me
Ed
inb
urgh
Tra
m P
hase
1a
Ed
inb
urgh
Tra
m P
hase
1b
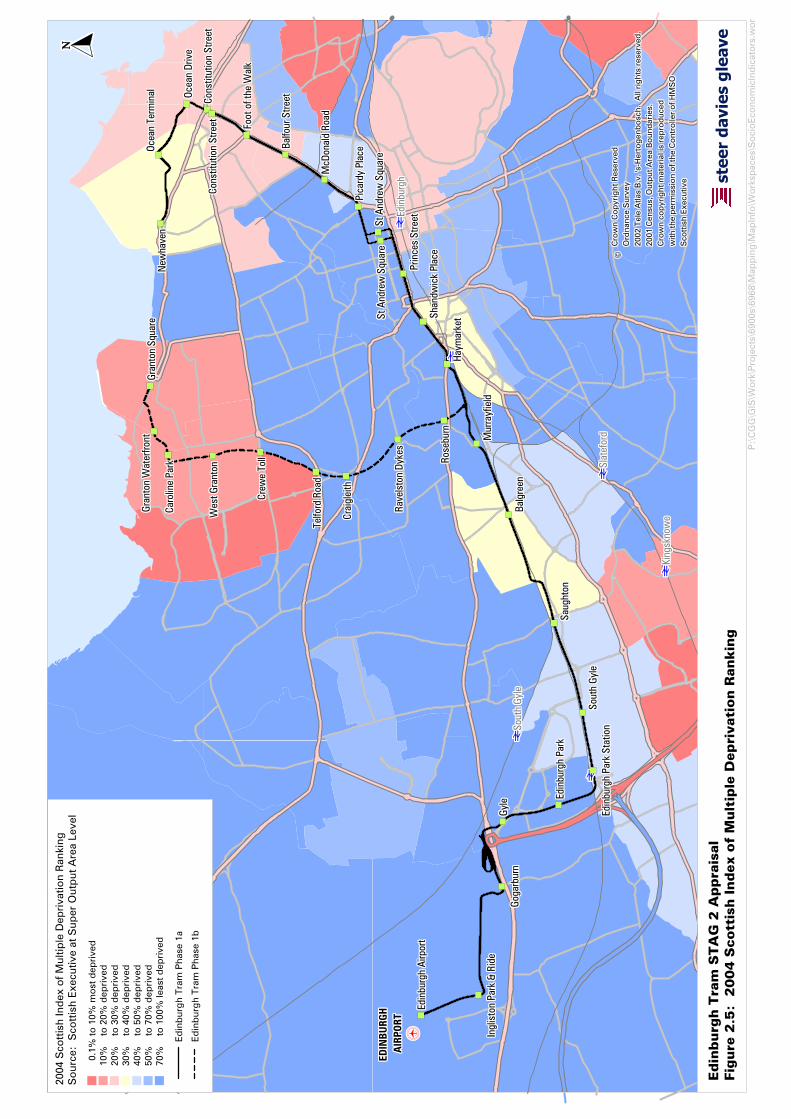
‡ ‡ ‡ ‡ ‡ ‡ ‡‡ ‡ ‡ ‡ ‡ ‡ ‡‡ ‡ ‡ ‡ ‡ ‡ ‡‡ ‡ ‡ ‡ ‡ ‡‡ ‡ ‡ ‡ ‡ ‡ ‡‡ ‡ ‡ ‡ ‡ ‡ ‡‡ ‡ ‡ ‡ ‡ ‡ ‡‡
è è è è è è èè è è è è è èè è è è è è èè è è è è èè è è è è è èè è è è è è èè è è è è è èè
è è è è è è èè è è è è è èè è è è è è èè è è è è èè è è è è è èè è è è è è èè è è è è è èèè è è è è è èè è è è è è èè è è è è è èè è è è è èè è è è è è èè è è è è è èè è è è è è èè
è è è è è è èè è è è è è èè è è è è è èè è è è è èè è è è è è èè è è è è è èè è è è è è èè
è è è è è è èè è è è è è èè è è è è è èè è è è è èè è è è è è èè è è è è è èè è è è è è èè
è è è è è è èè è è è è è èè è è è è è èè è è è è èè è è è è è èè è è è è è èè è è è è è èè
EDIN
BURG
H ED
INBU
RGH
EDIN
BURG
H ED
INBU
RGH
EDIN
BURG
H ED
INBU
RGH
EDIN
BURG
H ED
INBU
RGH
EDIN
BURG
H A
IRPO
RTA
IRPO
RTA
IRPO
RTA
IRPO
RTA
IRPO
RTA
IRPO
RTA
IRPO
RTA
IRPO
RTA
IRPO
RT
Sout
h Gy
leSo
uth
Gyle
Sout
h Gy
leSo
uth
Gyle
Sout
h Gy
leSo
uth
Gyle
Sout
h Gy
leSo
uth
Gyle
Sout
h Gy
leEd
inbu
rgh
Park
Sta
tion
Edin
burg
h Pa
rk S
tatio
nEd
inbu
rgh
Park
Sta
tion
Edin
burg
h Pa
rk S
tatio
nEd
inbu
rgh
Park
Sta
tion
Edin
burg
h Pa
rk S
tatio
nEd
inbu
rgh
Park
Sta
tion
Edin
burg
h Pa
rk S
tatio
nEd
inbu
rgh
Park
Sta
tion
Shan
dwic
k Pl
ace
Shan
dwic
k Pl
ace
Shan
dwic
k Pl
ace
Shan
dwic
k Pl
ace
Shan
dwic
k Pl
ace
Shan
dwic
k Pl
ace
Shan
dwic
k Pl
ace
Shan
dwic
k Pl
ace
Shan
dwic
k Pl
ace
Haym
arke
tHa
ymar
ket
Haym
arke
tHa
ymar
ket
Haym
arke
tHa
ymar
ket
Haym
arke
tHa
ymar
ket
Haym
arke
t
Mur
rayf
ield
Mur
rayf
ield
Mur
rayf
ield
Mur
rayf
ield
Mur
rayf
ield
Mur
rayf
ield
Mur
rayf
ield
Mur
rayf
ield
Mur
rayf
ield
Rose
burn
Rose
burn
Rose
burn
Rose
burn
Rose
burn
Rose
burn
Rose
burn
Rose
burn
Rose
burn
Ocea
n Te
rmin
alOc
ean
Term
inal
Ocea
n Te
rmin
alOc
ean
Term
inal
Ocea
n Te
rmin
alOc
ean
Term
inal
Ocea
n Te
rmin
alOc
ean
Term
inal
Ocea
n Te
rmin
al
Cons
titut
ion
Stre
etCo
nstit
utio
n St
reet
Cons
titut
ion
Stre
etCo
nstit
utio
n St
reet
Cons
titut
ion
Stre
etCo
nstit
utio
n St
reet
Cons
titut
ion
Stre
etCo
nstit
utio
n St
reet
Cons
titut
ion
Stre
et
St A
ndre
w S
quar
eSt
And
rew
Squ
are
St A
ndre
w S
quar
eSt
And
rew
Squ
are
St A
ndre
w S
quar
eSt
And
rew
Squ
are
St A
ndre
w S
quar
eSt
And
rew
Squ
are
St A
ndre
w S
quar
e
Prin
ces
Stre
etPr
ince
s St
reet
Prin
ces
Stre
etPr
ince
s St
reet
Prin
ces
Stre
etPr
ince
s St
reet
Prin
ces
Stre
etPr
ince
s St
reet
Prin
ces
Stre
et
New
have
nN
ewha
ven
New
have
nN
ewha
ven
New
have
nN
ewha
ven
New
have
nN
ewha
ven
New
have
n
Gran
ton
Wat
erfro
ntGr
anto
n W
ater
front
Gran
ton
Wat
erfro
ntGr
anto
n W
ater
front
Gran
ton
Wat
erfro
ntGr
anto
n W
ater
front
Gran
ton
Wat
erfro
ntGr
anto
n W
ater
front
Gran
ton
Wat
erfro
nt
Caro
line
Park
Caro
line
Park
Caro
line
Park
Caro
line
Park
Caro
line
Park
Caro
line
Park
Caro
line
Park
Caro
line
Park
Caro
line
Park
Wes
t Gra
nton
Wes
t Gra
nton
Wes
t Gra
nton
Wes
t Gra
nton
Wes
t Gra
nton
Wes
t Gra
nton
Wes
t Gra
nton
Wes
t Gra
nton
Wes
t Gra
nton
Crew
e To
llCr
ewe
Toll
Crew
e To
llCr
ewe
Toll
Crew
e To
llCr
ewe
Toll
Crew
e To
llCr
ewe
Toll
Crew
e To
ll
Telfo
rd R
oad
Telfo
rd R
oad
Telfo
rd R
oad
Telfo
rd R
oad
Telfo
rd R
oad
Telfo
rd R
oad
Telfo
rd R
oad
Telfo
rd R
oad
Telfo
rd R
oad
Crai
glei
thCr
aigl
eith
Crai
glei
thCr
aigl
eith
Crai
glei
thCr
aigl
eith
Crai
glei
thCr
aigl
eith
Crai
glei
th
Rave
lsto
n Dy
kes
Rave
lsto
n Dy
kes
Rave
lsto
n Dy
kes
Rave
lsto
n Dy
kes
Rave
lsto
n Dy
kes
Rave
lsto
n Dy
kes
Rave
lsto
n Dy
kes
Rave
lsto
n Dy
kes
Rave
lsto
n Dy
kes
Balg
reen
Balg
reen
Balg
reen
Balg
reen
Balg
reen
Balg
reen
Balg
reen
Balg
reen
Balg
reen
Saug
hton
Saug
hton
Saug
hton
Saug
hton
Saug
hton
Saug
hton
Saug
hton
Saug
hton
Saug
hton
Goga
rbur
nGo
garb
urn
Goga
rbur
nGo
garb
urn
Goga
rbur
nGo
garb
urn
Goga
rbur
nGo
garb
urn
Goga
rbur
n
Ingl
isto
n Pa
rk &
Rid
eIn
glis
ton
Park
& R
ide
Ingl
isto
n Pa
rk &
Rid
eIn
glis
ton
Park
& R
ide
Ingl
isto
n Pa
rk &
Rid
eIn
glis
ton
Park
& R
ide
Ingl
isto
n Pa
rk &
Rid
eIn
glis
ton
Park
& R
ide
Ingl
isto
n Pa
rk &
Rid
e
Sout
h Gy
leSo
uth
Gyle
Sout
h Gy
leSo
uth
Gyle
Sout
h Gy
leSo
uth
Gyle
Sout
h Gy
leSo
uth
Gyle
Sout
h Gy
le
Slat
efor
dSl
atef
ord
Slat
efor
dSl
atef
ord
Slat
efor
dSl
atef
ord
Slat
efor
dSl
atef
ord
Slat
efor
d
King
skno
we
King
skno
we
King
skno
we
King
skno
we
King
skno
we
King
skno
we
King
skno
we
King
skno
we
King
skno
we
Edin
burg
hEd
inbu
rgh
Edin
burg
hEd
inbu
rgh
Edin
burg
hEd
inbu
rgh
Edin
burg
hEd
inbu
rgh
Edin
burg
h
Gran
ton
Squa
reGr
anto
n Sq
uare
Gran
ton
Squa
reGr
anto
n Sq
uare
Gran
ton
Squa
reGr
anto
n Sq
uare
Gran
ton
Squa
reGr
anto
n Sq
uare
Gran
ton
Squa
re
St A
ndre
w S
quar
eSt
And
rew
Squ
are
St A
ndre
w S
quar
eSt
And
rew
Squ
are
St A
ndre
w S
quar
eSt
And
rew
Squ
are
St A
ndre
w S
quar
eSt
And
rew
Squ
are
St A
ndre
w S
quar
e
Pica
rdy
Plac
ePi
card
y Pl
ace
Pica
rdy
Plac
ePi
card
y Pl
ace
Pica
rdy
Plac
ePi
card
y Pl
ace
Pica
rdy
Plac
ePi
card
y Pl
ace
Pica
rdy
Plac
e
McD
onal
d Ro
adM
cDon
ald
Road
McD
onal
d Ro
adM
cDon
ald
Road
McD
onal
d Ro
adM
cDon
ald
Road
McD
onal
d Ro
adM
cDon
ald
Road
McD
onal
d Ro
ad
Balfo
ur S
treet
Balfo
ur S
treet
Balfo
ur S
treet
Balfo
ur S
treet
Balfo
ur S
treet
Balfo
ur S
treet
Balfo
ur S
treet
Balfo
ur S
treet
Balfo
ur S
treet
Foot
of t
he W
alk
Foot
of t
he W
alk
Foot
of t
he W
alk
Foot
of t
he W
alk
Foot
of t
he W
alk
Foot
of t
he W
alk
Foot
of t
he W
alk
Foot
of t
he W
alk
Foot
of t
he W
alk
Cons
titut
ion
Stre
etCo
nstit
utio
n St
reet
Cons
titut
ion
Stre
etCo
nstit
utio
n St
reet
Cons
titut
ion
Stre
etCo
nstit
utio
n St
reet
Cons
titut
ion
Stre
etCo
nstit
utio
n St
reet
Cons
titut
ion
Stre
et
Ocea
n Dr
ive
Ocea
n Dr
ive
Ocea
n Dr
ive
Ocea
n Dr
ive
Ocea
n Dr
ive
Ocea
n Dr
ive
Ocea
n Dr
ive
Ocea
n Dr
ive
Ocea
n Dr
ive
Edin
burg
h Pa
rkEd
inbu
rgh
Park
Edin
burg
h Pa
rkEd
inbu
rgh
Park
Edin
burg
h Pa
rkEd
inbu
rgh
Park
Edin
burg
h Pa
rkEd
inbu
rgh
Park
Edin
burg
h Pa
rk
Gyle
Gyle
Gyle
Gyle
Gyle
Gyle
Gyle
Gyle
Gyle
Edin
burg
h Ai
rpor
tEd
inbu
rgh
Airp
ort
Edin
burg
h Ai
rpor
tEd
inbu
rgh
Airp
ort
Edin
burg
h Ai
rpor
tEd
inbu
rgh
Airp
ort
Edin
burg
h Ai
rpor
tEd
inbu
rgh
Airp
ort
Edin
burg
h Ai
rpor
t
© © ©© ©© © ©©C
row
n C
op
yrig
ht R
eser
ved
Cro
wn
Co
pyr
ight
Res
erve
dC
row
n C
op
yrig
ht R
eser
ved
Cro
wn
Co
pyr
ight
Res
erve
dC
row
n C
op
yrig
ht R
eser
ved
Cro
wn
Co
pyr
ight
Res
erve
dC
row
n C
op
yrig
ht R
eser
ved
Cro
wn
Co
pyr
ight
Res
erve
dC
row
n C
op
yrig
ht R
eser
ved
Ord
nanc
e S
urve
yO
rdna
nce
Sur
vey
Ord
nanc
e S
urve
yO
rdna
nce
Sur
vey
Ord
nanc
e S
urve
yO
rdna
nce
Sur
vey
Ord
nanc
e S
urve
yO
rdna
nce
Sur
vey
Ord
nanc
e S
urve
y20
02 T
ele
Atla
s B
.v. '
s-H
erto
genb
osc
h. A
ll ri
ghts
res
erve
d.
2002
Tel
e A
tlas
B.v
. 's-
Her
toge
nbo
sch.
All
righ
ts r
eser
ved
.20
02 T
ele
Atla
s B
.v. '
s-H
erto
genb
osc
h. A
ll ri
ghts
res
erve
d.
2002
Tel
e A
tlas
B.v
. 's-
Her
toge
nbo
sch.
All
righ
ts r
eser
ved
.20
02 T
ele
Atla
s B
.v. '
s-H
erto
genb
osc
h. A
ll ri
ghts
res
erve
d.
2002
Tel
e A
tlas
B.v
. 's-
Her
toge
nbo
sch.
All
righ
ts r
eser
ved
.20
02 T
ele
Atla
s B
.v. '
s-H
erto
genb
osc
h. A
ll ri
ghts
res
erve
d.
2002
Tel
e A
tlas
B.v
. 's-
Her
toge
nbo
sch.
All
righ
ts r
eser
ved
.20
02 T
ele
Atla
s B
.v. '
s-H
erto
genb
osc
h. A
ll ri
ghts
res
erve
d.
2001
Cen
sus,
Out
put
Are
a B
oun
dar
ies.
2001
Cen
sus,
Out
put
Are
a B
oun
dar
ies.
2001
Cen
sus,
Out
put
Are
a B
oun
dar
ies.
2001
Cen
sus,
Out
put
Are
a B
oun
dar
ies.
2001
Cen
sus,
Out
put
Are
a B
oun
dar
ies.
2001
Cen
sus,
Out
put
Are
a B
oun
dar
ies.
2001
Cen
sus,
Out
put
Are
a B
oun
dar
ies.
2001
Cen
sus,
Out
put
Are
a B
oun
dar
ies.
2001
Cen
sus,
Out
put
Are
a B
oun
dar
ies.
Cro
wn
cop
yrig
ht m
ater
ial i
s re
pro
duc
ed
Cro
wn
cop
yrig
ht m
ater
ial i
s re
pro
duc
ed
Cro
wn
cop
yrig
ht m
ater
ial i
s re
pro
duc
ed
Cro
wn
cop
yrig
ht m
ater
ial i
s re
pro
duc
ed
Cro
wn
cop
yrig
ht m
ater
ial i
s re
pro
duc
ed
Cro
wn
cop
yrig
ht m
ater
ial i
s re
pro
duc
ed
Cro
wn
cop
yrig
ht m
ater
ial i
s re
pro
duc
ed
Cro
wn
cop
yrig
ht m
ater
ial i
s re
pro
duc
ed
Cro
wn
cop
yrig
ht m
ater
ial i
s re
pro
duc
ed
with
the
per
mis
sio
n o
f the
Co
ntro
ller
of H
MS
Ow
ith th
e p
erm
issi
on
of t
he C
ont
rolle
r o
f HM
SO
with
the
per
mis
sio
n o
f the
Co
ntro
ller
of H
MS
Ow
ith th
e p
erm
issi
on
of t
he C
ont
rolle
r o
f HM
SO
with
the
per
mis
sio
n o
f the
Co
ntro
ller
of H
MS
Ow
ith th
e p
erm
issi
on
of t
he C
ont
rolle
r o
f HM
SO
with
the
per
mis
sio
n o
f the
Co
ntro
ller
of H
MS
Ow
ith th
e p
erm
issi
on
of t
he C
ont
rolle
r o
f HM
SO
with
the
per
mis
sio
n o
f the
Co
ntro
ller
of H
MS
OS
cott
ish
Exe
cutiv
eS
cott
ish
Exe
cutiv
eS
cott
ish
Exe
cutiv
eS
cott
ish
Exe
cutiv
eS
cott
ish
Exe
cutiv
eS
cott
ish
Exe
cutiv
eS
cott
ish
Exe
cutiv
eS
cott
ish
Exe
cutiv
eS
cott
ish
Exe
cutiv
e stee
r da
vies
gle
ave
Edin
burg
h T
ram
STA
G 2
Appra
isal
Fig
ure
2.5
: 2
004 S
cott
ish I
ndex o
f M
ult
iple
Depri
vati
on R
ankin
g
P:\
CG
G\G
IS\W
ork
\Pro
ject
s\69
00s\
6968
\Map
pin
g\M
apIn
fo\W
ork
spac
es\S
oci
oE
cono
mic
Ind
icat
ors
.wo
r
2004
Sco
ttis
h In
dex
of M
ultip
le D
epri
vatio
n R
anki
ngS
our
ce:
Sco
ttis
h E
xecu
tive
at S
uper
Out
put
Are
a Le
vel
0.1%
to 1
0% m
ost
dep
rive
d10
% to
20%
dep
rive
d20
% to
30%
dep
rive
d30
% to
40%
dep
rive
d40
% to
50%
dep
rive
d50
% to
70%
dep
rive
d70
% to
100
% le
ast d
epri
ved
Ed
inb
urgh
Tra
m P
hase
1a
Ed
inb
urgh
Tra
m P
hase
1b

‡ ‡ ‡ ‡ ‡ ‡ ‡‡ ‡ ‡ ‡ ‡ ‡ ‡‡ ‡ ‡ ‡ ‡ ‡ ‡‡ ‡ ‡ ‡ ‡ ‡‡ ‡ ‡ ‡ ‡ ‡ ‡‡ ‡ ‡ ‡ ‡ ‡ ‡‡ ‡ ‡ ‡ ‡ ‡ ‡‡
è è è è è è èè è è è è è èè è è è è è èè è è è è èè è è è è è èè è è è è è èè è è è è è èè
è è è è è è èè è è è è è èè è è è è è èè è è è è èè è è è è è èè è è è è è èè è è è è è èèè è è è è è èè è è è è è èè è è è è è èè è è è è èè è è è è è èè è è è è è èè è è è è è èè
è è è è è è èè è è è è è èè è è è è è èè è è è è èè è è è è è èè è è è è è èè è è è è è èè
è è è è è è èè è è è è è èè è è è è è èè è è è è èè è è è è è èè è è è è è èè è è è è è èè
è è è è è è èè è è è è è èè è è è è è èè è è è è èè è è è è è èè è è è è è èè è è è è è èè
EDIN
BURG
H ED
INBU
RGH
EDIN
BURG
H ED
INBU
RGH
EDIN
BURG
H ED
INBU
RGH
EDIN
BURG
H ED
INBU
RGH
EDIN
BURG
H A
IRPO
RTA
IRPO
RTA
IRPO
RTA
IRPO
RTA
IRPO
RTA
IRPO
RTA
IRPO
RTA
IRPO
RTA
IRPO
RT
Sout
h Gy
leSo
uth
Gyle
Sout
h Gy
leSo
uth
Gyle
Sout
h Gy
leSo
uth
Gyle
Sout
h Gy
leSo
uth
Gyle
Sout
h Gy
leEd
inbu
rgh
Park
Sta
tion
Edin
burg
h Pa
rk S
tatio
nEd
inbu
rgh
Park
Sta
tion
Edin
burg
h Pa
rk S
tatio
nEd
inbu
rgh
Park
Sta
tion
Edin
burg
h Pa
rk S
tatio
nEd
inbu
rgh
Park
Sta
tion
Edin
burg
h Pa
rk S
tatio
nEd
inbu
rgh
Park
Sta
tion
Shan
dwic
k Pl
ace
Shan
dwic
k Pl
ace
Shan
dwic
k Pl
ace
Shan
dwic
k Pl
ace
Shan
dwic
k Pl
ace
Shan
dwic
k Pl
ace
Shan
dwic
k Pl
ace
Shan
dwic
k Pl
ace
Shan
dwic
k Pl
ace
Haym
arke
tHa
ymar
ket
Haym
arke
tHa
ymar
ket
Haym
arke
tHa
ymar
ket
Haym
arke
tHa
ymar
ket
Haym
arke
t
Mur
rayf
ield
Mur
rayf
ield
Mur
rayf
ield
Mur
rayf
ield
Mur
rayf
ield
Mur
rayf
ield
Mur
rayf
ield
Mur
rayf
ield
Mur
rayf
ield
Rose
burn
Rose
burn
Rose
burn
Rose
burn
Rose
burn
Rose
burn
Rose
burn
Rose
burn
Rose
burn
Ocea
n Te
rmin
alOc
ean
Term
inal
Ocea
n Te
rmin
alOc
ean
Term
inal
Ocea
n Te
rmin
alOc
ean
Term
inal
Ocea
n Te
rmin
alOc
ean
Term
inal
Ocea
n Te
rmin
al
Cons
titut
ion
Stre
etCo
nstit
utio
n St
reet
Cons
titut
ion
Stre
etCo
nstit
utio
n St
reet
Cons
titut
ion
Stre
etCo
nstit
utio
n St
reet
Cons
titut
ion
Stre
etCo
nstit
utio
n St
reet
Cons
titut
ion
Stre
et
St A
ndre
w S
quar
eSt
And
rew
Squ
are
St A
ndre
w S
quar
eSt
And
rew
Squ
are
St A
ndre
w S
quar
eSt
And
rew
Squ
are
St A
ndre
w S
quar
eSt
And
rew
Squ
are
St A
ndre
w S
quar
e
Prin
ces
Stre
etPr
ince
s St
reet
Prin
ces
Stre
etPr
ince
s St
reet
Prin
ces
Stre
etPr
ince
s St
reet
Prin
ces
Stre
etPr
ince
s St
reet
Prin
ces
Stre
et
New
have
nN
ewha
ven
New
have
nN
ewha
ven
New
have
nN
ewha
ven
New
have
nN
ewha
ven
New
have
n
Gran
ton
Wat
erfro
ntGr
anto
n W
ater
front
Gran
ton
Wat
erfro
ntGr
anto
n W
ater
front
Gran
ton
Wat
erfro
ntGr
anto
n W
ater
front
Gran
ton
Wat
erfro
ntGr
anto
n W
ater
front
Gran
ton
Wat
erfro
nt
Caro
line
Park
Caro
line
Park
Caro
line
Park
Caro
line
Park
Caro
line
Park
Caro
line
Park
Caro
line
Park
Caro
line
Park
Caro
line
Park
Wes
t Gra
nton
Wes
t Gra
nton
Wes
t Gra
nton
Wes
t Gra
nton
Wes
t Gra
nton
Wes
t Gra
nton
Wes
t Gra
nton
Wes
t Gra
nton
Wes
t Gra
nton
Crew
e To
llCr
ewe
Toll
Crew
e To
llCr
ewe
Toll
Crew
e To
llCr
ewe
Toll
Crew
e To
llCr
ewe
Toll
Crew
e To
ll
Telfo
rd R
oad
Telfo
rd R
oad
Telfo
rd R
oad
Telfo
rd R
oad
Telfo
rd R
oad
Telfo
rd R
oad
Telfo
rd R
oad
Telfo
rd R
oad
Telfo
rd R
oad
Crai
glei
thCr
aigl
eith
Crai
glei
thCr
aigl
eith
Crai
glei
thCr
aigl
eith
Crai
glei
thCr
aigl
eith
Crai
glei
th
Rave
lsto
n Dy
kes
Rave
lsto
n Dy
kes
Rave
lsto
n Dy
kes
Rave
lsto
n Dy
kes
Rave
lsto
n Dy
kes
Rave
lsto
n Dy
kes
Rave
lsto
n Dy
kes
Rave
lsto
n Dy
kes
Rave
lsto
n Dy
kes
Balg
reen
Balg
reen
Balg
reen
Balg
reen
Balg
reen
Balg
reen
Balg
reen
Balg
reen
Balg
reen
Saug
hton
Saug
hton
Saug
hton
Saug
hton
Saug
hton
Saug
hton
Saug
hton
Saug
hton
Saug
hton
Goga
rbur
nGo
garb
urn
Goga
rbur
nGo
garb
urn
Goga
rbur
nGo
garb
urn
Goga
rbur
nGo
garb
urn
Goga
rbur
n
Ingl
isto
n Pa
rk &
Rid
eIn
glis
ton
Park
& R
ide
Ingl
isto
n Pa
rk &
Rid
eIn
glis
ton
Park
& R
ide
Ingl
isto
n Pa
rk &
Rid
eIn
glis
ton
Park
& R
ide
Ingl
isto
n Pa
rk &
Rid
eIn
glis
ton
Park
& R
ide
Ingl
isto
n Pa
rk &
Rid
e
Sout
h Gy
leSo
uth
Gyle
Sout
h Gy
leSo
uth
Gyle
Sout
h Gy
leSo
uth
Gyle
Sout
h Gy
leSo
uth
Gyle
Sout
h Gy
le
Slat
efor
dSl
atef
ord
Slat
efor
dSl
atef
ord
Slat
efor
dSl
atef
ord
Slat
efor
dSl
atef
ord
Slat
efor
d
King
skno
we
King
skno
we
King
skno
we
King
skno
we
King
skno
we
King
skno
we
King
skno
we
King
skno
we
King
skno
we
Edin
burg
hEd
inbu
rgh
Edin
burg
hEd
inbu
rgh
Edin
burg
hEd
inbu
rgh
Edin
burg
hEd
inbu
rgh
Edin
burg
h
Gran
ton
Squa
reGr
anto
n Sq
uare
Gran
ton
Squa
reGr
anto
n Sq
uare
Gran
ton
Squa
reGr
anto
n Sq
uare
Gran
ton
Squa
reGr
anto
n Sq
uare
Gran
ton
Squa
re
St A
ndre
w S
quar
eSt
And
rew
Squ
are
St A
ndre
w S
quar
eSt
And
rew
Squ
are
St A
ndre
w S
quar
eSt
And
rew
Squ
are
St A
ndre
w S
quar
eSt
And
rew
Squ
are
St A
ndre
w S
quar
e
Pica
rdy
Plac
ePi
card
y Pl
ace
Pica
rdy
Plac
ePi
card
y Pl
ace
Pica
rdy
Plac
ePi
card
y Pl
ace
Pica
rdy
Plac
ePi
card
y Pl
ace
Pica
rdy
Plac
e
McD
onal
d Ro
adM
cDon
ald
Road
McD
onal
d Ro
adM
cDon
ald
Road
McD
onal
d Ro
adM
cDon
ald
Road
McD
onal
d Ro
adM
cDon
ald
Road
McD
onal
d Ro
ad
Balfo
ur S
treet
Balfo
ur S
treet
Balfo
ur S
treet
Balfo
ur S
treet
Balfo
ur S
treet
Balfo
ur S
treet
Balfo
ur S
treet
Balfo
ur S
treet
Balfo
ur S
treet
Foot
of t
he W
alk
Foot
of t
he W
alk
Foot
of t
he W
alk
Foot
of t
he W
alk
Foot
of t
he W
alk
Foot
of t
he W
alk
Foot
of t
he W
alk
Foot
of t
he W
alk
Foot
of t
he W
alk
Cons
titut
ion
Stre
etCo
nstit
utio
n St
reet
Cons
titut
ion
Stre
etCo
nstit
utio
n St
reet
Cons
titut
ion
Stre
etCo
nstit
utio
n St
reet
Cons
titut
ion
Stre
etCo
nstit
utio
n St
reet
Cons
titut
ion
Stre
et
Ocea
n Dr
ive
Ocea
n Dr
ive
Ocea
n Dr
ive
Ocea
n Dr
ive
Ocea
n Dr
ive
Ocea
n Dr
ive
Ocea
n Dr
ive
Ocea
n Dr
ive
Ocea
n Dr
ive
Edin
burg
h Pa
rkEd
inbu
rgh
Park
Edin
burg
h Pa
rkEd
inbu
rgh
Park
Edin
burg
h Pa
rkEd
inbu
rgh
Park
Edin
burg
h Pa
rkEd
inbu
rgh
Park
Edin
burg
h Pa
rk
Gyle
Gyle
Gyle
Gyle
Gyle
Gyle
Gyle
Gyle
Gyle
Edin
burg
h Ai
rpor
tEd
inbu
rgh
Airp
ort
Edin
burg
h Ai
rpor
tEd
inbu
rgh
Airp
ort
Edin
burg
h Ai
rpor
tEd
inbu
rgh
Airp
ort
Edin
burg
h Ai
rpor
tEd
inbu
rgh
Airp
ort
Edin
burg
h Ai
rpor
t
© © ©© ©© © ©©C
row
n C
op
yrig
ht R
eser
ved
Cro
wn
Co
pyr
ight
Res
erve
dC
row
n C
op
yrig
ht R
eser
ved
Cro
wn
Co
pyr
ight
Res
erve
dC
row
n C
op
yrig
ht R
eser
ved
Cro
wn
Co
pyr
ight
Res
erve
dC
row
n C
op
yrig
ht R
eser
ved
Cro
wn
Co
pyr
ight
Res
erve
dC
row
n C
op
yrig
ht R
eser
ved
Ord
nanc
e S
urve
yO
rdna
nce
Sur
vey
Ord
nanc
e S
urve
yO
rdna
nce
Sur
vey
Ord
nanc
e S
urve
yO
rdna
nce
Sur
vey
Ord
nanc
e S
urve
yO
rdna
nce
Sur
vey
Ord
nanc
e S
urve
y20
02 T
ele
Atla
s B
.v. '
s-H
erto
genb
osc
h. A
ll ri
ghts
res
erve
d.
2002
Tel
e A
tlas
B.v
. 's-
Her
toge
nbo
sch.
All
righ
ts r
eser
ved
.20
02 T
ele
Atla
s B
.v. '
s-H
erto
genb
osc
h. A
ll ri
ghts
res
erve
d.
2002
Tel
e A
tlas
B.v
. 's-
Her
toge
nbo
sch.
All
righ
ts r
eser
ved
.20
02 T
ele
Atla
s B
.v. '
s-H
erto
genb
osc
h. A
ll ri
ghts
res
erve
d.
2002
Tel
e A
tlas
B.v
. 's-
Her
toge
nbo
sch.
All
righ
ts r
eser
ved
.20
02 T
ele
Atla
s B
.v. '
s-H
erto
genb
osc
h. A
ll ri
ghts
res
erve
d.
2002
Tel
e A
tlas
B.v
. 's-
Her
toge
nbo
sch.
All
righ
ts r
eser
ved
.20
02 T
ele
Atla
s B
.v. '
s-H
erto
genb
osc
h. A
ll ri
ghts
res
erve
d.
2001
Cen
sus,
Out
put
Are
a B
oun
dar
ies.
2001
Cen
sus,
Out
put
Are
a B
oun
dar
ies.
2001
Cen
sus,
Out
put
Are
a B
oun
dar
ies.
2001
Cen
sus,
Out
put
Are
a B
oun
dar
ies.
2001
Cen
sus,
Out
put
Are
a B
oun
dar
ies.
2001
Cen
sus,
Out
put
Are
a B
oun
dar
ies.
2001
Cen
sus,
Out
put
Are
a B
oun
dar
ies.
2001
Cen
sus,
Out
put
Are
a B
oun
dar
ies.
2001
Cen
sus,
Out
put
Are
a B
oun
dar
ies.
Cro
wn
cop
yrig
ht m
ater
ial i
s re
pro
duc
ed
Cro
wn
cop
yrig
ht m
ater
ial i
s re
pro
duc
ed
Cro
wn
cop
yrig
ht m
ater
ial i
s re
pro
duc
ed
Cro
wn
cop
yrig
ht m
ater
ial i
s re
pro
duc
ed
Cro
wn
cop
yrig
ht m
ater
ial i
s re
pro
duc
ed
Cro
wn
cop
yrig
ht m
ater
ial i
s re
pro
duc
ed
Cro
wn
cop
yrig
ht m
ater
ial i
s re
pro
duc
ed
Cro
wn
cop
yrig
ht m
ater
ial i
s re
pro
duc
ed
Cro
wn
cop
yrig
ht m
ater
ial i
s re
pro
duc
ed
with
the
per
mis
sio
n o
f the
Co
ntro
ller
of H
MS
Ow
ith th
e p
erm
issi
on
of t
he C
ont
rolle
r o
f HM
SO
with
the
per
mis
sio
n o
f the
Co
ntro
ller
of H
MS
Ow
ith th
e p
erm
issi
on
of t
he C
ont
rolle
r o
f HM
SO
with
the
per
mis
sio
n o
f the
Co
ntro
ller
of H
MS
Ow
ith th
e p
erm
issi
on
of t
he C
ont
rolle
r o
f HM
SO
with
the
per
mis
sio
n o
f the
Co
ntro
ller
of H
MS
Ow
ith th
e p
erm
issi
on
of t
he C
ont
rolle
r o
f HM
SO
with
the
per
mis
sio
n o
f the
Co
ntro
ller
of H
MS
OS
cott
ish
Exe
cutiv
eS
cott
ish
Exe
cutiv
eS
cott
ish
Exe
cutiv
eS
cott
ish
Exe
cutiv
eS
cott
ish
Exe
cutiv
eS
cott
ish
Exe
cutiv
eS
cott
ish
Exe
cutiv
eS
cott
ish
Exe
cutiv
eS
cott
ish
Exe
cutiv
e stee
r da
vies
gle
ave
Edin
burg
h T
ram
STA
G 2
Appra
isal
Fig
ure
2.6
: 2
004 E
ducati
on D
epri
vati
on D
om
ain
Rankin
g
P:\
CG
G\G
IS\W
ork
\Pro
ject
s\69
00s\
6968
\Map
pin
g\M
apIn
fo\W
ork
spac
es\S
oci
oE
cono
mic
Ind
icat
ors
.wo
r
2004
Ed
ucat
ion
Dep
riva
tion
Do
mai
n R
anki
ngS
our
ce:
Sco
ttis
h E
xecu
tive
at S
uper
Out
put
Are
a
0.1%
to 5
% le
ast e
duc
ated
5% to
10%
dep
rive
d10
% to
20%
dep
rive
d20
% to
30%
dep
rive
d30
% to
40%
dep
rive
d40
% to
50%
dep
rive
d50
% to
100
% m
ost
ed
ucat
ed
Ed
inb
urgh
Tra
m P
hase
1a
Ed
inb
urgh
Tra
m P
hase
1b

Edinburgh Tram Network STAG 2 Appraisal
C:\Documents and Settings\rfineman\My Documents\Edinburgh Tram STAG 2 compilation MASTER v7 (2).doc
15
2.15 The study highlighted some general social and economic characteristics of the NEAR area:
• North Edinburgh has larger household sizes than the city and national averages. There are also high proportions of large households with children, and elderly households in the area;
• The area had a younger population than Edinburgh as whole; • 53% of respondents in the NEAR area rented housing from the local authority.
Owner-occupied levels were low, at 28% of households in the area. The report noted the difficulties in developing a private housing market in the area, with market values of properties low. The proportion of respondents with housing from the Housing Association and Co-operative Sector is double the proportion in Edinburgh as a whole (at 11%, compared to 5% in Edinburgh). This reflects the growing significance of this sector in housing in the area;
• Access to a car varied amongst the areas surveyed. Overall, 66% did not have access to a car. This compares to 46% of Edinburgh residents with no access to a car, and 35% in Scotland overall. Therefore, the North Edinburgh area has significantly higher than average proportions of people with no access to private vehicular transport;
• Across Scotland, 12% of households do not have a bank or Building Society account. In the NEAR area, this proportion was 23%, suggesting a high level of exclusion with regard to financial services;
• Overall 22% had a net income of less than £300 per month, with females faring worse than males – 29% of women in lowest income bracket, compared to 13% of men;
• The levels of qualifications in North Edinburgh were poor compared to the national average. Those with no qualifications were double the national average. In the NEAR area, 46% left school with no qualifications. Overall, only 22% had undertaken post school education.
2.16 In relation to employment, the following figures show the nature of employment patterns and modes of travel in the area:
• In the NEAR area 42% of adults in surveyed households were employed full-time, 12% part-time, with 22% unemployed and 13% retired. Unemployment figures for Edinburgh for 1997 suggested 4.5% unemployed in the city overall;
• Since the 1999 study unemployment in the NEAR area has fallen to approximately 9% when measured by proportion of the population in receipt of unemployment benefits. This increase in employment in the area, though, is in accordance with the caveat which suggests that the proportion of the population who are economically inactive, but not necessarily in receipt of benefits, is approximately 40% (NEAR, 2006);
• Despite increased levels of employment in the NEAR area the gap between employment levels in Northern Edinburgh compared to the city centre remains significant, the NEAR area continues to have significantly higher unemployment rates to the rest of the city (Local Labour Market Information, 2006);
• The proportion of respondents employed part-time is lower than the Edinburgh average. Overall, differences between genders reflect wider trends, with 51% of males in full-time employment, compared to only 26% of females. More females are unemployed than males. However, females working part-time is much more

Edinburgh Tram Network STAG 2 Appraisal
C:\Documents and Settings\rfineman\My Documents\Edinburgh Tram STAG 2 compilation MASTER v7 (2).doc
16
significant at 16% compared to 2% of male respondents; • Compared to Edinburgh as a whole, the NEAR area has a low proportion of
adults working in managerial, administrator and professional sectors. The majority of respondents were employed in the service and skilled trade sectors, with some variations across neighbourhoods;
• There are significant levels of long-term unemployment: 80% of the unemployed respondents had been so for longer than a year, higher than the official statistics of 24% (explained by unregistered unemployed in this survey) and 48% had been unemployed for longer than 5 years. Long-term unemployment was particularly prevalent in older age groups, especially between 45-54 years old;
• Overall in the NEAR area, most respondents worked in the city centre (29%), followed closely by the NEAR area (28%);
• When asked about mode of travel to work, overall the largest single proportion (36%) travelled by bus, followed by 31% travelling by their own car and 14% walking. Although this is considered a high modal share in favour of the bus in relation to the Scottish average, this proportion reduces significantly when looking at areas with lower levels of accessibility. For instance, the largest proportion of West Granton respondents travel to work by car (38%) with bus at 26%, walking at 15% and cycling at 11% (compared to an overall average of 4%);
• When asked about barriers to their ideal job, 21% stated access, the second highest obstacle after lack of experience. Access is likely to be a greater barrier to the new development and employment areas in the north of Edinburgh, without improvements in public transport provision;
• As a consequence of the research into modes of travel to work, the study concluded that employment patterns were shown to reflect public transport links. It also suggested that work patterns will continue to be affected by accessibility by bus and foot. The main growth areas were viewed to be service sector employment, in the city centre and at The Gyle and Edinburgh Park. The report stressed that better public transport links to the latter two locations in particular were required to enable access to opportunities, with relatively good public transport access currently to the city centre.
2.17 A study carried out by Oscar Faber (Oscar Faber, 2000) examining public transport options in North Edinburgh, reinforced Halcrow’s findings. It stressed these communities’ reliance on public transport and the desire for improvement in connections to areas of employment in Leith and the west of the city.
2.18 Previous studies that have examined the socio-economic characteristics have identified that the North Edinburgh area – defined as Muirhouse, West Pilton, West Granton, Royston/Wardieburn and Drylaw – is characterised by social deprivation and economic need. While there is an acceptance that improved transport provision will not address all of the needs of the area, there is also recognition that in tandem with other initiatives promoting housing, employment and urban regeneration, it can make a contribution to improving the well being of Northern Edinburgh. It is also important to note that while the available studies have concentrated on a sub-area of North Edinburgh, the socio-economic deprivation is not limited to the area covered by the NEAR study. Needs spread further a field, including into Leith where, notwithstanding the regeneration that has occurred there, areas of social deprivation remain.
Edinburgh Tram Network STAG 2 Appraisal
C:\Documents and Settings\rfineman\My Documents\Edinburgh Tram STAG 2 compilation MASTER v7 (2).doc
17
Socio-Economic Characteristics in West Edinburgh
2.19 The West Edinburgh corridor has a relatively high population density and a growing population, creating favourable conditions for high quality public transport.
2.20 In a high proportion of the area over forty per cent of households do not have access to a car and are therefore dependant on public transport to gain access to employment shopping and leisure facilities. While this is similar to the Edinburgh average, low car ownership is concentrated in the southern part of the corridor. This area, particularly the Moat, Stenhouse and Sighthill wards, also experiences a high level of deprivation, low levels of educational attainment, and relatively high unemployment. This indicates that these areas are not fully sharing in the overall success of Edinburgh. The provision of high quality public transport would improve accessibility and assist in overcoming social exclusion and improved access to a wider range of employment opportunities.
Environment
Aims and Objectives
2.21 The overarching planning objectives for the study have been set out and discussed in Chapter 2 of this report. Environmental objectives are expressed within these aims and objectives, and are clearly established by the Government’s environmental objective as one of the five key objectives for transport.
2.22 These objectives are supported by policies and aspirations at the regional and local level in statutory documents such as structure and local plans and the Local Transport Strategy (LTS), which have an environmental theme. The statutory development plan for the area through which the scheme passes comprises the Edinburgh and Lothian Structure Plan and several local plans. The core strategy of these documents is to facilitate more sustainable patterns of land use and development, which include protection and enhancement of the natural and built environment.
2.23 The draft LTS, updated to cover the 3 to 5 years from 2007, currently out for consultation, re-iterates a key aim stated in the LTS 2004 – 2007 which is to reduce the environmental impacts of travel. To support this, the document includes the following proposed objectives which relate to ‘environment’:
• To increase the proportion of journeys made on foot, by cycle, by motorbikes and by public transport;
• To implement the tram project; • To reduce the need to travel, especially by car; • To reduce the adverse impacts of travel, including road accidents and
environmental damage; and • To recognise the many roles that streets have for the community – as places that
people live and work, as areas that people meet, shop and relax, as a setting for the city’s built heritage, as well as routes for movement whether by car, bus, bicycle or on foot.

Edinburgh Tram Network STAG 2 Appraisal
C:\Documents and Settings\rfineman\My Documents\Edinburgh Tram STAG 2 compilation MASTER v7 (2).doc
18
2.24 The LTS contains targets for air pollution and noise pollution from traffic which will be used to help monitor progress in achieving objectives. The Air Quality Objectives outlined in the draft LTS are:
• To work in pursuit of objectives set by the Air Quality (Scotland) Amendment Regulations 2002; and
• To contribute to national objectives for the reduction of greenhouse gas emissions.
2.25 An Air Quality Management Area (AQMA) has been set up by CEC, leading to the production of an Air Quality Action Plan (AQAP) at the end of 2002 following a period of public consultation. This plan, which is monitored annually, sets out how the objectives for NO2 emissions in the area are to be pursued.
2.26 The City Local Plan for Edinburgh5 sets out broad objectives for the city’s environmental policy:
• To ensure that the unique qualities of the city, its built heritage and the character of its urban areas are safeguarded for the future;
• To protect important landscape and natural features of the environment, including the city’s green belt setting;
• To protect and enhance the nature conservation and biodiversity interest of the city; and
• To minimise the adverse effect of development on natural resources.
Existing and Potential Environmental Problems
2.27 The relevant baseline environmental conditions for each of the environmental sub objectives is summarised in Chapter 9 of this report. This section on existing and potential problems therefore focuses on particular issues of significance for the environment in the vicinity of the proposed Edinburgh Tram’s study area.
2.28 In relation to the environmental sub-objectives set out in STAG, the key environmental sub-objective which can be identified as a problem is city centre air quality. This has been specifically identified, since air quality can be related to quantitative standards (air quality objectives) such that exceedences of these standards (or predicted future exceedences) can constitute environmental ‘problems’. Air quality is also an issue which receives public and media attention (it is therefore also a ‘perceived problem’), particularly in terms of health implications, and one which is very clearly related to issues of city centre traffic growth and congestion in Edinburgh.
2.29 As a requirement of Part IV of the Environment Act 1995, local authorities have been required to complete a review and assessment of air quality to determine whether the air quality objectives are likely to be met, and where necessary designate Air Quality Management Areas (AQMAs).
5 Edinburgh City Local Plan Consultation draft, City of Edinburgh Council, 2006: http://map.avinet.no/plans/eclp/contents.htm

Edinburgh Tram Network STAG 2 Appraisal
C:\Documents and Settings\rfineman\My Documents\Edinburgh Tram STAG 2 compilation MASTER v7 (2).doc
19
2.30 The review and assessment of air quality report6 for Edinburgh recommended that a single AQMA be declared which focused on the city centre and links directly to the other locations in order that an integrated action plan can be prepared. The designated AQMA centres on the Princes Street to Haymarket corridor but also encompasses Leith Walk to the east and extends as far west as Roseburn Terrance, encompassing Dalry Road and Gorgie Road.
2.31 Edinburgh city centre was declared an AQMA on the basis that the nitrogen dioxide objectives for the annual and hourly mean have been observed as higher than is acceptable. Studies in Edinburgh have shown that 88% of nitrogen oxides come from road transport with the remaining 12% coming from domestic heating and Edinburgh International Airport7.
2.32 The CEC are currently monitoring pollutant levels in the western corridor of the city leading to the airport area, with a particular focus along Corstophine Road and St Johns Road, encompassing Drumbrae Roundabout. Monitoring is occurring with a view to creating a second AQMA in the west of the city.
2.33 Road traffic clearly makes the principal contribution to air pollutant emissions in Edinburgh, and the measures included in the proposed Edinburgh City Council Action Plan for the AQMA are directly related to the cause of the problem. These are:
• Reducing the amount of traffic; and • Easing traffic congestion.
2.34 These objectives are clearly relevant to the overall planning objectives for the proposed scheme, which are addressed in detail in Chapter 2 of this report.
Summary of Environmental Impacts for Phase 1 of the tram
2.35 Problems relating to other environmental sub-objectives are less straightforward to identify through comparison of existing conditions with objectives and standards. For example, whilst periodic flooding in parts of the Water of Leith in the northern area of the city is known to be a problem, most of the locations where the proposed tram route crosses the watercourses are not flood prone, and existing bridges would be used. One exception is the Gogar Burn, which is a recognised Area of Importance for Flood Control, where new bridges would be built to accommodate the tram. Preventative measures and other mitigation will ensure the development of the scheme will not result in any significant impact on existing drainage systems or patterns. However, the scheme would not require provision for compensatory land.
2.36 Areas of contaminated ground are present along the route. In particular, along the disused railway land around Baird Drive and Haymarket, and the areas of made ground close to the Gogar Burn near Castle Gogar (a former landfill site, believed to
6 Stage 3 Review and Assessment of Air Quality, City of Edinburgh Council, 2001: http://www.edinburgh.gov.uk/airquality
7 Summary Air Quality Action Plan, City of Edinburgh Council: http://www.edinburgh.gov.uk/airquality

Edinburgh Tram Network STAG 2 Appraisal
C:\Documents and Settings\rfineman\My Documents\Edinburgh Tram STAG 2 compilation MASTER v7 (2).doc
20
have been used for demolition material). Temporary impacts from the construction works will cause minor negative impacts on the land here, but assuming effective mitigation, the permanent impacts during the operation of the tram are expected to be neutral to minor.
2.37 There are a few protected species known to be present along the route, which could be impacted by the tram, including badgers, bats and otters. These are mainly on the western stretch from the city centre towards the airport and on the Roseburn corridor to Granton. Construction of the tram could cause significant temporary and permanent impacts to the badger, although appropriate mitigation has been identified to minimise this. This has been investigated and addressed in the Landscape and Habitat Management Plan8 (LHMP). As a ‘living’ document, it evolves as the detailed design changes, guiding planning and implementation over the whole lifetime of the scheme.
2.38 The significance of the World Heritage Site designation of the city centre and its importance as a valued townscape is also a key factor in the environmental appraisal. This is therefore reflected in the appraisal against the appraisal sub-objectives relating to landscape/townscape, visual amenity and cultural heritage. The appraisal shows that the scheme is expected to enhance the local landscape in certain areas, yet have some adverse impacts to varying degrees in different locations along the route. The overall assessment is minor to neutral impact.
2.39 To make way for the tram, three sites have been identified to be demolished or relocated, including two Listed Buildings (The Caledonian Alehouse and the Heart of Midlothian War Memorial at Haymarket). These result in a major adverse impact on cultural heritage. Elsewhere along the route, impact on cultural heritage is relatively minimal.
Environmental Issues and Constraints
2.40 There are some environmental issues and constraints associated with the tram alignment, notably the potential impact when the tram passes close to Areas of Importance for Flood Control at the Gogar Burn, and over some sites of contaminated land. This impact will be mitigated by providing new crossings of the Gogar Burn and smaller un-named water courses or ditches in the vicinity of the Flood Control area; however no compensatory land will be provided in respect of flood related matters.
2.41 In the case of Line 1b there is potentially a significant biodiversity impact, where the tram is likely to affect the protected badger population. This has been addressed in the LHMP, where a separate Badger Mitigation Strategy has been developed, involving the construction of an artificial sett. Significant impacts on landscape/townscape include the demolition or relocation of listed buildings at Haymarket. However, simultaneously, the environment will be actively improved in many locations.
2.42 The extent to which the tram scheme can contribute to reduce environmental adversities (e.g. air pollution) is also influenced by other factors such as
8 Landscape and Habitat Management Plan, by ERM for tie Ltd, first published June 2005 (accessible via tiewebsite http://tt.tiedinburgh.co.uk/documents.html)

Edinburgh Tram Network STAG 2 Appraisal
C:\Documents and Settings\rfineman\My Documents\Edinburgh Tram STAG 2 compilation MASTER v7 (2).doc
21
complementary measures to encourage use of public transport and reduce the demand for road traffic. In this STAG appraisal, where appropriate, they have been incorporated into the transport assumptions which underpin the predicted traffic flows (and therefore air quality effects) for the operation of the tram.
Transport
Public Transport
Bus provision
2.43 Edinburgh is served by some 135 local bus services using over 800 buses which call at over 2,000 stops. According to the 2001 Census, for Edinburgh residents using the private car or public transport for their journey to work, around 35% use bus9. Since Edinburgh has one of the highest rates of bus use per person in Britain, public transport is crucial in maintaining the accessibility and economy of the city centre.
2.44 There are a number of bus operators providing bus services in Edinburgh. The principal bus operator is Lothian Buses who provide an extensive network of bus services throughout the city. Other operators include First, Stagecoach, and Scottish Citylink. Existing services run predominantly on radial routes through the city centre which is based on a strong grid pattern. Problems of congestion have affected journey times and reliability. In order to try and mitigate the effect this has on bus journey times, bus priority measures have been implemented on core corridors throughout the city.
2.45 Despite the extensive bus network in the city, the percentage of trips to work by bus in Edinburgh (as a share of the total of private car and public transport) fell between 1991 and 2001 from 40% to 35% (2001 Census). However, since 2001, results from the Scottish Household Survey indicate a rise in the use of bus for journeys to work by Edinburgh residents from 36% to 39%10. Increasing bus use is also evident in Lothian Buses patronage, which has increased by over 25% since 199811.
2.46 The principal growth areas in the city at the Gyle, North Edinburgh and Kinnaird Park are inadequately served by buses from certain directions, with journeys by bus to these areas often requiring interchange between services.
2.47 Over the last decade CEC and its predecessor Lothian Region have introduced a number of measures, including the Greenways, in order to increase the attractiveness of journeys by bus in the city.
9 Travel To Work Patterns And Mode Of Travel To Work In Edinburgh & The Lothians 2001 - An Analysis Of The 2001 Census Travel To Work Data, City Development Department, City of Edinburgh Council, December 2004
10 SHS Annual Reports available from www.scotland.gov.uk/topics/statistics/16002/14048 11 Local Transport Strategy 2006 - Consultation Draft, CEC, 30th June 2006
Edinburgh Tram Network STAG 2 Appraisal
C:\Documents and Settings\rfineman\My Documents\Edinburgh Tram STAG 2 compilation MASTER v7 (2).doc
22
North Edinburgh
2.48 A study of public transport in North Edinburgh12 reviewed existing services and recommended a strategy, with particular reference to the two main developments in the area, Leith and Granton Waterfronts.
2.49 It was reported that concerns over the capacity of the current road network were expressed by Lothian Buses, who indicated that there were particular pinch points in the central area through which services ran to and from North Edinburgh. It was argued that these points impair their ability to deliver effective service provision to the area in question. These areas are:
• Lothian Road/Princes Street/Charlotte Square; • Picardy Place and London Road/Leith Walk roundabouts; and • George IV Bridge/The Mound/Lawnmarket.
2.50 Other areas along the routes were identified as causing problems for the running of service, mainly by lack of capacity caused by unrestricted on-street parking.
2.51 In the same study, representatives of CEC commented on the lack of clarity of bus services in the area, with ad-hoc provision being made by operators for new developments, and expressed the general view that North Edinburgh is the only part of the city to suffer from a lack of high quality service. The comment was also made that the current road network in North Edinburgh hindered the development of a high quality bus service.
2.52 The study mapped accessibility to a set of defined strategic destinations (categorised under travel, education, employment, retail, leisure and health) from four local centres in North Edinburgh, namely Granton, Muirhouse, Newhaven and Leith. The mapping exercise clearly showed a low level of direct services to destinations in the West of the city, notably Haymarket, Gyle, Edinburgh Park, Sighthill and Hermiston Gait, as well as the Airport. This limited accessibility to the west is a recurring theme in several studies carried out on transport in the North Edinburgh area, and has implications for access to employment and social inclusion.
2.53 The study recommended new and improved public transport services to and from North Edinburgh, as well as within, in the short to medium term. The strategic links (which should be aligned with the development areas) forming the core of the strategy were identified as the “Roseburn Link”, utilising the Southern Access Road and the former railway solum via Haymarket, and from Newhaven and Leith to the city centre.
2.54 A review of the North Edinburgh Public Transport Strategy13 suggested that new direct public transport services from Granton to the Gyle, Edinburgh Park and the airport should be considered, as the strategy appeared to focus mainly on improved links to and from the city centre, and on east-west corridors. The same review
12 North Edinburgh Public Transport Strategy – Final Report, Oscar Faber, 2000 13 Review of the North Edinburgh Public Transport Strategy, Colin Buchanan and Partners, 2000

Edinburgh Tram Network STAG 2 Appraisal
C:\Documents and Settings\rfineman\My Documents\Edinburgh Tram STAG 2 compilation MASTER v7 (2).doc
23
emphasised certain issues in connection with the North Edinburgh public transport strategy, such as the need to meet an incremental build-up of demand for public transport as a result of the development in North Edinburgh, by phasing additional capacity. The review agreed that a segregated public transport corridor would be required in the long-term.
2.55 Leith Walk is the principal bus corridor connecting northern districts to the city, with eight frequent services connecting the city centre to Leith. There are a further three frequent14 services on Inverleith Row corridor, and four frequent services operating along the Crewe Road South corridor. All these services operate at high frequencies, with most routes running at either 4bph or 6bph. Low floor buses already operate on many routes and are continuing to be introduced as the fleet is renewed.
2.56 Since 2000 the existing Greenway on the Leith Walk corridor has been supplemented by the introduction of the Leith to Straiton Quality Bus Corridor, which consists of a package of measures to improve the quality and reliability of bus services along the A900/A701/A7 corridor and connects North Edinburgh to the south of the city via the city centre. These measures include real time passenger information signs, bus priority, P&R, and interchange facilities at key locations along the corridor (including Elm Row). Bus priority measures are also being introduced to improve conditions on the Inverleith Row and Crewe Road South corridors. The city centre pinch points that were highlighted in the North Edinburgh public transport strategy have been addressed by the introduction of city centre measures, which include the removal of westbound general traffic on Princes Street.
West Edinburgh
2.57 Current bus services in west of the city predominantly operate along radial routes from the city centre. As with other areas of the city, many services cross through the city centre and their journey times and reliability are susceptible to congestion on the road network. The A8 and A71, which both operate as Greenways, are the principal on-street bus corridors to the west. Bus route interchange points are at Drumbrae, Haymarket Station, Edinburgh Park and The Gyle Shopping Centre. There are further interchanges at the Ingliston Park & Ride site and at Edinburgh Airport.
2.58 Nine services operate on the A71 corridor and seven services on the A8 corridor, including Lothian Buses’ Airlink service to Edinburgh Airport from the city centre. All of these services operate at frequencies of at least two to six buses per hour, seven days a week. Five routes across the two corridors operate 24 hours a day. There are also a number of other daytime and evening services in the area, which run on lower frequencies.
2.59 Greenways have improved bus travel, especially to and from the city centre, the Gyle area and Edinburgh Airport. However, traffic congestion in the corridor is reaching the point where the effectiveness of the Greenways at junctions is being undermined, and this problem is likely to worsen in future as traffic volumes increase further.
14 Frequent – Headway equal to or less than 15 minutes

Edinburgh Tram Network STAG 2 Appraisal
C:\Documents and Settings\rfineman\My Documents\Edinburgh Tram STAG 2 compilation MASTER v7 (2).doc
24
2.60 Fastlink was opened in 2004 and has improved the quality of bus services between Edinburgh Park, the city centre, and North Edinburgh. It provides an off road two-way, guided busway between Broomhouse and Stenhouse Drive and bus priority in the Gyle area and between Stenhouse Drive and West Approach Road. Lothian Buses Services 2 and 22 (Edinburgh Park to The Jewel and Ocean Terminal respectively) use the guided busway. Buses operating on the busway have been fitted with horizontal rubber wheels that guide the bus between fixed kerbs either side of the concrete busway.
2.61 On the A71 corridor the Hermiston P&R site offers bus based park and ride facilities for those travelling into the city from the south west. It is served by four of Lothian Buses’ services, including a new express service, which together provide a bus service from the Park and Ride facility to the city centre every five minutes. The site has some 470 spaces, with average usage currently around 300 cars per day.
2.62 The A8 is Edinburgh’s busiest corridor and it is now served by the Ingliston P&R site which provides bus based park and ride facilities for those travelling to the city from the west. It has a new branded express bus service and is also served by the Lothian Buses Service 35, which links the P&R site to the Airport, the Gyle, Edinburgh Park, and to Ocean Terminal via the Old Town. The site has some 535 spaces, with average usage currently around 400 cars per day.
2.63 To the north of the A8 the A90 is the principal route linking the city to Fife and the north of Scotland via the Forth Road Bridge. An innovative bus priority scheme has been installed on this corridor, which has resulted in significant improvements for buses travelling into and out of the city. The success of this scheme has helped nurture and underpin the growth of patronage of the Ferrytoll P&R in Fife.
Rail provision
2.64 There are 11 railway stations15 within the city area, and the rail network is important for medium and long distance travel to the city centre.
2.65 The main rail terminals are Waverley in the city centre and Haymarket to the West of the city centre. Although Edinburgh has rail links to the south and the north, trains arrive at Waverley from the west and east. Trains bound for Berwick and England exit the city to the East, before turning South down the coast. Trains bound for Fife and the north of Scotland exit the City to the West to allow access to the Forth Rail Bridge. As a result access by rail is a significant issue for the Western section of the proposed tram route, but does not impact upon the north of the city.
2.66 Rail services have, to date, played a limited role in serving the needs of the corridor from the city centre to the West. Until recently the only station within the corridor outside the city centre, was at South Gyle on the Fife line. This provides a useful railhead for medium to long distance trips to and from the area, but the service is not sufficiently frequent for it to contribute significantly to movements within the
15 Excluding Musselburgh.

Edinburgh Tram Network STAG 2 Appraisal
C:\Documents and Settings\rfineman\My Documents\Edinburgh Tram STAG 2 compilation MASTER v7 (2).doc
25
corridor.
2.67 The more recently opened Edinburgh Park station on the Edinburgh-Glasgow line appears to be playing a similar role to South Gyle, but will generate a need for high quality local public transport as a feeder to the station.
2.68 Stations are also located at Wester Hailes, Kingsknowe and Slateford on the southern edge of the corridor. These are served by an hourly stopping service from Edinburgh to Glasgow. The role of these stations in catering for the intra Edinburgh needs of the corridor is also limited.
2.69 The Edinburgh Airport Rail Link (EARL) would create direct rail services linking Edinburgh Airport to the rest of Scotland. Once constructed it will be possible to travel on trains from the Airport to destinations to the north, west and south, including Glasgow, Stirling, Perth, Fife, Inverness, Dundee and Aberdeen, as well as Edinburgh itself and onwards to England. The proposed link includes the construction of a railway station at the main terminal at Edinburgh Airport and trains would arrive and depart via a tunnel. The estimated outturn capital cost of the scheme is between £550 million and £650 million. A Private Bill for the scheme was introduced to the Scottish Parliament in March 2006 and this has passed the In-Principle stage. The next phase is that a reporter has been appointed to hear evidence in November/December 2006 with the expectation that the Bill will be passed in around May 2007.
2.70 Haymarket is currently the subject of a major study examining its potential as a major transport hub linking train, tram and bus services. The study, being undertaken by CEC with funding provided by the Scottish Executive, will look at options for improving facilities and linking up public transport choices at the station as part of an integrated transport system.
2.71 Heavy rail has a significant role to play in catering for longer distance trips to and from West Edinburgh but is not suited to playing a major role in meeting the demand for travel within the corridor. Along with South Gyle, the more recently opened Edinburgh Park station and proposed Edinburgh Airport Rail Link are likely to increase the need for high quality local public transport within the corridor.
Private Transport
Highway network
2.72 The principal routes into the city centre form the north and west comprise the A90 Queensferry Road, A8 Corstorphine Road, A71 Calder Road/Gorgie Road, and A900 Leith Walk. The principal east – west route north of the city centre is the A902 Ferry Road. The A903 and A901 provide access to the Forth shoreline area; the latter also provides an alternative east – west route serving Leith Docks. A new Southern Approach Road, constructed on the alignment of the former railway solum to Granton Harbour, has been introduced to serve the Granton development area. In general, the roads in the area are predominantly single carriageways with frontage development.
2.73 The A8 Glasgow Road which runs through the centre of the West Edinburgh corridor is one of the key radial routes in Edinburgh. It serves a significant area of suburban
Edinburgh Tram Network STAG 2 Appraisal
C:\Documents and Settings\rfineman\My Documents\Edinburgh Tram STAG 2 compilation MASTER v7 (2).doc
26
Edinburgh and major land uses such as Edinburgh Airport, Edinburgh Park, The Gyle Centre and Murrayfield. It is a major route into the city from West Lothian and beyond. It feeds into the City of Edinburgh Bypass at Gogar and parallels the main Edinburgh to Glasgow railway to Haymarket. The A8 is also one of Edinburgh’s Greenways, offering bus priorities through various traffic management measures and provision of dedicated road space.
2.74 The A900 Leith Walk consists of four traffic lanes for most of its length, two of which are Greenways dedicated to buses, taxis, and cyclists for 11 hours during the day. Leith Walk provides passage for those travelling from the city centre to Leith, Newhaven, and Granton.
Car demand and congestion
2.75 Combined with frequent junctions and access points, travel speeds are typical of such dense urban areas, with low speeds and congestion during the peaks. During the 1980s and 1990s, commuting into Edinburgh by car rose by 53%, with traffic volumes increasing, for instance by 52% on the A8 at Gogar and by 31% at Barnton in the ten years to 199516. Between 1991 and 2001, Census data indicates that commuting by car in Edinburgh rose by over 16%. Since 2001, data from the Scottish Household Survey indicates that the share of commuting by car for Edinburgh residents has declined marginally.
2.76 Levels of peak hour traffic into the city centre have remained static in recent years. Limited traffic growth has occurred (both spatially and temporally) only where there has been the available capacity to do so. This reflects the impacts of capacity limitations and restrictions on growth in car use to the city centre and increasing car ownership and economic dispersal outwith the centre.
2.77 Between Leith Walk and Queensferry Road, the crossings of the Water of Leith act as pinch points to north-south traffic. North-south traffic has to cross or use in part a number of heavily trafficked east-west routes. The area experiences significant ‘rat running’, with many alternative routes along roads often unsuitable for heavy volumes of traffic.
2.78 Forecast trends in traffic and congestion point to an overall growth in traffic levels of 11% from 2005 to 2011, with a further 26% to 2031; the consequential impacts on congestion would be greater than this. Of this growth, the largest impacts will be concentrated on those areas of highest growth, and consequently the highest congestion increases are expected to be on the strategic routes serving the areas of major economic activity around the city: west Edinburgh, the Waterfront, the South East Wedge and the city centre. Such increases in congestion will have commensurate effects on bus journey time and reliability.
16 City Plan for Edinburgh, CEC, 1999

Edinburgh Tram Network STAG 2 Appraisal
C:\Documents and Settings\rfineman\My Documents\Edinburgh Tram STAG 2 compilation MASTER v7 (2).doc
27
Opportunities
2.79 In addition to addressing the socio-economic, environmental and transport problems of Edinburgh as described in the previous sections, a rapid transit scheme can also contribute to the fulfilment of development opportunities that exist in north and west Edinburgh.
2.80 As part of the demand forecasting and appraisal process for Edinburgh Tram, a thorough and robust review of planning opportunities has been undertaken involving CEC planners. This has considered the likely range of development possible at the various sites identified and the potential impact that Edinburgh Tram might have on the overall scale of development. The following sets out the most likely considered level of development with Edinburgh Tram in place.
2.81 Central Edinburgh development opportunities are set out in Table 2.1. Given the already dense nature of much of the central area, the opportunities are relatively modest in scale and spread throughout the central area.
TABLE 2.1 CENTRAL EDINBURGH DEVELOPMENT
Location Residential (Units)
Office/ Business
(Sq m)
Retail (Sq m)
Hotel (Rooms)
Commercial (Sq m)
Leisure (Sq m)
Other (Sq m)
St. James Centre -8,000 8,000
Princes Street 13,000
St Andrews Sq 6,000
New Street 200 17,200 5,100 200
East Market Street
21,000
Waverley Station 40,000
Fountainbridge/ Edinburgh Quay: Fountain North
640 17,100 2,005 5,10017
Fountainbridge/ Edinburgh Quay: Freer Street
190 850 4,800
Fountainbridge/ Edinburgh Quay: Fountain South
1,000 30,000 5,000 5,000
Edinburgh Quay 5,500 400
Morrison Street Haymarket
21,390 3,350 750
Quartermile 689 37,200 8,000 250
Total 2,719 141,390 91,705 450 4,800 5,750 5,100
17 Student Halls.

Edinburgh Tram Network STAG 2 Appraisal
C:\Documents and Settings\rfineman\My Documents\Edinburgh Tram STAG 2 compilation MASTER v7 (2).doc
28
2.82 The biggest development opportunity in Edinburgh is the redevelopment of the Granton and Leith Docks areas. Whilst substantial development has already taken place, notably at Leith, the overall aspirations for these areas are very considerable, as detailed in Table 2.2. The development potential is focused on residential use, with some 25,800 units envisaged. Nearly 350,000 square meters of other uses complete the development potential.
TABLE 2.2 NORTH EDINBURGH DEVELOPMENT
Location Residential (Units)
Office/ Business
(Sq m)
Retail (Sq m)
Hotel (Units)
Commercial (Sq m)
Leisure (Sq m)
Other (Sq m)
Granton Waterfront
7,800 40,400 130,000 8,800 65,00018
Western Harbour, Newhaven
3,000 6,000 41,500
Leith Docks 15,000 30,000 20,000
Total 25,800 30,000 66,400 0 171,500 8,800 65,000
2.83 Planned development in west Edinburgh is outlined in Table 2.3. The significant development planned in the office/business sector would have a considerable impact on Tram patronage levels.
TABLE 2.3 WEST EDINBURGH DEVELOPMENT
Location Residential (Units)
Office/ Business (Sq m)
Retail (Sq m)
Hotel (Units)
Commercial (Sq m)
Leisure (Sq m)
Other (Sq m)
Edinburgh Gate, New Bridge
50,000
Newbridge North
50,000
Ratho Park 3,350
Edinburgh Park
200,000 168
Heriot Watt Research Park
174,00019
Sighthill Park 14,300
Total 0 253,350 0 168 50,000 14,300 174,000
18 Hotel, cultural use and education. 19 Research Park extension and campus extension.

Edinburgh Tram Network STAG 2 Appraisal
C:\Documents and Settings\rfineman\My Documents\Edinburgh Tram STAG 2 compilation MASTER v7 (2).doc
29
2.84 The data presented above pertains to the most likely development scenario and has been utilised in the demand forecasting for Edinburgh Tram. An associated maximum planning scenario has also been developed, where there is potential for further expansion in these areas, over and above the most likely considered. The additional development potential is set out in Table 2.4. Of note, an additional 6,400 residential units are possible in North Edinburgh, with potential for significant additional office/business and commercial space across the three areas.
TABLE 2.4 ADDITIONAL DEVELOPMENT POTENTIAL ARISING FROM MAXIMUM DEVELOPMENT
Location Residential (Units)
Office/ Business
(Sq m)
Retail (Sq m)
Hotel (Units)
Commercial (Sq m)
Leisure (Sq m)
Other (Sq m)
Central Edinburgh
615 23,410 29,695 50 200 3,750 0
North Edinburgh
6,400 20,000 26,100 0 78,500 1,200 15,000
West Edinburgh
0 50,000 0 0 15,000 0 0
Total 7,015 93,410 55,795 50 93,700 4,950 15,000


Edinburgh Tram Network STAG 2 Appraisal
C:\Documents and Settings\rfineman\My Documents\Edinburgh Tram STAG 2 compilation MASTER v7 (2).doc
31
3. TRANSPORT PLANNING OBJECTIVES
STAG Requirements
3.1 STAG appraisal is not simply completion of the Appraisal Summary Tables. It is a holistic process that begins from identification of problems and issues, development of transport planning objectives and the generation and sifting of options, all of which take place prior to appraisal. Therefore a key requirement is to provide a rationale for the selection of particular project proposals, and that rationale must be traceable back to the issues to be addressed and the transport planning objectives determined by the promoter of the project.
3.2 The STAG appraisal process requires that proposals are tested against two sets of objectives:
• The planning objectives established by the planner (planning strategy); and • The Government’s five objectives (environment, safety, economy, integration and
accessibility).
3.3 In addition, the integration objective requires testing against other relevant external objectives relating to transport, land use or wider policies (local, regional and national policy framework).
3.4 STAG suggests that, when setting objectives in complex situations, there should be layers or levels of objectives. Levels should comprise strategic and operational level objectives and possibly intermediate objectives below which should also be linked to the strategic level aims. While strategic level objectives are concerned with final
Establishing transport planning objectives is central to the development of options and to the testing and appraisal of those options. The performance of options against objectives will determine which options become proposals to be taken forward to the full appraisal process.
The transport planning objectives are fundamental to the STAG 1 appraisal. In addition it is necessary to test proposals against the Scottish Executive’s five objectives of environment, safety, economy, integration and accessibility, and other relevant external objectives. The transport planning objectives are used at both the option testing stage and in the Part 1 appraisal stage to determine the preferred options to be taken forward. The Part 2 appraisal contains an updated assessment against the transport planning objectives, but there the focus is on the Executive's 5 objectives.
The aim of this chapter is to describe the process involved in developing the transport planning objectives. The objectives developed are based principally on the identified opportunities, problems and constraints in the waterfront - city centre – airport corridor, which were discussed in the preceding chapter. The development of objectives also takes cognisance of the requirements of STAG and takes into account objectives and policies from the relevant planning documents. These documents are reviewed before setting out the transport planning objectives.
Edinburgh Tram Network STAG 2 Appraisal
C:\Documents and Settings\rfineman\My Documents\Edinburgh Tram STAG 2 compilation MASTER v7 (2).doc
32
(policy) outcomes, the lower levels of objectives can relate to outputs from particular strategies and / or to the inputs used.
3.5 CEC has clear strategic objectives enabling projects to be categorised as part of particular strategies. This is beneficial in taking forward the projects through the STAG appraisal process. However, a further explicit process is needed for developing an option appraisal which addresses the requirements of a STAG appraisal. This process underlies the rationale for the project, by testing outcomes against objectives, assessing likely costs and value for money, and considering deliverability and fundability.
3.6 In order to support the development of its integrated transport policy, the Government has established five appraisal objectives in STAG, which are used when authorities and agencies develop and appraise new transport proposals. Thus, planning objectives are required to satisfy the five overarching national objectives for transport:
• Environment; • Safety; • Economy; • Integration; and • Accessibility.
3.7 The approach adopted in this report is based on the fundamental principles of the STAG appraisal process which states that, at all stages of the process, consideration of the proposals should be:
• Objective Led: Considering the objectives of other policies; • Open Minded: Inclusive and integrated with policy areas; and • Auditable: Well structured and clearly referenced.
3.8 In order to develop the required rationale and to provide a STAG driven basis for categorisation of projects, the following section sets out the overall vision for transport in the area, derived from the aims and objectives of transport and other planning documents at all levels. From this base the planning objectives for the STAG appraisal are developed.
Planning and Policy Framework
3.9 This section will examine the planning and policy framework set out in the objectives from relevant plans and strategies relating to the area affected by the Edinburgh Tram. It will examine polices from the transport sphere and other relevant policy areas, and incorporate objective setting at National, Regional and Local levels, leading on to setting planning objectives for the development of the Edinburgh tram.
National Context
3.10 Transport policy frameworks and structures for delivery have recently undergone a period of substantial change in Scotland, which has included the formation of a new national transport agency, named Transport Scotland. As well as the pending National
Edinburgh Tram Network STAG 2 Appraisal
C:\Documents and Settings\rfineman\My Documents\Edinburgh Tram STAG 2 compilation MASTER v7 (2).doc
33
Transport Strategy (NTS) which will guide transport policy across the country, this section will make reference to guidance and strategies at the national level which will also have an impact on the planning objective setting for the proposed development of the Edinburgh Tram.
National Strategy and National Planning Guidance
3.11 Consultation on National Transport Strategy (2006)20 proposed a number of high level transport objectives, which were originally outlined in the most recent Transport White Paper ‘Scotland’s Transport Future’ (2004).21 The NTS consultation period closed on 13 July 2006 and the strategy is scheduled for publication in October 2006. The high level national objectives for transport are set out below:
• Promote economic growth by building, enhancing, managing and maintaining transport services, infrastructure and networks to maximise their efficiency;
• Promote social inclusion by connecting remote and disadvantaged communities and increasing the accessibility of the transport network;
• Protect our environment and improve health by building and investing in public transport and other types of efficient and sustainable transport which minimise emissions and consumption of resources and energy;
• Improve safety of journeys by reducing accidents and enhancing personal safety for pedestrians, cyclists, drivers, passengers and staff; and
• Improve integration by making journey planning and ticketing easier and working to ensure smooth connection between different forms of transport.
3.12 To support the high level objectives, a number of specific transport goals are suggested in the consultation for the National Transport Strategy, again giving an indication of what the transport goals in the final NTS will comprise;
• Facilitate economic growth; • Promote accessibility; • Promote choice and raise awareness of the need for change; • Promote modal shift; • Promote new technologies and cleaner fuels; • Manage demand; • Reduce the need to travel; and • Promote road safety.
3.13 Planning objective setting specifically in relation to transport is addressed further in Scottish Planning Policy 17 (SPP17) Planning for Transport.22 A new Planning
20 Scotland’s National Transport Strategy: A Consultation, The Scottish Executive, 2006: http://www.scotland.gov.uk/Publications/2006/04/20084756/0
21 Scottish Transport White Paper - Scotland’s Transport Future, The Scottish Executive, 2004: http://www.scotland.gov.uk/library5/transport/stfwp-00.asp
22 Scottish Planning Policy: SPP17 Planning for Transport, The Scottish Executive, 2005: http://www.scotland.gov.uk/Publications/2005/08/16154406/44078
Edinburgh Tram Network STAG 2 Appraisal
C:\Documents and Settings\rfineman\My Documents\Edinburgh Tram STAG 2 compilation MASTER v7 (2).doc
34
Advice Note (PAN) 75: Planning for transport (2005)23, accompanies SPP17. This contains more specific guidance than SPP17, and refers to the importance of integration of land use planning with transport, taking account of environmental aims and policies, and policies on economic growth, education, health and the objective of a fairer, more inclusive society.
3.14 Within SPP17, land use planning is stated as an important tool in:
• Reducing the need for travel by relating land use to transport facilities; • Enabling access to local facilities by walking and cycling; • Encouraging public transport access to developments; and • Supporting essential motorised travel.
3.15 As stressed in SPP17, the general hierarchy of priorities for individual travel accessibility development should be walking, cycling, public transport and then finally private cars. SPP17 suggests that access to jobs and facilities across the wider urban area should be a prime consideration. Accessibility of new developments is an important issue, and one that has historically been difficult to measure definitively.
National Economic Development Objectives
3.16 The national strategy for promoting economic development ‘The Way Forward: Framework for Economic Development in Scotland’ (FEDS)24 was originally presented to the Scottish Parliament in June 2000, and has since been refreshed in September 2004. The objectives within this framework are split into two types: the principle outcome objectives and the enabling objectives.
3.17 The Principle Outcome Objectives are as follows:
• Economic growth - with growth accelerated and sustained through greater competitiveness in the global economy;
• Regional development - with economic growth a pre-requisite for all regions to enjoy the same economic opportunities, and with regional development itself contributing to national economic prosperity;
• Closing the opportunity gap - with economic growth a pre-requisite for all in society to enjoy enhanced economic opportunities, and with social development in turn contributing to national economic prosperity; and
• Sustainable development - in economic, social and environmental terms.
3.18 The achievement of these desired outcomes depends upon a complex array of economic drivers. Establishing the underlying conditions and context for economic growth to flourish is, therefore, a critical step. There are four key enabling objectives:
23 Planning Advice Note: PAN 75 – Planning for Transport, The Scottish Executive, 2005: http://www.scotland.gov.uk/Publications/2005/08/16154453/44538
24 Framework for Economic Development in Scotland, The Scottish Executive, 2004: http://www.scotland.gov.uk/Publications/2004/09/19872/42430

Edinburgh Tram Network STAG 2 Appraisal
C:\Documents and Settings\rfineman\My Documents\Edinburgh Tram STAG 2 compilation MASTER v7 (2).doc
35
• A stable and supportive macroeconomic environment; • A facilitating national economic context: encompassing the physical, human and
electronic infrastructure; • Dynamic competitiveness in Scottish enterprises; and • Economic policies and programmes to secure the social, regional and
environmental objectives.
National Sustainable Development Objectives
3.19 ‘Choosing our Future: Scotland’s Sustainable Development Strategy’,25 was published in December 2005. The key aim of the strategy is to present methods by which Scotland can adhere to the common, UK wide sustainable transport aim laid out in the ‘One Future – Different Paths’ document in March 2005.26 This is an important policy to adhere to in development of the tram, its principal aims, as outlined below, should therefore be borne in mind:
"to enable all people throughout the world to satisfy their basic needs and enjoy a better quality of life without compromising the quality of life of future generations."
West Edinburgh Planning Framework
3.20 The Scottish Executive is currently preparing a National Planning Framework,27 which will identify West Edinburgh as a location where it is in the nation’s interest to promote a co-ordinated approach to planning. West Edinburgh is considered to be of national importance in economic, transport, and environmental terms. The nature and scale of development, both existing and committed, is significant to the regional and Scottish economy. Established land uses such as Edinburgh Airport, RBS Headquarters campus and the Royal Highland Showground play a national or regional role, and have aspirations for long-term growth. The existence of Edinburgh Airport, and the road and rail routes that connect West Edinburgh to the rest of the country place it in a strategically important location.
3.21 The West Edinburgh Planning Framework28 defines a key objective as being:
“the need to improve public transport accessibility to established development sites and reduce congestion.”
3.22 The Scottish Executive, CEC and Scottish Enterprise Edinburgh and Lothian have worked with the stakeholders to prepare a long-term strategic planning framework for the area, which was published in 2003. The Framework has served as an input to the
25 Choosing our future: Scotland’s Sustainable Development Strategy, The Scottish Executive, 2005: http://www.scotland.gov.uk/Publications/2005/12/1493902/39032
26 ‘One Future – Different Paths’, The UK’s Shared Framework for Sustainable Development, HM Government, 2005: http://www.sustainable-development.gov.uk/publications/pdf/SD%20Framework.pdf
27 National Planning Framework for Scotland: Guidance for the spatial development of Scotland to 2025, 2004, http://www.scotland.gov.uk/Publications/2004/04/19170/35317
28 West Edinburgh Planning Framework, Scottish Executive, 2003: http://www.scotland.gov.uk/Publications/2003/03/16751/19944

Edinburgh Tram Network STAG 2 Appraisal
C:\Documents and Settings\rfineman\My Documents\Edinburgh Tram STAG 2 compilation MASTER v7 (2).doc
36
development plans for the area and will also be a material consideration in development control decisions.
Edinburgh Airport Outline Masterplan
3.23 The Outline Edinburgh Airport Masterplan,29 prepared by BAA Edinburgh, was circulated for consultation in 2005 and published in July 2006. It is prepared in line with the expectations of the White Paper ‘The Future of Air Transport’30, published by the Department for Transport in December 2003. A core theme of the Airport Masterplan, as outlined in the White Paper is the fact that:
"ensuring the provision of adequate airport capacity in Scotland, whilst taking full account of environmental concerns, is an important priority for the Government and the Scottish Executive".
3.24 The aim is for sustained and responsible growth of Edinburgh Airport to 2030. Within this broad aim for the development of Edinburgh airport, BAA Edinburgh developed the Edinburgh Airport Surface Access Strategy in consultation with SESTRAN, which set three broad objectives relating to surface access:
• To increase the percentage of passengers using public transport from 16% to 25% by 2007;
• To reduce single-occupancy car journeys by staff from 88% to 78% by 2007; and • To develop an integrated transport strategy.
Regional context
3.25 In terms of regional transport planning CEC forms part of the South East Scotland Regional Transport Partnership (SESTRAN), while for local development and land use planning it falls within the Edinburgh and Lothian’s Structure Plan area. Objectives of each of these bodies, laid out in their strategies, will be outlined in this section.
Regional Transport Objectives
3.26 Under the Transport Act (Scotland) 2005 the Regional Transport Partnerships became statutory bodies. This new legislation has set up seven statutory RTPs of which SESTRAN is one. CEC is one of eight member councils of SESTRAN (the others being: Clackmannanshire Council, East Lothian Council, Falkirk Council, Fife Council, Midlothian Council, Scottish Borders Council and West Lothian Council).
3.27 SESTRAN had previously produced an RTS published in 2003,31 this is now in the process of being updated under the new statutory arrangements. The new RTPs are
29 The Outline Edinburgh Airport Masterplan, BAA Edinburgh, 2006: http://www.edinburghairport.com 30 The Future of Air Transport, DfT, 2003:
http://www.dft.gov.uk/stellent/groups/dft_aviation/documents/divisionhomepage/029650.hcsp 31 Regional Transport Strategy for the South of Scotland, SESTRAN, 2003:
http://www.sestran.org.uk/regional_transport_strategy.html

Edinburgh Tram Network STAG 2 Appraisal
C:\Documents and Settings\rfineman\My Documents\Edinburgh Tram STAG 2 compilation MASTER v7 (2).doc
37
tasked with producing their RTSs by April 2007, which will set out objectives for the region over the next 20 years.
3.28 The current overall policy principles adopted by SESTRAN are:
• Promote and develop travel awareness and information, encourage walking/cycling, promote better health and fitness and encourage the use of public transport;
• Improve safety for all road and transport users; • Reduce the environmental impacts of travel; • Enhance community life and social inclusion, and • Encourage the use of the most economic, effective, environmentally friendly and
efficient modes for freight transport.
Structure Plan
3.29 CEC is linked with East Lothian, Midlothian and West Lothian to form the ‘Edinburgh and the Lothians Structure Plan 2015’,32 which was approved by Scottish Ministers in June 2004. A key theme of the Structure Plan is the provision of appropriate measures for accessibility to developments, which has in part included safeguarding of land for potential future transport infrastructure enhancement or development.
3.30 The Structure Plan has adopted a number of Strategic Aims relating to the overall policy setting framework, taking into account policies at national and local levels:
• Maintaining and enhancing economic competitiveness; • Promoting a more inclusive society; • Protecting and enhancing the natural and built environment; and • Integrating land use and transport.
3.31 Within the section of the Structure Plan specifically relating to the role of transport in relation to development, a number of transport specific objectives have been set:
• Ensure that the location and design of new development, especially major new development, reduces the need to travel by car and encourages the use of public transport, walking and cycling;
• Maximise accessibility for all in the community by foot, cycle and public transport;
• Manage car use through parking policies, particularly by applying development control maximum parking standards, in conjunction with public transport improvements;
• Encourage the movement of freight by rail and sea or, where road freight is dominant, along the strategic road network;
• Support transport strategies by safeguarding land for improvements to transport
32 Edinburgh and the Lothians Structure Plan 2015, City of Edinburgh Council et al, 2004: http://www.edinburgh.gov.uk/CEC/City_Development/Planning_and_Strategy/Structure_Plan/EDINBURGH_AND_THE_LOTHIANS_STRUCTURE_PLAN_2001.HTML

Edinburgh Tram Network STAG 2 Appraisal
C:\Documents and Settings\rfineman\My Documents\Edinburgh Tram STAG 2 compilation MASTER v7 (2).doc
38
networks and prioritizing the provision of new transport infrastructure required to support the development strategy; and
• Ensure that development caters for its transport needs.
Local Policies
3.32 As will be identified in this section there is an extensive hierarchy of local planning documents applicable to the implementation of the Tram on a city wide and area specific level. Initially the city-wide, corporate level documents are reviewed. These cover all policy areas and set out CEC’s vision and strategic objectives for the city as a whole over the coming decades. A number of ‘subject specific’ planning documents are then reviewed, the Local Transport Strategy is clearly a key document in this field, but plans and policies focussing on community safety, health and economic development are also discussed. A number of more specific plans focussing on either general strategic aims, or specific policy fields, for particular areas of the city which will be affected by the Tram are also included.
Edinburgh’s vision
3.33 CEC’s vision for Edinburgh is presented in the ‘Building a Better Edinburgh’ document33 (June 2003) which outlines the overall vision CEC has for development in the city. This over-arching vision, which covers all policy areas, informs planning and objective setting at all other levels and across all policy areas of council planning. CEC’s vision is that Edinburgh, by 2015, will:
• Lead the most successful and sustainable city region in Northern Europe; • Sustain the highest quality of life of any UK city competing with the best in the
world; • Keep and attract the people needed to drive its talent and knowledge economy
and provide every citizen with the best personal opportunities for work, education and development; and
• Be a safe and tolerant, creative and connected city, promoting the well being of both people and place.
3.34 The vision for the city recognises the importance of transport for the economy of the city. At the same time it seeks a major change in the way transport needs are met in order to achieve central objectives relating to the sustainability of the city and its environment, safety in using transport and the need to promote greater social inclusion.
3.35 CEC has a well developed vision for transport over the next 20 years. This is outlined in the Local Transport Strategy, and is developed in accordance with the overall vision for the city.
33 Building a Better Edinburgh, City of Edinburgh Council, 2003: http://www.edinburgh.gov.uk/internet/Council/Council_publications/Council_policies_and_plans/CEC_the_edinburgh_city_vision

Edinburgh Tram Network STAG 2 Appraisal
C:\Documents and Settings\rfineman\My Documents\Edinburgh Tram STAG 2 compilation MASTER v7 (2).doc
39
Corporate Plan
3.36 CEC's Corporate Plan; ‘Edinburgh 2007’,34 was agreed by CEC in September 2003. It sets out the vision for Edinburgh and CEC's priorities. It provides direction for the Departmental Service Plans and covers manifesto commitments made by CEC Administration. The plan also sets out the performance agenda for CEC and how progress will be measured over the four years of the plan.
3.37 Transport is presented as an important issue in the Corporate Plan with “making sure that the City has modern effective transport arrangements” stated as a key theme. CEC’s priorities, outlined in the corporate plan are as follows. The position of maintenance and improvement of transport infrastructure underlines the key role that CEC sees transport to take in the development of the city:
• Developing and supporting the provision of a quality transport infrastructure; • Responding to the effects of the local housing market by improving the supply of
affordable housing; • Responding to labour shortages coupled with improving access within the
employment market; • Improving the quality of the public realm particularly in the city centre; and • Maintaining competitive advantage over other cities in the tourism market
through ongoing investment in services, facilities and infrastructure.
Local Transport Strategy
3.38 The current LTS covers the period 2004 - 2007,35 consultation on an updated LTS to cover the three to five years from 2007 closed at the end of August 2006.36 Publication of the renewed LTS is anticipated in late 2006.
3.39 CEC has stated its vision for transport within the Local Transport Strategy (LTS) as follows:
• Edinburgh aspires to be a city with a transport system that is accessible to all and serves all. Edinburgh’s transport system should contribute to better health, safety and quality of life, with particular consideration for vulnerable people such as children, and elderly and disabled people: it should be a true Citizen’s Network. The transport system should support a strong, sustainable local economy.
• CEC will seek to maximise people’s ability to meet their day-to-day needs within short distances that can easily be undertaken without the need to use a car. The city should develop and grow in a form that reduces the need to travel longer distances, especially by car. Choice should be available for all journeys within the city.
34 Edinburgh 2007, City of Edinburgh Council, 2003: http://www.edinburgh.gov.uk/internet/council/council_publications/CEC_corporate_plan__edinburgh_2007
35 Local Transport Strategy 2004 – 2007, City of Edinburgh Council, 2004: http://www.edinburgh.gov.uk/CEC/City_Development/Transport_and_Communications/LocalTransportStrategy2004to2007/home1.html
36 Local Transport Strategy Consultation Draft, City of Edinburgh Council, 2006.

Edinburgh Tram Network STAG 2 Appraisal
C:\Documents and Settings\rfineman\My Documents\Edinburgh Tram STAG 2 compilation MASTER v7 (2).doc
40
3.40 The aims proposed in the draft LTS from 2007 are:
• To support a sustainable and growing local and regional economy; • To improve safety for all road and transport users; • To reduce the environmental impacts of travel; • To promote better health and fitness; and • To reduce social exclusion.
3.41 These general aims relate closely to overall national and local priorities for the economy, environment and social policy, set by the Scottish Executive and CEC respectively. They have been developed into a series of more specific objectives for the transport system:
• To facilitate reliable and convenient access to the city and movement within it, in particular by reducing congestion;
• To increase the proportion of journeys made on foot, by cycle, by motorbikes and by public transport;
• To implement the tram project; • To reduce the need to travel, especially by car; • To reduce the adverse impacts of travel, including road accidents and
environmental damage; • To recognise the many roles that streets have for the community – as places that
people live and work, as areas that people meet, shop and relax, as a setting for the city’s built heritage as well as routes for movement whether by car, bus, bicycle or on foot;
• To improve the ability of people with low incomes or mobility impairments to use the transport system; and
• To ensure that the road, footway and cycle network are of a standard suitable for safe and comfortable movement.
The Edinburgh City Local Plan
3.42 The Edinburgh City Local Plan Consultation Draft37 was approved for consultation purposes by the Planning Committee on 9 March 2006. The public consultation period ran from 2 May 2006 - 30 June 2006. The Plan sets out policies and proposals for future land use change and development in the period to 2015 at least. This is the first local plan covering the whole of the city. Currently there are five local plans covering different parts of the area, all adopted at various times in the past. The most up-to-date is the South East Edinburgh Local Plan, adopted in 2005. These will all be replaced when the new Edinburgh City Local Plan is adopted.
3.43 The transport objectives laid out in the consultation draft of the local plan are:
• To minimise the distances people need to travel;
37 Edinburgh City Local Plan Consultation draft, City of Edinburgh Council, 2006: http://map.avinet.no/plans/eclp/contents.htm

Edinburgh Tram Network STAG 2 Appraisal
C:\Documents and Settings\rfineman\My Documents\Edinburgh Tram STAG 2 compilation MASTER v7 (2).doc
41
• To maximise the accessibility of communities to jobs and essential services; • To minimise the detrimental effects of traffic and parking on communities and
the environment; and • To support the provision of necessary infrastructure.
3.44 The Consultation Draft of the Local Plan makes specific reference to development of a tram network as a key issue for a sustainable public transport system, citing it as an alternative to travel by private car.
3.45 The Central Edinburgh Local Plan was adopted by CEC in May 1997 and will be reviewed as part of the Edinburgh City Local Plan.
The North East Edinburgh Local Plan Alteration
3.46 A consolidated version of this plan was published early in 2005. It contains CEC’s policies and proposals for the development and use of land in the north east of the city including the communities of Leith, Portobello, Newhaven, Trinity, Craigentinny, Northfield, Willowbrae and Joppa. The Local Plan was reviewed in 2000 and an alteration introduced to reflect the changing development opportunities in the area. The main change was the major development opportunity in Leith Docks Western Harbour.
3.47 The plan fully recognises the importance of developing a high quality transport network to serve the major developments including the provision of a possible Light Rapid Transit system and depot within the plan area.
Draft West Edinburgh Local Plan
3.48 The Draft West Edinburgh Local Plan38 (2001) focuses on the development opportunity at Granton Waterfront and outlines the need for improved transport infrastructure linking the area to the city centre and beyond as an objective in the process of development for the area.
3.49 Within the existing transport framework in Granton, the Masterplan39 proposes a three tier public transport structure, as follows:
• A strategic link between the city centre and the Waterfront with three stops (close to the local centre on the Plateau, on the eastern side of the Park, and the Harbour/Granton Village);
• A spinal east-west route for the extension of the main bus routes of the area through the site; and
• A series of loops interacting with these two systems, to be operated by local buses.
38 Draft West Edinburgh Local Plan, City of Edinburgh Council, 2001: http://www.edinburgh.gov.uk/CEC/City_Development/Planning/Draft_West_Edinburgh_Local_Plan/west_local_plan_contents.html
39 The Granton Masteplan, City of Edinburgh Council: http://www.edinburgh.gov.uk/CEC/Corporate_Services/Corporate_Communications/waterfrontintro/index.html
Edinburgh Tram Network STAG 2 Appraisal
C:\Documents and Settings\rfineman\My Documents\Edinburgh Tram STAG 2 compilation MASTER v7 (2).doc
42
Waterfront Edinburgh: Granton Masterplan
3.50 In January 2006, Waterfront Edinburgh Ltd submitted a Master Plan and Strategic Environmental Assessment (SEA) to the City of Edinburgh Council. The proposal comprises a mixture of land uses including housing, offices, hotels and commercial space, cafes, bars and shops. Within the plan a number of objectives are laid out regarding the urban form of the proposed developments and their impacts on the surrounding infrastructure;
• The development of a high level of accessibility, especially for a strategic public transportation system back to the City centre;
• The implementation of sustainable development policies; • The stimulation of high-quality architecture, landscape and public realm
design; and • The promotion of a rich mix of development.
Finalised Rural West Edinburgh Local Plan 2003
3.51 The Rural West Edinburgh Local Plan40 was approved by CEC in 2003, superseding the first finalised plan of 1999. The area covered by the plan is a key location in the transport network of east central Scotland, including strategic links between the city and the west and north of Scotland and beyond. It is consistent with the Structure Plan of 2004. The plan comprises a written statement and a proposals map. The plan seeks to achieve the relevant elements of CEC’s Local Transport Strategy which apply to the Rural West Edinburgh area:
• To reduce reliance and use of the private car and maximise accessibility for all, through careful location and design of new development and the provision of dedicated infrastructure to encourage walking, cycling and public transport use;
• To improve road safety and enhance the quality of the environment, particularly for pedestrians and cyclists through the introduction of appropriate traffic management measures and provision of dedicated infrastructure;
• To improve public transport linkages between the city and the major traffic generators in Rural West Edinburgh;
• To encourage the movement of freight by rail wherever possible; and • To safeguard land for new transport infrastructure where this can be fully
justified in strategic terms, while ensuring that adverse environmental effects are avoided.
Leith Docks Development Framework
3.52 The document41 sets out a long-term vision and framework for the phased redevelopment of Leith docks. It was prepared in initial form by Forth Ports plc within a context set by the CEC and subsequently edited by the Council both prior to and
40 The Finalised Rural West Edinburgh Local Plan, City of Edinburgh Local Plan, 2003: http://www.edinburgh.gov.uk/CEC/City_Development/Planning_and_Strategy/RWELP/RWELPmenu2.html
41 The Leith Docks Development Framework Final Version: http://download.edinburgh.gov.uk/Leith_docks/LDDF_Main_Text_App1.pdf
Edinburgh Tram Network STAG 2 Appraisal
C:\Documents and Settings\rfineman\My Documents\Edinburgh Tram STAG 2 compilation MASTER v7 (2).doc
43
following a public consultation process. The framework addresses an area of approximately 170 hectares covering Leith docks, in Forth Ports’ ownership, and the surrounding area, including part of the historic core of Leith.
3.53 The overarching objective of the vision for this area is as follows:
“To provide an extension of Leith and the city which integrates the old and new areas in a mixed, balanced and inclusive waterfront community while responding to contemporary aspirations, concerns and ideas regarding urban planning”
Community Planning Strategy
3.54 There are two main aims of Community Planning, which can be described as:
• Making sure people and communities are genuinely engaged in the decisions made on public services which affect them; allied with
• A commitment from organisations to work together, not apart, in providing better public services.
3.55 The first Community Plan for Edinburgh was published at the start of 2000. This has been refreshed with the publication of ‘A Community Plan for Edinburgh – The Key Challenges 2004 - 2010’.42 This provides an assessment of the big issues that face the city, presents key challenges including the need for better services and quality of life, and provides partner agencies with a framework by which to tackle these. A key focus within the plan is on sustainable development. To this end the plan calls for widespread production of green travel plans. In relation to transport the objectives of the plan are at a general level; “To improve transport” is one of the ten key challenges identified, with implementation of the Tram specifically mentioned as a milestone within this challenge.
Edinburgh Community Safety Partnership Strategy 2005 – 2008
3.56 The vision for the Community Safety Partnership is to ensure that Edinburgh is a safe place to live, work and visit.43 A key aim is that community safety is written in to the service plans of all public services across the city by 2008. Prevention of accidents and reducing the fear of crime are aspects of the city transport system directly referred to in the community safety strategy. Under the appraisal heading ‘safety’ they should form key considerations regarding how well the tram would perform regarding safety.
Joint Health Improvement Plan
3.57 The requirement to produce a Joint Health Improvement Plan (JHIP) came from the Scottish Executive in 2002 as part of a national drive to develop and co-ordinate
42 A Community Plan for Edinburgh, City of Edinburgh Council, 2004: http://download.edinburgh.gov.uk/CommunityPlanning/Edinburgh_community_plan_2004_2010_.pdf
43 Community Safety Partnership Strategy, City of Edinburgh Council, 2005: http://www.saferedinburgh.org.uk/admin/pubs/Strategy%20Plan.pdf

Edinburgh Tram Network STAG 2 Appraisal
C:\Documents and Settings\rfineman\My Documents\Edinburgh Tram STAG 2 compilation MASTER v7 (2).doc
44
health improvement capacity and activities in each local authority area. The ‘Working for a Healthier Edinburgh: Edinburgh Joint Health Improvement Plan (JHIP) 2003-2006’44 expresses the important role of the main Community Planning partners in making Edinburgh a healthier city. It is an integral part of both the City Community Plan (produced by the Edinburgh Partnership) and the Lothian Local Health Plan (produced by the Lothian NHS Board).
3.58 The overall objectives for Joint Health improvement planning are;
• To engage all sectors and communities in the city in joint action to improve the health and wellbeing of Edinburgh residents;
• To engage all sectors and communities in tackling health inequalities in the city; and
• To prioritise joint actions which make a positive impact on improving health and wellbeing and on reducing health inequalities.
West Edinburgh Local Community Plan (Draft)
3.59 The West Edinburgh Community Planning Partnership is in the process of updating the West Edinburgh Local Community Plan45 which was released in draft form in April 2006. The plan outlines a vision for West Edinburgh by 2012 to be a place where:
• There is a vibrant community and a wide range of opportunities for people to take part in public life;
• People are valued, healthy, and feel in control; • People are given a wide range of learning and training opportunities; • Local services and amenities are of an excellent standard and responsive to
people’s needs; • The environment is safe, clean and well maintained and housing meets the
Edinburgh standard; and • People can fully enjoy the benefits of Edinburgh’s economic growth.
3.60 In order to achieve this vision the Planning Partnership has outlined six priorities:
• Supporting children, young people and families; • Improving health and well being; • Building community capacity; • Making neighbourhoods safer, cleaner and more attractive; • Promoting economic prosperity; and • Providing learning opportunities.
44 Working for a Healthier Edinburgh, City of Edinburgh Council, 2003: http://www.nhslothian.scot.nhs.uk/publications
45 The West Edinburgh Local Community Plan (Draft), West Edinburgh Community Planning Partnership, 2006: http://www.wecpp.myed.org/?page=6073

Edinburgh Tram Network STAG 2 Appraisal
C:\Documents and Settings\rfineman\My Documents\Edinburgh Tram STAG 2 compilation MASTER v7 (2).doc
45
3.61 The document also outlines a desired outcome to be improvement of the availability of public transport in West Edinburgh.
Developing Transport Planning Objectives
3.62 Transport planning objectives define what the “planner” or promoter wishes to achieve in terms of the problems to be addressed and the outcomes to be achieved. The process of developing these objectives has been informed principally by the identification of specific opportunities, problems and constraints:
• The potential for future growth of the Edinburgh economy, which is dependent on access to labour and to suitable development sites, allied to the need to adopt a denser form of urban development in order to reduce the need to travel
• Forecast growth in traffic congestion and lengthening journey times on key corridors in the city, especially along and close to the key development corridors
• The need to achieve and sustain higher levels of mode switch from car to public transport especially in development corridors
• The potential for relatively dense residential and commercial development in the waterfront and for further commercial development between the city centre and the airport
• Constraints imposed on development at the waterfront by the land use planners because of the inability of a bus based transit system to handle the volumes of demand which would arise between the waterfront and the city centre-airport corridor if the waterfront were developed to its full potential
• The strong desirability of retaining as much new development within this corridor, in order to maximise the economic benefits of dense development, to minimise the need to travel by retaining residential developments within the city and especially within the corridor and to avoid use of less environmentally suitable land use options outside the city for residential developments.
• Issues of social inclusion affecting disadvantaged communities located close to the new waterfront development areas which would benefit from access to employment opportunities generated by both residential and commercial developments.
3.63 To enable an integrated and holistic approach to generating and testing options it is essential that these issues together with the above policies are all considered in preparation of the transport planning objectives for the corridor. These objectives are expressed as strategic objectives; under these are more specific operational objectives which are also used as the basis of evaluation (see Chapter 10). The transport planning objectives are shown below.
• To support the local economy by improving accessibility – To achieve an integrated, efficient, accessible and quality public transport system that promotes economic growth to the local community, improving its performance and competitiveness. This is fundamental to achieving both the social inclusion and economic development elements of the transport vision, through:
Improved access to the public transport network; and Improved access to employment opportunities.
• To promote sustainability and reduce environmental damage caused by traffic – To encourage more sustainable travel and comply with the targets set by
Edinburgh Tram Network STAG 2 Appraisal
C:\Documents and Settings\rfineman\My Documents\Edinburgh Tram STAG 2 compilation MASTER v7 (2).doc
46
the Air Quality Amendment Regulations. This is fundamental to achieving the environmental, sustainability, health and fitness and traffic aspirations, through:
Increasing proportion of journeys made by public transport, cycling and walking; and
Reducing local and global emissions (improving air quality and reducing contribution to greenhouse gases).
• To reduce traffic congestion – To enable cars to be used efficiently, reducing congestion and delays on key routes. This is fundamental to the achievement of economic development and environmental aims of the vision, through:
Reducing number of trips by car; and Reducing traffic volume on key routes.
• To make the transport system safer and more secure – To aim at less deaths by road traffic accident, by reducing vehicle volumes, speeds and making roads safer for both users and non-users. This is fundamental to the achievement of the safety elements of the vision, through:
Reducing traffic accidents. • To promote social benefits – To take the new system as an opportunity to
promote social and community benefits, which are fundamental to the respective elements of the vision, through:
Improving liveability of streets, maximising their role as the focal point of local communities; and
Reducing social exclusion, by improving the ability of people with low incomes, no access to car, the elderly or those with mobility impairments to use the transport system.
Edinburgh Tram Network STAG 2 Appraisal
C:\Documents and Settings\rfineman\My Documents\Edinburgh Tram STAG 2 compilation MASTER v7 (2).doc
47
4. SCHEME HISTORY: OPTION GENERATION, OPTION SIFTING AND STAG APPRAISAL
Introduction
4.1 The concept of a network of tram lines in Edinburgh was first outlined within the Integrated Transport Initiative (ITI) developed by CEC to achieve the aims set out in the Local Transport Strategy. Development work on the ITI initially began in the late-1990s, with Scottish Executive ‘Approval in Principle’ being achieved in 2002.
4.2 During this period, Waterfront Edinburgh Limited (a joint venture between CEC and Scottish Enterprise Edinburgh and Lothian) commissioned the Feasibility Study for a North Edinburgh Rapid Transit Solution46. This study examined the technical and economic case for a high capacity transit system serving north Edinburgh. At this time the rationale for such a system was the predicted inability of a conventional bus-based system to carry the expected volume of public transport movements between the major development area of North Edinburgh and major employment areas.
North Edinburgh route – Line 1
Development and sifting
4.3 The above mentioned feasibility study was undertaken for Waterfront Edinburgh Limited and was led by a Steering Group that involved the City Council. This study was charged with the task of considering options for public transport to link the Waterfront development sites in North Edinburgh (at Granton and Leith) with the City Centre.
4.4 The objectives of the study were:
• To develop and to establish the economics of a comprehensive public transport solution connecting the Waterfront project site with the City Centre, considering all practicable modes of transport and combinations of modes;
• To recommend a solution and an appropriate procurement route; and • To develop and outline business case supporting the recommendations
4.5 The study and report were developed in accordance with The Scottish Executive’s Guidance for Public Transport Fund bids and the draft STAG. In that context, the study:
46 Feasibility for a North Edinburgh Rapid Transit Solution, Andersen, Steer Davies Gleave and Mott MacDonald, 2001
The purpose of this Chapter is to set out the process from the setting of the transport planning objectives through option generation and sifting to the development of proposals for a tram scheme for Edinburgh.

Edinburgh Tram Network STAG 2 Appraisal
C:\Documents and Settings\rfineman\My Documents\Edinburgh Tram STAG 2 compilation MASTER v7 (2).doc
48
• Reviewed the transport and land use policies, aims and objectives for Edinburgh and the wider environs;
• Set out existing problems in North Edinburgh; • Developed a set of options to address the objectives and problems and undertook
outline appraisal of each; • Consulted with stakeholders (including CEC, local community groups and
businesses); • Define a Preferred option, with more detailed appraisal; and • Considered the financial, procurement and risk transfer options.
4.6 The feasibility study considered a range of issues, including:
• Technology options – bus based systems, guided bus and rail based rapid transit; • Alignment and route options – Granton – Haymarket, Granton – St. Andrews
Square, the full Northern Loop; and • Potential demand and revenue – demand and revenue forecasts were made for
each of the three route options and for guided bus and light rail transit technologies.
4.7 While only the first draft of STAG was available at this time and was not in official use, the approach adopted complied with STAG’s objectives based planning approach, working from problems through to objectives and the development of possible options to achieve these objectives.
4.8 The development and sifting of the options was made in the context of technical, operational, patronage, cost and integration issues and in the ability of the options to satisfy the planning objectives. The study confirmed that a conventional bus based public transport network would not be a feasible medium term option as a way of linking the waterfront development areas to the city and to major employment sites. This finding reflected the forecast level of working age population growth in the area, potential public transport patronage and the impact on current bus operations of a significant increase in bus use on key corridors in central Edinburgh arising from demand for public transport on the part of the concentration of population in the waterfront area.
4.9 The option assessment indicated that a tram solution offered better outcomes than a guided bus system. This was due to a range of factors including tram being able to deliver a step change improvement along its whole route (whereas guided bus would operate as a normal bus for much of its length), institutional difficulties of establishing guided bus concessions and issues surrounding attractiveness to the private sector. Further appraisal indicated that in general, a full loop option offered the highest potential for solving the identified problems, take advantage of the opportunities and address the transport planning objectives.
4.10 This option sifting process resulted in a Preferred Option being identified: it should be noted that in contrast to common current practice, STAG 1 was not used to sift options: this reflects the then status of STAG.
4.11 The Preferred Option was the full Northern Loop using LRT technology. Following
Edinburgh Tram Network STAG 2 Appraisal
C:\Documents and Settings\rfineman\My Documents\Edinburgh Tram STAG 2 compilation MASTER v7 (2).doc
49
this, a preliminary STAG appraisal of the preferred option was presented as part of the feasibility study. It should be noted that the draft STAG guidance was issued in July 2001, contemporaneously with the feasibility study report. The appraisal contained within the feasibility study was therefore undertaken in accordance with STAG; however, strictly speaking it is not a STAG1 appraisal.
4.12 This appraisal is set out in Appendix A (note that the structure and layout follows the draft STAG guidance and may differ from the full guidance issued in September 2003). The appraisal was accepted by CEC and the Scottish Executive, from whom funding was made available further to develop the scheme.
Subsequent development and consultation
4.13 The preferred option of a tram network was explored further in the “Edinburgh LRT Masterplan Study” commissioned by CEC and undertaken by Arup. This study indicated that a larger tram network could be feasible, within which the priority would be to develop the Northern Loop, which could be followed by lines to the west and the south-east of the city centre.
4.14 This option development process was revisited during 2002 as part of the development of Line 1 to STAG2 level and this broadly confirmed the Preferred Option, subject to potential alignment variants at George Street/Princes Street and Telford Road/former railway solum.
4.15 These options were taken forward to public consultation in order to ensure robust and inclusive decision-making, whilst simultaneously undertaking more detailed technical analysis to inform the more detailed variant level development and sifting process. Following the consultation and further analysis, the Preferred Options were identified as Princes Street and the former railway solum respectively, and a single preferred route alignment was therefore identified. This single option was then carried forward to a detailed STAG2 appraisal; the resultant AST is set out in Appendix A.
West of city route - Line 2
4.16 As with the Northern scheme, which became Line 1, the original concept of a second mass transit route running westward from the city centre was the ITI developed by the CEC. Having established a tram scheme as the Preferred Option to address the needs of the waterfront development area, and with a desire to make public transport use as seamless as possible, it was logical to consider a linked tram scheme to serve the westward route. As discussed below, the option of a bus based scheme was also assessed.
4.17 The refining of a preferred tram network was further undertaken through the LRT Masterplan study undertaken by Arup. This study identified a route that would serve the Corstorphine / Murrayfield and South Gyle / Stenhouse to city centre movements as well as providing other links to the city centre and within West Edinburgh. The study demonstrated that the West Edinburgh corridor should be a priority for investment. It also revisited the available technologies and, like the Line 1 feasibility study, concluded that LRT (or Tram) was the appropriate choice for a city of Edinburgh’s size. The Part 1 Appraisal Summary Table (AST) arising from this work

Edinburgh Tram Network STAG 2 Appraisal
C:\Documents and Settings\rfineman\My Documents\Edinburgh Tram STAG 2 compilation MASTER v7 (2).doc
50
is reproduced in Appendix B.
4.18 By the time that Arup’s work was completed, the ‘Fastlink’ Busway scheme was committed. Accordingly Arup considered whether further investment in tram was worthwhile. They concluded that the tram would generate significant additional performance and reliability benefits and would lead to a significant further modal shift from car to public transport. While not part of this appraisal, Arup also confirmed the potential integration benefits of providing a network of tram routes. They also pointed out that the on-street bus priority measures that are a key feature of Fastlink would remain after conversion of the guideway element to tram.
4.19 In addition to the overall Masterplan Study, Arup prepared a document entitled “West Edinburgh Tram: Prospectus to Scottish Executive” in April 2002. This set out the arguments for building WEBS first and subsequently developing West Edinburgh Tram. This demonstrated that the benefits from tram were significantly greater than those of WEBS, but that the benefits of the latter were sufficient to cover the capital costs within 4 years. Overall Arup concluded that there was a strong case for West Edinburgh tram as the second stage of development of public transport in the corridor. The prospectus was accepted by the Scottish Executive as the basis for offering PTF funding for the further development of the tram scheme.
Detailed assessment of route variants
4.20 Once the case had been made in principle for Line 2, the starting point for the detailed development of Line 2 was to examine and select the Preferred Route Corridor through West Edinburgh. During this phase of the study, over thirty route options were defined and three basic corridors identified as follows:
• North – along the A8; • Central – a similar corridor to that used for the City of Edinburgh Rapid Transit
generally following the heavy rail line from West Edinburgh to the city; and • South – following the A71 and Western Approach Road.
4.21 Initial route development identified some 30 alignment options, with a very large number of combinations being possible from these. In some stretches of the route (for example from Newbridge to Gogar Roundabout) the options were similar but on slightly different alignments. Between Gogar Roundabout and the city centre there were distinctly different choices to be made between ‘corridors’ (for example a northerly corridor along the A8, a second ‘central’ corridor generally following the Edinburgh-Glasgow railway and previously developed CERT corridor, and a third southerly one following in part the A71). It was essential to reduce the options and combinations to a manageable number for onward analysis towards a preferred route.
4.22 All 30 alignment options were appraised using appraisal methods consistent with STAG, with impacts scored using professional judgement. Overall, the intention was to provide a relative comparison between options; the preferred route corridor arising from this work and which was taken forward to public consultation was the central corridor, which broadly follows the alignment of CERT. Some sub-options remained and these were carried forward to public consultation:

Edinburgh Tram Network STAG 2 Appraisal
C:\Documents and Settings\rfineman\My Documents\Edinburgh Tram STAG 2 compilation MASTER v7 (2).doc
51
• Princes Street/George Street; • The Roseburn to Carrick Knowe section; • Gogar Roundabout; and • Near to the Airport.
4.23 Following the consultation and further analysis, a single preferred route alignment was identified and this was then carried forward to a detailed STAG2 appraisal. The resultant AST is presented in Appendix B.


Edinburgh Tram Network STAG 2 Appraisal
C:\Documents and Settings\rfineman\My Documents\Edinburgh Tram STAG 2 compilation MASTER v7 (2).doc
53
5. DEVELOPMENT OF EDINBURGH TRAM DURING THE PARLIAMENTARY PROCESS
Project Phasing
5.1 The final STAG reports for Lines 1 and 2 were produced in September 2004 and contained relatively minor updates and revisions from the first version issued in November 2003, with the promoted schemes remaining essentially unchanged.
5.2 During 2005 the key funding and affordability issues were addressed in the context of a fixed SE grant of £375m, a substantial contribution from CEC and the financial risks which will have to be borne by either CEC or SE. The conclusion reached was that although Tram Line 1 only or Tram Line 2 only had a high degree of deliverability within the constraint of a fixed SE grant of £375m, a network of Lines 1 and 2, with or without the Newbridge Shuttle, was unlikely to be affordable in one phase of construction and that a phased approach to procurement and delivery would be implemented.
5.3 Taking a prudent view on capital cost estimates and funding sources, an examination was undertaken by a number of parties — tie, CEC, TEL (see below), Lothian Buses, Transdev (the tram operator) — to assess optimum construction phasing. This work was validated by the SE. The parties determined through reasoned argument and professional judgement which phases within the totality of lines 1 and 2 would be the best to proceed with, assuming that Royal Assent was granted for both Bills.
5.4 Consideration has been given to a range of options for first phase network construction and to the pattern of construction of subsequent phases. This work indicates that the line from Newhaven to Edinburgh Airport (phase 1a), via Haymarket and Princes Street, gives the best balance of costs and benefits and presents a high probability of being financially viable when integrated with Lothian Buses services. This first phase of the tram development could be extended to include the section of Line 1 from Roseburn to Granton Square (phase 1b).
5.5 Phase 1a would provide the core support for the city economy and would directly link the major growth centres at the Airport/Gogarburn/West Edinburgh and Leith Waterfront with the city centre. It would provide access to the major housing and commercial developments under construction and planned and would underpin the role of these developments in sustaining the Edinburgh’s role as a growing successful capital city.
5.6 The link to Leith will serve two thirds of the waterfront development contained in the
This Chapter sets out the development of Edinburgh Tram during and following the Parliamentary process for Lines 1 and 2. The key developments set out are those that relate to the proposed phased implementation, recognising current affordability constraints, and the creation of Transport Edinburgh Limited, a new company set up by CEC to oversee the integrated operations of Lothian Buses and Edinburgh Tram.

Edinburgh Tram Network STAG 2 Appraisal
C:\Documents and Settings\rfineman\My Documents\Edinburgh Tram STAG 2 compilation MASTER v7 (2).doc
54
area that runs across the Leith waterfront between Newhaven and the eastern end of the Victoria Dock in Leith. Two thirds of the totality—approaching 20,000 houses plus shops and offices—is within that arc. The tram will serve that area extremely well. Figures have changed during the consideration of the Bill and Forth Ports has made revised proposals for Leith Docks. Under the latest proposals, a community the size of Bathgate will be built in Leith Docks.
5.7 The advantages to CEC in achieving its vision for the city and in securing transport infrastructure stemming from this proposed first phase of the tram are:
• The tram would be a world class gateway to the city for visitors arriving at the Airport, providing access to all modes of transport;
• Direct access to the major shopping destinations of the Gyle, Ocean Terminal and the city centre and to the Royal Bank of Scotland’s new international headquarters at Gogarburn;
• Access for existing communities to employment, leisure, shopping and other opportunities;
• The line would link with existing transport hubs at Edinburgh Park, Haymarket and Waverley Railway Stations and at the Bus Station in St Andrew Square to give first class interchange for local and long distance trips;
• The line would serve an expanded ‘Park and Ride’ at Ingliston increasing the catchment area of the tram and further reducing the demand for car travel in the city;
• The Roseburn Street tram stop would serve Murrayfield and Tynecastle stadia, giving access to international and national sporting and other events;
• This first phase would provide the core infrastructure on which expansion of the network would be built and could include in the future the proposed Line 3 linking the city centre with the new Royal Infirmary and the key development areas in South Edinburgh.
5.8 The development of this core section of Lines 1 and 2, as a first phase, is fully supported by TEL and Transdev, the tram operator.
5.9 The resulting first phase (Phase 1a) represents a good “fit” with the Structure and Local Plans. This is also the case with Phase 1b, which CEC wishes to construct at the same time as Phase 1a. Here the key ‘driver’ is the need to link the Granton Waterfront with the rest of the network and the rest of the city-region. Granton is linked to the network at Haymarket via the Roseburn corridor, which also serves the new Telford College, the Western General Hospital, Craigleith retail park and other key destinations.
Transport Edinburgh Limited
5.10 It has always been a critical element of the planning for the tram system that the operations of bus and tram (and other modes) should be as fully integrated as possible. Edinburgh is in an almost unique position, in that the main bus operator in the city is majority owned by the public sector. Recognising the unique opportunity this presented, CEC decided to establish Transport Edinburgh Limited (“TEL”), to take on the responsibility for coordinating the services of Lothian Buses and the tram.

Edinburgh Tram Network STAG 2 Appraisal
C:\Documents and Settings\rfineman\My Documents\Edinburgh Tram STAG 2 compilation MASTER v7 (2).doc
55
5.11 TEL is the single economic entity within which both the tram and Lothian Buses will operate. As a result of the common ownership of both Lothian Buses and the Edinburgh Tram, TEL will ensure complete integration of bus and tram services in a single network, avoiding unnecessary duplication and at the same time maximising passenger benefits through a fully integrated ticketing regime and marketing of the integrated network. TEL will take full advantage of the continuing engagement of Transdev, the tram operator, whose experience of tram and other public transport operation complements the expertise available in Lothian Buses.
5.12 TEL has played a leading role in the work carried out to date in assessing the economic and financial viability of the Phase 1a tram integrated with bus services and is assisting the Joint Revenue Committee contractor to define the parameters and inputs to the patronage and revenue modelling process to inform the optimal tram and bus network. TEL has also been engaging in consultation with third party bus operators.
5.13 TEL is committed to the implementation of integrated ticketing between the tram and Lothian Buses with fare parity between the two systems.


Edinburgh Tram Network STAG 2 Appraisal
C:\Documents and Settings\rfineman\My Documents\Edinburgh Tram STAG 2 compilation MASTER v7 (2).doc
57
6. CONSULTATION
Objectives and consultation process
6.1 Extensive consultation has been undertaken in respect of the Edinburgh Tram network. tie appointed a specialist advisor, Weber Shandwick, to develop and implement an overall strategy for public relations and communications, for both Lines 1 and 2.
6.2 The main objectives of the consultations were to inform stakeholders about the proposals, and to allow stakeholders to express their views on the proposals and therefore contribute to the assessment and preparation of final route designs. The consultation process also aimed to raise awareness and understanding of, and interest in, the proposals amongst stakeholders, and to build support where possible. In addition, the consultation process was intended to enable misconceptions and negative perceptions amongst stakeholders and the wider public to be addressed.
6.3 The consultation process involved three main groups and many methods of consultation. This is summarised in Table 6.1.
Participation and consultation is central to the ethos of STAG. A well planned and well executed participation and consultation strategy will lead to better proposals and greater support for their implementation.
Extensive consultation was undertaken during the development of Lines 1 and 2 and this is summarised below. This continued through the Parliamentary process, notably the management of and negotiation with objectors to the Bill. A separate strand during this time and subsequently has been the creation of Community Liaison Groups to inform further development of the scheme.

Edinburgh Tram Network STAG 2 Appraisal
C:\Documents and Settings\rfineman\My Documents\Edinburgh Tram STAG 2 compilation MASTER v7 (2).doc
58
TABLE 6.1 CONSULTATION TO DATE
Groups Methods Who involved?
Clients Steering group meetings Monthly progress meetings Small meetings
tie CEC Transport and Planning division Scottish Executive
Stakeholder Letters Telephone conversations Meetings
Environmental (e.g. Murrayfield Flood Defence) Statutory Heritage (e.g. Historic Scotland) Transport (e.g. Network Rail) Community (e.g. Scottish Rugby Union) Business (e.g. Royal Bank of Scotland) Public Utility (e.g. British Telecom) Emergency services Disability Technical (e.g. Traffic Interface Group)
Public Media launch Leaflets Website Freefone number Consultation with Political Representatives & Community Organisations Exhibitions Public meetings
General public
Results of the consultation for Line 1
6.4 The main findings were that 84% supported the concept of the tram in Edinburgh. The key points raised by the Line 1 consultation are summarised below.
Route-alignment concerns:
• Princes Street/George Street – Princes Street was supported by 66% of respondents.
• Telford Road/Former railway solum – Responses from the public within the zone of influence of the route options favoured the former railway solum along the Roseburn corridor. When taking into account all parties, the picture switched in favour of Telford Road, particularly because of cycle groups, who were concerned that there might be an adverse effect on the cycleway if the former railway solum were used for the tram route.
• With regard to proposed stops on Line 1, 83% of the respondents considered them to be well placed and convenient.
• There was concern about existing traffic problems and the plan for road realignment for Lower Granton Road. A desire was expressed to relocate the tram from this section.
• Trinity Crescent and Starbank Road also emerged as sections causing concern about width of carriageway, conflict with traffic and loss of parking.
• On Leith Walk and Constitution Street concerns were expressed about impact of

Edinburgh Tram Network STAG 2 Appraisal
C:\Documents and Settings\rfineman\My Documents\Edinburgh Tram STAG 2 compilation MASTER v7 (2).doc
59
the tram on bus services and about traffic management generally. • The use of the Roseburn to Crewe Toll railway corridor was noted as impacting
on wildlife, conflicting with cycling, having safety risks (of cyclists beside trams), and impacting on adjoining housing.
Environment-related concerns:
6.5 The following concerns were expressed:
• Noise levels during the day, depending on road traffic flows, and noise from depots.
• Air Quality Management Area (AQMA) could be designated in the city centre due to predicted future exceedences of nitrogen dioxide levels.
• The need for measures to contain contaminated run-off during construction and operation was identified; Sustainable Urban Drainage Systems (SUDS) measures should be considered.
• The presence of a SSSI at Wardie Shaw was noted. • Appropriate assessment of potential works to seawall at Trinity Crescent required
by SNH due to impacts on Firth of Forth SSSI/SPA. • Roseburn corridor is an important habitat for animals (protected species and
scheme impacts are significant). • Potentially contaminated areas of land identified along the route corridor. • Greater archaeological sensitivity in the coastal and Forth port areas. Important
archaeological areas east of Constitution Street.
Other concerns:
• There was a need to ensure that tram operation will not adversely affect servicing and deliveries to businesses.
• Integrated ticketing should be available for bus and tram travel. Tickets should also be available through shops.
• It was observed that the west side of the loop, Roseburn to Granton would provide a welcome new public transport link which is not available at present;
Results of the consultation for Line 2
6.6 The key points raised by the Line 2 consultation are summarised below.
• 86% supported the route of Edinburgh Tram Line Two, while 14% did not support the route. The main reasons given for supporting the Edinburgh Tram Line Two route
were: it would provide a vital link to the Airport; Links with existing public transport; it would alleviate congestion in West Edinburgh; it would provide a good link to Gyle Centre, business parks, RBS and Royal Highland Showground; and would benefit the tourist industry.
The main objections to the Edinburgh Tram Line Two route were; proximity to residential properties; requirement for Compulsory Purchase Orders (CPOs) in some areas; there was seen to be no need to extend to tram to Newbridge (perception there would be few users in this area). The route does not cover some heavily populated areas where likely tram users reside, for

Edinburgh Tram Network STAG 2 Appraisal
C:\Documents and Settings\rfineman\My Documents\Edinburgh Tram STAG 2 compilation MASTER v7 (2).doc
60
example Gorgie, Dalry and Corstorphine. • 86% supported the proposed stops on Edinburgh Tram Line Two, whereas 14%
had some objections to the stop locations. The main reasons given for supporting the Edinburgh Tram Line Two stops
were: they are thought to be well placed; and good balance between accessibility and speed.
The main objections to the Edinburgh Tram Line Two stops were: too few stops; and concern over increased parking at stops.
6.7 There were specific points mentioned by stakeholders, which were reported in more detail:
• Network Rail generally approved of the principle of the tram, although it had a few concerns: e.g. the Haymarket depot - access will be restricted from Russell Road and Roseburn Street and affects diesel tanks at Roseburn St.
• Her Majesty’s Royal Inspectorate’s main concerns included: Bridge construction – at Russell Road and Balgreen Road. Requirement to
improve vertical clearances. Gogar Depot – feasibility of locating the main line depot adjacent to the
Airport (issues over electromagnetic compatibility, lighting, OHLE and buildings interface with safety flight envelope, ensuring no “credible” risk of collision between aircraft and depot).
Tram/road/pedestrian interface – issues over management of vehicle and pedestrian movements, sight lines, safe clearances;
• Historic Scotland/ Edinburgh World Heritage: main concerns were regarding the tram scheme fitting into the streetscape with minimum impact, especially the impact of overhead power infrastructure, cables, fixings and supports. This fed into the development of the Design Manual for the development of the tram.
6.8 In specific areas (Murrayfield, Gogarburn, the Airport Area and Newbridge), locally specific stakeholders were consulted. The results of this are summarised in Table 6.2 below:
TABLE 6.2 STAKEHOLDER CONSULTATION RESULTS FOR LINE 2
Murrayfield Main points raised
Scottish Rugby Union (SRU)
Tram movements will have impact on crowds during major events at the Murrayfield Stadium, but only about a quarter of an hour before kick off and half an hour after the match. There are 14 major events a year. If the SRU back pitches are required for the Edinburgh Tram Line Two route, any losses in land area would need to be recovered elsewhere. The pitches are liable to flooding. The SRU indicated that flood protection walls would be required if the back pitches were to be used for tram stabling.
CEC Murrayfield Flood Defence
The north option would run over a flood retention area of approximately 300m in length. The tram route would need to be designed to ensure that flood capacity of this retention area is not reduced.
Edinburgh Park Limited / New Edinburgh
Positive view of tram. Feel it is desirable for the tram to run as close to the adjacent road as possible to allow for landscaping to be provided between the tram and Edinburgh Park buildings. The stop location in the middle of Edinburgh Park would be required to be of a high quality architecturally and in keeping with the surroundings.
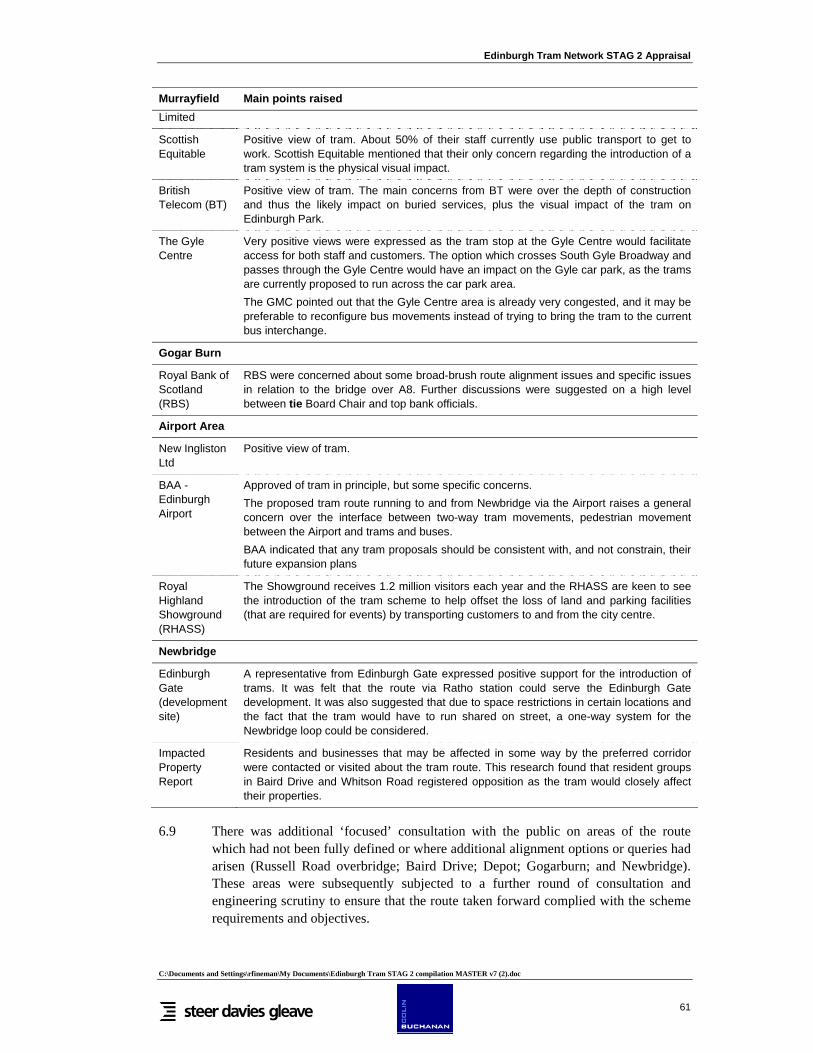
Edinburgh Tram Network STAG 2 Appraisal
C:\Documents and Settings\rfineman\My Documents\Edinburgh Tram STAG 2 compilation MASTER v7 (2).doc
61
Murrayfield Main points raised Limited
Scottish Equitable
Positive view of tram. About 50% of their staff currently use public transport to get to work. Scottish Equitable mentioned that their only concern regarding the introduction of a tram system is the physical visual impact.
British Telecom (BT)
Positive view of tram. The main concerns from BT were over the depth of construction and thus the likely impact on buried services, plus the visual impact of the tram on Edinburgh Park.
The Gyle Centre
Very positive views were expressed as the tram stop at the Gyle Centre would facilitate access for both staff and customers. The option which crosses South Gyle Broadway and passes through the Gyle Centre would have an impact on the Gyle car park, as the trams are currently proposed to run across the car park area. The GMC pointed out that the Gyle Centre area is already very congested, and it may be preferable to reconfigure bus movements instead of trying to bring the tram to the current bus interchange.
Gogar Burn
Royal Bank of Scotland (RBS)
RBS were concerned about some broad-brush route alignment issues and specific issues in relation to the bridge over A8. Further discussions were suggested on a high level between tie Board Chair and top bank officials.
Airport Area
New Ingliston Ltd
Positive view of tram.
BAA -Edinburgh Airport
Approved of tram in principle, but some specific concerns. The proposed tram route running to and from Newbridge via the Airport raises a general concern over the interface between two-way tram movements, pedestrian movement between the Airport and trams and buses. BAA indicated that any tram proposals should be consistent with, and not constrain, their future expansion plans
Royal Highland Showground (RHASS)
The Showground receives 1.2 million visitors each year and the RHASS are keen to see the introduction of the tram scheme to help offset the loss of land and parking facilities (that are required for events) by transporting customers to and from the city centre.
Newbridge
Edinburgh Gate (development site)
A representative from Edinburgh Gate expressed positive support for the introduction of trams. It was felt that the route via Ratho station could serve the Edinburgh Gate development. It was also suggested that due to space restrictions in certain locations and the fact that the tram would have to run shared on street, a one-way system for the Newbridge loop could be considered.
Impacted Property Report
Residents and businesses that may be affected in some way by the preferred corridor were contacted or visited about the tram route. This research found that resident groups in Baird Drive and Whitson Road registered opposition as the tram would closely affect their properties.
6.9 There was additional ‘focused’ consultation with the public on areas of the route which had not been fully defined or where additional alignment options or queries had arisen (Russell Road overbridge; Baird Drive; Depot; Gogarburn; and Newbridge). These areas were subsequently subjected to a further round of consultation and engineering scrutiny to ensure that the route taken forward complied with the scheme requirements and objectives.

Edinburgh Tram Network STAG 2 Appraisal
C:\Documents and Settings\rfineman\My Documents\Edinburgh Tram STAG 2 compilation MASTER v7 (2).doc
62
6.10 The consultation did result in changes to the then proposed routes. The highlights of these are listed below:
• At Ingliston, proposals now terminate the main tram route at the Airport Terminal building, with any service to Newbridge being provided by a shuttle service from Ingliston.
• At Gogar, Option B, which avoids Gogar roundabout and is the most popular option, has been recommended as the final proposal.
• For Roseburn/Carrick Knowe, tie is proposing Option B (north of the railway line), in line with the response to the public consultation.
• For the Airport alignment, the preferred route is a principal service terminating at the airport, connecting at Ingliston Park & Ride with a shuttle service to Newbridge.
6.11 There was further technical work undertaken which, together with the consultation outcomes, influenced the Final Route proposals.
Parliamentary Process
Edinburgh Tram (Line 1) Bill (introduced by City of Edinburgh Council)
6.12 The Edinburgh Tram (Line 1) Bill was promoted in the Parliament on 29 January 2004 by CEC. Following its introduction, there was a 60 day period for objections, which ended on 29 March 2004. This resulted in 206 admissible objections.
6.13 The Edinburgh Tram (Line 1) Bill Committee was established and met for the first time on 30 June 2004. The Committee published its Preliminary Stage Report on 16 February 2005, which was debated by the Parliament on 2 March 2005. At the debate of 2 March 2005, Parliament agreed the general principles of the Bill, and that the Bill should proceed as a Private Bill47. On 3 March 2005 the Parliament passed a financial resolution on the Bill.
6.14 The Committee then commenced the Consideration Stage of the Bill. This stage involved the consideration of objections and the detail of the Bill48. At the start of Consideration Stage, the Committee grouped those objections which, in its opinion, were the same or similar. The result of this process was that of the 192 outstanding objections that remained following the conclusion of Preliminary Stage, 47 groups were subsequently agreed by the Committee.
47 Private Bill Process Flowchart: http://www.scottish.parliament.uk/business/committees/tram-one-tram-two/papers-04/tram-line-guidance.pdf
48 Consideration Stage initially a 10 stage process. 1. Objections Grouped; 2. Lead Objectors Identified; 3. Promoter and Lead Objectors submit a list of topics, a witness list, a witness summary and details of any amendments; 4. Committee selects witnesses; 5. Timetable for Evidence Set; 6. Promotor and Lead Objector submit Witness Statement; 7. Witness statements passed to other parties; 8. Revised Witness Statements submitted; 9. Committee Consideration commences; 10. Committee reports

Edinburgh Tram Network STAG 2 Appraisal
C:\Documents and Settings\rfineman\My Documents\Edinburgh Tram STAG 2 compilation MASTER v7 (2).doc
63
6.15 Following informal discussions between the clerks and objectors, the Committee also agreed the ‘lead objectors’ for each group, to have responsibility for coordinating that group’s provision of evidence. Where an objection was not or could not be grouped, the original objector automatically became the lead objector for that “group”. The Committee had to arbitrate between the interests of the promoter and the interests of each of the remaining objectors and report on each outstanding objection49.
6.16 The Consideration Stage Report was published on 1 March 2006, and in this report, the Committee gave its decision as to whether to uphold or dismiss each objection. Several objections were withdrawn before and during this first phase of Consideration Stage, as a result of negotiations between the promoter and objectors.
6.17 After the Committee had commenced Consideration Stage, it received a request from the promoter for it to consider a proposal to change the alignment of the tram route at two points – in the Haymarket Yards area and the Ocean Terminal area – which would take it outwith the limits of deviation. The Committee agreed that both these proposals merited consideration, meaning that it had to be made aware of any relevant arguments and objections in relation to each altered route. The promoter advertised the proposed route changes, notified affected parties and produced revised and supplementary accompanying documents explaining what the proposed amendments would involve. A new objection period was established and 5 objections were received.
6.18 During the course of the Consideration Stage, these objections were withdrawn and accordingly the Committee agreed in its Consideration Stage Report published on 1 March 2006 that these proposed route changes should be made to the Bill
6.19 At Final Phase, there was a final consideration of the Private Bill and a decision whether to pass or reject it was taken at a meeting of the whole Parliament. The Bill was passed following the Final Phase debate held on 29 March 2006.
6.20 The Bill received Royal Assent on 8th May 2006.
Edinburgh Tram (Line Two) Bill (introduced by City of Edinburgh Council)
6.21 The Edinburgh Tram (Line Two) Bill was promoted in the Parliament on 29 January 2004 by CEC. Following its introduction, there was a 60 day period for objections ended on 29 March 2004. This resulted in 85 admissible objections.
6.22 The Edinburgh Tram (Line 2) Bill Committee was established and met for the first time on 29 June 2004. The Committee published its Preliminary Stage Report on 9 February 2005, which was debated by the Parliament on 23 February 2005. At this debate of the 23 February 2005, Parliament agreed the general principles of the Bill,
49 The Committee held meetings in the Scottish Parliament on 21 and 27 June, 5, 13, 19, 27, 28 September, 3 and 25 October, 7, 8, 14 and 29 November and 5 December 2005, at which it took oral evidence from the promoter, objectors and their witnesses. The Committee also took oral evidence at joint meetings with the Edinburgh Tram (Line 2) Bill Committee on 14 June and 1 November 2005. These meetings were limited to consideration of objections identical to both Bills

Edinburgh Tram Network STAG 2 Appraisal
C:\Documents and Settings\rfineman\My Documents\Edinburgh Tram STAG 2 compilation MASTER v7 (2).doc
64
and that the Bill should proceed as a Private Bill.
6.23 The Committee then commenced the Consideration Stage of the Bill. At the start of Consideration Stage, the Committee grouped those objections which, in its opinion, were the same or similar. The result of this process was that of the 77 outstanding objections that remained following the conclusion of Preliminary Stage, 57 groups were subsequently formed by the Committee. The Committee also agreed “lead objectors” for each group, to have responsibility for coordinating that group’s provision of evidence.
6.24 Several objections were withdrawn before and during this first phase of Consideration Stage, as a result of negotiations between the promoter and objectors.
6.25 After the Committee had commenced Consideration Stage, it received a request from the promoter for it to consider a proposal to change the alignment of the tram route at two points - in the Haymarket Yards area and the Gyle area - which would take it outwith the limits of deviation. Such changes, if agreed by the Committee, would necessitate amendments to the Bill.
6.26 A new objection period was established and seven objections were received. The Committee subsequently agreed that the notification carried out by the promoter and the revised documents it produced were adequate, and that all the new objections should progress to Consideration Stage.
6.27 All of the objections in respect of the amendment at the Gyle were subsequently withdrawn and although not all of the objections in relation to the route change at Haymarket were withdrawn, the Committee agreed in its Consideration Stage Report published on 21 December 2005 that the route be amended as sought.
6.28 The Committee noticed that the essence of many objections to Line 2 related to the compulsory acquisition of the objectors’ land and rights in land, and the adverse local environmental impacts that objectors consider they will suffer. Having regard to all of the evidence, the Committee was satisfied that the benefits of the scheme outweighed the disbenefits and that an appropriate balance has been struck between the rights of those adversely affected by the scheme and its benefits to the wider community.
6.29 On 3 March 2005 the Parliament passed a financial resolution on the Bill. The Consideration Stage Report was published on 21 December 2005 and the Bill was passed following the Final Phase debate held on 22 March 2006.
6.30 The Bill received Royal Assent on 27 April 2006.
Objection Management
6.31 Not all objections were resolved during the parliamentary process. tie made extensive efforts to negotiate with objectors to try and reach agreement. As a result of these negotiations many objections were withdrawn. tie sent the objector a letter in comfort giving assurances to that individual/business that what had been agreed in the negotiation process would be put in place. Where negotiation was unsuccessful and tie and the objector reached a point where there was no further discussion, tie issued a
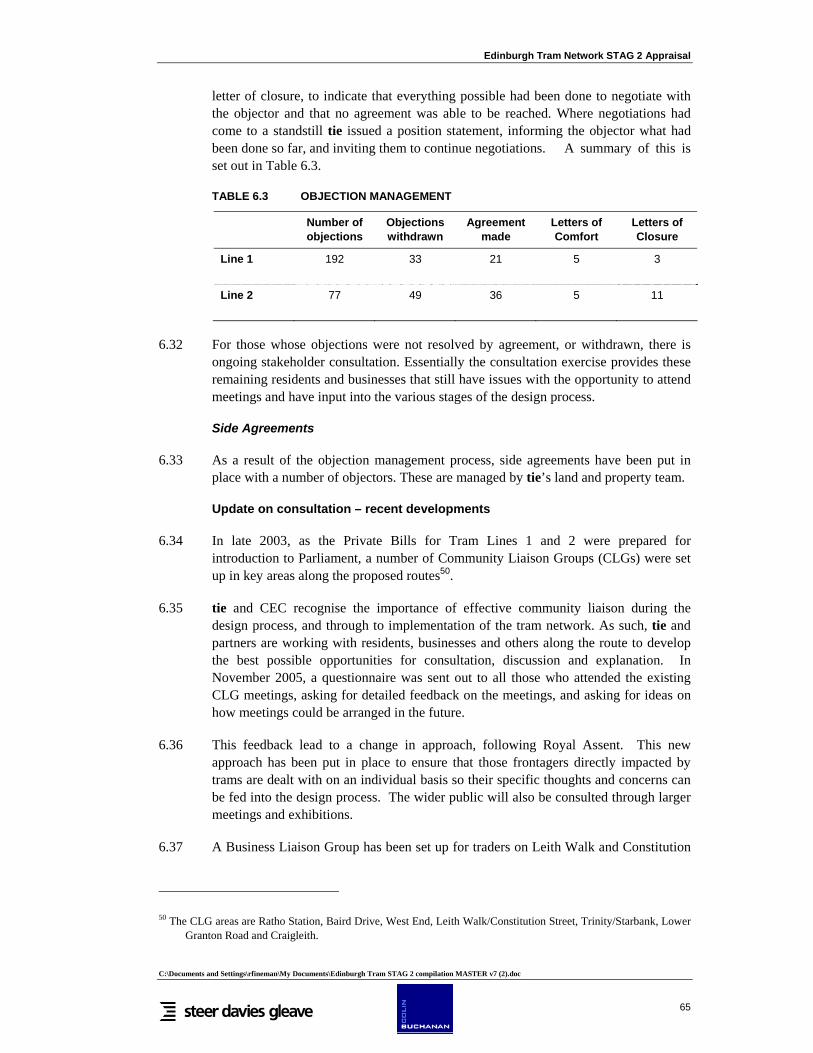
Edinburgh Tram Network STAG 2 Appraisal
C:\Documents and Settings\rfineman\My Documents\Edinburgh Tram STAG 2 compilation MASTER v7 (2).doc
65
letter of closure, to indicate that everything possible had been done to negotiate with the objector and that no agreement was able to be reached. Where negotiations had come to a standstill tie issued a position statement, informing the objector what had been done so far, and inviting them to continue negotiations. A summary of this is set out in Table 6.3.
TABLE 6.3 OBJECTION MANAGEMENT
Number of objections
Objections withdrawn
Agreement made
Letters of Comfort
Letters of Closure
Line 1 192 33 21 5 3
Line 2 77 49 36 5 11
6.32 For those whose objections were not resolved by agreement, or withdrawn, there is ongoing stakeholder consultation. Essentially the consultation exercise provides these remaining residents and businesses that still have issues with the opportunity to attend meetings and have input into the various stages of the design process.
Side Agreements
6.33 As a result of the objection management process, side agreements have been put in place with a number of objectors. These are managed by tie’s land and property team.
Update on consultation – recent developments
6.34 In late 2003, as the Private Bills for Tram Lines 1 and 2 were prepared for introduction to Parliament, a number of Community Liaison Groups (CLGs) were set up in key areas along the proposed routes50.
6.35 tie and CEC recognise the importance of effective community liaison during the design process, and through to implementation of the tram network. As such, tie and partners are working with residents, businesses and others along the route to develop the best possible opportunities for consultation, discussion and explanation. In November 2005, a questionnaire was sent out to all those who attended the existing CLG meetings, asking for detailed feedback on the meetings, and asking for ideas on how meetings could be arranged in the future.
6.36 This feedback lead to a change in approach, following Royal Assent. This new approach has been put in place to ensure that those frontagers directly impacted by trams are dealt with on an individual basis so their specific thoughts and concerns can be fed into the design process. The wider public will also be consulted through larger meetings and exhibitions.
6.37 A Business Liaison Group has been set up for traders on Leith Walk and Constitution
50 The CLG areas are Ratho Station, Baird Drive, West End, Leith Walk/Constitution Street, Trinity/Starbank, Lower Granton Road and Craigleith.

Edinburgh Tram Network STAG 2 Appraisal
C:\Documents and Settings\rfineman\My Documents\Edinburgh Tram STAG 2 compilation MASTER v7 (2).doc
66
Street.
6.38 The Frontager Survey originally completed by Mott MacDonald in early 2005, which covered Leith Walk and Constitution Street, has been repeated and validated by Halcrow. Halcrow have undertaken a route wide frontager survey of all businesses and residents around the proposed route, excluding Princes Street and St Andrew’s Square, which will be the subject of a separate consultation.
6.39 The Systems Design Services (SDS) consultants (Parsons Brinkerhoff) provide a team which provides stakeholder support by way of a stakeholder relationship manager and design manager responsible for stakeholder relations who have worked with tie to formulate a design specific consultation programme.
6.40 The aim of these design consultations is to enable direct, face-to-face discussion between the design team and affected individuals and tie to ensure that those affected by the tram have the opportunity for individual input. Other aims are to increase understanding of the decision-making process and the means by which individuals can influence the design, to increase knowledge and awareness, to encourage those affected by the tram to focus on practical issues and options, to collect detailed records of issues, concerns, ideas and preferences and to use these to inform the design, to maintain a dialogue throughout the design process in which each decision can be explained with reference to the documented concerns of the individuals who have contributed and finally to foster a direct, open and constructive relationship between tie and individuals around the route.
6.41 Meetings have been organised at 3 key stages in the design process:
• To feed information into the preliminary design (April-June 2006) • To present and explain the preliminary design and collect further feedback
(August-September 2006) • To present and explain the final design and take comments on any aspects which
may still be modified (November-December 2006)
6.42 Meetings have been organised for every section of the route, and invitations sent to all individual frontagers abutting the LOD, both residential and business. Separate, additional consultation events for the wider community to be organised at stage 2 (preliminary design), as mentioned below.
6.43 After a presentation by SDS and general question-and-answer session, attendees are invited to talk through and document their own issues, concerns and ideas on the consultation forms provided. These are transmitted directly to the individual designers working on each section, and provide an unambiguous record of the meeting.
6.44 The initial design consultation started on 24th April, and for the purposes of consultation, phases 1a and 1b of the route were divided into 14 sectors51. The
51 The 14 sectors are: Foot of the Walk - Constitution Street; Constitution Street – Leith Waterfront; MacDonald Road – Foot of the Walk; Picardy Place – MacDonald Road; Haymarket – Shandwick Place; Balbirnie Place; Roseburn Maltings; Craigleith – Crewe Toll; Roseburn – Craigleith; Granton; Murrayfield – Balgreen Road;

Edinburgh Tram Network STAG 2 Appraisal
C:\Documents and Settings\rfineman\My Documents\Edinburgh Tram STAG 2 compilation MASTER v7 (2).doc
67
preliminary design review started in July 2006 and will finish by the end of 2006. Feedback from businesses and residents from the design review will feed into the final design, and final design meetings will be held in late 2006.
6.45 In addition separate consultation is taking place with the residents of Baird Drive based on tie’s obligations according to the Edinburgh Tram Line 2 Act 2006, in particular regarding plans for the construction of the network in that area.
6.46 Completed questionnaires which had been submitted to designers will be available for reference so that frontagers can see where their comments had been taken into account for the next stage of design, or if they had not they will be provided with an explanation.
6.47 Alongside the frontager meetings, the SDS stakeholder team have visited individual frontagers who had specific issues in order to discuss on a one to one basis.
6.48 At the moment, the next step is to receive comment from the frontagers on preliminary design.
6.49 At the same time as the second set of design consultation meetings in Sept – Nov 2006, there will be 6 further public consultations52. These will be exhibitions staffed by members of tie and the design team, who will provide project information and give members of the public on the background on why Edinburgh needs a tram network and the benefits it will bring. There is also the opportunity to look at the detail of the preliminary design and talk one to one with designers.
6.50 Further consultation groups have been convened for other stakeholders.
6.51 The Disability Access consultation group was set up in December 2005 and is held once every two months. tie has convened its own forum for the purposes of disability consultation by making contact with various disability interest groups.
6.52 The Cycling consultation group has also been ongoing since December 2005, and is made up from representatives from the Cyclists’ Touring Club (the UK’s national cyclists’ organisation), SPOKES (a local cyclists’ group also referred to as the Lothian Cycle Campaign) and SUSTRANS (a UK wide charity for the promotion of sustainable transport).
6.53 All of the objections in respect of the amendment at the Gyle were subsequently withdrawn and although not all of the objections in relation to the route change at Haymarket were withdrawn, the Committee agreed in its Consideration Stage Report published on 21 December 2005 that the route be amended as sought.
6.54 The Emergency Services Consultation, ongoing since the beginning of 2006, is made
Haymarket – Murrayfield; St Andrew Square – York Place; Shandwick Place – Princes Street East and Princes Street East – St Andrew Square.
52 These 6 consultations will cover the areas of Leith, Roseburn, New Town, Airport, Granton, Edinburgh Park (Western Approach).

Edinburgh Tram Network STAG 2 Appraisal
C:\Documents and Settings\rfineman\My Documents\Edinburgh Tram STAG 2 compilation MASTER v7 (2).doc
68
up from representatives from Fire and Rescue, Lothian and Borders Police, the Coastguard, The Ambulance Service and CEC Emergency Planning Office.

Edinburgh Tram Network STAG 2 Appraisal
C:\Documents and Settings\rfineman\My Documents\Edinburgh Tram STAG 2 compilation MASTER v7 (2).doc
69
7. DESCRIPTION OF PROPOSED SCHEME
Introduction
7.1 The proposed scheme now comprises a combination of elements of the former Line 1 and Line 2 proposals. These are described below.
Route Alignment
Phase 1a
Newhaven to Constitution Street
7.2 From Newhaven Stop on Lindsay Road to Ocean Terminal the tram will run segregated parallel to the street then on-street for a short section. A new retaining wall structure, approximately on the line of the existing pedestrian ramp, will provide access from the Lindsay Road to Dock Road. The alignment runs parallel to the existing road, segregated running to the tramstop at Ocean Terminal, where a turnback facility is provided.
7.3 From Ocean Terminal, the tramline runs on-street along Ocean Drive, over the existing bridge at the Victoria Dock entrance and the existing Tower Place bridge, both of which will be modified to accommodate the tramway. A tramstop will be provided off-street on Ocean Drive near the new casino and proposed residential developments, from where the alignment runs off-street as far as Tower Street.
7.4 From Tower Street to Foot of the Walk, the tramway runs on-street, a mixture of segregated and non-segregated. Platform stops are provided between Bernard and Queen Charlotte Streets.
Foot of The Walk to York Place
7.5 The tramlines will run on-street (centre running) for the length of Leith Walk from Foot of The Walk to Picardy Place.
7.6 Platform stops, located centrally between tram lanes, are proposed at Foot of The Walk, Balfour Street, and McDonald Road.
This Chapter sets out a high level description of the proposed scheme for a number of areas, providing the basis for the appraisal set out in the next Chapter:
• Route alignment - noting stop locations, elements of major infrastructure and integration with the road network;
• Infrastructure – detailing key elements of infrastructure associated with the tramway; • Tram vehicle specification; • Tram operations; • Capital and operating costs; and • Bus network integration – setting out the proposals for the integration of Lothian Buses
with Edinburgh tram.

Edinburgh Tram Network STAG 2 Appraisal
C:\Documents and Settings\rfineman\My Documents\Edinburgh Tram STAG 2 compilation MASTER v7 (2).doc
70
7.7 The London Road and Picardy Place junctions will be modified as necessary, possibly retaining roundabouts, and there will be a platform tramstop at Picardy Place, within the general area of the existing car park fronting the Holiday Inn Hotel.
7.8 The tram will cross the junction of Broughton Street, and will be centre running along York Place, to the northeast corner of St Andrew Square
City Centre
7.9 The layout of the tramline through St Andrew Square will consist of either a single track around a loop consisting of St Andrew Sq West (South and North St David Street), Queen St, St Andrew Sq East (North and South St Andrew Street), and Princes Street, or a twin track running along the east side of the square in St Andrew Street. Under the former arrangement, there will be two stops one serving eastbound and one west bound passengers; under the latter, there will be a bi-directional stop close to the Bus Station. (These options are under development with CEC, with finalisation and identification of the preferred option expected in Q1 2007.)
7.10 From the junction of South St David Street and Princes Street the tram will continue along Princes Street, as double track, on a specially developed public transport route closed to general traffic. There will be a single stop located between Hanover Street and Frederick Street. The alignment will continue to the west of Princes Street across the junctions with South St.Charlotte Street and Lothian Road. From the West End the route will continue on a central alignment along Shandwick Place, with an island stop located between Atholl Crescent and Coates Crescent. Continuing towards Haymarket along West Maitland Street the tram will be centre running reaching Haymarket Junction, where there will be a revised roundabout configuration. The roads around the junction, such as Morrison Street and Dalry Road will also be re-configured. A stop is proposed on a viaduct structure which will carry the tram off street parallel to Haymarket Terrace. The stop will provide an interchange with the Haymarket heavy rail station.
7.11 West of this stop the alignment will make its way between Rosebery and Elgin House to run parallel to the heavy rail track alongside Balbirnie Place.
Roseburn to Carrick Knowe
7.12 The alignment continues parallel to the railway line to bridge over Russell Road. From here the tramline skirts around the northern boundary of the ScotRail depot. The tram alignment will be supported by a retaining wall to the rear of the business properties fronting onto Roseburn Street. An elevated stop is proposed immediately opposite the Murrayfield turnstiles, which will service the stadium and the surrounding area.
7.13 The tram will cross Roseburn Street on a viaduct and then continues to the south of the rugby stadium on a retaining wall, which will extend the existing rail embankment. The tram route continues to the south of the training pitches where the increased space allows for a steep grassed embankment in preference to a vertical wall. A new bridge will be provided over the Water of Leith, and to the west the tram continues on a grassed embankment. The residents of the adjacent properties in Baird Drive will be screened from the operation of the tram by planting at the foot of the embankment and

Edinburgh Tram Network STAG 2 Appraisal
C:\Documents and Settings\rfineman\My Documents\Edinburgh Tram STAG 2 compilation MASTER v7 (2).doc
71
noise barriers at the top. The tram will cross Balgreen Road on a bridge at the same level as the railway. A tramstop to the west will be accessed by a ramp from Balgreen Road. The tram will continue along the south of Carrick Knowe Golf Course in the area reserved for a dedicated transport corridor, and then rises to cross to the south of the railway on a new bridge at the west end of the golf course.
Carrick Knowe to Edinburgh Park
7.14 Between Carrick Knowe and South Gyle Access the tram will follow the alignment of and will replace the guided busway, which currently runs parallel to the railway. Two existing bridges over Saughton Road and Broomhouse Drive will be converted for use by the tram. Stops will be provided adjacent to Saughton Road and South Gyle Access.
7.15 The tram will cross South Gyle Access on a new bridge and then run in the verge beside Bankhead Drive and the railway. A stop will be provided at Edinburgh Park Station to allow for interchange for passengers between light and heavy rail.
7.16 The tram alignment will then rise onto a viaduct and turn north to recross the railway and enter the Edinburgh Park development area. The tram will run in a reserved public-transport corridor, which has been included in the business park masterplan, and a stop will be provided at the centre of the park.
Gogar Junction
7.17 The alignment crosses Lochside Avenue and South Gyle Broadway at signalised junctions and a stop will provide access to the Gyle shopping centre. The Tram will pass underneath the A8 and the roundabout slip roads in a new tunnel structure.
Depot
7.18 A depot site has been identified between the Fife Rail Line and Gogar Roundabout. This utilises a small triangle of waste ground and some agricultural land at the edge of the greenbelt. The depot site is bounded to the north by the line of the proposed Edinburgh Airport Rail Link. The depot will be constructed at a low level in order to minimise visual impact and to avoid disruption to the airport runway flight path, hence a significant amount of excavation will be required to lower the existing ground level by approximately 7metres.
7.19 A depot building will house staff accommodation and control room for the system, together with maintenance facilities and storage. Stabling will be provided for the tram fleet, with an allowance for future fleet expansion.
Gogarburn
7.20 The alignment continues west parallel to the A8 to a new stop at Gogarburn, which will serve the Royal Bank of Scotland’s World Headquarters. The alignment around Gogar Church has been selected to minimise impact on expected archaeological remains, the setting of listed buildings and a scheduled ancient monument, along with the ecological issues along the Gogar Burn, which will be crossed on a new bridge.
Ingliston and Airport

Edinburgh Tram Network STAG 2 Appraisal
C:\Documents and Settings\rfineman\My Documents\Edinburgh Tram STAG 2 compilation MASTER v7 (2).doc
72
7.21 The alignment will run west through farmland to Ingliston, crossing the proposed EARL line on a bridge. The existing Park and Ride facilities at Ingliston will be extended to serve a tramstop. To the north the tram will run alongside the Gogar Burn, through the rear of the airport hotel car park and cross the airport service road. The terminus stop will be on the site of Burnside Road and will allow for future inclusion within a transport interchange hub including access to the heavy rail link, the tram, buses and taxis. A covered walkway, constructed by Edinburgh Airport, will provide access to the airport terminal building.
Phase 1b
Granton Square to Ferry Road
7.22 The tram will run through the Granton Waterfront development area from Granton Square to the junction of West Granton Access and West Granton Road, at the northern edge of Pilton. This area is currently undergoing comprehensive redevelopment and as such the tram alignment has been determined primarily through the development master-planning process. The tram alignment continues along West Granton Access and through the junction at Ferry Road. Stops are planned at Granton Square, Waterfront Avenue, West Granton Access, Caroline Park and Ferry Road (Crewe Toll).
7.23 The planned stop at Granton Square has a potential positive effect on the townscape by reinforcing what is currently a rather neglected nodal point in the urban fabric. From Granton Square to the junction between West Harbour Road and the new spine road, the tram will run on a segregated alignment along the north side of West Harbour Road.
7.24 Through much of the Granton development area, the tram will form part of a transport boulevard along the new spine road. The design for this area will be developed in conjunction with the planners and developers so that the tram forms an integral part of the development. In particular the materials used will reflect the design intentions of the masterplan. Midway along Waterfront Avenue there will be a tramstop (Granton Waterfront) and also a stop at Caroline Park near the junction with Waterfront Broadway. Both stops will be designed to fit with the surrounding landscape, with platforms slightly raised and blending with the surrounding pavements.
7.25 The redevelopment of the Granton Waterfront area is so extensive that its character is primarily one of change, so it is only slightly sensitive to further change. The introduction of the tram system has already been designed in the masterplan.
7.26 The tram route through Pilton is along a reserved corridor on the west verge of the newly constructed West Granton Access from West Granton Road to Ferry Road, with a stop positioned approximately mid-way along West Granton Access.
7.27 The tram will be constructed along the broad grass verge to the new road, temporary infill opened up under part of the span of the bridge carrying Crewe Road Gardens over West Granton Access.
7.28 To improve what is currently a fairly bleak townscape it is envisaged that the track-bed will be in-filled with grass and the route will be landscaped with any vegetation

Edinburgh Tram Network STAG 2 Appraisal
C:\Documents and Settings\rfineman\My Documents\Edinburgh Tram STAG 2 compilation MASTER v7 (2).doc
73
removed during construction replaced with areas of trees and decorative shrub planting.
7.29 The Crewe Toll stop located next to the junction between West Granton Access and Ferry Road will form a bus - tram interchange between the north-south orientated tramway and the main road extending east-west.
Ferry Road to Haymarket
7.30 This section provides for residential areas through Craigleith and Roseburn and offers a connection for the rapidly expanding transport needs of the major development area in Granton to the major modal interchange at Haymarket and the City Centre. This section makes use of a former railway corridor, providing a rapid, segregated section of route, which has very little impact upon and from other modes of transport.
7.31 The tram will follow the former railway corridor from Ferry Road to the point where it meets the existing heavy rail corridor just west of Haymarket. South of the Crewe Toll stop at Ferry Road, stops are planned at Telford Road, Craigleith, Ravelston Dykes and Roseburn.
7.32 Alterations will be required to all the smaller bridges that the tram runs over, including the bridge over the A8 at Roseburn. Works will be required to widen the Groathill Avenue and Craigleith Drive underbridges, and also the Coltbridge viaduct. The design for the Coltbridge Viaduct will promote a sympathetic solution within this conservation area.
7.33 At both ends of the former railway corridor, the existing footpath is on embankment some five metres above the surrounding land. Significant slope strengthening works will be required to support the tramline over a length of about 150 metres.
7.34 The former railway surface was converted to a combined cycleway and footpath in the 1980’s and is now a well-used and popular recreational facility. The embankment and cutting slopes have become very dense with many mature and semi-mature trees, which are predominately self-seeded, forming a lush enclosed landscape that is distinctly separate from the surrounding primarily residential areas. The area has been maintained against the background of the route being reserved as a public transport corridor.
7.35 The tram and the replacement cycleway/footpath will be constructed on the line of the old trackbed. The tram will run on the east side of the track-bed and the cycle and foot path to the west, with formal crossings as required to allow public accesses to the east.
7.36 The combined width of the tram tracks and the cycleway and footpath will be approximately 11 metres, compared to the original railway of 8 metres and the current cycleway of 3 metres. Through the majority of the existing cutting and embankments retaining structures will be required to accommodate the required widening.
7.37 Where the railway corridor passes under narrow and low arched bridges, the track bed will be lowered to allow the tram tracks to be offset from the bridge centre-line and thus allow room for a narrower cycleway/footpath.
Edinburgh Tram Network STAG 2 Appraisal
C:\Documents and Settings\rfineman\My Documents\Edinburgh Tram STAG 2 compilation MASTER v7 (2).doc
74
7.38 The safety clearances required for the Overhead Line Equipment (OLE), combined with the increased width of track, mean that extensive tree clearance will be required, opening up the current enclosed nature of the railway corridor. The disturbed slopes will be landscaped and removed vegetation replaced with suitable trees and shrubs.
7.39 The cycleway and footpath will be surfaced in a fine grade blacktop as existing, while the tram track, with the exception of crossings, incorporating a grass finish.
7.40 The stops at Telford Road, Craigleith, Ravelston Dykes and Roseburn are entirely within the railway corridor and will be designed as well-detailed low platforms, with the shelters, seating, signage and other equipment designed as an integrated whole. The level differences between the stops and the adjacent cycleway and accesses will be dealt with by the incorporation of ramps and steps with commensurate lighting and security measures. The Telford Road stop will facilitate access to the nearby hospital while the stop at Craigleith will be positioned to fit with the surrounding access paths to the residential areas and Retail Park. The Roseburn stop will be located close to the A8 serving local residents and properties in the vicinity of the main road.
Tram Infrastructure
Rails, trackslab and surfacing
7.41 The nature of tramline surfacing (track, swept path, affected roads and footpaths) is dependent upon its environment. On street, trackslab construction (reinforced concrete) must provide strength to support the traffic / tram loads (including risk of voids beneath) together with appropriate stray current protection. Steel rails precoated with a resilient material are fixed within the trackslab. The trackslab may also be designed for specific circumstances to mitigate ground borne vibrations and noise. Off-street the rails may be fixed within “grasstrack” (usually a “lawned” type slab or unit construction) or traditional ballast and sleeper type arrangement.
7.42 The extent of surfacing works assumed is based on the following reinstatement criteria:
• typically the tramline width will be a minimum of around 3.5m per lane within streetrunning sections;
• increased lane width and centre line separation will be required on bends; • increased centre line to accommodate centre poles where necessary; • carriageway and footpath width provision should include for the necessary street
furniture including signage & signalling, poles, barriers, etc; • where no existing pavement offers space or access for specific maintenance
purposes, additional surfaced pavement may be required; and • footpaths will generally not be less than 2.0m wide.
Cycleways
7.43 Where practically possible, cycleways and cycle lanes will be provided as segregated routes for cyclists, with the aim of reducing perceived and actual danger from other road users, thus improving the user experience and encouraging their use. Their provision has been an important factor in the design of the Edinburgh Tram system.

Edinburgh Tram Network STAG 2 Appraisal
C:\Documents and Settings\rfineman\My Documents\Edinburgh Tram STAG 2 compilation MASTER v7 (2).doc
75
Parking bays
7.44 Parking bays will be provided, where possible, along the Edinburgh Trams route for the purposes of loading, residential parking, drop off points, taxi ranks and bus stops, when appropriate.
Trackside equipment
7.45 The provision of trackside equipment, required for the safe and effective operation and maintenance of the tram scheme, will be designed to achieve the appropriate balance between operational use and impact on the setting.
7.46 Trackside equipment may be divided into various categories:
• Power supply - sub-stations, overhead line equipment, trackside isolators and return circuits for OLE;
• Stop equipment cabinets; • Communications and signalling, including telephones and emergency call
buttons; • Track controls; • Signage; • Lighting; • Fare collection mechanisms; • Closed circuit television systems (security) and PA; and • Shelters, seating and balustrading;
Substations
7.47 Twelve new 11kV substations will be built along the route to accommodate the infrastructure’s power supply. They will be spaced along the route at approximately 2km spacing, as dictated by the needs to supply power to the system. The substation buildings will be approximately 15m by 4 m plan area, which includes a provision for DNO supply.
Overhead Line Equipment
7.48 Overhead copper cabling supplying power to the vehicles will be supported by either side poles, centre poles or building fixings, as appropriate to the particular location
Stop equipment cabinets
7.49 Each stop will be provided with a Stop Equipment Cabinet, which will house the majority of the control equipment such as communication and signalling equipment. Where possible this would be co-located with a sub-station. Such cabinets are generally metal units with a 1-2m frontage, up to 1m depth and 1.5m high.
Communications and signalling
7.50 Equipment at or near stops and at all road crossings will be needed to facilitate tram signal and traffic controls, this will include poles and signs, together with control boxes and a small electrical supply pillar. Small control cabinets will be required close

Edinburgh Tram Network STAG 2 Appraisal
C:\Documents and Settings\rfineman\My Documents\Edinburgh Tram STAG 2 compilation MASTER v7 (2).doc
76
to all signals (including telephones and emergency call buttons) for power supply controls. Stop equipment cabinets will house all other control equipment. The tramline will be signalled using road type signals. The road signals will interface with the urban traffic controls and will require small pillars or cabinets to house the vehicle recognition system.
7.51 A PA system will be provided at each stop and will be controlled from the Operations Centre at the Depot.
7.52 All communication equipment will be sited on the platforms or where the tram crosses roads in the usual position to warn tram and other vehicles of the right of way at a given junction.
Track controls
7.53 Points at turnouts will be electrically activated either from track circuits, vehicle recognition system or transponders relaying from the control centre. A small power supply pillar will normally be sited close to these to isolate the supply, should it be required. An emergency point lever will be supplied to each vehicle.
7.54 Point motors will be located in pits within the road at the points location.
Signage
7.55 Typical signage at a stop will be stop name boards (perhaps illuminated, usually two per platform), direction signs and local map information, real time information boards, destination signs, timetable, disabled boarding point sign, braille information panel and Edinburgh Tram Logo.
Lighting
7.56 Typically, lighting at the stop will differentiate it from the local street scene and provide adequate levels of illumination for safety.
Fare collection equipment
7.57 It is currently the policy of tie and CEC to use inspectors for fare collection in addition to a ticket vending machine at all platforms. The level of redundancy will be subject to review.
Closed circuit television systems (security) and PA
7.58 Closed circuit television cameras are normally mounted on poles strong enough to resist vibrations etc. A public address system and emergency call buttons can be attached to these or other poles such as street lighting columns.
7.59 The cameras will have a point, tilt and zoom facility and will be interfaced to the emergency call button, such that the camera will turn to the location of the call button when the button is pressed. All controls will be contained within the stop equipment

Edinburgh Tram Network STAG 2 Appraisal
C:\Documents and Settings\rfineman\My Documents\Edinburgh Tram STAG 2 compilation MASTER v7 (2).doc
77
cabinet.
Shelters, seating and balustrading
7.60 The type and style of shelters and seating will be determined from the design guide. Their location relative to other stop equipment will vary from stop to stop. Balustrading will be provided as required, in accordance with design guidelines.
Vehicle specification
Introduction
7.61 The procurement of appropriate tram vehicles to operate the Edinburgh Tram Network is underway, with the expectation that a supplier will be appointed following a competitive tendering process in mid 2007. The specification for this procurement process sets out the requirement for the highest quality of design and construction which must comply with the following general design criteria:
• high safety standards, compliance with Railway Safety Principles and Guidance and Rail Vehicle Accessibility Regulations;
• high reliability, minimum maintenance requirement and ease of repair; • the Tram will be designed to operate in conjunction with a track gauge of
1,435mm and a flange back-to-back dimension consistent with the rail types to be used on the system;
• proven design and technology; • low floor access; • ease of cleaning; • modern and attractive appearance; • low weight; • low environmental impact; • meets access requirements for the disabled; • minimum use of energy; and • the Trams will be required to have a minimum operating capability of at least
100,000 km per year.
7.62 The trams will be articulated in order to negotiate the track alignment. They will be fully bi-directional and capable of being driven from either end and will have passenger doors on both sides.
Specific Technical Requirements
7.63 The Tram body will be a nominal width of 2.65m externally and the total Tram length will be a nominal value of 40m.
7.64 The following loading conditions apply in the Specification:
• AW0 = Tram tare weight (empty car) • • AW1 = AW0 + full load of seated passengers

Edinburgh Tram Network STAG 2 Appraisal
C:\Documents and Settings\rfineman\My Documents\Edinburgh Tram STAG 2 compilation MASTER v7 (2).doc
78
• • AW2 = AW1 + weight of standing passengers at 4 persons/m2 • • AW3 = AW1 + weight of standing passengers at 5 persons/m2 • • AW4 = AW1 + weight of standing passengers at 6 persons/m2 • • AW5 = AW1 + weight of standing passengers at 8 persons/m2
where the mean passenger weight is taken to be 70.5kg.
7.65 The passenger capacity of the tram will be at least 230 persons, of which a minimum of 80 will be seated, on fixed seats. There will in addition be provision for wheelchairs in accordance with Rail Vehicle Accessibility Regulations. There will also be provision for luggage racks.
7.66 At least 70% of the floor area will be low-floor, with have a height above rail level between 300mm and 400mm. High floor areas will be minimised and all doorways will allow for level boarding access at a height between 300-350mm above the top of the rail.
7.67 The Tram will have a maximum operating speed of up to 80km/h.
Noise and Vibration
7.68 The Tram will be compliant with the Noise and Vibration Policy of the Edinburgh Tram Project and it is important that the proposed Tram should be as quiet as is reasonably possible. This is likely to mean that the proposed design will incorporate wheel damping, side skirts with sound-deadening linings and resilient mounting of electrical equipment likely to generate noise.
7.69 In meeting these requirements, it is a requirement of the tram supplier to carry out noise tests in Edinburgh to determine the frequency peaks generated, in particular by the wheels. The results of these tests will be used to determine the type and extent of any tuned vibration dampers that should subsequently be fitted to the wheels.
Interior
7.70 Care and attention will be given to provide a safe passenger environment within the tram vehicles. In regard to this, passenger movement within the Tram will be made as safe as practicable, and able-bodied passengers will be able to move along the entire length of the passenger saloon of the Tram.
7.71 The free and safe movement and loading of passengers will be facilitated by the incorporation of handrails, grab-poles and an interior free of tripping hazards and sharp corners throughout the Tram and hand-holds will be provided to maximise the use of standing space, particularly in vestibules and articulations.
7.72 Steps may be included to permit the movement of passengers to or from areas where there is a difference in the height of the floor of the Tram. Steps will not exceed 180mm in height and the quantity should be as few as possible. There will be a minimum of 16 seats accessible to passengers without using steps.
7.73 All seats will be at least 450mm wide, ergonomically designed, resistant to damage and soiling and have easily replaceable covers. The seats will as far as possible not be
Edinburgh Tram Network STAG 2 Appraisal
C:\Documents and Settings\rfineman\My Documents\Edinburgh Tram STAG 2 compilation MASTER v7 (2).doc
79
placed on pedestals, i.e. will not require a step up for passengers when taking a seat.
7.74 The actual floor area available for standing passengers will be clearly identified by the Tram Supplier and this has yet to be determined. From this the total standing capacity will be calculated, respecting Rail Vehicle Accessibility Regulations and the limitations of standing room in areas such as articulations. The Tram Supplier will propose alternative seating layouts, incorporating luggage racks and wheelchair spaces. Seating will generally be arranged transversely with minimum longitudinal seating. The Tram Supplier will also indicate any space that might be used for the carriage of bicycles.
7.75 The tram will be fitted with luggage racks, distributed evenly about the vehicle and situated as close as practicable to the vestibules. This will be particularly practical for those passengers travelling with cases or bags to or from the Airport. The luggage racks will occupy a floor space of up to 10m2 and extend the full height of the interior and have two intermediate shelves. At floor level a horizontal bar will extend across the opening into the saloon to prevent objects rolling out of the luggage space. In addition, and wherever practicable, the tram will be provided with overhead luggage racks in the saloon area, for holding small items of luggage. This provision may account for up to 20% of the required luggage space.
7.76 Headroom throughout the seating areas will be at least 2.3m to ceiling in the low floor areas and where uneven floor height is proposed, then 2.1m to ceiling in the high floor areas.
7.77 All passenger areas of Trams will be provided with a heating and ventilation system that maintains a constant acceptable ambient temperature during transit between Tram stops and during boarding and alighting at Tram stops when operating in all prevailing climatic and environmental conditions on the proposed route.
Bogies
7.78 The bogies are the non-powered sections of the tram located between the traction units and will incorporate suspension systems to give a high-quality ride characteristic. The suspension system will be self-adjusting or adjustable for wheel wear so that ride heights can be closely maintained. The ground clearance (from top of rail) fully laden with worn wheels will not be less than 65mm to any part of the bogie structure except a track guard.
7.79 Each axle will have a spring-applied friction brake. It will be possible to release the spring-applied brake manually in the event of failure of the actuation system. Under normal operation the parking brake will release and apply automatically when the driver’s controller is activated. Each bogie will have two electro-magnetic track-brakes, one suspended over each rail between the wheels.
7.80 The wheels will incorporate resilience and damping in order to minimise noise and vibration. Tuned vibration absorbers will be fitted after carrying out tests to determine their most effective parameters. The end bogies will carry adjustable track guards on their outer ends, to conform to Railway Safety Principle and Guidance requirements for under-run protection. The motor bogies will be interchangeable with each other.

Edinburgh Tram Network STAG 2 Appraisal
C:\Documents and Settings\rfineman\My Documents\Edinburgh Tram STAG 2 compilation MASTER v7 (2).doc
80
7.81 The ride comfort levels measured according to the ISO 2631 Standard on a ballasted straight and level track in good condition are set out in Table 7.1.
TABLE 7.1 RIDE COMFORT LEVELS
Location Speed Wz vertical Wz lateral
40 km/h 2,32 1,58 Drivers Cab
70 km/h 2,96 2,36
40 km/h 2,24 1,64 Passenger Compartment 70 km/h 2,82 2,28
Propulsion Equipment
7.82 The Tram will not export additional risk onto Network Rail infrastructure. In particular the harmonic generation from the propulsion and control equipment will not interfere with train-borne or trackside systems or other third party systems and infrastructure.
7.83 Table 7.2 sets out the Trams performance when motoring, on straight and level track and with a nominal line voltage of 750V dc:
TABLE 7.2 TRAM PERFORMANCE
Speed (km/h) Load Performance Notes
0 – 30 Up to AW4 1.2 m/s2 Instantaneous
0 - 70 Up to AW4 0.8m/s2 Average
7.84 The Trams will provide safe operation on all gradients under degraded performance modes as imposed by the traction equipment. In particular the Trams will be able to complete any journey on the System with one complete traction drive unit isolated.
7.85 The traction and braking control system will be optimised to provide smooth and low jerk values in starting from rest, acceleration, braking and stopping, on level track and on all gradients that are encountered, under all loading and environmental conditions, while protecting against unintended downhill movement.
Braking Equipment
7.86 The service brake application will be capable of retardation at an acceptable rate (as defined in Railway Safety Principles and Guidance) at all specified tare and laden conditions and the jerk rate will be limited so as to not cause discomfort to standing passengers. The service brake will normally consist of a regenerative electro-dynamic brake, (that as far as is practicable will return the braking energy to the overhead line) and a friction brake. The electro-dynamic brake will normally take precedence over the friction brake.
7.87 The braking performance of the Tram is set out in Table 7.3

Edinburgh Tram Network STAG 2 Appraisal
C:\Documents and Settings\rfineman\My Documents\Edinburgh Tram STAG 2 compilation MASTER v7 (2).doc
81
TABLE 7.3 TRAM BRAKING PERFORMANCE
Mode Means of initiation Effective mean braking rate on level and straight track at AW2 loading
Comments
Service brake
Master controller 1.2m/s2 1.3m/s2 maximum instantaneous. Predominantly electro-dynamic brake
Parking brake
Parking brake switch Release of dead man’s switch Tram shut-down
N/A Hold a laden Tram (to AW4), plus an unladen and unbraked Tram on a 8.5% maximum gradient. Friction brake
Hazard brake (Revocable)
Master controller Dead man’s switch
2.5m/s2
3 to 4m/s2 instantaneous. Electro-dynamic, friction brakes and track brakes. Sand, continuous audible warning wheel slide correction system active
Emergency brake (Irrevocable)
Red mushroom switch
At least 1.2m/s2 as per the service brake.
Friction brakes and track brakes Sand
Passenger Doors
7.88 The Tram will be equipped with at least four pairs of bi-parting sliding-plug doors on each side of the vehicle for the passenger saloon and one internal cab door per cab with a clear opening of not less than 610mm. The passenger saloon doors will be fitted on both sides of the vehicle in the low-floor area.
7.89 The doors will be opened and closed by the driver or simply released by the driver so that the passengers will be able to open the doors themselves using door push buttons. The push buttons will be illuminated when they are activated. The doors will stay open for a fixed time before closing automatically. A warning tone will be sounded when the doors are released and a different tone will sound to give warning of door closure.
Passenger Information System
7.90 The Tram will be fitted with six external destination displays, one at each end above the cab and two on each side, one near each end. These displays will be capable of displaying as a minimum a service number and the ultimate destination of the Tram. Internal saloon displays will be used to show information concerning the next stop and additionally a "Tram Stopping" sign. They will also display the local time, and should also be able to display public service information. The number and location of these displays will be such that the information will be easily visible to passengers within any part of the Tram.
7.91 The size of the Passenger Information Display font will conform to the requirements

Edinburgh Tram Network STAG 2 Appraisal
C:\Documents and Settings\rfineman\My Documents\Edinburgh Tram STAG 2 compilation MASTER v7 (2).doc
82
of the Rail Vehicle Access Regulations 1998. The brightness of the displays will compensate for ambient light quality.
Traction Power Supply and Overhead Line Equipment ("OLE")
7.92 The Trams will operate from a nominal 750V dc overhead power supply, and traction return current will be via the running rails. The minimum and maximum supply voltages will be 500V and 900V respectively. The Trams will be fitted with an electrically-raised, roof-mounted pantograph compatible with the overhead line equipment.
7.93 The maximum and minimum wire heights will be determined during the detail design process, and its is anticipated that support to the OLE will be provided as a combination of poles and building fixings, dictated by design and broader planning considerations.
Supervisory, Control & Communications Systems
7.94 The Trams will be fitted with equipment to automatically indicate their position to, and communicate with, a central control centre. A voice radio system will be permanently available between the driver and the control centre.
Tram operations
7.95 The JRC modelling work in conjunction with the service integration plan has produced the latest patronage forecast for the Edinburgh Tram Network. This has allowed the tram and bus service plan to be validated and adjusted to ensure sufficient capacity is provided at an affordable level throughout the network.
7.96 The service integration plan seeks to provide an integrated public transport network upon introduction of the tram.
7.97 Optimising the TEL bus and TEL tram services has been developed using a number of JRC model runs to refine the network services, and the costs of their provision in terms of operating hours and frequencies of tram and bus services.
7.98 The tram service provision is based upon the number of trams per hour (tph) necessary to carry the demand predicted by the model in the AM peak hour in the busiest direction.
Edinburgh Tram Network STAG 2 Appraisal
C:\Documents and Settings\rfineman\My Documents\Edinburgh Tram STAG 2 compilation MASTER v7 (2).doc
83
Figure 7.1and Figure 7.2 show the predicted tram loadings against capacity in 2011 in the Eastbound and Westbound directions respectively.

Edinburgh Tram Network STAG 2 Appraisal
C:\Documents and Settings\rfineman\My Documents\Edinburgh Tram STAG 2 compilation MASTER v7 (2).doc
84
FIGURE 7.1 PHASE 1A+1B 2011 AM PEAK EASTBOUND FLOW
0
1,000
2,000
3,000
4,000
5,000
6,000
7,000
8,000
9,000
10,000
Airport
Inglist
on P+R
Gogarb
urn Gyle
Edinbu
rgh Park
Edinbu
rgh Park
Station
South
Gyle
Saugh
ton
Balgree
n
Murray
field
Haymark
et
Shand
wick Plac
e
Prince
s Stre
et
St.And
rew Squ
are
Picady
Place
McDon
ald R
oad
Balfou
r Stre
et
Foot o
f the W
alk
Consti
tution
Stre
et
Ocean
Driv
e
Ocean
Term
inal
Newha
ven
Granton
Square
Granton
Wate
rfron
t
Carolin
e Park
West G
ranton
Crewe T
oll
Telford
Roa
d
Craigle
ith
Ravels
ton D
ykes
Roseb
urn
Phase 1a Phase 1b
Pax
per m
odel
led
perio
dBoardersAlightersCapacity 6tph/12tphLoad
FIGURE 7.2 PHASE 1A+1B 2011 AM PEAK WESTBOUND FLOW
0
1,000
2,000
3,000
4,000
5,000
6,000
7,000
8,000
9,000
10,000
Airport
Inglist
on P
+R
Gogarb
urn Gyle
Edinbu
rgh Park
Edinbu
rgh Park
Station
South
Gyle
Saugh
ton
Balgree
n
Murray
field
Haymark
et
Shand
wick Plac
e
Prince
s Stre
et
St.And
rew Squ
are
Picady
Plac
e
McDon
ald R
oad
Balfou
r Stre
et
Foot o
f the W
alk
Consti
tution
Stre
et
Ocean
Driv
e
Ocean
Term
inal
Newha
ven
Granto
n Squ
are
Granto
n Wate
rfron
t
Carolin
e Park
West G
ranton
Crewe T
oll
Telford
Roa
d
Craigle
ith
Ravels
ton D
ykes
Phase 1a Phase 1b
Pax
per m
odel
led
perio
d
BoardersAlightersCapacity 6tph/12tphLoad
7.99 The busiest direction in the AM peak hour is Westbound, which can be met with a tram service frequency of 6 tph on the Airport branch combined with 6 tph on the Granton branch to provide 12 tph on the combined section.
7.100 This tram service frequency is applied in 2011 when the Edinburgh Tram Network opens and for the first four years of operation. It operates as shown in Figure 7.3 with the services on the common section terminating at Newhaven and Ocean Terminal to ensure services can be turned back efficiently and consistently.

Edinburgh Tram Network STAG 2 Appraisal
C:\Documents and Settings\rfineman\My Documents\Edinburgh Tram STAG 2 compilation MASTER v7 (2).doc
85
FIGURE 7.3 TRAM OPERATING PATTERN IN 2011
7.101 The JRC model for 2031, as shown in Figure 7.4 and Figure 7.5 for eastbound and westbound respectively, show that there is significant growth in passenger demand arising from both specific developments along the tram corridors and across the whole integrated network.
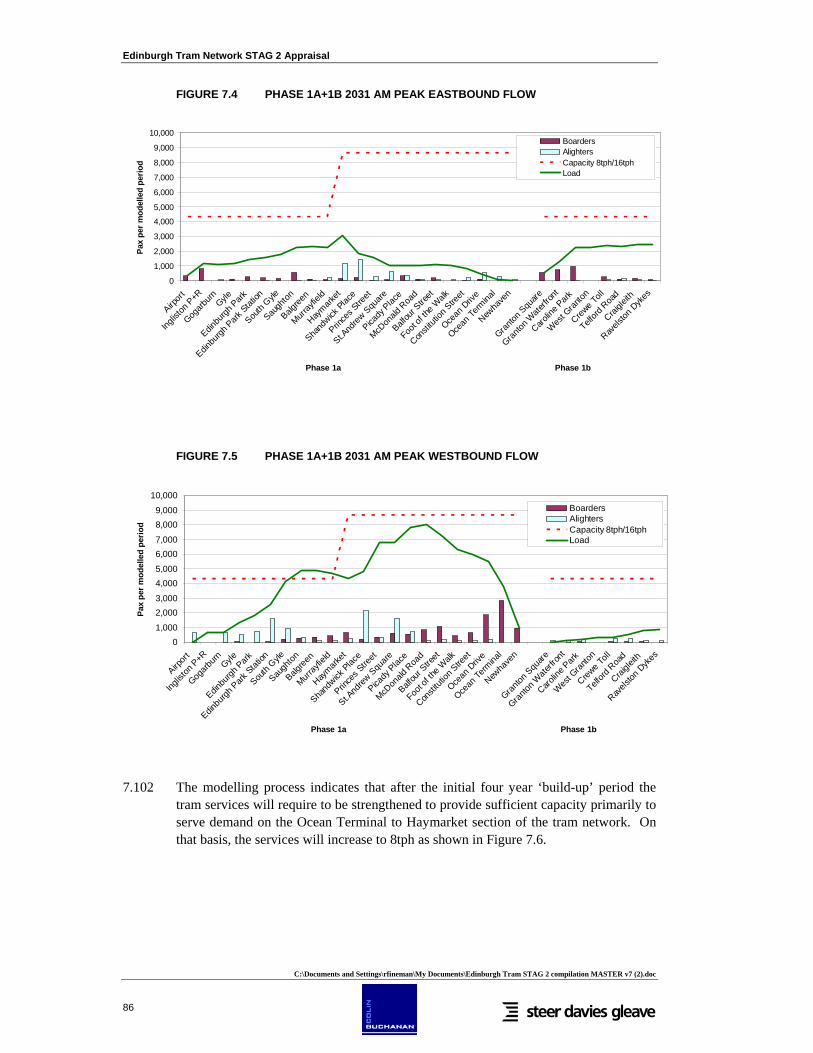
Edinburgh Tram Network STAG 2 Appraisal
C:\Documents and Settings\rfineman\My Documents\Edinburgh Tram STAG 2 compilation MASTER v7 (2).doc
86
FIGURE 7.4 PHASE 1A+1B 2031 AM PEAK EASTBOUND FLOW
0
1,000
2,000
3,000
4,000
5,000
6,000
7,000
8,000
9,000
10,000
Airport
Inglist
on P
+R
Gogarb
urn Gyle
Edinbu
rgh Park
Edinbu
rgh Park
Station
South
Gyle
Saugh
ton
Balgree
n
Murray
field
Haymark
et
Shand
wick Plac
e
Prince
s Stre
et
St.And
rew S
quare
Picady
Place
McDon
ald R
oad
Balfou
r Stre
et
Foot o
f the W
alk
Consti
tution
Stre
et
Ocean
Driv
e
Ocean
Term
inal
Newha
ven
Granto
n Squ
are
Granton
Wate
rfron
t
Carolin
e Park
West G
ranton
Crewe T
oll
Telford
Roa
d
Craigle
ith
Ravels
ton D
ykes
Phase 1a Phase 1b
Pax
per m
odel
led
perio
dBoardersAlightersCapacity 8tph/16tphLoad
FIGURE 7.5 PHASE 1A+1B 2031 AM PEAK WESTBOUND FLOW
01,000
2,0003,000
4,0005,000
6,0007,000
8,0009,000
10,000
Airport
Inglis
ton P
+R
Gogarb
urn Gyle
Edinbu
rgh Park
Edinbu
rgh P
ark Stat
ion
South
Gyle
Saugh
ton
Balgree
n
Murray
field
Haymark
et
Shand
wick P
lace
Prince
s Stre
et
St.And
rew Squ
are
Picady
Place
McDon
ald R
oad
Balfou
r Stre
et
Foot o
f the W
alk
Consti
tution
Stre
et
Ocean
Driv
e
Ocean
Term
inal
Newha
ven
Granto
n Squ
are
Granto
n Wate
rfron
t
Carolin
e Park
West G
ranto
n
Crewe T
oll
Telford
Roa
d
Craigle
ith
Ravels
ton D
ykes
Phase 1a Phase 1b
Pax
per m
odel
led
perio
d
BoardersAlightersCapacity 8tph/16tphLoad
7.102 The modelling process indicates that after the initial four year ‘build-up’ period the tram services will require to be strengthened to provide sufficient capacity primarily to serve demand on the Ocean Terminal to Haymarket section of the tram network. On that basis, the services will increase to 8tph as shown in Figure 7.6.
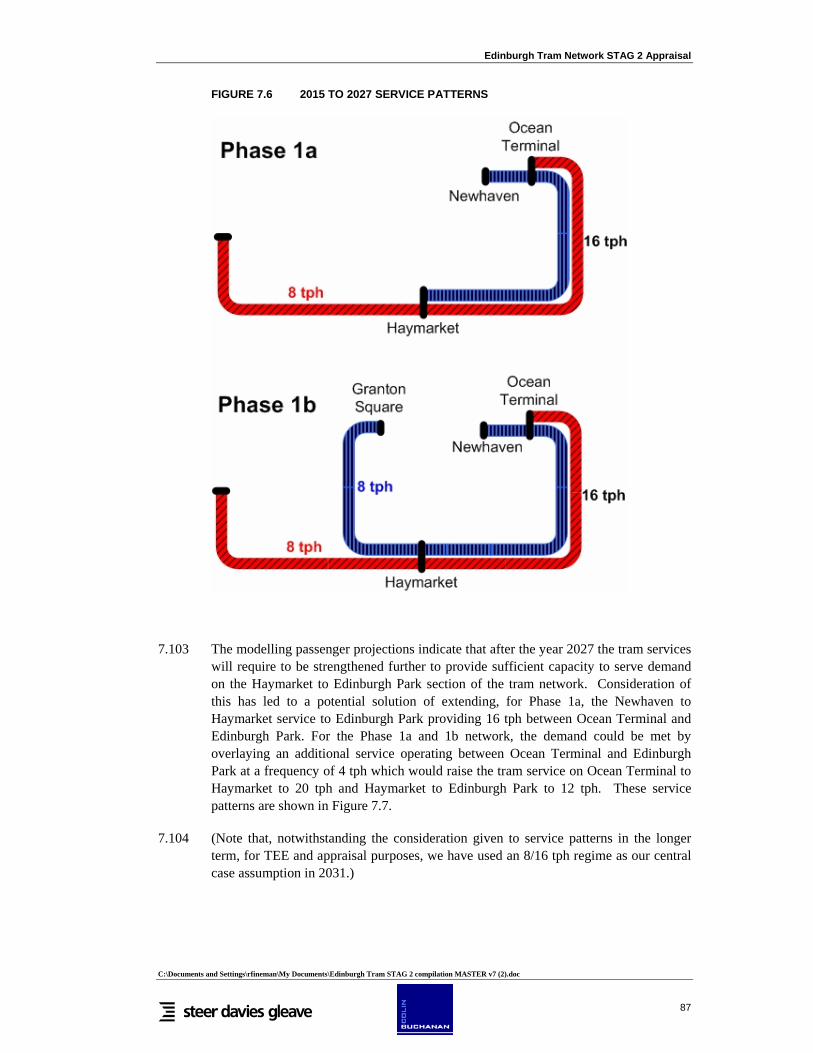
Edinburgh Tram Network STAG 2 Appraisal
C:\Documents and Settings\rfineman\My Documents\Edinburgh Tram STAG 2 compilation MASTER v7 (2).doc
87
FIGURE 7.6 2015 TO 2027 SERVICE PATTERNS
7.103 The modelling passenger projections indicate that after the year 2027 the tram services will require to be strengthened further to provide sufficient capacity to serve demand on the Haymarket to Edinburgh Park section of the tram network. Consideration of this has led to a potential solution of extending, for Phase 1a, the Newhaven to Haymarket service to Edinburgh Park providing 16 tph between Ocean Terminal and Edinburgh Park. For the Phase 1a and 1b network, the demand could be met by overlaying an additional service operating between Ocean Terminal and Edinburgh Park at a frequency of 4 tph which would raise the tram service on Ocean Terminal to Haymarket to 20 tph and Haymarket to Edinburgh Park to 12 tph. These service patterns are shown in Figure 7.7.
7.104 (Note that, notwithstanding the consideration given to service patterns in the longer term, for TEE and appraisal purposes, we have used an 8/16 tph regime as our central case assumption in 2031.)

Edinburgh Tram Network STAG 2 Appraisal
C:\Documents and Settings\rfineman\My Documents\Edinburgh Tram STAG 2 compilation MASTER v7 (2).doc
88
FIGURE 7.7 2028 ONWARDS TRAM SERVICE PATTERNS
7.105 The first and last tram services and frequencies for 6 & 12 tram per hour scenario are shown in Table 7.4 and for 8 & 16 tram per hour scenario in Table 7.5. These scenarios are based upon the following assumptions and conditions:
• A basic frequency of 6 or 8 trams per hour per service (combined to give a total of 12 or 16 trams per hour) is required during the daytime to replace withdrawn bus services (and therefore demand and capacity) on Leith Walk.
• Short workings between Edinburgh Airport/Granton Square and St. Andrew Square are based on the ability to turn trams at St Andrew Square. The precise location and feasibility of the turnback is currently under review.
• Edinburgh Airport service tram frequency is ramped up/down from Ocean Terminal. Granton Square or Haymarket service tram frequency is ramped up/down from Newhaven.
• Trams going into service between Gogar depot and Ocean Terminal / Newhaven will run “in service” from the Gyle (first tram Gyle to Ocean Terminal approx. 05:15).
• Haymarket or Granton Square service trams going out of service running between

Edinburgh Tram Network STAG 2 Appraisal
C:\Documents and Settings\rfineman\My Documents\Edinburgh Tram STAG 2 compilation MASTER v7 (2).doc
89
Newhaven and Gogar depot will run “in service” as far as the Gyle. • Edinburgh Airport service trams going out of service will run “in service” from
Ocean Terminal to Edinburgh Airport with a short “dead run” from Edinburgh Airport to Gogar depot.
• The period of time between the last tram returning to the depot at night and the first tram leaving the depot in the morning is about 4hrs 30 min. Consequently the maintenance window will allow work on the system infrastructure for about 3 hours and 45 minutes, depending on location each night and allowing time for the implementation and withdrawal of isolations.
• Service proposals are based on the requirement to always have a tram present at the Airport tramstop.

Edinburgh Tram Network STAG 2 Appraisal
C:\Documents and Settings\rfineman\My Documents\Edinburgh Tram STAG 2 compilation MASTER v7 (2).doc
90
TABLE 7.4 FIRST & LAST TRAM SERVICES AND FREQUENCIES FOR 6 & 12 TRAM PER HOUR SCENARIO
first tram 06:00 06:45 07:00 07:20 23:15
last tram 23:59
1a Airport to Ocean Terminal 0 6 6 6 6a 01a Ocean Terminal to Airport 6 6 6 6 6 01a Haymarket to Newhaven 0 0 6 6 0 01a Newhaven to Haymarket 0 0 0 6 0 0
1b Airport to Ocean Terminal 0 6 6a 01b Ocean Terminal to Airport 6 6 6 01b Granton to Newhaven 0 6 6b 01b Newhaven to Granton 6 6 6c 0
first tram 06:00 06:45 07:30 07:50 23:15
last tram 23:59
1a Airport to Ocean Terminal 0 6 6 6 6a 01a Ocean Terminal to Airport 6 6 6 6 6 01a Haymarket to Newhaven 0 0 6 6 0 01a Newhaven to Haymarket 0 0 0 6 0 0
1b Airport to Ocean Terminal 0 6 6a 01b Ocean Terminal to Airport 6 6 6 01b Granton to Newhaven 0 6 6b 01b Newhaven to Granton 6 6 6c 0
first tram 06:00 06:45 08:00 08:20 23:15
last tram 23:59
1a Airport to Ocean Terminal 0 6 6 6 6a 01a Ocean Terminal to Airport 6 6 6 6 6 01a Haymarket to Newhaven 0 0 6 6 0 01a Newhaven to Haymarket 0 0 0 6 0 0
1b Airport to Ocean Terminal 0 6 6a 01b Ocean Terminal to Airport 6 6 6 01b Granton to Newhaven 0 6 6b 01b Newhaven to Granton 6 6 6c 0
Notes:a f rom approx 23:15 trams run f rom A irport - City Centre onlyb f rom approx 23:15 trams run f rom Granton - City Centre onlyc f rom approx 23:15 Granton trams run f rom New haven - Haymarket continuing in service on TL2 to Gyle
Netw ork / Phasing
Service frequency commencing at:
Sunday (trams per hour)
Netw ork / Phasing
Service frequency commencing at:
Monday - Friday (trams per hour)
Netw ork / Phasing
Service frequency commencing at:
Saturday (trams per hour)
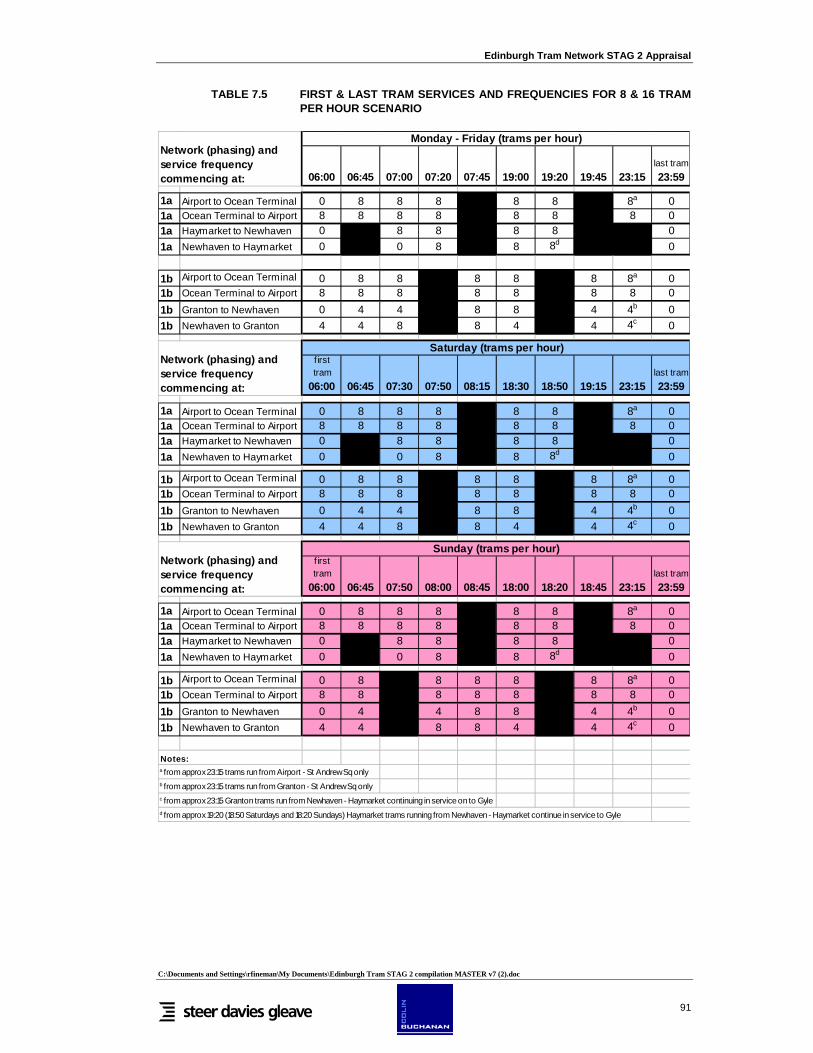
Edinburgh Tram Network STAG 2 Appraisal
C:\Documents and Settings\rfineman\My Documents\Edinburgh Tram STAG 2 compilation MASTER v7 (2).doc
91
TABLE 7.5 FIRST & LAST TRAM SERVICES AND FREQUENCIES FOR 8 & 16 TRAM PER HOUR SCENARIO
06:00 06:45 07:00 07:20 07:45 19:00 19:20 19:45 23:15last tram 23:59
1a Airport to Ocean Terminal 0 8 8 8 8 8 8a 01a Ocean Terminal to Airport 8 8 8 8 8 8 8 01a Haymarket to Newhaven 0 8 8 8 8 01a Newhaven to Haymarket 0 0 8 8 8d 0
1b Airport to Ocean Terminal 0 8 8 8 8 8 8a 01b Ocean Terminal to Airport 8 8 8 8 8 8 8 01b Granton to Newhaven 0 4 4 8 8 4 4b 01b Newhaven to Granton 4 4 8 8 4 4 4c 0
first tram
06:00 06:45 07:30 07:50 08:15 18:30 18:50 19:15 23:15last tram 23:59
1a Airport to Ocean Terminal 0 8 8 8 8 8 8a 01a Ocean Terminal to Airport 8 8 8 8 8 8 8 01a Haymarket to Newhaven 0 8 8 8 8 01a Newhaven to Haymarket 0 0 8 8 8d 0
1b Airport to Ocean Terminal 0 8 8 8 8 8 8a 01b Ocean Terminal to Airport 8 8 8 8 8 8 8 01b Granton to Newhaven 0 4 4 8 8 4 4b 01b Newhaven to Granton 4 4 8 8 4 4 4c 0
first tram
06:00 06:45 07:50 08:00 08:45 18:00 18:20 18:45 23:15last tram 23:59
1a Airport to Ocean Terminal 0 8 8 8 8 8 8a 01a Ocean Terminal to Airport 8 8 8 8 8 8 8 01a Haymarket to Newhaven 0 8 8 8 8 01a Newhaven to Haymarket 0 0 8 8 8d 0
1b Airport to Ocean Terminal 0 8 8 8 8 8 8a 01b Ocean Terminal to Airport 8 8 8 8 8 8 8 01b Granton to Newhaven 0 4 4 8 8 4 4b 01b Newhaven to Granton 4 4 8 8 4 4 4c 0
Notes:a from approx 23:15 trams run from Airport - St Andrew Sq onlyb from approx 23:15 trams run from Granton - St Andrew Sq onlyc from approx 23:15 Granton trams run from Newhaven - Haymarket continuing in service on to Gyled from approx 19:20 (18:50 Saturdays and 18:20 Sundays) Haymarket trams running from Newhaven - Haymarket continue in service to Gyle
Sunday (trams per hour)
Network (phasing) and service frequency commencing at:
Network (phasing) and service frequency commencing at:
Network (phasing) and service frequency commencing at:
Monday - Friday (trams per hour)
Saturday (trams per hour)

Edinburgh Tram Network STAG 2 Appraisal
C:\Documents and Settings\rfineman\My Documents\Edinburgh Tram STAG 2 compilation MASTER v7 (2).doc
92
Capital and operating costs
Capital costs
7.106 The Project Estimate for capital works has been updated for the completion of the Preliminary Design Stage of the Project. The estimate for the various elements has been prepared on the following basis:
• Project management, administration and supervision costs – a costed resource plan for the project delivery structure based on a delivery into revenue service date of summer 2011 plus project overhead costs (accommodation and IT etc)
• Design costs – the fixed price design contract with SDS plus changes thereto. • Utility Diversions – A measured estimate applying rates derived from the contract
awarded to quantities derived from the preliminary design drawings plus the quotes obtained for the diversion of other utilities outside the scope of the awarded contract.
• Tram vehicles supply and commissioning – An allowance based on the returned tenders for the tram supply and commissioning contract.
• Infrastructure provision - A measured estimate applying rates from specialist consultants (SDS and Cyril Sweet Limited) to quantities derived from the preliminary design drawings
• Risk allowance – A quantified risk assessment applied to risks identified from risk workshops with designers and commercial personnel.
• Optimism bias – By applying the standard process.
7.107 This estimate has been reviewed by a peer group selected from senior members within the project to confirm the robustness of the estimate.
7.108 The capital costs for Edinburgh Tram are presented in Table 7.6.
TABLE 7.6 EDINBURGH TRAM CAPITAL COSTS (2006 PRICES)
Item Cost (£m)
Scheme 1a + 1b Costs
Out-turn costs, assuming 6% construction price inflation 499
Of which
Risk and optimism bias component 81
% risk and OB 16%
Total – out-turn – Scheme 1a + 1b Costs 580
Total – out-turn – Scheme 1a only 495
Note: These were the capital costs at the point of a ‘freeze’ in their development. Further work has since been done on costs, resulting in marginal changes, the results of which are reflected in tie’s Financial Business Plan. The differences have a relatively marginal impact on the economic appraisal, the results of which are available in a technical note.
Lifecycle costs
7.109 The Life Cycle Cost models have been developed to reflect a total system working Life cycle of 60 years. Within this, two aspects of life cycle have been modelled:

Edinburgh Tram Network STAG 2 Appraisal
C:\Documents and Settings\rfineman\My Documents\Edinburgh Tram STAG 2 compilation MASTER v7 (2).doc
93
• Planned Renewal - replacement/renewal of systems/sub systems at the end of their anticipated life expectancy
• Day-to-day – daily maintenance and operational maintenance of systems/sub systems which may include replacement of defective minor components
7.110 Planned renewal will take place at pre determined time intervals dictated by the specified performance criteria of the individual system. In addition, planned refurbishment of major systems has been considered for the Tram Fleet in order to achieve the required overall 30 year life span for these units. This refurbishment, undertaken at 15 year intervals would cover livery, upholstery, motors, pantographs, etc. At 30 years service the complete tram unit is replaced.
7.111 The Life Cycle Models adopt a structure consistent with that used in estimating the capital costs, identifying particular systems and sub systems for analysis in the model. The models then make use of the base line cost information to provide life cycle cost information against the system and sub system headings therein. This information is augmented with additional knowledge derived from tram projects which are already operational in the UK and Ireland.
7.112 Within each element of this structure the systems identified have been analysed and basic assumptions made regarding annual, day-to-day maintenance items and planned replacement items. Generally, day-to-day maintenance includes for such items as daily inspection, cleaning, standard daily maintenance regimes, etc. Assumptions regarding replacement of components take into consideration the frequency of replacement and the percentage of the base quantity that may require replacement.
Operating costs
7.113 Operating costs are a significant component in the economic and financial assessment of the business case. The main tram operating costs estimates have been developed by the appointed operator, TRANSDEV, based on the cost model prepared for the DPOFA. Key operating costs outside the DPOFA are Electricity, Insurance and Marketing costs. All operating cost projections, including the ones provided by TRANSDEV, have undergone an iterative process of evaluation, involving input from TEL and benchmarking against other UK tram schemes.
7.114 The operating costs cover day to day costs which will be incurred in the running of the ETN, and include the operator’s management fee. The costs are driven by the operating requirements of the different service patterns which will be implemented during the life of the ETN to meet travel demand. The service pattern assumptions are fully aligned to the service integration plan for TEL tram and TEL bus.
7.115 The largest single component is staff costs, with drivers and inspectors comprising around 50% of the total operating costs. These costs are part of the TRANSDEV cost projection model and are pegged against current TEL bus driver rates.
7.116 The other largest single costs item is electricity which represents some 10% of the operating cost for trams. As there are high uncertainties around the future change in the underlying energy prices, real cost inflation has been applied to the projections. Electricity does not form part of the agreement with TRANSDEV.
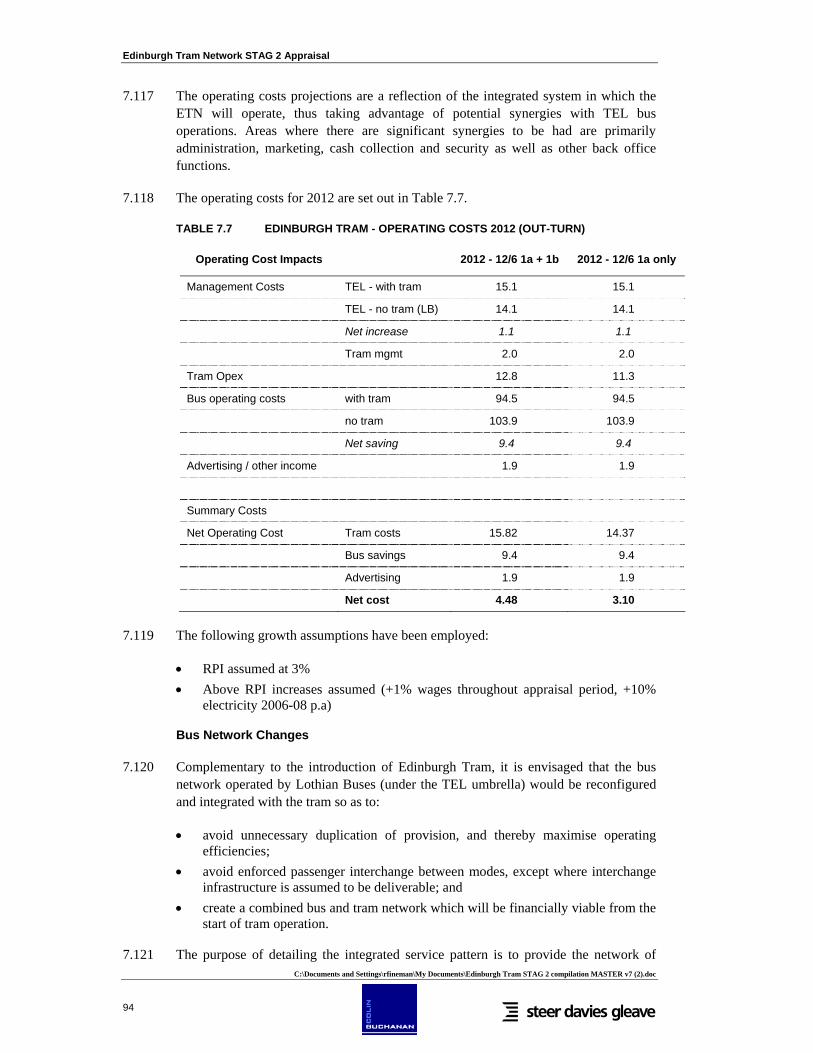
Edinburgh Tram Network STAG 2 Appraisal
C:\Documents and Settings\rfineman\My Documents\Edinburgh Tram STAG 2 compilation MASTER v7 (2).doc
94
7.117 The operating costs projections are a reflection of the integrated system in which the ETN will operate, thus taking advantage of potential synergies with TEL bus operations. Areas where there are significant synergies to be had are primarily administration, marketing, cash collection and security as well as other back office functions.
7.118 The operating costs for 2012 are set out in Table 7.7.
TABLE 7.7 EDINBURGH TRAM - OPERATING COSTS 2012 (OUT-TURN)
Operating Cost Impacts 2012 - 12/6 1a + 1b 2012 - 12/6 1a only
Management Costs TEL - with tram 15.1 15.1
TEL - no tram (LB) 14.1 14.1
Net increase 1.1 1.1
Tram mgmt 2.0 2.0
Tram Opex 12.8 11.3
Bus operating costs with tram 94.5 94.5
no tram 103.9 103.9
Net saving 9.4 9.4
Advertising / other income 1.9 1.9
Summary Costs
Net Operating Cost Tram costs 15.82 14.37
Bus savings 9.4 9.4
Advertising 1.9 1.9
Net cost 4.48 3.10
7.119 The following growth assumptions have been employed:
• RPI assumed at 3% • Above RPI increases assumed (+1% wages throughout appraisal period, +10%
electricity 2006-08 p.a)
Bus Network Changes
7.120 Complementary to the introduction of Edinburgh Tram, it is envisaged that the bus network operated by Lothian Buses (under the TEL umbrella) would be reconfigured and integrated with the tram so as to:
• avoid unnecessary duplication of provision, and thereby maximise operating efficiencies;
• avoid enforced passenger interchange between modes, except where interchange infrastructure is assumed to be deliverable; and
• create a combined bus and tram network which will be financially viable from the start of tram operation.
7.121 The purpose of detailing the integrated service pattern is to provide the network of
Edinburgh Tram Network STAG 2 Appraisal
C:\Documents and Settings\rfineman\My Documents\Edinburgh Tram STAG 2 compilation MASTER v7 (2).doc
95
services to be coded into the JRC patronage and revenue model and to provide the basis for the operating cost projections for both the bus and tram divisions.
7.122 The following details the proposed pattern of service integration of TEL buses with trams, which has been prepared with input from Transdev and tie.
7.123 The plan for alterations to bus services was based originally on services in operation as at August 2005. It was systematically updated to take account of subsequent network changes such as the introduction of Service X48, operation of which requires 8 buses. Assumptions were then made on future changes which could be necessitated by specific, known developments in the period 2006-2011. These changes were then taken into account in the final service integration plan.
7.124 The bus service changes proposed have been used to calculate operating cost savings which would arise on the introduction of trams.
Phase 1a
7.125 Both the 6/12 and 8/16 frequency options are based on big trams (capacity c265). On the basis of a capacity ratio of 2.6 buses per big tram, or 2 buses per small tram, both frequency options lead to the same assumption in terms of the consequential changes to the bus network. (In other words, lower frequency with larger trams displaces the same volume of buses as higher frequency with smaller trams.) The planning of service tram service levels was based on matching capacity to demand while assuming that the impact of service frequency on demand would be a secondary effect for marginal changes to a relatively high service level. In practice it is envisaged that variant service patterns could be created (without additional fleet requirement) in order to address particular peak period capacity issues that may emerge with time.
7.126 The primary objective of the Service Integration Plan is to derive a combined network which is financially viable from the start. In view of the lead time for ordering more trams, the difficulty in purchasing small numbers and the likely unavailability of small numbers of trams to the same specification as those already in the fleet, the need to provide capacity for future growth has led to the decision to procure larger trams as well as to procure sufficient vehicles at the outset to provide an 8/16 tram per hour service pattern when required.
7.127 The main scope for reducing bus service provision is where the tram route runs parallel or very close to existing bus routes. Where the tram route follows a different alignment, along which or in the vicinity of which there are no existing bus routes, there will be no reduction as bus service reductions are assumed only where the tram offers an acceptable replacement facility. The tram route varies in its proximity to bus routes, hence the changes to bus services also vary according to the sections of tram route. These can be summarised as follows:
Ocean Terminal – Foot of Leith Walk
7.128 The section of tramline between Ocean Terminal and Bernard Street, via the Docks and Ocean Drive, does not closely mirror or replace any existing bus route. Hence bus services on this section will be maintained, feeding into the tram at the foot of Leith Walk.

Edinburgh Tram Network STAG 2 Appraisal
C:\Documents and Settings\rfineman\My Documents\Edinburgh Tram STAG 2 compilation MASTER v7 (2).doc
96
Foot of Leith Walk – St Andrew Square
7.129 This section offers great potential for bus service reductions. On a rule of thumb bus:tram ratio of 2.6 to 1, for every 1 tram per hour, the objective is to take out 2.6 buses per hour. Table 7.8 shows current inter-peak buses per hour and the volume reductions that it is hoped will be achievable.
TABLE 7.8 LEITH WALK BUS AND TRAM HOURLY FREQUENCIES
Route Current Proposed Change
Tram 0 12 +12
(32 bus equivalent)
7 6 6 0
10 6 0 -6
12 4 0 -4
14 4 4 0
16 6 6 0
22 12 0 -12
25 6 0 -6
49 3 3 0
Total bus 47 19 28
7.130 Service 16 will be retained in order to preserve a limited number of buses linking Leith Walk with Princes Street.
7.131 This shows that the target bus volume reduction is virtually identical to the volume currently operating the full length of the Leith Walk – Princes Street axis. For that reason, Services 10, 12, 22 and 25 will be removed from Leith Walk. As most Princes Street / Leith Walk bus services are replaced by tram, the remaining buses on Leith Walk run on the Leith Walk – Bridges – ERI axis, as the tram will not offer a service on this corridor.
7.132 This proposal assumes high-quality interchanges are deliverable at the foot of Leith Walk and at St Andrew Square. The ‘interchanges’ section below expands on implications for bus services which are truncated at both St Andrew Square and the foot of Leith Walk.
St Andrew Square – Haymarket
7.133 The scope for reducing bus volumes on this section, which largely comprises Princes Street, is limited as the tram route does not offer any substantial cross-city link currently offered by bus. This means that, while most routes serving Leith Walk can be removed from Leith Walk, because the western or southern ends of those routes are not replaced by trams, they still need to traverse Princes Street.
7.134 For example, passengers travelling from, say, the Fairmilehead / Morningside / Bruntsfield corridor cannot be expected to transfer on to tram at the West End to complete their journey to, say, Waverley, as there is no suitable tram stop expected at
Edinburgh Tram Network STAG 2 Appraisal
C:\Documents and Settings\rfineman\My Documents\Edinburgh Tram STAG 2 compilation MASTER v7 (2).doc
97
the West End, nor is there space to locate an interchange. In any case, it is not considered a sensible option to introduce an enforced interchange for the very large numbers of passengers who would be affected only a very short distance from their trip destination or origin; neither would it be sensible to decant bus passengers at the foot of Lothian Road and expect them to walk along Princes Street.
7.135 For these reasons, the potential for reduction in buses on Princes Street itself comprises the reduction in frequencies of Services 22 and 100.
Haymarket – Airport
7.136 There are two facilities offered by the tram which yield the potential to reduce significantly the volume of bus service provision:
• Airport – City Centre passenger demand • The section of route from Broomhouse to Saughton Mains, currently comprising
the Fastlink guided busway
7.137 As far as the Airport is concerned, it is assumed that many passengers who currently use Airlink 100 will transfer to the tram. Those who will definitely not do so are those who use Airlink to travel between the Airport and points not served by the tram, namely all stops between Maybury and Wester Coates. To serve those passengers, a reduced-frequency Airlink will continue to run. For passengers travelling between the Airport and the Haymarket – Waverley section, the majority are assumed to choose the tram. The working assumption for present purposes is that the volume of service on Airlink will be cut by at least 50% to 4 per hour though this can be reviewed further.
7.138 As far as the Fastlink section between Broomhouse and Saughton Mains is concerned, it is assumed that virtually all passengers travelling between this section and Princes Street will switch to the tram. This volume of demand is, however, a relatively small proportion of the total demand on the existing service (22). Hence, a reduction in Service 22 frequency has been assumed. (The northern half of the 22 is withdrawn in toto between St. Andrew Square and the foot of Leith Walk.)
7.139 As far as the other Fastlink service (the 2) is concerned, it offers no links which will be provided by the tram, so no reduction in provision on Service 2 is assumed.
7.140 Specifically, the following heavily used sections of the 22 do not offer any potential for tram substitution:
• Lothian Road – Fountainpark – Westfield – Stenhouse • Broomhouse – South Gyle Crescent – Edinburgh Park
7.141 Between Lothian Road and Stenhouse, the existing Service 22 follows a route which is outside an acceptable walking distance from the tram stops (with the exception of the East Whitson area, from where residents can access the tram stop at Balgreen Halt via the Balgreen Road pedestrian tunnel). While the reduction in Service 22 frequency referred to above will affect this section of route, there is unlikely to be any further impact on bus services on this section.
7.142 Between Broomhouse and Edinburgh Park, the bus route crosses under the railway

Edinburgh Tram Network STAG 2 Appraisal
C:\Documents and Settings\rfineman\My Documents\Edinburgh Tram STAG 2 compilation MASTER v7 (2).doc
98
line and serves South Gyle Crescent and Redheughs Avenue. There is only one walking link between the tram stops south of the railway to South Gyle Crescent, and no tram stops will be within acceptable walking distance of Redheughs Avenue. The tram does not therefore affect the bus services on this section, so no changes are assumed, other than the frequency reduction on the 22 resulting from modal transfer on the Broomhouse / Saughton Mains section.
Bus network changes
7.143 The proposed bus network changes are set out in Table 7.9.
TABLE 7.9 BUS NETWORK CHANGES
Route Currently Proposed
10 Torphin – Newhaven Torphin – St. Andrew Square
12 Gogarburn – The Jewel Gogarburn – St. Andrew Square. Section between The Jewel and between King’s Road and Foot of Leith Walk replaced by new Service 40
16 Colinton – Silverknowes Colinton – Silverknowes but diverted via Henderson St to replace service 22
21 Gyle – Duke Street Gyle – Restalrig
22 Gyle – Ocean Terminal
Gyle – Leith Street at reduced frequency. Replaced between Ocean Terminal and Foot of Leith Walk by diversion of Services 16 and 35 via Commercial Street, Shore and Henderson Street
25 Riccarton – Restalrig Riccarton – Leith Street. Section between Restalrig and Foot of Leith Walk replaced by Service 21, terminating at Restalrig
32 Clovenstone – RIE Clovenstone – Kings Road Replaced between King’s Road and RIE by new service 40
35 Airport – Ocean Terminal Airport – Ocean Terminal, but diverted via Henderson Street, Shore and Commercial Street to replace Service 22
40 n/a
New service, Ocean Terminal – RIE, to replace Service 22 on Shore, service 12 via between Foot of Leith Walk and The Jewel and service 32 between Kings Road and RIE
100 Airport – Waverley Frequency reduced to every 15 mins
Phase 1b
7.144 Under Phase 1b, the trams planned to terminate at Haymarket under Phase 1a will extend to Granton Waterfront. As this section does not run parallel to any bus routes, it does not lead to bus service withdrawals. However, during the parliamentary process, a commitment was given to the effect that feeder buses would be provided linking Crewe Toll with the Western General Hospital. The feeder service will take the form of simply providing interchange at Crewe Toll with existing bus services or with a free-standing shuttle bus service. Such a service will cost two buses to operate.
Interchanges

Edinburgh Tram Network STAG 2 Appraisal
C:\Documents and Settings\rfineman\My Documents\Edinburgh Tram STAG 2 compilation MASTER v7 (2).doc
99
Foot of Leith Walk (Phase 1a)
7.145 This interchange is the key to being able to curtail bus routes at the northern end of Leith Walk. Without it, there is no practical way in which buses approaching the foot of Leith Walk from Great Junction Street or Duke Street can be curtailed such that they no longer continue up Leith Walk. An effective interchange at this location must be delivered. Otherwise, bus volume reductions on Leith Walk (and the consequential cost savings) will not be realised. As the numbers of passengers involved in what will be enforced modal interchange is significant, a high quality of design, minimising both walking distances and waiting times, must be achieved.
7.146 On the assumption that a sufficiently good design can and will be delivered, a network design was developed which matches routes curtailed at Great Junction Street with routes curtailed at Duke Street, so they can be linked into through routes, thereby reducing what would otherwise be an absolute requirement to accommodate terminating buses at this awkward location. This design has subsequently been modified to retain a limited number of buses per hour linking Leith Walk with Princes Street to ensure that those with restricted mobility have an alternative to enforced interchange.
St Andrew Square (Phase 1a)
7.147 An interchange at the east end of the city centre is also required to accommodate buses reaching the city centre from points west and south of the West End which currently continue via Leith Walk. These are the routes which need to be truncated in order to achieve modal transfer on Leith Walk. Various options have been considered and a design arrived at which accommodates the following:
• provision for passenger interchange between bus and tram; and • provision for terminating buses and essential layover.
Crewe Toll (Phase 1b)
7.148 This interchange is necessary to accommodate the provision of the feeder buses linking the tram route to the Western General Hospital. A free-standing shuttle bus may be provided to meet this requirement for feeder buses or existing bus services 29 and 37 may be sufficient.
Operator competition
7.149 A third party operator response to the service integration plan which resulted in the introduction of new bus services competing with the TEL network (where changes have been made to integrate bus and tram) would necessitate a revision to this plan. However, the assessment at present is that the current plan does not open up gaps for such an operator to exploit, provided crucially that the interchange infrastructure referred to above is provided.


Edinburgh Tram Network STAG 2 Appraisal
C:\Documents and Settings\rfineman\My Documents\Edinburgh Tram STAG 2 compilation MASTER v7 (2).doc
101
8. THE DO-MINIMUM AND REFERENCE CASE
Introduction
8.1 The appraisal of any transport scheme is usually made against a Do-Minimum situation, the situation that would exist without the transport scheme under consideration. The Do-Minimum normally includes only committed schemes, essentially all schemes and proposals under construction or for which statutory powers exist to develop the proposal and the funding mechanism has been approved or funding is available.
8.2 There are occasions, however, where this approach may not be appropriate and where some consideration of probable changes to the transport network beyond this are appropriate; such a scenario is typically referred to as a Reference Case.
8.3 As part of the demand forecasting and appraisal process for Edinburgh Tram, a thorough and robust review of planning opportunities has been undertaken involving CEC planners in conjunction with the stakeholders group. The results show that strong growth in population, employment and the economy is expected, placing the transport network under increasing strain.
8.4 This Chapter therefore examines whether a Reference Case is a more appropriate comparator for Edinburgh Tram. In summary, this Chapter:
• describes the Do-Minimum and sets out the appraisal of Edinburgh Tram against this Do-Minimum;
• develops the definition and rational of the Reference Case and sets out the performance of the Reference Case against the Do-Minimum in appraisal terms, to understand more about the validity of the Reference Case; and
• provides an appraisal of Edinburgh Tram against this Reference Case.
8.5 Such incremental appraisals are a requirement of STAG guidance. The appraisals presented focus on the Transport Economic Efficiency appraisal and the associated Cost to Government analysis.
EARL
8.6 In each of these three appraisals, EARL has been excluded. This scheme is currently passing through the Parliamentary Bill process and thus has no formal legal status, nor has funding been approved. However, EARL is in Transport Scotland’s Priority List and hence for the main appraisal of Edinburgh Tram set out in the next Chapter, EARL has been added to the Reference Case.
Edinburgh Tram
8.7 The changes to the transport network modelled to represent Edinburgh Tram for Phase 1a are as follows:
• A tram service running between Edinburgh Airport and Ocean Terminal via the City Centre at 6tph in 2011 and 8tph in 2031, and a service running from Haymarket to Newhaven, also at 6tph in 2011 and 8tph in 2031 (making 12tph

Edinburgh Tram Network STAG 2 Appraisal
C:\Documents and Settings\rfineman\My Documents\Edinburgh Tram STAG 2 compilation MASTER v7 (2).doc
102
and 16tph respectively in total on the section between Haymarket and Ocean Terminal) ;
• Fares parity with buses; • Bus network changes as set out in Chapter 7; and • Associated remodelling of the highway network to accommodate tram, including
closure of Shandwick Place to general traffic, the signalisation and reconfiguration of Picardy Place roundabout and the banning of right turns on Leith Walk.
8.8 For Phase 1a+1b, the definition is as per Phase 1a, but with the tram service terminating at Haymarket extended to Granton.
Do-Minimum definition
2011
8.9 The 2011 Do-Minimum changes from the 2005 Base are concentrated on public transport, as follows:
• Additional rail services Airdrie - Bathgate Stirling – Alloa – Kincardine Glasgow Airport Rail Link Borders Rail Link
• Revised / Additional bus services Revisions to routes/frequencies for services 1, 7, 8, 10, 11, 12, X12, 14, 15,
16, 17, 21, 22, 25, 30, 32, 34, 35, 37, 37A (withdrawn), 47, X47, X48, 49, 100 using information supplied by Lothian Buses.
Expansion of Ingliston Park and Ride site to 1500 spaces (from current 535 spaces)
80p bus fares removed Bus timetabled journey times as well as reliability have been assumed to be
as in the base year (2005).
2031
8.10 The Do-Minimum specification for 2031 is as for 2011, with the addition of the following:
• Additional bus services 14A (as 14 south of the foot of Leith Walk and serving the Docks north
of this point) 22A (as 22 south of the foot of Leith Walk and serving the Docks north
of this point) 25A (as 25 between Waverley and the foot of Leith Walk. No service
south of Waverley and serving the Docks north of the foot of Leith Walk)
49A (as 49 south of the foot of Leith Walk and serving the Docks north of this point)
Edinburgh Tram Network STAG 2 Appraisal
C:\Documents and Settings\rfineman\My Documents\Edinburgh Tram STAG 2 compilation MASTER v7 (2).doc
103
• Slower bus journey times, with a journey time increment derived from increases to delay at key junctions forecast by 2031;
• The application of a bus in-vehicle time weight to be applied to represent an increase in the standard deviation of journey times equal to 10% of in-vehicle time. This increment is then weighted by 1.3 to reflect the penalty associated with this increase in unreliability53; and
Reference Case definition
8.11 The high demand growth expected in Edinburgh has necessitated a commensurate increase in bus service provision. Because of these significant changes and without accommodating network enhancements, significant uncertainty would exist as to the journey time performance, reliability and operability of buses in the future.
8.12 However, it is the stated policy of CEC that public transport should be supported through the provision of priorities to deliver journey time improvements to bus, and that the policy of maintaining public transport journey time and reliability will continue into the future.
8.13 While bus improvements are usually developed incrementally to meet relatively short term targets and objectives (e.g. priorities to enable bus journey times and reliability to be maintained or improved), the definition of a tram comparator for 2031 requires consideration of what type of measures might be required to deliver fast and reliable bus journey times well into the future.
8.14 Accordingly, a Reference Case has been developed that incorporates measures of the scale and type it is believed will be present in 2031, which will facilitate the accommodation of increased bus services and maintain their current levels of journey times and reliability. In essence, it is reasoned that such a Reference Case provides a more credible and realistic assessment of transport network conditions in 2031, than a Do-Minimum does.
8.15 It is not intended actually to represent a committed masterplan for traffic management; instead it is to illustrate the appraisal of the scheme against a more credible background of highway network performance than would be possible with a conventional Do Minimum.
8.16 A Reference Case has therefore been developed, which includes a selection of discrete measures thought to be consistent with the scale and impact of the sort of measures that would be likely in practice. CEC has expressed support for this principle The measures included in the 2031 Reference Case are:
• The banning of right turns on Leith Walk • The implementation of signal priorities in Picardy Place • The closure of Shandwick Place to general traffic.
53 Based on data presented in Table 8.14, The Demand for Public Transport: a practical guide, TRL Report TRL593, TRL, 2004

Edinburgh Tram Network STAG 2 Appraisal
C:\Documents and Settings\rfineman\My Documents\Edinburgh Tram STAG 2 compilation MASTER v7 (2).doc
104
8.17 These measures are equivalent to some of the measures that would be implemented as part of the tram scheme, a mode of transport capable of conveying many more passengers per vehicle than buses.
8.18 Clearly the measures identified in the Reference Case do not represent firm commitments at a scheme level, but they do reflect the scale and type of measure that would be required to deliver CEC’s policy commitments. In transport, these are encapsulated in the Local Transport Strategy (LTS) and the forthcoming draft LTS sets out the policy objectives for bus priorities. This text, set out in Appendix C, supports the implementation of the measures listed in paragraph 8.16 and confirms that the measures proposed accurately reflect the nature and type of scheme that CEC would consider in support of achieving such objectives. It is therefore considered that they are appropriate for the purposes of this appraisal.
8.19 It should also be noted that, were measures not taken to accommodate the necessary levels of public transport service in the future, it is likely that the expected demand growth scenario would not be achieved.
TEE appraisals
8.20 TEE and Cost to Government analysis has been undertaken to illustrate the incremental benefits of moving to a Reference Case comparator for the appraisal of Edinburgh Tram, rather than the more traditional Do-Minimum. The results are set out in Table 8.1. These results include the appraisal of the (Option 1a+1b) scheme against the Reference Case with EARL added and this is the basis for the remainder of the STAG appraisal. The results indicate that, with the Reference Case and EARL in place (both of which are expected to deliver significant benefits in themselves) the Option 1a+1b tram scheme is expected to provide an additional Net Present Value of £273m.
Edinburgh Tram vs Do-Minimum (no EARL)
8.21 Edinburgh Tram delivers strong economic benefits, totalling £1,177m. Of this, some £997m relates to public transport benefits, with highway benefits totalling some £183m. Direct scheme costs are supported by significant public transport revenues accruing to TEL. Overall, a Benefit : Cost ratio of 3.01 is achieved.
8.22 In the 1a only case, benefits are reduced by around 30%-40%, leading to an overall scheme benefit of £719m. Costs fall by a more modest 20%, giving a lower Benefit : Cost ratio of 2.32.
8.23 The appraisal against the formal Do-Minimum, as required by STAG, therefore shows high value for money against Transport Economic Efficiency criteria.

Edinburgh Tram Network STAG 2 Appraisal
C:\Documents and Settings\rfineman\My Documents\Edinburgh Tram STAG 2 compilation MASTER v7 (2).doc
105
TABLE 8.1 APPRAISAL OF EDINBURGH TRAM (FOR 1A+1B CASE UNLESS OTHERWISE STATED)
Economic impacts (£m PV, 2002 prices)
Edinburgh Tram vs
Do-Minimum
(no EARL)
Edinburgh Tram vs
Do-Minimum
(no EARL), 1a only
Reference Case vs
Do-Minimum
(no EARL)
Edinburgh Tram vs
Reference Case (no
EARL)
Edinburgh Tram vs
Reference Case (with
EARL)
PT User Benefits 997 660 1,233 669 657
Highway User benefits 183 103 297 328 72
Private sector provider impacts 10 -9 -118 6 -15
Accident benefits54 -13 -36 -22 -24 -5
Present Value of Scheme Benefits 1,177 719 1,390 980 709
Present Value of Scheme Costs 390 310 -98 424 436
Net Present Value (£ m) 786 409 1,488 556 273
Benefit : Cost Ratio 3.01 2.32 n/a 2.31 1.63
Reference Case vs Do-Minimum (no EARL)
8.24 The appraisal demonstrates that the Reference Case would, as expected, deliver significant benefits to public transport users, equivalent to £1,233m in PV terms. In addition to this, the appraisal suggests that the reference case would also deliver benefits to highway users of £296m PV. This stems from a greater retention of public transport usage in the Reference Case rather than transfer per se, whereas on the Do-Minimum bus journey time increases would encourage greater car use; this effect more than offsets the impact of decreased highway capacity.
8.25 Because the physical measures of the Reference Case are illustrative rather than specific and are expected to be relatively small in scale, cost estimates have not been undertaken. But it is evident that the benefits (including long-term additional revenues to public transport of the Reference Case) are substantial. Were the direct cost to be less than the £98m of monies gained by the Public Sector from an increase in public transport revenues, then the scheme would be financially viable in its own right, leading to an ‘all gain’ Benefit : Cost ratio.
54 The Do-Something scenario includes a higher level of development along the tram corridor than in the Do-Minimum/Reference Case. The effect of this is to increase the overall volume of movements in the ‘with tram’ case, which could potentially include a higher number of car trips than in the ‘no tram’ case even after the switch from car to tram has taken place. The implication of this is that the model and appraisal will be underestimating the positive benefits of Edinburgh Tram associated with changes in highway demand, including road accident benefits. Without tram, it is likely that the developments would take place elsewhere, most likely in peripheral locations with a higher proportion of car usage and longer trip lengths. We are not accounting for the ‘disbenefits’ of this traffic. Overall, therefore, the appraisal of Edinburgh Tram is considered to be on a conservative basis.
Edinburgh Tram Network STAG 2 Appraisal
C:\Documents and Settings\rfineman\My Documents\Edinburgh Tram STAG 2 compilation MASTER v7 (2).doc
106
Edinburgh Tram vs Reference Case (no EARL)
8.26 The move to a Reference case as the comparator for Edinburgh Tram reduces the public transport benefits, to £669m, as a result of the higher bus speeds in the Reference case compared to the Do-Minimum. Conversely, highway benefits increase to £328m, since the definition of the highway networks are similar and hence the impact is more about the benefits of modal shift from highway on those remaining on the highway network.
8.27 The net benefits fall compared to the Do-Minimum appraisal, to £980m. The impact on the Benefit : Cost ratio is higher though, due to an increase in costs due to lower additional public transport revenues accruing to TEL. This arises from the Reference Case capturing the higher public transport share from the maintenance of bus journey times compared to the Do-Minimum. The Benefit : Cost ratio is 2.31.
Summary
8.28 As part of the demand forecasting and appraisal for Edinburgh Tram, a review of planning assumptions has revealed that there is expected to be strong growth in travel demands in the city. This is expected to give rise to a significant increase in bus network provision to accommodate this growth, and commensurate growth in highway traffic levels and hence congestion in a Do-Minimum situation.
8.29 Given the adverse impact this will have bus operations, a Reference case has been developed which seeks to recognise CEC’s policy objectives of mitigating such trends. It is considered that such a Reference Case provides a more robust and credible basis for appraisal than a Do-Minimum.
8.30 This Chapter set out TEE appraisal results for Edinburgh Tram against both a Do-Minimum and a Reference Case, as well as the benefits of moving from a Do-Minimum to a Reference Case. Positive cases have been demonstrated for each of these appraisals. Edinburgh Tram performs best against a Do-Minimum, with a Benefit : Cost ratio of 3.01; against the Reference case, this falls to 2.31. However, it is considered that, whilst lower, this provides a more robust basis for appraisal.
8.31 For the main appraisal of Edinburgh Tram, set out in the next Chapter, EARL is added to the Reference Case.
Edinburgh Tram Network STAG 2 Appraisal
C:\Documents and Settings\rfineman\My Documents\Edinburgh Tram STAG 2 compilation MASTER v7 (2).doc
107
9. STAG PART 2 APPRAISAL
Planning assumptions
Growth
9.1 As part of the demand forecasting and appraisal process for Edinburgh Tram, a thorough and robust review of planning opportunities has been undertaken involving CEC planners in conjunction with the stakeholders group. This has considered the likely range of development possible at the various sites identified and the potential impact that Edinburgh Tram might have on the overall scale of development. The resultant development levels were set out in Chapter 2.
9.2 The Central Case forecasts for Edinburgh Tram presented in this Chapter utilise an associated set of ‘most likely’ planning assumptions. This ensures that the case for tram is robust and credible.
9.3 Growth as far as 2021 is calculated using observed trip making rates, driven by the aforementioned development planning data provided by CEC planning department. Assumptions regarding likely rates of development ‘take-up’ were established through a workshop process with CEC planners and other stakeholders. Growth outside of the City of Edinburgh was based on appropriate local factors from the TEMPRO database.
9.4 The following growth assumptions were then implemented beyond the current planning horizon:
• 2021 – 2031: 2.0% per year; • 2031 – 2041: 1.5% per year; • 2041 – 2051: 1.0% per year; and • 2051 – 2070: No further growth.
9.5 Given the confidence and policy led intention that Edinburgh Tram will stimulate additional development, the Do-Something situation includes a higher level of
This Chapter sets out the STAG Part 2 appraisal for the Edinburgh Tram scheme, essentially appraisal against the five Government objectives in detail, namely:
• Environment; • Safety; • Economy; • Integration; and • Accessibility and Social Inclusion.
The appraisal will be preceded by some commentary on the transport impacts of Edinburgh Tram (such as tram ridership and attendant impacts on bus and car travel) and an appraisal against the planning objectives. Following the Part 2 appraisal, the Cost to Government and STAG Part 2 Appraisal Summary Tables will be presented.

Edinburgh Tram Network STAG 2 Appraisal
C:\Documents and Settings\rfineman\My Documents\Edinburgh Tram STAG 2 compilation MASTER v7 (2).doc
108
development along the tram corridor than in the Do-Minimum/Reference Case. This is focused in the Granton redevelopment area.
The Impact of Land Use
9.6 The Do-Something scenario includes a higher level of development along the tram corridor than in the Do-Minimum/Reference Case. The effect of this is to increase the overall volume of movements in the ‘with tram’ case, which could potentially include a higher number of car trips than in the Do-Minimum even after the switch from car to tram has taken place.
9.7 Without tram, it is likely that the developments would take place elsewhere, most likely in peripheral locations with a higher proportion of car usage and longer trip lengths. While some locally adverse impacts of this relocated traffic are reflected in the appraisal, the benefits of traffic reductions elsewhere (outside of the study area) are not fully accounted for. The implication of this is that the appraisal slightly underestimates the positive benefits of Edinburgh Tram associated with changes in highway demand (such as highway benefits, road accident benefits and noise and air quality).
9.8 Overall, therefore, the appraisal of Edinburgh Tram is considered to be on a conservative basis.
Transport Impacts
9.9 This sections sets out the demand for Edinburgh Tram and the associated impacts on other public transport demand and on the highway network. The information presented here is based on the outputs from the comprehensive computer based JRC transport model; demand forecasts and other outputs from the transport model are used in calculating the economic impacts of the scheme (such as travel time savings), as well as some environmental (such as air quality) and safety impacts (the number of road accidents).
Central Case Definition
9.10 The changes to the transport network modelled to represent Edinburgh Tram are as follows:
• For Phase 1a: A tram service running between Edinburgh Airport and Ocean Terminal via
the City Centre at 6tph in 2011 and 8tph in 2031, and a service running from Haymarket to Newhaven, also at 6tph in 2011 and 8tph in 2031 (making 12tph and 16tph respectively in total on the section between Haymarket and Ocean Terminal) ;
Fares parity with buses; and Bus network changes as set out in Chapter 7.
• For Phase 1a+1b A tram service running between Edinburgh Airport and Newhaven via the
City Centre at 6tph in 2011 and 8tph in 2031 and an additional service between Granton and Ocean Terminal at 6tph in 2011 and 8tph in 2031

Edinburgh Tram Network STAG 2 Appraisal
C:\Documents and Settings\rfineman\My Documents\Edinburgh Tram STAG 2 compilation MASTER v7 (2).doc
109
(making 12tph and 16tph respectively in total on the section between Haymarket and Ocean Terminal);
Fares parity with buses; and Bus network changes as set out in Chapter 7.
Phase 1a transport impacts
9.11 The impact on overall travel demand in Edinburgh and its environs arising from Phase 1a is presented in Table 9.1. The increase in public transport trips is significant, reaching over 4,000 in the 2031 AM Peak period. The impact on car appears mixed, with the peak periods experiencing a reduction, but with a small increase in the Interpeak periods. However, these figures are reflective of the differential planning assumptions for the Reference and Edinburgh Tram cases; the reductions in car travel resulting from the introduction of the tram are obscured by the increases caused by the additional development assumed in the with-tram situation.
TABLE 9.1 TRAVEL DEMAND BY PUBLIC AND PRIVATE TRANSPORT (PHASE 1A)
(Trips per 2-Hour Period) 2011 2031
AM IP AM IP
Reference Case Public transport 94,993 54,707 135,845 80,648
Private car 114,303 72,680 140,042 100,693
Edinburgh Tram Public transport 96,920 55,570 140,115 82,508
Private car 114,068 72,756 139,591 101,114
Differences Public transport 1,927 862 4,270 1,860
Private car -235 76 -451 421
9.12 Table 9.2 presents the aggregate demand by modelled period and year. In the AM peak, the demand is heaviest in the westbound direction; in the Interpeak, the demand is more balanced, with flows not significantly different from the lower directional peak demand. Annual demand is forecast at 10.61 million in 2011 (including a 25% reduction for the ramp up period55), rising to 24.32 million by 2031.
TABLE 9.2 EDINBURGH TRAM PHASE 1A DEMAND
2011 2031 (Trips per 2-Hr Period)
AM IP AM IP
Eastbound 2,689 2,005 3,967 4,331
Westbound 4,041 1,696 11,876 3,956
Total 6,730 3,701 15,843 8,287
Annual (m) 10.61 24.32
55 The ramp up period reflects the fact that the full impacts of a major transport scheme take several years to materialise and therefore a reduction is applied to forecasts to account for this. For Edinburgh Tram, the assumption is 75%, 85%, 92%, 97%, and 99% for the five years from opening. Hence, a reduction of 25% is applied to the forecasts for 2011 to obtain the actual demand expected in the opening year.

Edinburgh Tram Network STAG 2 Appraisal
C:\Documents and Settings\rfineman\My Documents\Edinburgh Tram STAG 2 compilation MASTER v7 (2).doc
110
9.13 The sources of demand for Edinburgh Tram are set out in Table 9.3. As expected, the majority of the demand is accounted for by transfer from bus. Transfer from rail is proportionately smaller, principally being abstraction from EARL and local rail trips to Edinburgh Park, with some growth in other rail trips interchanging to tram. The remainder is accounted for by demand new to public transport, which is equal to 19% and 25% of tram demand in 2011 and 2031 respectively. These proportions are consistent with empirical evidence from existing systems and an increasing share from car is consistent with the higher congestion levels and hence attractiveness of tram expected and forecast in the later year.
TABLE 9.3 IMPACT OF EDINBURGH TRAM ON DEMAND, BY MODE (PHASE 1A)
2011 2031
Bus 8.02 16.66
Rail 0.58 1.66
Mode shift from car / new development 2.01 6.00
Tram 10.61 24.32
9.14 Edinburgh Tram demand profiles for Phase 1a are presented in Figure 9.1 to.Figure 9.8 Key points to note are:
• The peak AM peak demand flow occurs in the westbound direction on Leith Walk, consistent with the overall demand by direction previously reported;
• The general pattern of demand is of boarding approaching the city centre, with alighting in the city centre and beyond;
• The impact of development in the Leith area is evident when comparing the AM Peak westbound boardings in 2011 with 2031; and
• Line capacity is forecast to be exceeded by 2031during the AM peak in the westbound direction.

Edinburgh Tram Network STAG 2 Appraisal
C:\Documents and Settings\rfineman\My Documents\Edinburgh Tram STAG 2 compilation MASTER v7 (2).doc
111
FIGURE 9.1 PHASE 1A 2011 AM PEAK EASTBOUND FLOW
01,0002,0003,0004,0005,0006,0007,0008,0009,000
10,000
Airport
Inglist
on P+R
Gogarb
urn Gyle
Edinbu
rgh Park
Edinbu
rgh Park
Station
South
Gyle
Saugh
ton
Balgree
n
Murray
field
Haymark
et
Shand
wick Plac
e
Prince
s Stre
et
St.And
rew Squ
are
Picady
Place
McDon
ald R
oad
Balfou
r Stre
et
Foot o
f the W
alk
Consti
tution
Stre
et
Ocean
Driv
e
Ocean
Term
inal
Newha
ven
Pax
per m
odel
led
perio
dBoardersAlightersCapacity 6tph/12tphLoad
FIGURE 9.2 PHASE 1A 2011 AM PEAK WESTBOUND FLOW
01,0002,0003,0004,0005,0006,0007,0008,0009,000
10,000
Airport
Inglist
on P+R
Gogarb
urn Gyle
Edinbu
rgh Park
Edinbu
rgh Park
Station
South
Gyle
Saugh
ton
Balgree
n
Murray
field
Haymark
et
Shand
wick Plac
e
Prince
s Stre
et
St.And
rew Squ
are
Picady
Place
McDon
ald R
oad
Balfou
r Stre
et
Foot o
f the W
alk
Consti
tution
Stre
et
Ocean
Driv
e
Ocean
Term
inal
Newha
ven
Pax
per m
odel
led
perio
d
BoardersAlightersCapacity 6tph/12tphLoad

Edinburgh Tram Network STAG 2 Appraisal
C:\Documents and Settings\rfineman\My Documents\Edinburgh Tram STAG 2 compilation MASTER v7 (2).doc
112
FIGURE 9.3 PHASE 1A 2011 INTERPEAK EASTBOUND FLOW
01,0002,0003,0004,0005,0006,0007,000
8,0009,000
10,000
Airport
Inglist
on P+R
Gogarb
urn Gyle
Edinbu
rgh Park
Edinbu
rgh Park
Station
South
Gyle
Saugh
ton
Balgree
n
Murray
field
Haymark
et
Shand
wick Plac
e
Prince
s Stre
et
St.And
rew Squ
are
Picady
Place
McDon
ald R
oad
Balfou
r Stre
et
Foot o
f the W
alk
Consti
tution
Stre
et
Ocean
Driv
e
Ocean
Term
inal
Newha
ven
Pax
per m
odel
led
perio
d
BoardersAlightersCapacity 6tph/12tphLoad
FIGURE 9.4 PHASE 1A 2011 INTERPEAK WESTBOUND FLOW
01,0002,0003,0004,0005,0006,0007,0008,0009,000
10,000
Airport
Inglist
on P+R
Gogarb
urn Gyle
Edinbu
rgh Park
Edinbu
rgh Park
Station
South
Gyle
Saugh
ton
Balgree
n
Murray
field
Haymark
et
Shand
wick Plac
e
Prince
s Stre
et
St.And
rew Squ
are
Picady
Place
McDon
ald R
oad
Balfou
r Stre
et
Foot o
f the W
alk
Consti
tution
Stre
et
Ocean
Driv
e
Ocean
Term
inal
Newha
ven
Pax
per m
odel
led
perio
d
BoardersAlightersCapacity 6tph/12tphLoad
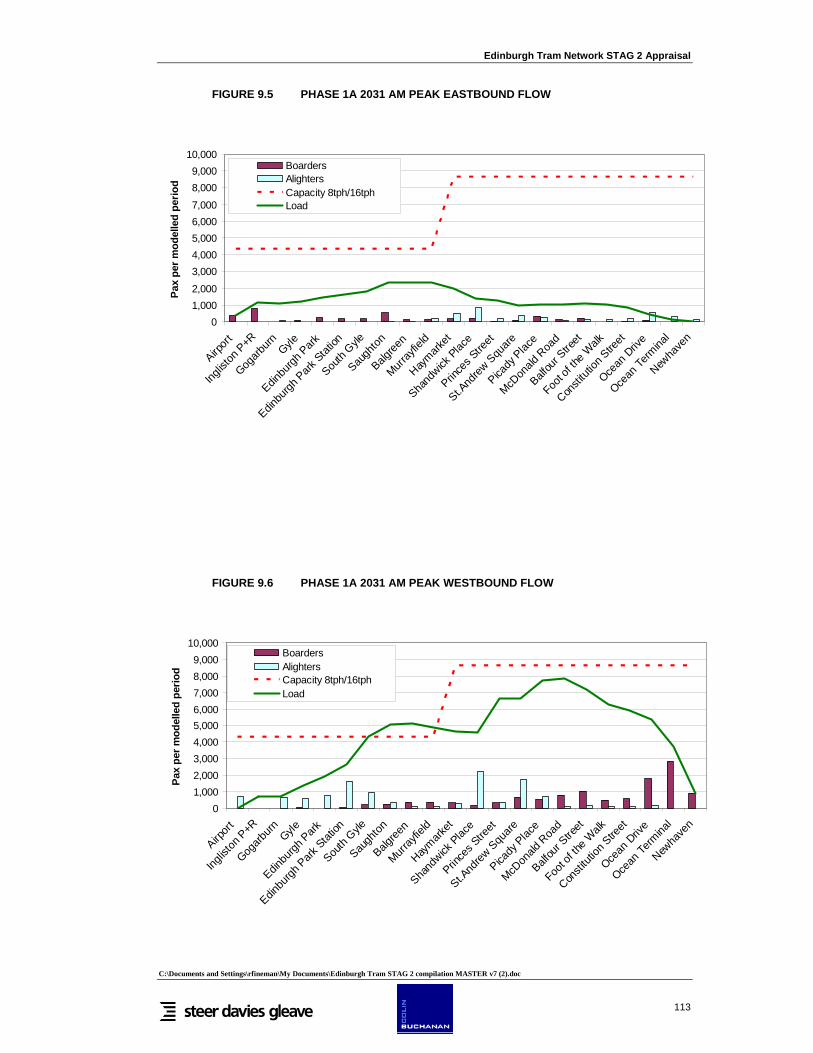
Edinburgh Tram Network STAG 2 Appraisal
C:\Documents and Settings\rfineman\My Documents\Edinburgh Tram STAG 2 compilation MASTER v7 (2).doc
113
FIGURE 9.5 PHASE 1A 2031 AM PEAK EASTBOUND FLOW
01,0002,000
3,0004,0005,0006,0007,000
8,0009,000
10,000
Airport
Inglist
on P+R
Gogarb
urn Gyle
Edinbu
rgh Park
Edinbu
rgh Park
Station
South
Gyle
Saugh
ton
Balgree
n
Murray
field
Haymark
et
Shand
wick Plac
e
Prince
s Stre
et
St.And
rew Squ
are
Picady
Place
McDon
ald R
oad
Balfou
r Stre
et
Foot o
f the W
alk
Consti
tution
Stre
et
Ocean
Driv
e
Ocean
Term
inal
Newha
ven
Pax
per m
odel
led
perio
dBoardersAlightersCapacity 8tph/16tphLoad
FIGURE 9.6 PHASE 1A 2031 AM PEAK WESTBOUND FLOW
01,0002,0003,0004,0005,0006,0007,0008,0009,000
10,000
Airport
Inglist
on P+R
Gogarb
urn Gyle
Edinbu
rgh Park
Edinbu
rgh Park
Station
South
Gyle
Saugh
ton
Balgree
n
Murray
field
Haymark
et
Shand
wick Plac
e
Prince
s Stre
et
St.And
rew Squ
are
Picady
Place
McDon
ald R
oad
Balfou
r Stre
et
Foot o
f the W
alk
Consti
tution
Stre
et
Ocean
Driv
e
Ocean
Term
inal
Newha
ven
Pax
per m
odel
led
perio
d
BoardersAlightersCapacity 8tph/16tphLoad
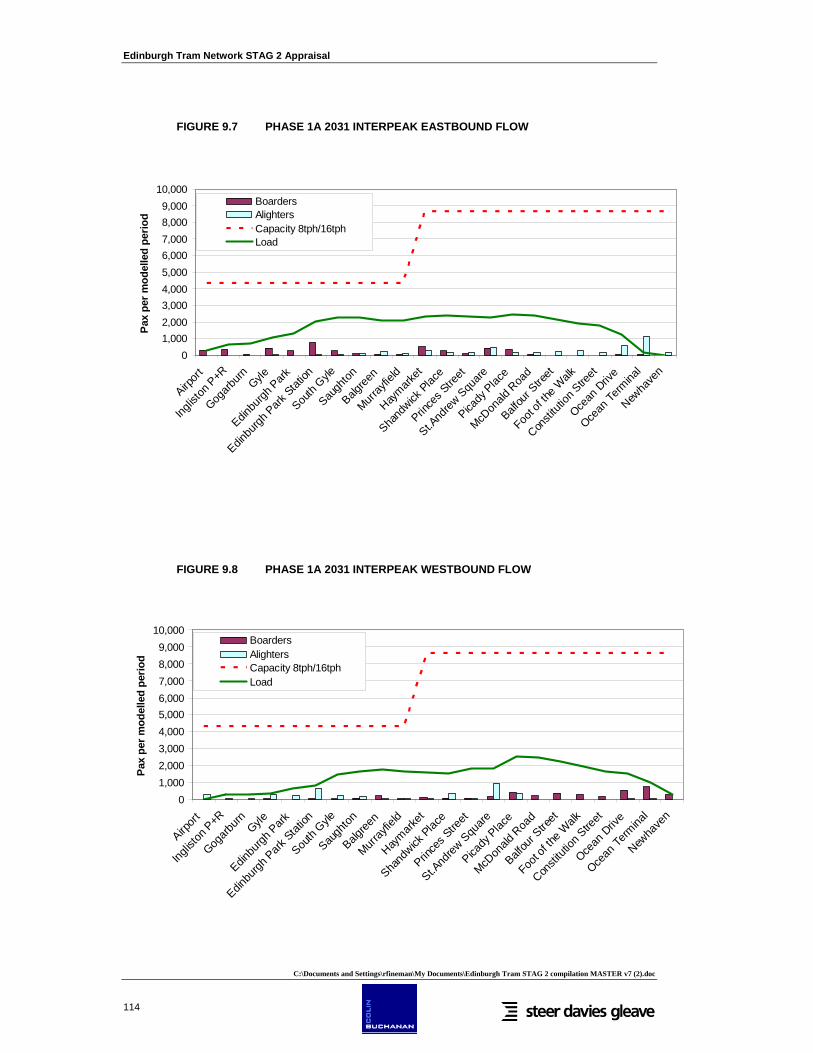
Edinburgh Tram Network STAG 2 Appraisal
C:\Documents and Settings\rfineman\My Documents\Edinburgh Tram STAG 2 compilation MASTER v7 (2).doc
114
FIGURE 9.7 PHASE 1A 2031 INTERPEAK EASTBOUND FLOW
01,0002,0003,0004,0005,0006,0007,0008,0009,000
10,000
Airpor
t
Inglist
on P
+R
Gogarb
urn Gyle
Edinbu
rgh P
ark
Edinbu
rgh P
ark Stat
ion
South
Gyle
Saugh
ton
Balgree
n
Murray
field
Haymark
et
Shand
wick Plac
e
Prince
s Stre
et
St.And
rew Squ
are
Picady
Place
McDon
ald R
oad
Balfou
r Stre
et
Foot o
f the W
alk
Consti
tution
Stre
et
Ocean
Driv
e
Ocean
Term
inal
Newha
ven
Pax
per m
odel
led
perio
d
BoardersAlightersCapacity 8tph/16tphLoad
FIGURE 9.8 PHASE 1A 2031 INTERPEAK WESTBOUND FLOW
01,0002,0003,0004,0005,0006,0007,0008,0009,000
10,000
Airport
Inglis
ton P+R
Gogarb
urn Gyle
Edinbu
rgh Park
Edinbu
rgh Park
Station
South
Gyle
Saugh
ton
Balgree
n
Murray
field
Haymark
et
Shand
wick Plac
e
Prince
s Stre
et
St.And
rew Squ
are
Picady
Place
McDon
ald R
oad
Balfou
r Stre
et
Foot o
f the W
alk
Consti
tution
Stre
et
Ocean
Driv
e
Ocean
Term
inal
Newha
ven
Pax
per m
odel
led
perio
d
BoardersAlightersCapacity 8tph/16tphLoad

Edinburgh Tram Network STAG 2 Appraisal
C:\Documents and Settings\rfineman\My Documents\Edinburgh Tram STAG 2 compilation MASTER v7 (2).doc
115
Phase 1a+1b transport impacts
9.15 The impact on overall travel demand in Edinburgh and its environs arising from Phase 1a+1b is presented in Table 9.4. The increase in public transport trips is significant, reaching over 4,000 in the 2031 AM Peak period. The impact on car is mixed, with the peak periods experiencing a reduction, but with a small increase in the Interpeak periods. (Note that given the differential planning assumptions for the Reference and Edinburgh Tram cases, the impact on the highway network is diluted, since the additional land uses will generate some car demand.)
TABLE 9.4 TRAVEL DEMAND BY PUBLIC AND PRIVATE TRANSPORT (PHASE 1A+1B)
2011 2031
AM IP AM IP
Reference Case Public transport 94,993 54,707 135,845 80,648
Private car 114,303 72,680 140,042 100,693
Edinburgh Tram Public transport 97,183 55,642 139,989 82,754
Private car 113,918 72,718 139,753 100,935
Differences Public transport 2,190 935 4,144 2,106
Private car -385 38 -289 242
9.16 Table 9.5 presents the aggregate demand by modelled period and year. In the AM peak, the demand is heaviest in the westbound direction; in the Interpeak, the demand is more balanced, with flows not significantly different from the lower directional peak demand. Annual demand is forecast at 13.18 million in 2011 (including a 25% reduction for the ramp up period56), rising to 31.62 million by 2031.
TABLE 9.5 EDINBURGH TRAM PHASE 1A+1B DEMAND
2011 2031
AM IP AM IP
Eastbound 3,664 2,607 6,839 6,276
Westbound 4,433 2,154 12,485 5,911
Total 8,098 4,761 19,324 12,187
Annual (m) 13.18 31.62
9.17 The sources of demand for Edinburgh Tram are set out in Table 9.6. As expected, the majority of the demand is accounted for by transfer from bus. Transfer from rail is proportionately smaller, principally being abstraction from EARL and local rail trips to Edinburgh Park, with some growth in other rail trips interchanging to tram. The
56 The ramp up period reflects the fact that the full impacts of a major transport scheme take several years to materialise and therefore a reduction is applied to forecasts to account for this. For Edinburgh Tram, the assumption is 75%, 85%, 92%, 97%, and 99% for the five years from opening. Hence, a reduction of 25% is applied to the forecasts for 2011 to obtain the actual demand expected in the opening year.

Edinburgh Tram Network STAG 2 Appraisal
C:\Documents and Settings\rfineman\My Documents\Edinburgh Tram STAG 2 compilation MASTER v7 (2).doc
116
remainder is accounted for by demand new to public transport, which is equal to 17% and 20% of tram demand in 2011 and 2031 respectively. These proportions are consistent with empirical evidence from existing systems and an increasing share from car is consistent with the higher congestion levels and hence attractiveness of tram expected and forecast in the later year. The proportion of demand new to public transport is higher for the scheme with only Phase 1a, than also with Phase 1b, principally because Phase 1a includes the park and ride site at Ingliston.
TABLE 9.6 SOURCES OF DEMAND FOR EDINBURGH TRAM (PHASE 1A+1B)
2011 2031
Bus 10.29 23.55
Rail 0.59 1.68
Mode shift from car / new development 2.29 6.39
Tram 13.18 31.62
9.18 Edinburgh Tram demand profiles for Phase 1a are presented in Figure 9.9 to Figure 9.16. Key points to note are:
• The peak AM peak demand flow occurs in the westbound direction on Leith Walk, consistent with the overall demand by direction previously reported;
• The general pattern of demand is of boarding approaching the city centre, with alighting in the city centre and beyond;
• The impact of development in the Leith area is evident when comparing the AM Peak westbound boardings in 2011 with 2031;
• Similarly, the impact of development in the Granton area is evident when comparing the AM Peak eastbound boardings in 2011 with 2031; and
• Line capacity is forecast to be exceeded by 2031during the AM peak in the westbound direction.
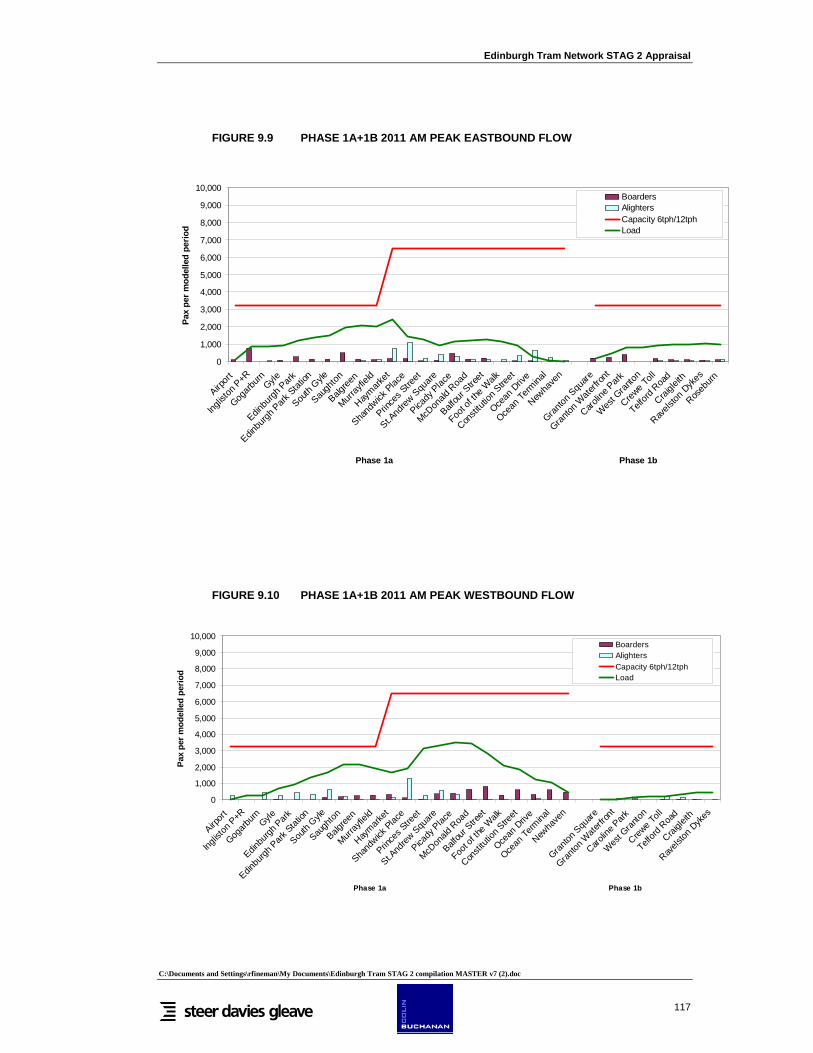
Edinburgh Tram Network STAG 2 Appraisal
C:\Documents and Settings\rfineman\My Documents\Edinburgh Tram STAG 2 compilation MASTER v7 (2).doc
117
FIGURE 9.9 PHASE 1A+1B 2011 AM PEAK EASTBOUND FLOW
0
1,000
2,000
3,000
4,000
5,000
6,000
7,000
8,000
9,000
10,000
Airpor
t
Inglis
ton P+R
Gogarb
urn Gyle
Edinbu
rgh Park
Edinbu
rgh P
ark S
tation
South
Gyle
Saugh
ton
Balgree
n
Murray
field
Haymark
et
Shand
wick P
lace
Prince
s Stre
et
St.And
rew S
quare
Picady
Plac
e
McDon
ald R
oad
Balfou
r Stre
et
Foot o
f the W
alk
Consti
tution
Stre
et
Ocean
Driv
e
Ocean
Term
inal
Newha
ven
Granton
Squ
are
Granto
n Wate
rfron
t
Carolin
e Park
West G
ranton
Crewe T
oll
Telford
Roa
d
Craigle
ith
Ravels
ton D
ykes
Roseb
urn
Phase 1a Phase 1b
Pax
per m
odel
led
perio
dBoardersAlightersCapacity 6tph/12tphLoad
FIGURE 9.10 PHASE 1A+1B 2011 AM PEAK WESTBOUND FLOW
0
1,000
2,000
3,000
4,000
5,000
6,000
7,000
8,000
9,000
10,000
Airport
Inglist
on P+R
Gogarb
urn Gyle
Edinbu
rgh Park
Edinbu
rgh Park
Station
South
Gyle
Saugh
ton
Balgree
n
Murray
field
Haymark
et
Shand
wick Plac
e
Prince
s Stre
et
St.And
rew Squ
are
Picady
Place
McDon
ald R
oad
Balfou
r Stre
et
Foot o
f the W
alk
Consti
tution
Stre
et
Ocean
Driv
e
Ocean
Term
inal
Newha
ven
Granton
Square
Granton
Wate
rfron
t
Carolin
e Park
West G
ranton
Crewe T
oll
Telford
Roa
d
Craigle
ith
Ravels
ton D
ykes
Phase 1a Phase 1b
Pax
per m
odel
led
perio
d
BoardersAlightersCapacity 6tph/12tphLoad

Edinburgh Tram Network STAG 2 Appraisal
C:\Documents and Settings\rfineman\My Documents\Edinburgh Tram STAG 2 compilation MASTER v7 (2).doc
118
FIGURE 9.11 PHASE 1A+1B 2011 INTERPEAK EASTBOUND FLOW
0
1,000
2,000
3,000
4,000
5,000
6,000
7,000
8,000
9,000
10,000
Airport
Inglis
ton P
+R
Gogarb
urn Gyle
Edinbu
rgh P
ark
Edinbu
rgh Park
Stat
ion
South
Gyle
Saugh
ton
Balgree
n
Murray
field
Haymark
et
Shand
wick P
lace
Prince
s Stre
et
St.And
rew S
quare
Picady
Place
McDon
ald R
oad
Balfou
r Stre
et
Foot o
f the W
alk
Consti
tution
Stre
et
Ocean
Driv
e
Ocean
Term
inal
Newha
ven
Granton
Square
Granto
n Wate
rfron
t
Carolin
e Park
Wes
t Gra
nton
Crewe T
oll
Telford
Roa
d
Craigle
ith
Ravels
ton D
ykes
Phase 1a Phase 1b
Pax
per m
odel
led
perio
d
BoardersAlightersCapacity 6tph/12tphLoad
FIGURE 9.12 PHASE 1A+1B 2011 INTERPEAK WESTBOUND FLOW
0
1,000
2,000
3,000
4,000
5,000
6,000
7,000
8,000
9,000
10,000
Airport
Inglist
on P+R
Gogarb
urn Gyle
Edinbu
rgh Park
Edinbu
rgh Park
Station
South
Gyle
Saugh
ton
Balgree
n
Murray
field
Haymark
et
Shand
wick Plac
e
Prince
s Stre
et
St.And
rew Squ
are
Picady
Place
McDon
ald R
oad
Balfou
r Stre
et
Foot o
f the W
alk
Consti
tution
Stre
et
Ocean
Driv
e
Ocean
Term
inal
Newha
ven
Granton
Square
Granton
Wate
rfron
t
Carolin
e Park
West G
ranton
Crewe T
oll
Telford
Roa
d
Craigle
ith
Ravels
ton D
ykes
Phase 1a Phase 1b
Pax
per m
odel
led
perio
d
BoardersAlightersCapacity 6tph/12tphLoad

Edinburgh Tram Network STAG 2 Appraisal
C:\Documents and Settings\rfineman\My Documents\Edinburgh Tram STAG 2 compilation MASTER v7 (2).doc
119
FIGURE 9.13 PHASE 1A+1B 2031 AM PEAK EASTBOUND FLOW
0
1,000
2,000
3,000
4,000
5,000
6,000
7,000
8,000
9,000
10,000
Airport
Inglist
on P+R
Gogarb
urn Gyle
Edinbu
rgh P
ark
Edinbu
rgh P
ark Stat
ion
South
Gyle
Saugh
ton
Balgree
n
Murray
field
Haymark
et
Shand
wick Plac
e
Prince
s Stre
et
St.And
rew Squ
are
Picady
Place
McDon
ald R
oad
Balfou
r Stre
et
Foot o
f the W
alk
Consti
tution
Stre
et
Ocean
Driv
e
Ocean
Term
inal
Newha
ven
Granto
n Squ
are
Granto
n Wate
rfron
t
Carolin
e Park
West G
ranto
n
Crewe T
oll
Telford
Roa
d
Craigle
ith
Ravels
ton D
ykes
Phase 1a Phase 1b
Pax
per m
odel
led
perio
d
BoardersAlightersCapacity 8tph/16tphLoad
FIGURE 9.14 PHASE 1A+1B 2031 AM PEAK WESTBOUND FLOW
01,000
2,0003,000
4,0005,000
6,0007,000
8,0009,000
10,000
Airpor
t
Inglis
ton P+R
Gogarb
urn Gyle
Edinbu
rgh Park
Edinbu
rgh P
ark S
tation
South
Gyle
Saugh
ton
Balgree
n
Murray
field
Haymark
et
Shand
wick P
lace
Prince
s Stre
et
St.And
rew S
quare
Picady
Plac
e
McDon
ald R
oad
Balfou
r Stre
et
Foot o
f the W
alk
Consti
tution
Stre
et
Ocean
Driv
e
Ocean
Term
inal
Newha
ven
Granto
n Squ
are
Granton
Wate
rfron
t
Carolin
e Park
West G
ranton
Crewe T
oll
Telford
Roa
d
Craigle
ith
Ravels
ton D
ykes
Phase 1a Phase 1b
Pax
per m
odel
led
perio
d
BoardersAlightersCapacity 8tph/16tphLoad

Edinburgh Tram Network STAG 2 Appraisal
C:\Documents and Settings\rfineman\My Documents\Edinburgh Tram STAG 2 compilation MASTER v7 (2).doc
120
FIGURE 9.15 PHASE 1A+1B 2031 INTERPEAK EASTBOUND FLOW
0
1,000
2,000
3,000
4,000
5,000
6,000
7,000
8,000
9,000
10,000
Airport
Inglist
on P+R
Gogarb
urn Gyle
Edinbu
rgh Park
Edinbu
rgh Park
Stat
ion
South
Gyle
Saugh
ton
Balgree
n
Murray
field
Haymark
et
Shand
wick Plac
e
Prince
s Stre
et
St.And
rew S
quare
Picady
Place
McDon
ald R
oad
Balfou
r Stre
et
Foot o
f the W
alk
Consti
tution
Stre
et
Ocean
Driv
e
Ocean
Term
inal
Newha
ven
Granton
Square
Granton
Wate
rfron
t
Carolin
e Park
West G
ranton
Crewe T
oll
Telford
Roa
d
Craigle
ith
Ravels
ton D
ykes
Phase 1a Phase 1b
Pax
per m
odel
led
perio
d
BoardersAlightersCapacity 8tph/16tphLoad
FIGURE 9.16 PHASE 1A+1B 2031 INTERPEAK WESTBOUND FLOW
0
1,000
2,000
3,000
4,000
5,000
6,000
7,000
8,000
9,000
10,000
Airport
Inglist
on P+R
Gogarb
urn Gyle
Edinbu
rgh Park
Edinbu
rgh Park
Station
South
Gyle
Saugh
ton
Balgree
n
Murray
field
Haymark
et
Shand
wick Plac
e
Prince
s Stre
et
St.And
rew Squ
are
Picady
Place
McDon
ald R
oad
Balfou
r Stre
et
Foot o
f the W
alk
Consti
tution
Stre
et
Ocean
Driv
e
Ocean
Term
inal
Newha
ven
Granton
Square
Granton
Wate
rfron
t
Carolin
e Park
West G
ranton
Crewe T
oll
Telford
Roa
d
Craigle
ith
Ravels
ton D
ykes
Phase 1a Phase 1b
Pax
per m
odel
led
perio
d
BoardersAlightersCapacity 8tph/16tphLoad

Edinburgh Tram Network STAG 2 Appraisal
C:\Documents and Settings\rfineman\My Documents\Edinburgh Tram STAG 2 compilation MASTER v7 (2).doc
121
Assessment against the Planning Objectives
9.19 A key principle of STAG is that a scheme is assessed against both the planning objectives established by the planning authority and the Government’s five overarching objectives. Performance against planning objectives is fundamental in a Part 1 appraisal, which seeks to define the choice and rational of preferred option(s) which best meets the planning objectives. The Part 2 appraisal is essentially a more detailed exploration and appraisal against both sets of objectives, providing an updated assessment of the scheme against the planning objectives and considering in detail appraisal against the five Government objectives. This section therefore reviews the appraisal of Edinburgh Tram against the planning objectives (see Chapter 3); the Government’s five objectives are considered in detail in the remainder of this chapter.
To support the local economy by improving accessibility
Improve access to the public transport network
9.20 Some of the alignment of Phase 1a is along existing public transport (bus) routes and whilst the Central case assumes some restructuring of the bus network along the route, buses will continue to run in parallel for much of its length. This will create a number of opportunities for public transport travel (and interchanges) in Edinburgh.
9.21 In addition, Phase 1b will open up new opportunities for public transport access, notably in terms of journeys from Granton and the Roseburn corridor to Haymarket and the West End.
Improved access to employment opportunities.
9.22 Edinburgh Tram will not only improve access to existing employment, it will also provide an opportunity to access new development sites planned for North Edinburgh (see Chapter 2). The wider consideration of public transport network coverage and associated accessibility is considered in later in this Chapter. It is demonstrated that Edinburgh Tram considerably improves access for a set of key employment destinations (although a few areas outside the immediate tram corridor experience slightly reduced accessibility due to changes to the bus network). This effect is significant for Phase 1a, with Phase 1a+1b delivering higher benefits than Phase 1a alone.
To promote sustainability and reduce environmental damage caused by traffic
Increase proportion of journeys made by public transport, cycling and walking
9.23 The modelling work for Edinburgh Tram has forecast increases in public transport demand. This leads to an increase in the share of demand by public transport, as set out in Table 9.7 and Table 9.8 for Phase 1a and Phase 1a+1b respectively. It should be noted that demand redistribution effects are different for the two scheme options and this can also influence the effect the two options have on mode share. The increase in the public transport share is typically around 0.5%, with the highest increase being around 0.8-0.9% in the 2031 AM Peak.

Edinburgh Tram Network STAG 2 Appraisal
C:\Documents and Settings\rfineman\My Documents\Edinburgh Tram STAG 2 compilation MASTER v7 (2).doc
122
TABLE 9.7 TRAVEL DEMAND BY PUBLIC AND PRIVATE TRANSPORT (PHASE 1A)
2011 2031
AM IP AM IP
Reference Case Public transport 94,993 54,707 135,845 80,648
Private car 114,303 72,680 140,042 100,693
PT share 45.4% 42.9% 49.2% 44.5%
Edinburgh Tram Public transport 96,920 55,570 140,115 82,508
Private car 114,068 72,756 139,591 101,114
PT share 45.9% 43.3% 50.1% 44.9%
Change in public transport share 0.5% 0.4% 0.9% 0.5%
TABLE 9.8 TRAVEL DEMAND BY PUBLIC AND PRIVATE TRANSPORT (PHASE 1A+1B)
2011 2031
AM IP AM IP
Reference Case Public transport 94,993 54,707 135,845 80,648
Private car 114,303 72,680 140,042 100,693
PT share 45.4% 42.9% 49.2% 44.5%
Edinburgh Tram Public transport 97,183 55,642 139,989 82,754
Private car 113,918 72,718 139,753 100,935
PT share 46.0% 43.3% 50.0% 45.1%
Change in public transport share 0.6% 0.4% 0.8% 0.6%
9.24 The above data relates to the whole modelled area of Edinburgh and its environs, however. At a local level, in the tram corridor, the change in public transport share will be greater. The impact of the tram on mode shift is proportionately greater in areas that it will directly serve, where it is intuitive to anticipate achieving mode shift. Figure 9.17 presents the percentage change in mode share by location of trip origin for the AM peak period in 2031. It is apparent that changes in mode share from car to public transport up to 10% will be generated for trips from certain areas directly served by the tram. Areas exhibiting mode shift of greater than 5% (encompassing significant areas of development and growth which otherwise would be associated with higher levels of car travel) include:
• Leith/Newhaven • Granton/Muirhouse • Craigleith • Roseburn • Sighthill • Edinburgh Airport
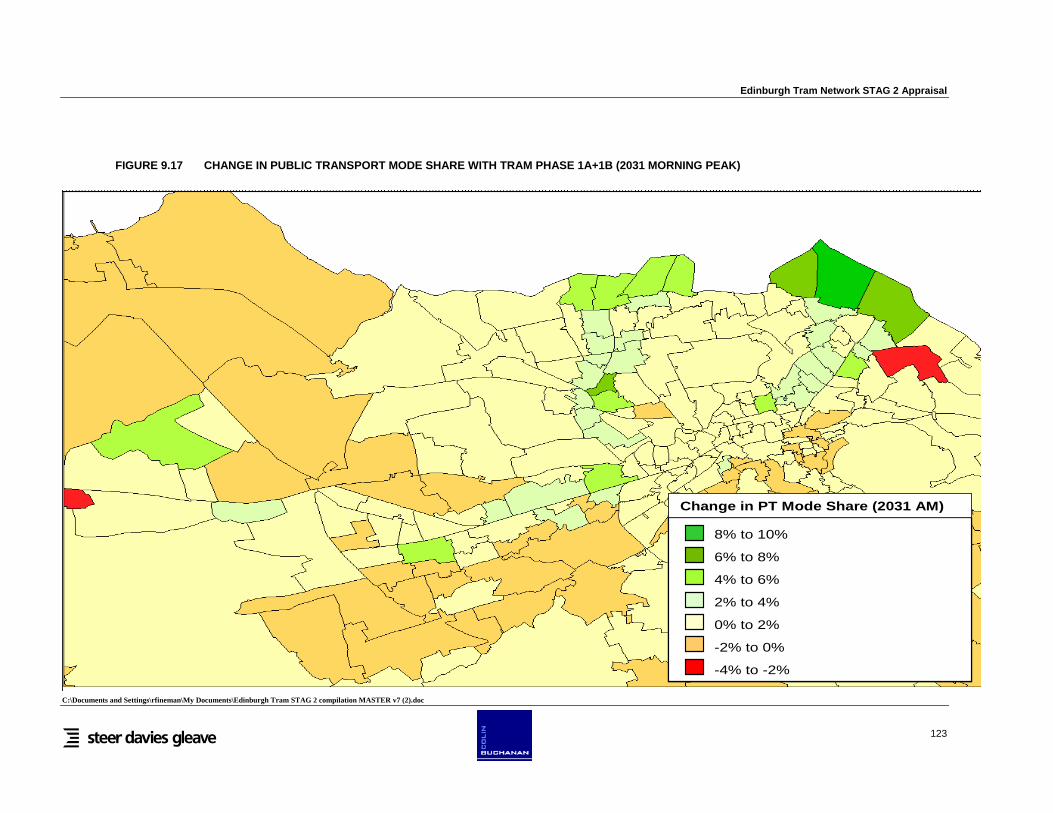
Edinburgh Tram Network STAG 2 Appraisal
C:\Documents and Settings\rfineman\My Documents\Edinburgh Tram STAG 2 compilation MASTER v7 (2).doc
123
FIGURE 9.17 CHANGE IN PUBLIC TRANSPORT MODE SHARE WITH TRAM PHASE 1A+1B (2031 MORNING PEAK)
8% to 10%
6% to 8%
4% to 6%
2% to 4%
0% to 2%
-2% to 0%
-4% to -2%
8% to 10%
6% to 8%
4% to 6%
2% to 4%
0% to 2%
-2% to 0%
-4% to -2%
Change in PT Mode Share (2031 AM)

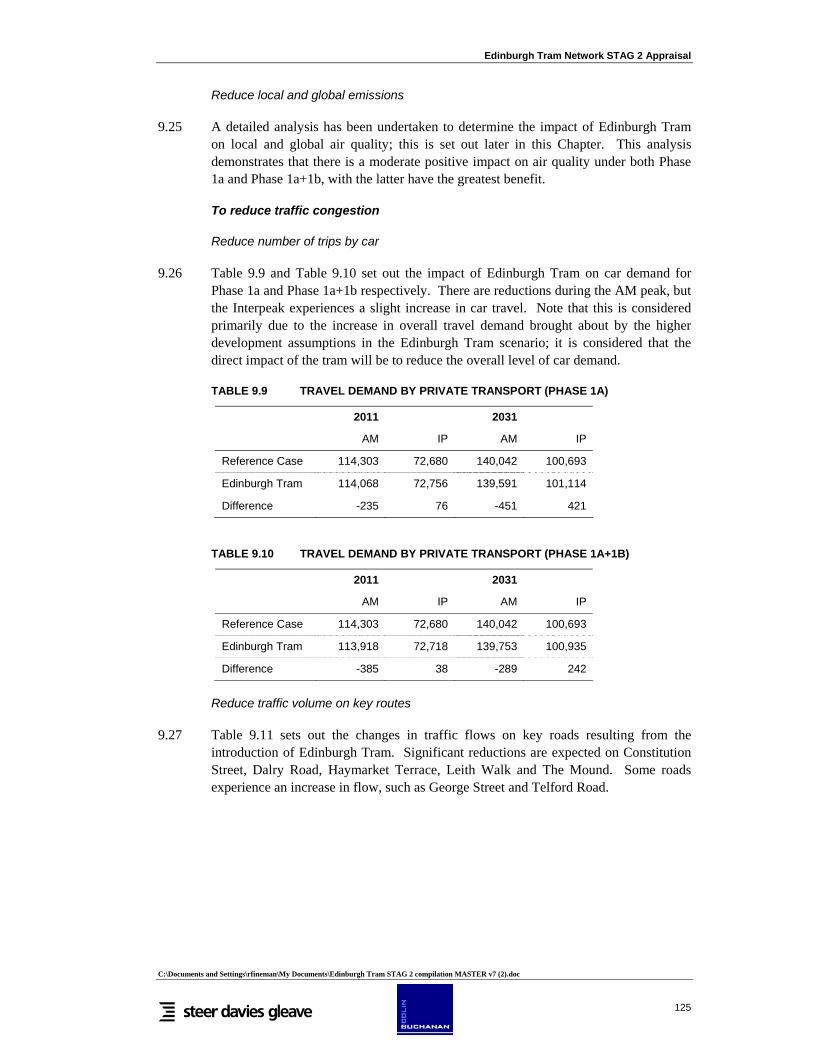
Edinburgh Tram Network STAG 2 Appraisal
C:\Documents and Settings\rfineman\My Documents\Edinburgh Tram STAG 2 compilation MASTER v7 (2).doc
125
Reduce local and global emissions
9.25 A detailed analysis has been undertaken to determine the impact of Edinburgh Tram on local and global air quality; this is set out later in this Chapter. This analysis demonstrates that there is a moderate positive impact on air quality under both Phase 1a and Phase 1a+1b, with the latter have the greatest benefit.
To reduce traffic congestion
Reduce number of trips by car
9.26 Table 9.9 and Table 9.10 set out the impact of Edinburgh Tram on car demand for Phase 1a and Phase 1a+1b respectively. There are reductions during the AM peak, but the Interpeak experiences a slight increase in car travel. Note that this is considered primarily due to the increase in overall travel demand brought about by the higher development assumptions in the Edinburgh Tram scenario; it is considered that the direct impact of the tram will be to reduce the overall level of car demand.
TABLE 9.9 TRAVEL DEMAND BY PRIVATE TRANSPORT (PHASE 1A)
2011 2031
AM IP AM IP
Reference Case 114,303 72,680 140,042 100,693
Edinburgh Tram 114,068 72,756 139,591 101,114
Difference -235 76 -451 421
TABLE 9.10 TRAVEL DEMAND BY PRIVATE TRANSPORT (PHASE 1A+1B)
2011 2031
AM IP AM IP
Reference Case 114,303 72,680 140,042 100,693
Edinburgh Tram 113,918 72,718 139,753 100,935
Difference -385 38 -289 242
Reduce traffic volume on key routes
9.27 Table 9.11 sets out the changes in traffic flows on key roads resulting from the introduction of Edinburgh Tram. Significant reductions are expected on Constitution Street, Dalry Road, Haymarket Terrace, Leith Walk and The Mound. Some roads experience an increase in flow, such as George Street and Telford Road.

Edinburgh Tram Network STAG 2 Appraisal
C:\Documents and Settings\rfineman\My Documents\Edinburgh Tram STAG 2 compilation MASTER v7 (2).doc
126
TABLE 9.11 CHANGES IN TRAFFIC FLOWS (2011 AM)
Road Do-Minimum 1a Change 1a+1b Change
Abbeyhill 2,259 2,209 -50 2,205 -54
Balgreen Road 1,231 1,375 144 1,362 131
Calder Road 3,706 3,594 -112 3,597 -109
Calton Road 768 845 77 846 78
Commercial Street 2,059 2,097 38 2,103 44
Constitution Street 861 428 -433 432 -429
Crewe Road North 1,340 1,343 3 1,319 -21
Crewe Road South 1,545 1,605 60 1,587 42
Dalry Road 2,593 1,673 -920 1,626 -967
Easter Road 1,942 2,021 79 2,001 59
Eastfield Road 2,803 2,873 70 2,874 71
Ferry Road 3,744 3,905 161 3,911 167
George Street 1,232 1,553 321 1,540 308
Glasgow Road 4,831 4,879 48 4,872 41
Granton Road 1,735 1,720 -15 1,694 -41
Haymarket Terrace 3,533 2,833 -700 2,871 -662
Inverleith Row 1,865 1,940 75 1,943 78
Leith Walk 1,784 1,164 -620 1,160 -624
London Road 2,084 2,174 90 2,178 94
Market Street 826 957 131 957 131
Morrisson Street 2,539 2,751 212 2,738 199
Palmerston Place 2,121 2,236 115 2,206 85
Pilrig Street 1,645 1,428 -217 1,433 -212
Queen Street 5,449 5,327 -122 5,294 -155
Queensferry Road 2,535 2,328 -207 2,323 -212
Queensferry Street 1,325 1,496 171 1,462 137
Salamandar Street 2,679 2,507 -172 2,508 -171
South Glye Broadway 3,275 3,343 68 3,344 69
Starbank Road 2,200 2,221 21 2,214 14
Telford Road 2,892 3,181 289 3,163 271
The Mound 2,175 1,674 -501 1,668 -507
West Granton Road 2,111 2,268 157 2,272 161
9.28 The changes in traffic flow are due to a range of effects. Traffic reductions are caused by car users choosing to make their journey by public transport instead but localised increases can be caused by the displacement of traffic by the tram, for example due to reduced road capacity in the streets on which the tram will operate and an element of re-routing of traffic in areas where particular traffic movements would be altered to

Edinburgh Tram Network STAG 2 Appraisal
C:\Documents and Settings\rfineman\My Documents\Edinburgh Tram STAG 2 compilation MASTER v7 (2).doc
127
accommodate the tram.
9.29 As noted in paragraph 9.6 and subsequently of this report, changes in traffic flows need careful interpretation because of the larger travel market assumed in the Do Something situation. Some increases apparent in Table 9.11, such as those connected with the Granton area are due to this effect and should not necessarily be considered to have been caused by the tram.
9.30 It will be necessary, as the scheme develops and once it is operational, to ensure that appropriate mitigation measures are introduced and maintained to ensure that the transport network performs efficiently. Particular measures that could be introduced will vary according to the location and the range of amenities in the immediate vicinity. Examples of these measures will include:
• Appropriate signing to encourage traffic to use appropriate routes; • Incorporation of traffic calming measures to discourage traffic from using
residential streets (e.g. the streets to the east and west of Leith Walk); • Review of parking and servicing provision on the adjacent local road network;
and • Provision of adequate parking for affected residents (e.g. at Granton Road).
9.31 In summary, whilst Edinburgh Tram removes some car demand from the highway network, at an individual street level it has only a slight beneficial impact on reducing traffic volumes on key routes. Although flow decreases appear to be largely offset by flow increases at a network level, this is due to the larger travel market assumed in the Do Something situation, which is not directly caused by the introduction of the tram.
To make the transport system safer and more secure:
Reduce traffic accidents.
9.32 The impact of Edinburgh Tram on the number of road traffic accidents has been estimated using model data on traffic flows by road type and the application of accident rates; the number of accidents savings by severity forecast is set out in Table 9.12. Using these figures directly from the modelled with and without-tram situations, an additional 75 accidents per annum are forecast alongside Phase 1a; alongside Phase 1a+1b a lower level of increase is forecast. The majority of these accidents are accounted for in terms of damage-only accidents.
TABLE 9.12 CHANGE IN ANNUAL NUMBER OF ACCIDENTS BY SEVERITY LEVEL
Level 1a 1a+1b
2011 2031 2011 2031
Damage +70.1 +70.1 +54.1 +19.8
Slight +4.6 +4.7 +3.6 +1.3
Serious +0.5 +0.5 +0.4 +0.1
Fatal +0.1 +0.1 +0.0 +0.0
Total +75.3 +75.4 +58.2 +21.3

Edinburgh Tram Network STAG 2 Appraisal
C:\Documents and Settings\rfineman\My Documents\Edinburgh Tram STAG 2 compilation MASTER v7 (2).doc
128
9.33 It should be noted that a portion of these increases are due to the larger travel market assumed in the with-tram situation and this component might not be considered as being directly caused by the introduction of the tram. Some adverse impact still results from redistribution and re-routing effects, however.
To promote social benefits:
Improve liveability of streets
9.34 This objective covers a whole gamut of interlinked issues, including accessibility, safety, environment and economy. In essence, it is about enhancing streets as ‘civic spaces’, where priority is given to people rather than cars. The current design for Edinburgh Tram is focused on delivering a transport scheme, which where possible looks to deliver benefits to the wider urban realm. The tram will provide an opportunity to implement wider enhancements to the urban realm, either explicitly planned and implemented in conjunction with the tram, or through the longer term effects of a planned framework for redevelopment and regeneration.
9.35 The regeneration effects of light rail typically take several years to become apparent and, to date, quantitative information about systems' impacts rarely has been collected. While it is difficult to demonstrate that tram schemes will themselves spark regeneration, they play a critical role in supporting it and shaping it in spatial terms. There is clear evidence of specific development projects led by light rail, such as in London Docklands, Salford Quays in Manchester and elsewhere. It is also clear that introducing light rail helps boost property values, both commercial and residential. Commercial values can experience uplifts of 100% or more, and effects on residential values can be discerned up to 1 km, or up to 20 minutes walk, from tram stops.
9.36 It is widely accepted that trams are more attractive than buses in urban areas, improving townscape features and liveability on the streets. This is valued by the wider public and not only by the users of the system.
Reduce social exclusion
9.37 Edinburgh Tram will provide a significant improvement in terms of the ability of the elderly and mobility impaired to use public transport. It will provide level boarding at stops, with the tram vehicle interior giving greater space and dedicated facilities for wheelchairs and/or prams, etc. The smooth ride and high level of comfort will make the tram system an attractive choice in comparison to other public transport modes. Such attributes will also be valued by other public transport users, albeit to a lesser degree.
9.38 The wider accessibility impacts are considered later in this Chapter, which explicitly sets out the impact of Edinburgh Tram on accessibility for those households without a car. This demonstrates that for a set of key employment destinations, there is a significant net improvement in access afforded by the scheme. Whilst some of those households benefit marginally (under 5 minutes reduction in travel time), there are substantial beneficiaries of 10 minutes or more.

Edinburgh Tram Network STAG 2 Appraisal
C:\Documents and Settings\rfineman\My Documents\Edinburgh Tram STAG 2 compilation MASTER v7 (2).doc
129
Environment
9.39 The environment objective involves protecting the built and natural environments, by minimising (or where possible avoiding) the temporary and permanent impacts of transport infrastructure and operation.
9.40 The appraisal of Edinburgh Tram Line has been undertaken using the STAG ‘project’ level approach. This assessment is based on a reconfiguration of the results of the previous Environmental Statements (ESs) for Edinburgh Tram Lines 1 and 2, which were prepared as part of the Parliamentary Bill process.
Noise and Vibration
9.41 Airborne noise propagates through the air from the sources to receptors, while ground vibration propagates via the ground into a receptor (building). Noise and vibration arise from the actual infrastructure construction (temporary) and from the operation of the schemes (permanent).
9.42 The methods and criteria used to predict and evaluate noise and vibration impacts have been derived from relevant recognised national and international guidance.
9.43 A Code of Construction Practice57 has been adopted; this includes restrictions on: closures of roads and footways, noise and hours of working, vibration, dust suppression and air pollution, disposal of waste and contaminated material, protection of the environment and safety. This will mitigate the impacts on noise and vibration levels during the construction process.
9.44 Similarly, a Noise and Vibration Policy has also been developed which sets out how tie proposes to mitigate noise from the operation of Edinburgh Tram. In essence, tie will undertake measures to mitigate significant noise impacts for residents and other noise sensitive receivers in the vicinity of the routes, following a tiered approach. This focuses initially on minimising the level of noise and vibration at source through appropriate vehicle standards and system design. Where levels are still considered excessive, noise barriers will then be provided, with the final option being the installation of noise insulation for residential properties.
Construction
9.45 The assessment of construction and vibration noise for Edinburgh Tram has been undertaken on a qualitative basis.
9.46 The noise levels associated with enabling works and track laying will be most typical of those to be produced on a daily basis during the construction phase. This will affect receptors along the length of the proposed alignment, whilst stop construction will only affect those located in the immediate vicinity.
9.47 In the absence of mitigation, significant impacts would be expected at receptors within approximately 40m of enabling works and approximately 15m of track laying and stop
57 Edinburgh Tram Lines 1 and 2: Code of Construction Practice (March 2006) published by tieLtd.

Edinburgh Tram Network STAG 2 Appraisal
C:\Documents and Settings\rfineman\My Documents\Edinburgh Tram STAG 2 compilation MASTER v7 (2).doc
130
construction. Ground vibration may be perceptible at receptors within close proximity to the alignment construction works (within 10m buffer) but is not expected to exceed the daytime assessment criterion. Hence, whilst vibration may be perceptible in some areas, due to its temporary nature, short duration and low levels, it is not expected to give rise to adverse comment and impacts are not expected to occur. The levels of vibration expected from construction works are considered unlikely to cause cosmetic or structural damage at any properties along the route.
9.48 Only the population resident in the immediate vicinity of construction works will be affected but temporarily. These works will be undertaken using mitigation measures. Therefore, construction noise is not considered to be a significant impact.
Operation: Road Traffic Noise
9.49 Changes in traffic demand and patterns as a result of the introduction of the tram will affect the levels of road traffic noise.
9.50 The outputs from the JRC transport model have been used to estimate the effect of the tram on road traffic, comparing the situation in the Do-Minimum (i.e. without the tram in 2011, the opening year, and 2031) with the Do-Something (i.e. with the tram on the same years). The key inputs for the road traffic noise assessment are: link-by-link traffic flow, composition and speed, and population catchment within each noise contour.
9.51 The appraisal method uses the Calculation of Road Traffic Noise to predict indicative changes in source traffic noise at various distances from each road link based on changes in traffic flows, speed and composition obtained from the traffic model. The effects of road gradient, topographic screening and reflection are not considered.
9.52 Two analyses were carried out:
• Changes in the number of people annoyed by noise; and • Changes in the number of people experiencing significant changes in noise levels.
9.53 For the first analysis, the GOMMMS noise annoyance-response relationships have been applied to the calculated noise levels to estimate the proportion of the population annoyed by different levels of noise. Annoyance-response relationships are given for noise levels above 55 dB. These percentages of people annoyed were correlated to the population within a 10 metre catchment of each link and summed across all links to give the total estimated population annoyed by noise for the whole study area.
9.54 For the second analysis, the acceptable levels for road traffic noise have been assumed at 65dB. Hence, any changes in noise levels below this threshold were disregarded. Noise contours of 3dB intervals from the minimum acceptable level, from the roadside up to 50 metres from each link, were created based on the geographical distribution of noise impacts.
9.55 Within each of these contours, the resident population was estimated using GIS analysis of 2001 census data. The total numbers of people experiencing an increase, decrease or no change in noise levels have been estimated by the summing of the population estimates for all links in the road network.
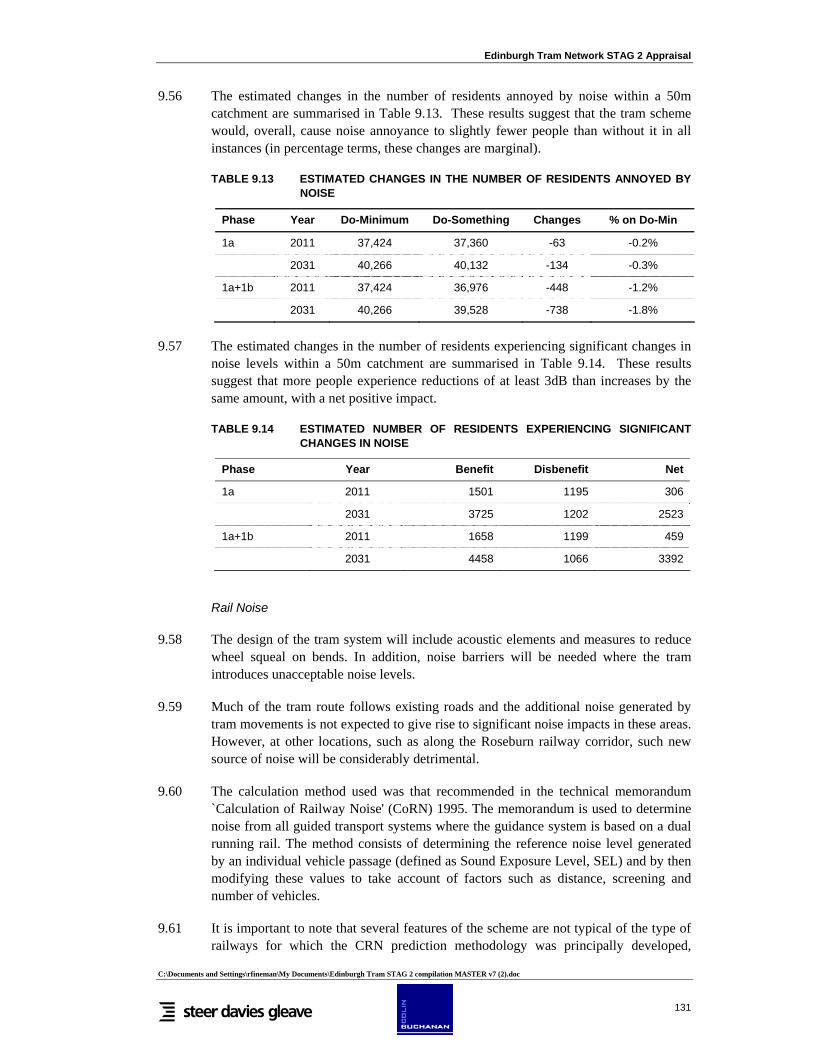
Edinburgh Tram Network STAG 2 Appraisal
C:\Documents and Settings\rfineman\My Documents\Edinburgh Tram STAG 2 compilation MASTER v7 (2).doc
131
9.56 The estimated changes in the number of residents annoyed by noise within a 50m catchment are summarised in Table 9.13. These results suggest that the tram scheme would, overall, cause noise annoyance to slightly fewer people than without it in all instances (in percentage terms, these changes are marginal).
TABLE 9.13 ESTIMATED CHANGES IN THE NUMBER OF RESIDENTS ANNOYED BY NOISE
Phase Year Do-Minimum Do-Something Changes % on Do-Min
1a 2011 37,424 37,360 -63 -0.2%
2031 40,266 40,132 -134 -0.3%
1a+1b 2011 37,424 36,976 -448 -1.2%
2031 40,266 39,528 -738 -1.8%
9.57 The estimated changes in the number of residents experiencing significant changes in noise levels within a 50m catchment are summarised in Table 9.14. These results suggest that more people experience reductions of at least 3dB than increases by the same amount, with a net positive impact.
TABLE 9.14 ESTIMATED NUMBER OF RESIDENTS EXPERIENCING SIGNIFICANT CHANGES IN NOISE
Phase Year Benefit Disbenefit Net
1a 2011 1501 1195 306
2031 3725 1202 2523
1a+1b 2011 1658 1199 459
2031 4458 1066 3392
Rail Noise
9.58 The design of the tram system will include acoustic elements and measures to reduce wheel squeal on bends. In addition, noise barriers will be needed where the tram introduces unacceptable noise levels.
9.59 Much of the tram route follows existing roads and the additional noise generated by tram movements is not expected to give rise to significant noise impacts in these areas. However, at other locations, such as along the Roseburn railway corridor, such new source of noise will be considerably detrimental.
9.60 The calculation method used was that recommended in the technical memorandum `Calculation of Railway Noise' (CoRN) 1995. The memorandum is used to determine noise from all guided transport systems where the guidance system is based on a dual running rail. The method consists of determining the reference noise level generated by an individual vehicle passage (defined as Sound Exposure Level, SEL) and by then modifying these values to take account of factors such as distance, screening and number of vehicles.
9.61 It is important to note that several features of the scheme are not typical of the type of railways for which the CRN prediction methodology was principally developed,

Edinburgh Tram Network STAG 2 Appraisal
C:\Documents and Settings\rfineman\My Documents\Edinburgh Tram STAG 2 compilation MASTER v7 (2).doc
132
namely: tram speeds are low, receivers are very close in some areas, and street-running track is used for the majority of the route. The source noise levels for the street running operation were based on other comparable street-running systems.
9.62 All residents within a buffer of the new tram line will be affected by the introduction of rail noise levels. The number of people likely to be annoyed by rail noise has been estimated as for road traffic noise.
9.63 Ground vibration could potentially be perceptible at receptors within approximately 20m of the alignment, but in case it is, the estimated levels are not expected to exceed the daytime assessment criterion beyond approximately 4m from the tracks. Any non-mitigated vibration will be transient and low level, and is not expected to give rise to adverse impact on people or buildings.
9.64 Table 9.15 sets out the number of residents impacted by tram noise. The number of people exposed to new rail noise as a result of the introduction of the tram has been estimated at 875 for Phase 1a and 1,198 for Phase 1a+1b.
TABLE 9.15 RESIDENTS IMPACTED BY TRAM NOISE
Phase 1a Phase 1a+1b
Residents directly exposed to noise 875 1,198
Residents annoyed by noise – weekday (weekend) 114 (105) 156 (144)
9.65 Table 9.15 also sets out the number of people who would be annoyed by tram noise; this considers a minimum threshold for rail noise impacts at LAeq, (0700-2300 hours) 55 dB (daytime) and the annoyance-response relationships for rail. It is relevant to note that the mitigating effect of any noise barriers at specific sensitive locations has not been taken into account in this assessment, since their size and precise location are not yet known.
9.66 The number of residents exposed to and annoyed by tram noise is modest compared to those benefiting from the tram, with daily tram demand being some 29,000 with Phase 1a in 2011, rising to 86,000 daily with Phase 1a+1b in 2031.
Air Quality – local
9.67 The key air pollutants considered for the appraisal of local air quality are Nitrogen Dioxide (NO2) and Particulate Matter (PM10) emitted from road traffic. Tram operation will have negligible impact on air quality along its route. Air quality standards for NO2 and PM10 at the local level are presented in Table 9.16 below.

Edinburgh Tram Network STAG 2 Appraisal
C:\Documents and Settings\rfineman\My Documents\Edinburgh Tram STAG 2 compilation MASTER v7 (2).doc
133
TABLE 9.16 AIR QUALITY STANDARDS
Pollutant Objective Date for Compliance
Nitrogen Dioxide (NO2) Annual Mean 40µg m-3 31st December 2005
99.8th %ile of Hourly Means 200µg m-3 31st December 2005
Particulate Matter (PM10) Annual Mean 40µg m-3 31st December 2004
90.4th %ile of Daily Means 50µg m-3 31st December 2004
Annual Mean 18µg m-3 31st December 2010
98.1%ile of Daily Means 50µg m-3 31st December 2010
9.68 A spreadsheet model has been used to estimate the changes in traffic emissions of NO2 and PM10 from the introduction of the tram, on a link-by-link basis. These are dependent on traffic flow, composition and speed.
9.69 The DMRB empirical method was used to estimate changes in roadside concentrations at certain distances from the road (50, 100, 150 and 200m). Background data for ambient concentrations of air pollutants for the City of Edinburgh are taken from the UK Air Quality Data and Statistics Database.
9.70 The analysis is undertaken in two ways:
• The population exposed to changes in pollutant concentrations of at least 10% within each catchment; and
• The population experiencing changes in relation to air quality standards.
9.71 Both analyses are based on the number of residents within each of the resident pollutant buffer zones experiencing increases, no change or decreases in concentrations of NO2 and PM10. Data on population are derived from GIS analysis of the 2001 postcode census data.
9.72 The population within each buffer on either side of the road link are weighted according to their distance to the roadside using weighting factors from DMRB. This accounts for the fact that traffic-related pollution decays rapidly with distance from the road.
9.73 The following scenarios are assessed: the Do-Minimum (i.e. without the tram in 2011 and 2031) with the Do-Something (i.e. with the tram on the same years).
9.74 STAG also requires an indication of the performance of a scheme in terms of the UK Air Quality Strategy.
9.75 Table 9.17 presents a weighted estimate of the number of people located within 200 metres of roads experiencing an improvement, degradation or no change in air quality. Under Phase 1a, the impact of Edinburgh Tram is broadly neutral, with comparable numbers of residents experiencing improvements in air quality as experience a worsening of air quality. For Phase 1a+1b, there is a material overall improvement.
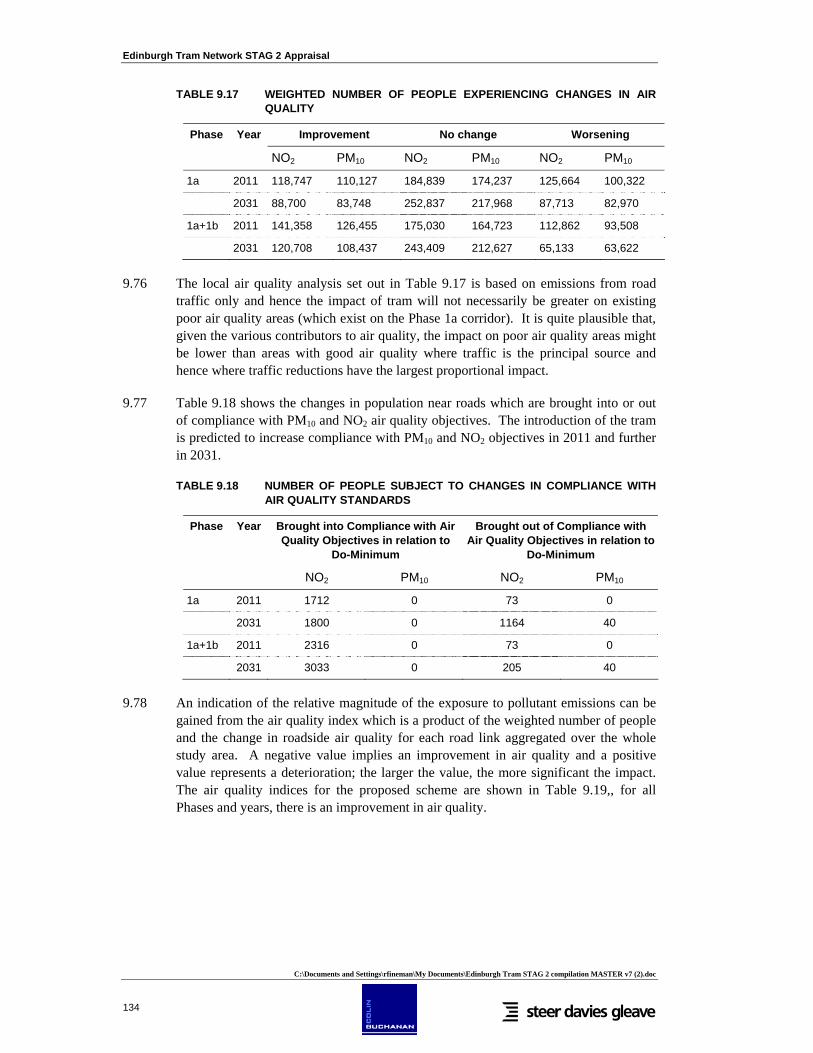
Edinburgh Tram Network STAG 2 Appraisal
C:\Documents and Settings\rfineman\My Documents\Edinburgh Tram STAG 2 compilation MASTER v7 (2).doc
134
TABLE 9.17 WEIGHTED NUMBER OF PEOPLE EXPERIENCING CHANGES IN AIR QUALITY
Phase Year Improvement No change Worsening
NO2 PM10 NO2 PM10 NO2 PM10
1a 2011 118,747 110,127 184,839 174,237 125,664 100,322
2031 88,700 83,748 252,837 217,968 87,713 82,970
1a+1b 2011 141,358 126,455 175,030 164,723 112,862 93,508
2031 120,708 108,437 243,409 212,627 65,133 63,622
9.76 The local air quality analysis set out in Table 9.17 is based on emissions from road traffic only and hence the impact of tram will not necessarily be greater on existing poor air quality areas (which exist on the Phase 1a corridor). It is quite plausible that, given the various contributors to air quality, the impact on poor air quality areas might be lower than areas with good air quality where traffic is the principal source and hence where traffic reductions have the largest proportional impact.
9.77 Table 9.18 shows the changes in population near roads which are brought into or out of compliance with PM10 and NO2 air quality objectives. The introduction of the tram is predicted to increase compliance with PM10 and NO2 objectives in 2011 and further in 2031.
TABLE 9.18 NUMBER OF PEOPLE SUBJECT TO CHANGES IN COMPLIANCE WITH AIR QUALITY STANDARDS
Phase Year Brought into Compliance with Air Quality Objectives in relation to
Do-Minimum
Brought out of Compliance with Air Quality Objectives in relation to
Do-Minimum
NO2 PM10 NO2 PM10
1a 2011 1712 0 73 0
2031 1800 0 1164 40
1a+1b 2011 2316 0 73 0
2031 3033 0 205 40
9.78 An indication of the relative magnitude of the exposure to pollutant emissions can be gained from the air quality index which is a product of the weighted number of people and the change in roadside air quality for each road link aggregated over the whole study area. A negative value implies an improvement in air quality and a positive value represents a deterioration; the larger the value, the more significant the impact. The air quality indices for the proposed scheme are shown in Table 9.19,, for all Phases and years, there is an improvement in air quality.
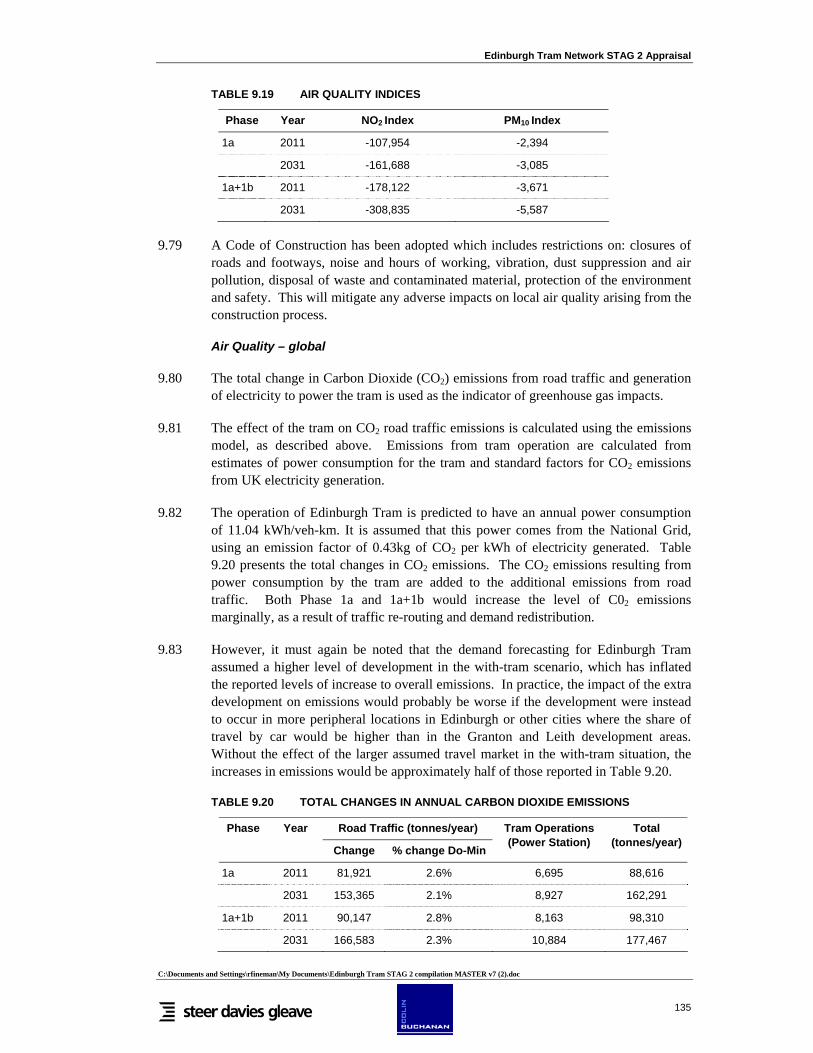
Edinburgh Tram Network STAG 2 Appraisal
C:\Documents and Settings\rfineman\My Documents\Edinburgh Tram STAG 2 compilation MASTER v7 (2).doc
135
TABLE 9.19 AIR QUALITY INDICES
Phase Year NO2 Index PM10 Index
1a 2011 -107,954 -2,394
2031 -161,688 -3,085
1a+1b 2011 -178,122 -3,671
2031 -308,835 -5,587
9.79 A Code of Construction has been adopted which includes restrictions on: closures of roads and footways, noise and hours of working, vibration, dust suppression and air pollution, disposal of waste and contaminated material, protection of the environment and safety. This will mitigate any adverse impacts on local air quality arising from the construction process.
Air Quality – global
9.80 The total change in Carbon Dioxide (CO2) emissions from road traffic and generation of electricity to power the tram is used as the indicator of greenhouse gas impacts.
9.81 The effect of the tram on CO2 road traffic emissions is calculated using the emissions model, as described above. Emissions from tram operation are calculated from estimates of power consumption for the tram and standard factors for CO2 emissions from UK electricity generation.
9.82 The operation of Edinburgh Tram is predicted to have an annual power consumption of 11.04 kWh/veh-km. It is assumed that this power comes from the National Grid, using an emission factor of 0.43kg of CO2 per kWh of electricity generated. Table 9.20 presents the total changes in CO2 emissions. The CO2 emissions resulting from power consumption by the tram are added to the additional emissions from road traffic. Both Phase 1a and 1a+1b would increase the level of C02 emissions marginally, as a result of traffic re-routing and demand redistribution.
9.83 However, it must again be noted that the demand forecasting for Edinburgh Tram assumed a higher level of development in the with-tram scenario, which has inflated the reported levels of increase to overall emissions. In practice, the impact of the extra development on emissions would probably be worse if the development were instead to occur in more peripheral locations in Edinburgh or other cities where the share of travel by car would be higher than in the Granton and Leith development areas. Without the effect of the larger assumed travel market in the with-tram situation, the increases in emissions would be approximately half of those reported in Table 9.20.
TABLE 9.20 TOTAL CHANGES IN ANNUAL CARBON DIOXIDE EMISSIONS
Road Traffic (tonnes/year) Phase Year
Change % change Do-Min
Tram Operations (Power Station)
Total (tonnes/year)
1a 2011 81,921 2.6% 6,695 88,616
2031 153,365 2.1% 8,927 162,291
1a+1b 2011 90,147 2.8% 8,163 98,310
2031 166,583 2.3% 10,884 177,467

Edinburgh Tram Network STAG 2 Appraisal
C:\Documents and Settings\rfineman\My Documents\Edinburgh Tram STAG 2 compilation MASTER v7 (2).doc
136
Water Quality, Drainage and Flood Defence
9.84 The assessment includes surface water features along the route, the quality and sensitivity of these features, hydrogeology and groundwater resources, drainage and flooding. The impacts of construction activities and run-off from the scheme on water quality have been assessed, and mitigation proposed to minimise predicted impacts.
For Phase 1a:
9.85 There are three main watercourses in the vicinity of Edinburgh Tram Line Phase 1a that could potentially be affected by the scheme. These are;
• the River Almond; • the Gogar Burn; and • the Water of Leith.
9.86 The River Almond is the least affected by Phase 1a, as it flows to the north west of Edinburgh Airport, and is not crossed by the tram route. The Gogar Burn is a tributary of the River Almond and, after passing beneath the A8, it flows northward to the Airport boundary, where it flows westwards before entering a culvert near the Airport terminal building to pass beneath the runway and into the River Almond.
9.87 The Gogar Burn is known to cause flooding in areas to the south of the Airport and surrounds and an Area of Importance for Flood Control has been defined in this location. A section of the route for the scheme between the Airport and Ingliston Park and Ride stops would run close to the burn. New crossings of the Gogar Burn would be required close to the Gogarburn and Edinburgh Park stops. In addition, a number of smaller un-named water courses or ditches in the vicinity of the Area of Importance for Flood Control would be crossed. However, a study in 2003 by Edinburgh Airport Rail Link (EARL) showed that, given the mitigation plans, the tram’s impact in this area would be neutral, and this was accepted in the Parliamentary Process.
9.88 The Water of Leith is crossed at Ocean Drive, to the north east of the city, as well as at Murrayfield, on the stretch towards Edinburgh Airport. Recent water quality assessments undertaken by the Scottish Environment Protection Agency (SEPA) indicate that near Ocean Drive the Water of Leith is of good quality. Overall, the Water of Leith is classified as a salmonid water of high amenity. Although existing bridges will be utilised to cross the Water of Leith in the north east, one new crossing will be required immediately west of the Murrayfield Rugby Ground. The Water of Leith is Class B (Fair) at this location and in recent times the river has caused severe flooding of the Rugby Ground and the surrounding area. The practice pitches here are also designated as Areas of Importance for Flood Control. The Murrayfield Flood Prevention Scheme will ensure that the impact of the tram here on the flood risk zone is neutral.
9.89 Stretches of the Gogar Burn have been assessed as Class B (Fair), with the stretch close to the Airport assessed as Class C (Poor) by SEPA. East of the Gogar Roundabout the route runs alongside the recently created Loch Ross, formed by widening the Gogar Burn at this point to create a water feature within Edinburgh Park. SEPA Guidelines and Best Construction Practices will be adopted and mitigation measures implemented during construction to keep the risk of surface water impacts,
Edinburgh Tram Network STAG 2 Appraisal
C:\Documents and Settings\rfineman\My Documents\Edinburgh Tram STAG 2 compilation MASTER v7 (2).doc
137
particularly sediment-laden runoff, to the minimum necessary for the scheme.
9.90 Considering the impact on hydrology and groundwater, much of the scheme is located within the area of a minor aquifer, which contains fractured or potentially fractured rocks. These do not have a high primary permeability or other features of varying permeability. Short sections of the scheme within the city centre are within areas with formations of rock with negligible permeability, generally regarded as containing insignificant quantities of groundwater. In locations where new drainage is required, the principles of Sustainable Urban Drainage Systems (SUDS) will be applied. SUDS measures include detention basins or wetland areas to remove pollutants in the run-off from hard surfaces prior to their discharge to adjacent watercourses. Implementation of mitigation and preventative measures, will ensure that development of the scheme will not result in any significant impacts on existing drainage systems or patterns.
9.91 Areas of contaminated ground are present along the route. Main issues included disused railway land around Baird Drive and Haymarket, as well as areas of made ground close to the Gogar Burn near Castle Gogar (a former landfill believed to have been used for demolition material).
Additional impacts for Phases 1a and 1b combined:
9.92 When including Phase 1b, the tram also crosses the Water of Leith at Coltbridge Viaduct. SEPA’s water quality assessments indicate that near Coltbridge Viaduct, the Water of Leith is of poor quality. As the scheme will utilise existing bridges to cross the Water of Leith, construction of the tram is unlikely to significantly impact water quality. SEPA Guidelines and Best Construction Practices will be adopted and mitigation measures implemented during construction to keep the risk of surface water impacts, particularly sediment-laden runoff, to the minimum necessary for the scheme.
9.93 Similar to Phase 1a, impact on drainage is minimal to neutral. Within the Roseburn Railway Corridor the gradient of surrounding land varies, with the tram running on embankment and in cutting within different sections of the corridor. The existing drainage regime of the corridor consists of stormwater drains installed for the former railway and these will be utilised for the operation of the tram.
Summary
9.94 Overall the scheme, with the planned flood mitigation programmes in the problem areas of Murrayfield and Gogarburn, is expected to have a neutral impact on flooding risk. Surface water quality and drainage may suffer slight negative impacts in the short term, during construction. Best construction practices will be adopted to minimise any sediment laden or contaminated runoff during construction. Utilisation of existing drainage and installation of sustainable drainage measures where appropriate will ensure that the operation of the scheme will not result in adverse impacts to water quality.
9.95 The construction works will involve bridge construction and temporary disturbance, which would have a direct temporary impact on the channel and banks of the Water of Leith and the Gogar Burn. It would also be necessary to construct a culvert over a minor unnamed watercourse, which is a tributary of the Gogar Burn. There would also be a number of land-based activities associated with the construction works,

Edinburgh Tram Network STAG 2 Appraisal
C:\Documents and Settings\rfineman\My Documents\Edinburgh Tram STAG 2 compilation MASTER v7 (2).doc
138
which could potentially have an impact on surface waters in the vicinity. The Code of Construction58 includes instructions to follow to avoid unnecessary damage.
9.96 Proposed mitigation would comprise the following:
• Construction activities would take place in accordance with all relevant legislation, codes of practice and Pollution Prevention Guidelines for protection of ground and surface water, with submission of an environmental method statement to SEPA.
• Temporary site drainage and/or treatment (e.g. settlement lagoons) would be put in place to manage site run-off and accidental spills of fuel, etc., during construction
• Identification of potential risks from possible contaminated land that would be disturbed by the proposed development.
• Temporary and permanent works would be designed to minimise disruption to water courses.
• The route drainage system would be designed to avoid pollution of watercourses and groundwater during operation though installation of interceptors, settlement tanks, etc.
9.97 The potential impacts to surface water, associated with the construction of the tram line, would be Minor and would be largely due to the temporary works associated with the construction of two new crossings of the Water of Leith and the Gogar Burn.
9.98 Assuming that adequate and well designed drainage is put in place that would collect and/or treat any contaminated run off and/or spills and that an effective management system and training is implemented to prevent inappropriate disposal or spills, potential impacts to groundwater from the proposed scheme would be Neutral.
9.99 Appropriate risk assessment of potential risks from contamination would be necessary to inform the site environmental management planning and development of appropriate mitigation measures for contaminated land risks. With these mitigation measures in place this would ensure that contact between potential contaminants and any identified receptors is minimised and the risk reduced to acceptable levels. The overall impact is assessed as being Neutral.
Geology
9.100 This section considers the impacts of the development on geology and soils and effects resulting from the presence of potentially contaminated land.
9.101 The route is underlain by glacial or raised marine deposits with areas of made ground. The underlying bedrock comprises sedimentary rocks consisting of mudstone, siltstone, sandstone and occasional thin limestones and coal seams, all of Carboniferous age. Superficial geological deposits of the area, as described by BGS, indicate that the route is principally underlain by Glacial Till (Boulder Clay).
58 Edinburgh Tram Lines 1 and 2: Code of Construction Practice (March 2006) published by tie Ltd.

Edinburgh Tram Network STAG 2 Appraisal
C:\Documents and Settings\rfineman\My Documents\Edinburgh Tram STAG 2 compilation MASTER v7 (2).doc
139
9.102 The proposed route runs in proximity to two designated sites; a Geological Site of Special Scientific Interest (SSSI) at Calton Hill; and the Castle Rock SSSI (Edinburgh Castle). Calton Hill SSSI extends to approximately 13ha, and is designated for its geological interest as part of Arthur’s Seat Volcano SSSI complex. The site is approximately 100m from the route at the top of Leith Walk. Castle Rock SSSI is close to the route at Princes Street, albeit on the far side of the main railway line west from Waverley Station. Neither should be affected by the route.
9.103 Impacts to soils along the route are likely to be generic to construction activity including erosion, disaggregation, compaction and pollution. Soil erosion as a result of development is most likely to occur in the form of water erosion where the mean annual rainfall, storm intensity and frequency are comparatively high. The removal of vegetation will contribute to erosion. Where erosion by water occurs, chemical transfer to surrounding watercourses may be an impact. Disaggregation is effectively the mixing up of soils when disturbed, both physically and chemically, and can result in problems for the re-establishment of vegetation where the chemical composition is altered. Compaction can hamper the infiltration of water resulting in increased runoff and erosion. Soil compaction can also result in difficulties for the reestablishment of vegetation in terms of root penetration and waterlogging. Pollution of soils can occur from a number of sources, in particular vehicle oils, construction materials and lead from exhausts.
9.104 Throughout the development, good practice will be adopted in order to prevent the occurrence of these potential impacts, particularly in sections of the route that are off-street. The prevention of soil erosion will involve minimising the removal of vegetation during development, and revegetation of bare areas as soon as possible. Suitable drainage systems will be put in place in order to prevent surface water build up. Some degree of disaggregation is likely to occur regardless of the mitigation measures implemented, although removal and storage of soil horizons separately can help to reduce this significantly. Using vehicles with wide tyres to spread vehicle weight, minimising the width of tracks for vehicular access, and tilling of the area will all assist in reducing compaction. Assuming that good practice measures are adopted during construction of the tram, no significant impacts on soil resources are predicted.
9.105 Any contaminated material encountered during construction will be dealt with in compliance with best practice, current legislation and statutory guidance, and no significant impacts resulting from the presence of contaminated material are predicted. The presence of contaminated land along the corridor is not expected to present any over-riding obstacle to development of the route. For areas where site investigation reveals the presence of contaminated land, a management plan will be prepared in order to comply with all relevant legislation. The plan will set out measures to avoid the remobilisation of contaminants via surface waters, groundwater and in the ambient air. Where potentially contaminated material is excavated, it will be investigated to determine the concentrations of any contaminants and to establish whether the material can be placed elsewhere on the site, and whether it should be classified as an environmental hazard by SEPA, or as special waste.
Additional impacts for Phases 1a and 1b combined:
9.106 Adding Phase 1b results in the tram running by a Regionally Important Geological Site (RIGS), at Craigleith. This site was a former quarry and was designated a RIGS in

Edinburgh Tram Network STAG 2 Appraisal
C:\Documents and Settings\rfineman\My Documents\Edinburgh Tram STAG 2 compilation MASTER v7 (2).doc
140
1999 by the Edinburgh Geological Society. Craigleith Quarry was operational for over 300 years, providing much of the sandstone used in the construction of Edinburgh's New Town in the 18th and 19th Centuries. The site is now a retail park, although the RIGS designation has renewed interest in the scientific and educational value of the rock outcrops. The proposed route passes approximately 30 metres west of the rock outcrops and is separated from the RIGS site by South Groathill Avenue. The proposed tram route will consequently have no impact on the Craigleith RIGS. The proposals will not impact on the future workings of any mineral reserves.
Summary
9.107 No impacts on designated geological sites such as SSSIs and RIGS are predicted from the construction and operation of the Edinburgh Tram. In addition, no impacts on active or mineral resources are predicted. Both of these impacts have therefore been assessed as Neutral.
9.108 During construction there will be the requirement to dispose of material from within the route as required by the detailed design. It is possible that some of this waste material would come from areas that are potentially contaminated. Particular issues would include known areas of made ground such as railway embankments, former railway or industrial and the area of former landfill at Gogar.
9.109 Waste would also be generated during operation of the scheme. This would be handled and disposed of according to current Waste Management legislation. The impact from waste management issues is therefore assessed as Minor.
Biodiversity
9.110 An outline of the development proposals has been compared with the findings of the baseline survey to predict the direct impacts that may result from the scheme. In addition, likely effects on known habitats of nature conservation value in proximity to the scheme have been considered. The Landscape and Habitat Management Plan 59 (LHMP) investigates and address these issues in detail. The first publication of the document was agreed during the parliamentary process for Line 1. It is however a ‘living’ document, which evolves as the detailed design changes.
For Phase 1a:
9.111 The proposed route runs mainly along existing roads. These are of limited nature conservation interest, with habitats restricted to street trees and amenity grassland strips. Other habitats in the surrounding area include those associated with parkland, gardens and abandoned land. The main fresh watercourse in the area is the Water of Leith.
9.112 A number of habitats are found along the proposed route including extensive areas of low value amenity and improved grassland, tall ruderal, introduced shrub, arable land and field boundaries have been identified along the tram route. Those of note include
59 Landscape and Habitat Management Plan, by ERM for tie Ltd, first published June 2005 (accessible via tiewebsite http://tt.tiedinburgh.co.uk/documents.html)
Edinburgh Tram Network STAG 2 Appraisal
C:\Documents and Settings\rfineman\My Documents\Edinburgh Tram STAG 2 compilation MASTER v7 (2).doc
141
woodland (broadleaf and mixed, no ancient woodland) and watercourses (the Gogar Burn and the Water of Leith).
9.113 Non-statutory designated areas along the route include Water of Leith Urban Wildlife Sit (UWS), Gogar Burn Site of Interest for Nature Conservation (SINC) and UWS. In addition, Carrick Knowe Golf Course is a Neighbourhood Nature Area (NNA).
9.114 Protected mammal species known to be present within the route study area include badgers, bats and otters. There are several Local Biodiversity Action Plan (LBAP) habitats and species within the route corridor.
9.115 Construction of the tram will result in significant temporary and permanent impacts to badger. Mitigation measures will be implemented to ensure that works undertaken in close proximity to badger setts and foraging habitat comply with the requirements of relevant legislation, in consultation with Scottish Natural Heritage (SNH) and the Scottish Executive Countryside and Natural Heritage Unit (CANHU). Appropriate mitigation measures will be implemented, in agreement with CANHU and SNH, to minimise habitat loss and disturbance to badger. This involves the creation of artificial setts and is outlined in the LHMP.
Additional impacts for Phases 1a and 1b combined:
9.116 When including Phase 1b, the stretch of the route that supports the most significant terrestrial vegetation is the Roseburn Railway Corridor. This includes woodland and grassland habitats.
9.117 Phase 1b of the route is aligned along the Roseburn Railway Corridor, an Urban Wildlife Site (UWS), for approximately 3km and will encroach into the ‘Coastline’ UWS along approximately 250m at Wardie Shore. The Water of Leith UWS is crossed via Coltbridge Viaduct in the Wester Coates area.
9.118 In terms of protected species in the vicinity, there are extensive signs of breeding and foraging badger along the Roseburn Railway Corridor. Additionally, pipistrelle bats (55kHz) were recorded foraging along the corridor during a September survey. No roosts were identified.
9.119 Construction of the tracks and walkway/cycleway will result in a significant impact to the Roseburn Railway Corridor UWS. The majority of vegetation will be removed along the embankments, affecting its function as a wildlife corridor. The impacts on this corridor will be limited to the minimum necessary through the implementation of mitigation measures, including the adoption of best practice measures during construction. As much vegetation will be retained as possible, consistent with safe completion of the works. No particular plant species of interest are known from the route.
Landscape
9.120 Landscape impacts are physical changes caused by a development which affect the character of the landscape and how it is experienced. They can consist of direct impacts on specific landscape features and elements or more subtle effects upon the overall pattern of elements, which together make up the local character. Where the

Edinburgh Tram Network STAG 2 Appraisal
C:\Documents and Settings\rfineman\My Documents\Edinburgh Tram STAG 2 compilation MASTER v7 (2).doc
142
area being discussed is predominantly built-up, it is described as ‘townscape’ rather than landscape.
9.121 Edinburgh is long established as one of UK’s national cultural assets and is the most highly valued of Scottish townscapes. It contains one of the largest areas of Georgian architecture in Europe and almost the entire city centre is inscribed on the UNESCO register of World Heritage Sites due to its unique architectural heritage and distinctive townscape. Conservation areas cover about one third of the city and there is general agreement that its special urban qualities have to be safeguarded and protected.
For Phase 1a:
9.122 In this section the existing townscape of the area affected by the tram are divided into ‘character zones’ to aid description and analysis60. The major impacts of the tram on these various townscapes are then described, zone by zone. Mitigation proposals by tie are given at the end of the section.
9.123 The tramline’s design proposals include the following elements relevant to the assessment of landscape impacts:
• A twin-track light rapid transit track-bed, generally at existing grade, paved in a variety of materials according to the situation;
• Stops with shelters, lighting, seating, ticketing and information; • Tram vehicles; • Overhead line equipment – conductor wires, supported on a combination of
cables or poles; • Substations; • Signalling equipment and signs; • The tram depot; and • Alterations to various existing bridge and retaining wall structures.
9.124 A number of major road junctions will be comprehensively redesigned and existing traffic will be diverted from the tram route in a number of places. There will be some townscape impacts off-site due to changes in traffic flows but these are expected to cause no significant impacts on the townscape.
9.125 The main sources of townscape impact will be the overhead infrastructure (wires and supports referred to as overhead line equipment (OLE)) new and altered structures such as bridges, new buildings, the tram depot and substations, and the tram stops with their associated shelters, seating, etc.
9.126 The tram signalling equipment and additional traffic signalling and signage will generally have small effects but they will add clutter to the streetscape and may in sensitive locations raise the overall townscape impact above a threshold for significant impacts.
60 The methodology is based on the ‘Guidelines for Landscape and Visual Assessment’ (LI and IEMA, 2nd Edition, 2002) and the STAG guidelines.
Edinburgh Tram Network STAG 2 Appraisal
C:\Documents and Settings\rfineman\My Documents\Edinburgh Tram STAG 2 compilation MASTER v7 (2).doc
143
9.127 The tram vehicles themselves will also have an impact in areas not currently trafficked, such as the railway corridor.
9.128 Construction activities for the tram will appear as an ordinary construction site of the sort common in urban areas, except that the sites will generally be long and linear, and will partially fill what are normally spaces within the fabric of the city. Many activities, such as the erection of the OLE supports and the equipping of the line will be of such short duration that their effect on the townscape is negligible. Several locations have been identified for use as construction compounds; these include the old bus depot site in Leith, vacant sites at Crewe toll, Craigleith, Saughton, Balgreen and Ingliston Park and Ride. These sites are all within the Limits of Land to be Acquired or Used (LLAU) as defined within the Tram Act, and will be reinstated following construction activity.
9.129 The tram will be a new element in the city, clearly visible to all and its impact will be dependent on the design of the system. There is substantial potential for mitigation through ensuring that the various new and altered elements are appropriately designed and integrated into the fabric of the city.
9.130 A Design Manual has been prepared, and this sets out the principles of urban design and detailing to be followed in the final design. This will provide specimen designs for key areas, including the whole of the World Heritage Site. Contract requirements will ensure that the final design complies with the Design Manual.
9.131 General mitigation commitments arising from the Design Manual include:
• Improvements to the pedestrian realm affected by the tram, including comprehensive wall to wall repaving of key areas;
• Careful design of the OLE to simplify the layout, balancing conductor wire and support cable sizes against support spacing so as to minimise the size of the wiring;
• Detailing and design of wire supports and their arrangement to suit the form of the street, particularly at junctions;
• Use of visually appropriate methods of OLE support, including designing a simple and elegant support column, attractive in its own right;
• Integrating the OLE supports with other vertical elements in the street (lighting and signing poles) as far as possible, and coordinating the spacing of new and existing poles, replacing existing lighting columns where appropriate;
• Simple alignment of the tram track to avoid as far as reasonably possible the need for complex OLE support structures or wiring, including straight alignments along the principal city centre streets to respect the formality of urban design of the New Town;
• Use of surfacing and kerb materials appropriate to the location, in accordance with CEC public realm guidelines;
• Coordinated and visually integrated design of tram stops, creating high quality pedestrian spaces, with the shelters, seating, signage and other equipment designed as an integrated whole, visually light and transparent.
9.132 A summary of the impacts on each townscape zone around the city centre is given in Table 9.21. The section of the route in Phase 1a which extends from Haymarket to Edinburgh Airport has been assessed in a slightly different way, and is described after

Edinburgh Tram Network STAG 2 Appraisal
C:\Documents and Settings\rfineman\My Documents\Edinburgh Tram STAG 2 compilation MASTER v7 (2).doc
144
TABLE 9.21 SUMMARY OF LANDSCAPE IMPACTS (PHASE 1A) Location Description Importance Impact
Haymarket Potentially complex OLE support. Road alterations and demolitions weaken enclosure of junction area. Tram stop will improve Haymarket Terrace.
World Heritage Site New Town Conservation Area (CA)
West of Haymarket Terrace: minor adverse to minor beneficial. East of Haymarket Terrace: major adverse. The tram stop: small area major beneficial.
West End OLE in designed vista. Road widened into gardens.
World Heritage Site New Town CA West End CA
Major adverse.
Princes Street OLE in designed vista and iconic tourist views. Footway widening.
World Heritage Site New Town CA
Overall major adverse, primarily arising from the OLE. Footway widening beneficial
St Andrew Sq OLE in designed vista and iconic tourist views.
World Heritage Site New Town CA
Major adverse impact.
Queen St to Picardy Pl
OLE in designed vista. Road widened and awkward level changes.
World Heritage Site New Town CA
Major adverse impact. Particular impact on National Portrait Gallery.
Leith Walk Road widening and loss of enclosure, but also improvement opportunity at top of Walk. OLE particularly visible in long views. Loss of street trees at north end.
World Heritage Site (part) New Town CA (part) Leith CA (part)
Overall major adverse impact.
Leith Distinctive small-scale local character, highly sensitive to change.
Leith CA Major adverse impact
Port of Leith Tram a minor additional element in industrial parts, part of a much wider change elsewhere.
Leith CA (part) Generally, minor impact, moderate in limited areas.
9.133 The section of route from Gogar roundabout to the Airport runs to the north of an Area of Great Landscape Value (AGLV) at Gogar. There is a Designed Landscape (Millburn Tower) to the south west of this stretch of corridor route, but this would be entirely unaffected by the tram proposals as there would be little intervisibility between the landscapes and the proposed tram route. The section of tram corridor from Gogar roundabout to the Airport falls within Green Belt designated land of which the local landscape character, under local plan policy is to be protected, maintained and enhanced. The tram corridor would also run adjacent to various areas of open space identified and protected under local plan policy.
9.134 Localised minor positive landscape impacts would arise particularly for the housing areas bounding Broomhouse and Stenhouse Drives due to the proposed mitigation planting along the tram corridor and the mixed woodland screen planting between the railway and tram corridors.
9.135 The area around Edinburgh Park comprises large business related developments including the modern office development set in spacious, attractive landscape grounds.

Edinburgh Tram Network STAG 2 Appraisal
C:\Documents and Settings\rfineman\My Documents\Edinburgh Tram STAG 2 compilation MASTER v7 (2).doc
145
It is anticipated that only minor negative or neutral landscape impacts would occur in this area, with occasional minor positive impacts as a result of the mitigation planting. Negative landscape impacts for example would be associated with the tram line running through the landscape corridor in Edinburgh Park and the introduction of the overbridge at Hermiston Gait.
9.136 The more rural/urban fringe area between the City Bypass and the Airport generally comprises of highly sensitive and very attractive, good quality landscape. It is characterised by the rural matrix of predominantly arable farmland subtle topographic and woodland features with the traditional estate planting together with agricultural shelterbelts creating a strong and positive influence on the appearance of the landscape. The introduction of the tram would have direct landscape impacts on the historic setting of Gogar Church resulting in moderate negative impacts. Generally however, landscape character at the Airport and sections of infrastructure corridors where the mitigation planting would enhance the existing landscape framework.
9.137 To conclude, although the scheme provides opportunities for enhancing the local landscape in certain areas, several major adverse impacts can be expected at varying degrees in different locations along the route.
Additional impacts for Phases 1a and 1b combined:
9.138 Phase 1b adds further landscape zones of the ‘railway corridor’, Pilton, Waterfront Granton. Impact analysis for these is summarised in Table 9.22 below.
TABLE 9.22 SUMMARY OF LANDSCAPE IMPACTS (PHASE 1b)
Location Description Importance Impact
Waterfront Granton
Part of a much wider change.
- Minor to neutral impact.
Pilton Tram will be a minor addition.
- Minor adverse impact.
Railway Corridor Significant vegetation removal required.
Coltbridge and Wester Coates CA (part)
Major adverse landscape impact
9.139 Overall the introduction of the tram into this wider character area, including the committed mitigation would have minor negative to neutral landscape impacts, primarily arising from the OLE and the localised removal of mature tree planting. However, at the railway corridor section, particularly at Roseburn, the negative landscape impacts increase to major adverse.
Visual Amenity
9.140 Visual impacts are changes in the composition and character of views available to people living, working and recreating in the area affected by the proposed development, changes in the visual amenity enjoyed by those who benefit from those views, and people’s responses to these changes.
9.141 By definition, visual effects can only occur where the tram system is visible. Along much of the route, the tram and its infrastructure will be seen from a comparatively

Edinburgh Tram Network STAG 2 Appraisal
C:\Documents and Settings\rfineman\My Documents\Edinburgh Tram STAG 2 compilation MASTER v7 (2).doc
146
restricted area: from buildings facing directly onto the tram line and from streets that cross the line. The buildings that form the streets generally block views from further afield. The exceptions to this are where the tram runs through or alongside open space – most importantly along Princes Street, but also through parts of the Port of Leith.
For Phase 1a:
9.142 This section describes the extent of the area affected by Tram (Phase 1a), the sensitivity of the various receptors of visual impact, the extent of visibility of the proposals and the potential visual impacts. It also sets out the measures proposed for the mitigation of these impacts61.
9.143 Visual impacts will be created by:
• The tram infrastructure – overhead line equipment, signals, stops and shelters; • The tram vehicles themselves; • The buildings associated with the tram, such as the depot and the substations; and • Alterations to structures such as the embankments on the railway corridor.
9.144 The sensitivity of the receptors of visual impact varies according to their activity and expectations. Those for whom the view is important or where changes will be particularly noticed, such as people enjoying tourist locations or outdoor recreation activities, iconic views of the city, designed vistas in the New Town and the main outlook from residential properties are highly sensitive. People travelling through or past (on roads and railways), shoppers and people enjoying indoor recreation activities are less sensitive and those whose attention can reasonably be expected to be focussed on their work or activity, i.e. offices and other workplaces, are least sensitive.
9.145 There will be visual impacts on virtually all the properties and roads along the tram route, on public open spaces and recreational sites such as Princes Street Gardens, St Andrew Square and from important tourist viewpoints such as Princes Street and Edinburgh Castle.
9.146 Major visual impacts are caused where proposed development is clearly noticeable and affects the character or quality of view for sensitive receptors. For this reason there will be major visual impacts along much of the route because of the unavoidable visibility of much of the tram infrastructure, particularly the overhead line equipment, from houses and flats along the route and from many of the main city centre tourist locations.
9.147 A summary of the visual amenity impacts is presented in Table 9.23.
61 Consultations regarding the visual impacts of Tram Line 1 have been undertaken with CEC City Development (Planning), Historic Scotland and Edinburgh World Heritage Trust. The methodology is based on the ‘Guidelines for Landscape and Visual Assessment’ (LI and IEMA, 2nd Edition, 2002) and the STAG guidelines.
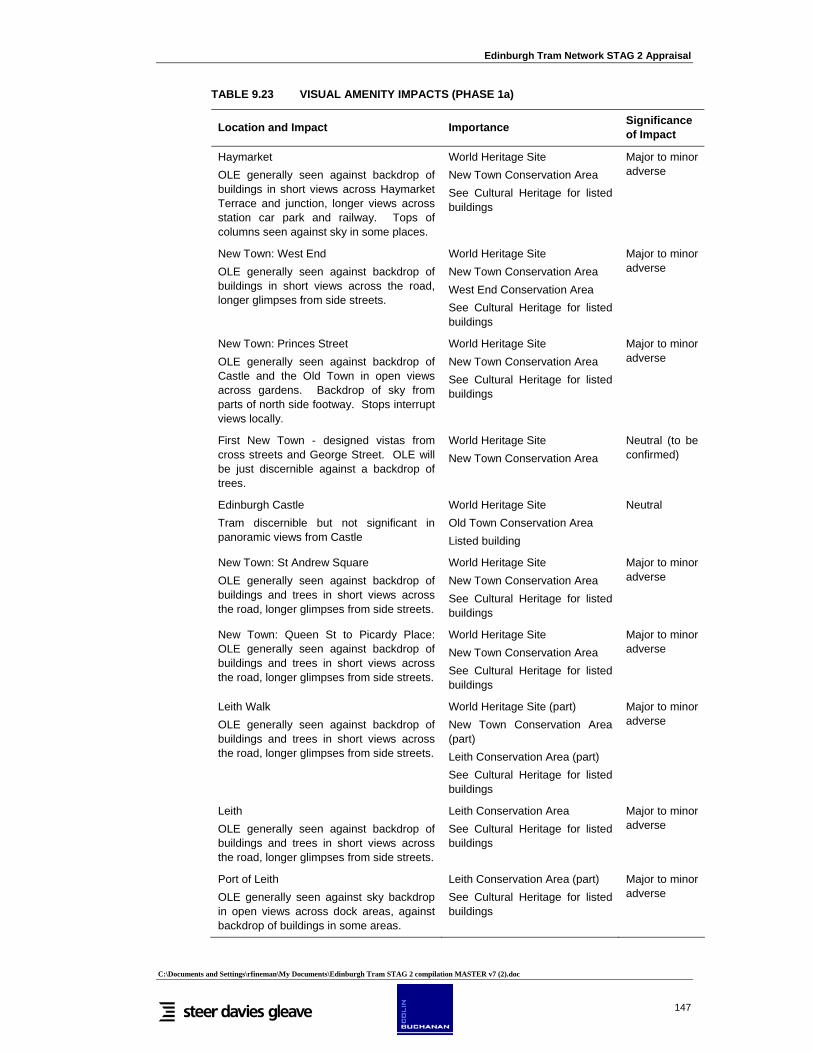
Edinburgh Tram Network STAG 2 Appraisal
C:\Documents and Settings\rfineman\My Documents\Edinburgh Tram STAG 2 compilation MASTER v7 (2).doc
147
TABLE 9.23 VISUAL AMENITY IMPACTS (PHASE 1a)
Location and Impact Importance Significance of Impact
Haymarket OLE generally seen against backdrop of buildings in short views across Haymarket Terrace and junction, longer views across station car park and railway. Tops of columns seen against sky in some places.
World Heritage Site New Town Conservation Area See Cultural Heritage for listed buildings
Major to minor adverse
New Town: West End OLE generally seen against backdrop of buildings in short views across the road, longer glimpses from side streets.
World Heritage Site New Town Conservation Area West End Conservation Area See Cultural Heritage for listed buildings
Major to minor adverse
New Town: Princes Street OLE generally seen against backdrop of Castle and the Old Town in open views across gardens. Backdrop of sky from parts of north side footway. Stops interrupt views locally.
World Heritage Site New Town Conservation Area See Cultural Heritage for listed buildings
Major to minor adverse
First New Town - designed vistas from cross streets and George Street. OLE will be just discernible against a backdrop of trees.
World Heritage Site New Town Conservation Area
Neutral (to be confirmed)
Edinburgh Castle Tram discernible but not significant in panoramic views from Castle
World Heritage Site Old Town Conservation Area Listed building
Neutral
New Town: St Andrew Square OLE generally seen against backdrop of buildings and trees in short views across the road, longer glimpses from side streets.
World Heritage Site New Town Conservation Area See Cultural Heritage for listed buildings
Major to minor adverse
New Town: Queen St to Picardy Place: OLE generally seen against backdrop of buildings and trees in short views across the road, longer glimpses from side streets.
World Heritage Site New Town Conservation Area See Cultural Heritage for listed buildings
Major to minor adverse
Leith Walk OLE generally seen against backdrop of buildings and trees in short views across the road, longer glimpses from side streets.
World Heritage Site (part) New Town Conservation Area (part) Leith Conservation Area (part) See Cultural Heritage for listed buildings
Major to minor adverse
Leith OLE generally seen against backdrop of buildings and trees in short views across the road, longer glimpses from side streets.
Leith Conservation Area See Cultural Heritage for listed buildings
Major to minor adverse
Port of Leith OLE generally seen against sky backdrop in open views across dock areas, against backdrop of buildings in some areas.
Leith Conservation Area (part) See Cultural Heritage for listed buildings
Major to minor adverse

Edinburgh Tram Network STAG 2 Appraisal
C:\Documents and Settings\rfineman\My Documents\Edinburgh Tram STAG 2 compilation MASTER v7 (2).doc
148
9.148 For the stretch from Haymarket to the Airport, the impacts vary. Generally, as the line gets further from the city centre, the visual envelope increases, and visual awareness of the tram corridor is more extensive.
9.149 From Haymarket west the visual envelope is contained in sections by localised planting and buildings but generally forms a relatively wide corridor contained by flats and the railway corridor to the south and open to the north extending across Carrick Knowe golf course towards Corstorphine Hill. The envelope from Carrick Knowe west remains wide although largely defined by the railway corridor to the north and by buildings to the south. Principal receptors along this section of corridor include, properties which lie adjacent to and/or have views overlooking the route corridor; employees working in offices and of the various industrial and commercial premises located adjacent to and/or with views of the route and users of the various footpaths and open spaces which either cross, run adjacent to or have views of the tram route.
9.150 From Gogar Roundabout west the visual envelope is more open and extensive. The envelope although often contained to the south by landform and woodland planting is open encompassing large areas to the north with localised built developments, occasional landform and pockets of planting restricting views. Receptors along this section include residents of the various scattered properties and pockets of concentrated development, users of the Airport and visitors to the showground, travellers using the various infrastructure corridors including the A8 and various footpaths and cycle ways which have views of the tram route.
9.151 The mitigation for the visual impacts is generally to design the tram system well, so that it fits comfortably into the scene as far as possible. Elements such as the stops and road alterations which can be designed as positive features will be treated as such, so that whilst they are visible they do not detrimentally affect the quality of the view. Elements that will by their very nature be seen as detrimental, specifically the OLE, will be designed to be as visually light as possible, cleanly and simply detailed.
9.152 A Design Manual has been prepared; this sets out the principles of design and detailing and in the construction contract will ensure that the final design complies with the Design Manual. Points in the Manual that are specifically intended to reduce the visual impact of the tram include:
• Careful design of the OLE to simplify the layout, balancing conductor wire and support cable sizes against support spacing so as to minimise the size of the wiring;
• Detailing and design of wire supports and their arrangement to suit the form of the street, particularly at junctions;
• To use visually appropriate methods of OLE support, including designing a simple and elegant support column, attractive in its own right;
• To integrate the OLE supports with other vertical elements in the street (lighting and signing poles) as far as possible, and coordinate the spacing of new and existing poles, replacing existing lighting columns where appropriate; and
• Simple alignment of the tram track to avoid as far as reasonably possible the need for complex OLE support structures or wiring.

Edinburgh Tram Network STAG 2 Appraisal
C:\Documents and Settings\rfineman\My Documents\Edinburgh Tram STAG 2 compilation MASTER v7 (2).doc
149
9.153 A number of views and viewpoints are particularly important in Edinburgh because of the designed vistas in the New Town and because of the importance of tourism in the city. Examples are former are the views down Princes Street towards Calton Hill, down St David Street to the Scott Monument, down Castle Street towards the Castle, and along George Street to St Andrew Square. Examples of the latter are the views from Princes Street, looking diagonally towards the Castle and views from the Castle across the New Town.
9.154 Where possible, these views have been taken into account in the indicative design. For example, the Princes Street stop will be located so that it does not affect the view from Castle Street. The central alignment on Princes Street was partly determined by the requirement to minimise the effect on views out of the street and to allow for simple, and thus visually lighter, OLE design. The overall assessment for Visual Impact is that impacts would be minor negative although significant for localised sections of the tram corridor, but elsewhere would not be significant.
Additional impacts for Phases 1a and 1b combined:
9.155 Along the railway corridor there will be major adverse visual impacts caused by the opening up of views to a newly active line, that are currently screened by vegetation and embankments, where these are being cut back. Here, mitigation can and will be provided by screening, particularly replacing and reinforcing hedges along the site boundary. A summary of this and the other impacts along this section of the route is shown in.Table 9.24.
TABLE 9.24 VISUAL AMENITY IMPACTS (PHASE 1b)
Location and Impact Importance Significance of Impact
Waterfront Granton OLE generally seen against backdrop of buildings and trees in short to medium views across the new transport boulevard, longer glimpses from side streets.
Moderate to minor adverse (compared to new development without tram)
Pilton OLE generally seen against backdrop of buildings in short views across the road, longer glimpses from side streets
Moderate to minor adverse
Railway Corridor Views into railway corridor from surrounding houses substantially opened up. OLE and passing trams become visible, generally against backdrop of buildings and trees in short to medium views. Views substantially opened up at S end where embankment re-graded.
Coltbridge and Wester Coates Conservation Area (part)
Major to minor adverse
Agriculture and soils
For Phase 1a:
9.156 The section of the route which passes between the airport and Haymarket will pass through several fields which are currently used for arable or under ‘set aside’. All fields are classified as Class 2 agricultural land i.e. high quality. Typically, tenant farmers hold short-term leases.
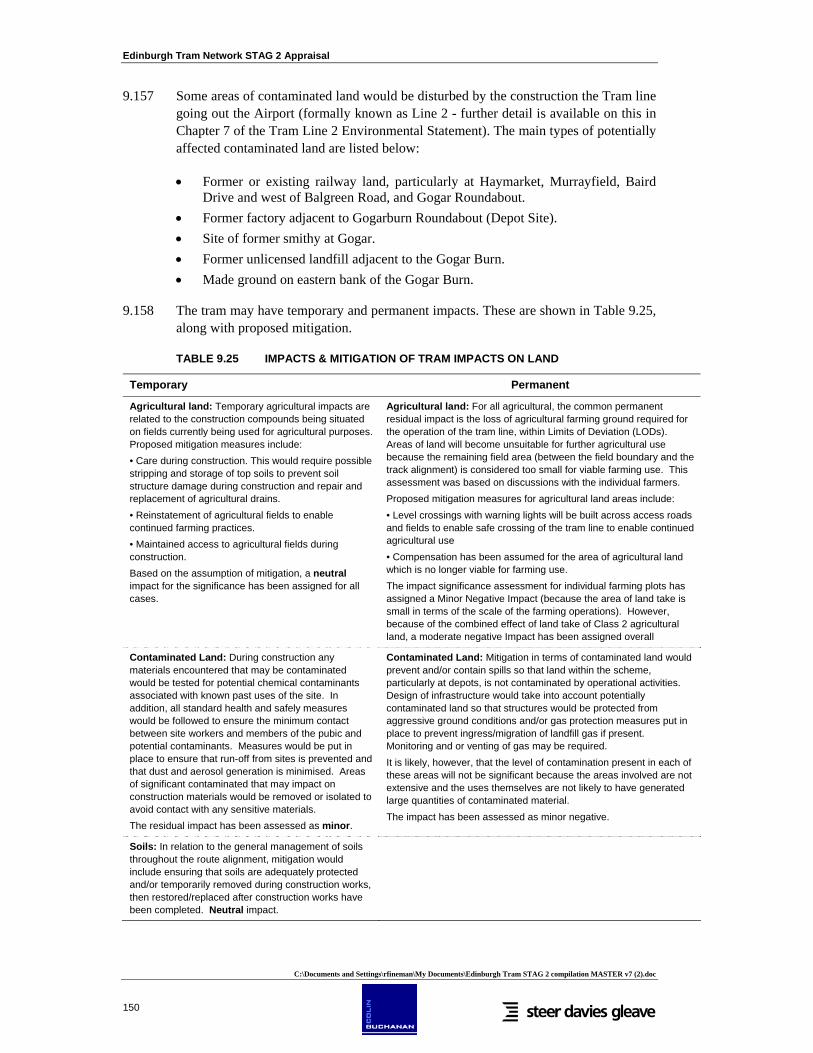
Edinburgh Tram Network STAG 2 Appraisal
C:\Documents and Settings\rfineman\My Documents\Edinburgh Tram STAG 2 compilation MASTER v7 (2).doc
150
9.157 Some areas of contaminated land would be disturbed by the construction the Tram line going out the Airport (formally known as Line 2 - further detail is available on this in Chapter 7 of the Tram Line 2 Environmental Statement). The main types of potentially affected contaminated land are listed below:
• Former or existing railway land, particularly at Haymarket, Murrayfield, Baird Drive and west of Balgreen Road, and Gogar Roundabout.
• Former factory adjacent to Gogarburn Roundabout (Depot Site). • Site of former smithy at Gogar. • Former unlicensed landfill adjacent to the Gogar Burn. • Made ground on eastern bank of the Gogar Burn.
9.158 The tram may have temporary and permanent impacts. These are shown in Table 9.25, along with proposed mitigation.
TABLE 9.25 IMPACTS & MITIGATION OF TRAM IMPACTS ON LAND
Temporary Permanent
Agricultural land: Temporary agricultural impacts are related to the construction compounds being situated on fields currently being used for agricultural purposes. Proposed mitigation measures include: • Care during construction. This would require possible stripping and storage of top soils to prevent soil structure damage during construction and repair and replacement of agricultural drains. • Reinstatement of agricultural fields to enable continued farming practices. • Maintained access to agricultural fields during construction. Based on the assumption of mitigation, a neutral impact for the significance has been assigned for all cases.
Agricultural land: For all agricultural, the common permanent residual impact is the loss of agricultural farming ground required for the operation of the tram line, within Limits of Deviation (LODs). Areas of land will become unsuitable for further agricultural use because the remaining field area (between the field boundary and the track alignment) is considered too small for viable farming use. This assessment was based on discussions with the individual farmers. Proposed mitigation measures for agricultural land areas include: • Level crossings with warning lights will be built across access roads and fields to enable safe crossing of the tram line to enable continued agricultural use • Compensation has been assumed for the area of agricultural land which is no longer viable for farming use. The impact significance assessment for individual farming plots has assigned a Minor Negative Impact (because the area of land take is small in terms of the scale of the farming operations). However, because of the combined effect of land take of Class 2 agricultural land, a moderate negative Impact has been assigned overall
Contaminated Land: During construction any materials encountered that may be contaminated would be tested for potential chemical contaminants associated with known past uses of the site. In addition, all standard health and safely measures would be followed to ensure the minimum contact between site workers and members of the pubic and potential contaminants. Measures would be put in place to ensure that run-off from sites is prevented and that dust and aerosol generation is minimised. Areas of significant contaminated that may impact on construction materials would be removed or isolated to avoid contact with any sensitive materials. The residual impact has been assessed as minor.
Contaminated Land: Mitigation in terms of contaminated land would prevent and/or contain spills so that land within the scheme, particularly at depots, is not contaminated by operational activities. Design of infrastructure would take into account potentially contaminated land so that structures would be protected from aggressive ground conditions and/or gas protection measures put in place to prevent ingress/migration of landfill gas if present. Monitoring and or venting of gas may be required. It is likely, however, that the level of contamination present in each of these areas will not be significant because the areas involved are not extensive and the uses themselves are not likely to have generated large quantities of contaminated material. The impact has been assessed as minor negative.
Soils: In relation to the general management of soils throughout the route alignment, mitigation would include ensuring that soils are adequately protected and/or temporarily removed during construction works, then restored/replaced after construction works have been completed. Neutral impact.
Edinburgh Tram Network STAG 2 Appraisal
C:\Documents and Settings\rfineman\My Documents\Edinburgh Tram STAG 2 compilation MASTER v7 (2).doc
151
Additional impacts for Phases 1a and 1b combined:
9.159 Phase 1b does not add any additional impacts on land and soils. This section of route does not pass through any contaminated land or agricultural land of high value.
Cultural Heritage
9.160 The assessment of the impacts of the scheme on cultural heritage in and adjacent to the scheme corridor has considered impacts to;
• Scheduled Ancient Monuments (SAMs)62 • Listed Buildings63 and other features of architectural or historic interest • Conservation Areas and other important historic townscape features 64 • Gardens and Designed landscapes65 • Edinburgh World Heritage Site • Other sites and areas of archaeological significance.
For Phase 1a:
9.161 For the more urban section of Phase 1a (between St.Andrews Square and Roseburn) baseline information was collated for a corridor defined by the limits of deviation for the scheme (defined as the buffer zone for the assessment). Information was also collated on Listed Buildings with a frontage on the route or in its immediate vicinity (for example Princes Street Gardens).
9.162 Between Roseburn and Newbridge baseline information was collated for features present within 200m of proposed development locations, although to the west of Gogar Roundabout baseline information was collated on sites with statutory and non-statutory designations present within 500m of proposed scheme features.
9.163 The scheme passes through or close to a variety of historic landscapes, including:
• The Haymarket complex, which includes the Category A listed station and two listed public houses;
• Newhaven, which has been a focus for early settlement since at least the medieval period and a major centre of ship building in the 16th century. The route follows the earlier shoreline in this location;
• The medieval burgh of Leith; the 19th century dockyard (the port of Leith was developed as the mercantile equivalent of the Georgian New Town); the medieval
62 Scheduled Ancient Monuments are sites of national cultural heritage importance which are designated under the Ancient Monuments and Archaeological Areas Act 1979
63 Listed Buildings are statutorily protected buildings of special architectural or historic interest, designated under the Planning (Listed Buildings and Conservation Areas) (Scotland) Act 1997.
64 Conservation areas are designated by planning authorities under the Planning (Listed Buildings and Conservation Areas) (Scotland) Act 1997 as areas of special architectural or historic interest, the character of which it is desirable to preserve or enhance.
65 Designed landscapes are formally laid out grounds or gardens often associated with large country houses. In Scotland an Inventory of Gardens and Designed Landscapes provides a comprehensive record of more important sites.

Edinburgh Tram Network STAG 2 Appraisal
C:\Documents and Settings\rfineman\My Documents\Edinburgh Tram STAG 2 compilation MASTER v7 (2).doc
152
churchyard of South Leith Parish Church; • The ancient thoroughfare of Leith Walk; • The site of a medieval and later village at Gogar; • The streets and gardens of the Edinburgh New Town and World Heritage Site
including Princes Street and Princes Street Gardens; and • Street furniture along the route has also been taken into account.
9.164 The rich historic fabric of the corridor is recognised in the designation of several conservation areas along the route (e.g. Newhaven; Leith (proposed); the New Town; and the Old Town). The impacts of the scheme on the setting of these areas are covered in the assessment of Townscape (see from section 9.120 above).
9.165 Impacts have been assessed on a site-by-site basis for the route. Several sites of archaeological, cultural and historical significance have been identified as directly affected by the construction and permanent development of the scheme, lying either in the swept path or buffer zone. Of the sites of national importance in the buffer zone, there is the Scheduled Ancient Monument of Victoria Bridge in Leith Port and Gogar Mains fort.
9.166 Between St Andrew Square and Haymarket the assessment corridor runs entirely within the Edinburgh World Heritage Site, New Town Gardens Designed Landscape, and Conservation Areas (New Town / West End). There are also 140 Listed Buildings spread densely along the whole of this route section (44 Category A, 76 Category B, 18 Category C(s) and 2 non-statutory C). 29 Listed Buildings are present along the corridor between St Andrew Square and Princes Street, around St Andrew Square; 64 Listed Buildings are present along Princes Street and in East and West Princes Street Gardens; and 47 Listed Buildings are present at the West End, between Princes Street and Haymarket. These designations reflect the recognition of the New Town as a distinctive part of the Edinburgh’s status as an internationally important cultural and architectural asset and townscape. St Andrew Square and Princes Street form key formal elements of the grid pattern design of the New Town, both now containing buildings of various dates. The West End forms part of an architecturally coherent extension of the New Town in the period up to 1880. No sites of purely archaeological interest have been identified between St Andrew Square and Haymarket, although Edinburgh Castle is protected as a Scheduled Ancient Monument.
9.167 A number of views and viewpoints are particularly important in Edinburgh because of the designed vistas in the New Town. Examples are the views down Princes Street towards Calton Hill, down St David Street to the Scott Monument, down Castle Street towards the Castle, and along George Street to St Andrew Square. There are also highly important views from Princes Street across Princes Street Gardens to Edinburgh Castle and the Old Town skyline, and views from the Castle across the New Town. Where possible, these views have been taken into account in the indicative design.
9.168 Powers exist under the Act to demolish the following, all of which are of local importance:
• The Caledonian Alehouse, Haymarket (Category C(S) Listed Building); • Heart of Midlothian War Memorial, Haymarket (Category C(S) Listed Building)

Edinburgh Tram Network STAG 2 Appraisal
C:\Documents and Settings\rfineman\My Documents\Edinburgh Tram STAG 2 compilation MASTER v7 (2).doc
153
– this will need to be relocated; and • Bridge at Groathill Road South (Not listed): this is required as part of Line 1b.
9.169 The Coltbridge Viaduct is to be modified to such an extent that the impact has been defined as partial demolition. Although not listed, this bridge lies within the Coltbridge and Wester Coates Conservation Area.
9.170 For the section of route corridor between Haymarket – Gogar Roundabout, the townscape is predominantly 20th century housing and industrial developments. Here, only a scatter of cultural heritage features would be in any way potentially affected by the proposed scheme. These comprise four Listed Buildings (1 Category A, 3 Category B), in particular the Category B Jenners Depository on Balgreen Road; and three sites or areas of limited archaeological interest including the remains of a 19th century field boundary and the former site of Gogar Loch. The potential of this route section to contain currently unidentified archaeological remains is mostly low or negligible.
9.171 Between Gogar Roundabout – Edinbugh Airport, the landscape is semi-rural and considerably fragmented by major transport corridors, housing and industrial development. The more important non-scheduled archaeological sites are the site of a medieval and later village at Gogar and a WWII pillbox located on the edge of Edinburgh Airport. The potential of this route section to contain currently unidentified archaeological remains is moderate or high in areas of agricultural land. Most of the Listed Buildings potentially affected are associated with a series of former country residences set within landscaped grounds to either side of the Glasgow Road (now the A8 trunk road). These include buildings associated with Castle Gogar, Gogarburn House, and Gogar Park. Those listed structures closest to the proposed tram route are Castle Gogar Lodge and Gogar Parish Church.
9.172 The preferred mitigation strategy is to preserve in situ and in an appropriate setting all cultural heritage resources. The tram alignment has been designed to avoid all direct effects wherever possible and to minimise potential indirect effects.
9.173 The majority of sites have a suggested Level 1 mitigation response (detailed photographic record). A high proportion of these comprise historic street furniture in the buffer zone. Most are unlikely to suffer physical impact during the works, but preventive measures need to be considered to avoid damage, particularly where the features form part of Listed Buildings.
9.174 Of the sites recommended for Level 2 mitigation, a detailed standing building survey is recommended. This higher level of survey has been suggested due to risk of physical impact on these sites from engineering works.
9.175 Level 3 mitigation (watching brief) is suggested for a few sites. For example, during ground breaking works at selected locations between Murrayfield and Edinburgh Park, including Carrick Knowe golf course.
9.176 The impacts on the cultural heritage along the route range from minor to major adverse. Overall the result is moderate adverse.

Edinburgh Tram Network STAG 2 Appraisal
C:\Documents and Settings\rfineman\My Documents\Edinburgh Tram STAG 2 compilation MASTER v7 (2).doc
154
Additional impacts for Phases 1a and 1b combined:
9.177 The scheme passes through or close to some additional historic landscapes, including:
• The Roseburn railway corridor, which is the line of the Granton branch of the Caledonian Railway, built in 1861 and closed in the 1980s;
• The designed landscape of Caroline Park; • The 19th century development of Granton with high aesthetic quality townscape
and minor industrial premises including the lighthouse and warehouses;
9.178 A variety of mitigation is possible as suggested with Phase 1a. Level 3 mitigation (watching brief) is recommended for part of the route believed to pass through the Caroline Park designed landscape. However, it seems likely that some of this area has been rendered archaeologically sterile by modern development.
Safety
Accidents
Change in road traffic accidents
9.179 The assessment of the changes in the number of road traffic accidents and associated casualties, as a result of the introduction of the tram, has been made quantitatively, considering the changes in traffic levels on the road network. Standard methodologies are based on accident rates and casualty rates (per vehicle-kilometres) per road type. The rates set out in the NESA manual (DMRB Volume 15) have been adopted.
9.180 A spreadsheet model has been used to estimate changes in personal injuries. It takes into account not only the casualty and accident rates by road type but also accident reduction in the future as a result of technological improvements.
9.181 The calculations have taken data from the JRC transport model on vehicle-kms travelled and the road types on which these occur. Table 9.26 shows that there is an increase in vehicle-kms on the network under both Phase 1a and Phase1a+1b. Whilst these may appear significant, they represent a change of just 0.1% in the total traffic on the network and include the assumption of a larger travel market in the with-tram situation.
TABLE 9.26 CHANGE IN VEHICLE-KMS (MILLION P.A. CHANGE DM TO DS)
Year 1a 1a+1b
2011 +14.95 +11.54
2031 +16.69 +4.71
9.182 The change in vehicle-kms is the net effect of several impacts of Edinburgh tram on traffic flows. Firstly, the direct impact of tram (highway capacity reductions on the tram corridor) will force traffic onto longer routes, increasing vehicle kms. The modelling undertaken assumed higher levels of land use and hence car trips with tram, again increasing overall vehicle kms. These two effects are mitigated by the transfer to tram of car trips, but the overall effect is still an increase in vehicle kms. Both drivers of vehicle kms increase are present in Phase 1a and Phase 1a+1b to the same

Edinburgh Tram Network STAG 2 Appraisal
C:\Documents and Settings\rfineman\My Documents\Edinburgh Tram STAG 2 compilation MASTER v7 (2).doc
155
degree (Phase 1b is off road and hence does not divert traffic, and both Phase 1a and Phase 1a+1b assume consistent land use changes) and hence the difference between the Phase 1a and Phase 1a+1b impacts is the increasing abstraction of car traffic to tram. Thus whilst Phase 1a and Phase 1a+1b have increased vehicle kms, Phase 1a+1b is lower since the level of car transfer is higher.
9.183 Standard accident rates are available by severity level: fatal, severe, slight and damage to property. Thus, it is possible to estimate the change in the balance of levels of severity, particularly if traffic distribution changes according to road types (e.g. deviation from one road type to another). The resultant impact on accident levels by severity level is set out in Table 9.27.
TABLE 9.27 CHANGE IN ANNUAL NUMBER OF ACCIDENTS BY SEVERITY LEVEL
Level 1a 1a+1b
2011 2031 2011 2031
Damage +70.1 +70.1 +54.1 +19.8
Slight +4.6 +4.7 +3.6 +1.3
Serious +0.5 +0.5 +0.4 +0.1
Fatal +0.1 +0.1 +0.0 +0.0
Total +75.3 +75.4 +58.2 +21.3
9.184 It should be noted that a portion of these increases are due to the larger travel market assumed in the with-tram situation and this component might not be considered as being directly caused by the introduction of the tram. Some adverse impact still results from redistribution and re-routing effects, however.
9.185 Using standard valuations for casualties, accidents and damage to property by severity level and the accident saving estimations summarised above, the total accidents benefits as a result of changed traffic by year and in terms of a total present value benefit is set out in Table 9.28. The total present value benefit is some -£11.9 million (ie a disbenefit strictly) for Phase 1a; for Phase 1a+1b, the impact is lower at some -£5.2 million. As noted above, it must still be considered that these small adverse impacts are slightly inflated by the assumption of a larger travel market in the with-tram situation.
TABLE 9.28 MONETISED ACCIDENT SAVINGS (£000S)
1a 1a+1b
2011 (undiscounted) -451 -348
2031 (undiscounted) -643 -182
Present Value over 60 years -11,897 -5,225
Change in accidents on public transport
9.186 It is accepted that the introduction of street running trams in Edinburgh may lead to tram-vehicle and tram-pedestrian conflict and, hence, accidents. This is particularly so along the street running sections, where exposure is greatest (notably at all signalised junctions and pedestrian and bus interaction on Princes St). As part of the design

Edinburgh Tram Network STAG 2 Appraisal
C:\Documents and Settings\rfineman\My Documents\Edinburgh Tram STAG 2 compilation MASTER v7 (2).doc
156
process, HMRI has provided advice to both the Scottish Executive and tie in relation to the design and operation of Edinburgh Tram.
9.187 In 2005, there were 193 tramway incidents in the UK, 154 of which involved road vehicle collisions; no fatalities were recorded. For appraisal there is no official guidance on the estimation of public transport accidents in STAG or WebTAG. This is primarily due to the very low incidence of accidents on public transport, making the derivation of statistically significant accident rates very difficult. The STAG guidance suggests that accidents on rail-based systems are negligible and so need not be considered (except when shared running by rail and other modes is felt to be likely to increase accident rates), since the greater level of segregation offered by rail modes reduces the risk of conflicts and, hence, accidents.
9.188 Much of Edinburgh Tram will be segregated from road traffic, limiting the opportunity of traffic-related accidents. Even when not segregated from other traffic, trams have many safety advantages. They can decelerate faster than most other vehicles; indeed the main constraint on braking rate is the safety of passengers and following vehicles. The vehicles are large with a high profile and move on clearly defined predictable paths. Cab design and mirrors ensure excellent visibility for the driver. As a result there should be a lower risk of accidents than with buses. However, the risk of accidents cannot be wholly eliminated. Unfortunately directly comparable tram and bus accident statistics are not available, while the accident rates for tramways vary with the degree of segregation from other traffic and the age of the system – newer systems in general appear to have lower accident rates.
9.189 In addition to the good safety characteristics of tram, there are significant changes to the bus network, with an overall reduction in the level of bus vehicle-kms on the network.
9.190 Overall, the introduction of Edinburgh Tram will lead to a lower risk of accidents on public transport. On that basis, the impact is assumed to be slight beneficial.
Security
9.191 More vulnerable groups in society, such as women and the elderly, may be subject to greater personal security risk when travelling by public transport, especially in the hours of darkness and/or at more remote locations, and this may be a deterrent to the use of public transport. For this reason, most modern public transport facilities include attractive passenger waiting facilities with security devices (e.g. surveillance, lighting, good design) as standard.
9.192 Sections of the tram network are off-street and will allow in most instances an open and bright aspect, although there will be limited background activity levels along the segregated parts of the route. As Edinburgh Tram is advanced a careful review will be undertaken of the street environment in the vicinity of potential stops/interchanges. Lighting and street furniture will be designed to provide maximum safety and security. This may involve ‘more than bright lights’ but will have the objective of providing street environments that are pleasing, attractive and calming in every sense. Stops and cycle parking facilities should be located where there is, as far as possible, plenty of human activity to avoid feelings of isolation; and, for cyclists, to minimise the risk of cycle theft.

Edinburgh Tram Network STAG 2 Appraisal
C:\Documents and Settings\rfineman\My Documents\Edinburgh Tram STAG 2 compilation MASTER v7 (2).doc
157
9.193 Provision of an attractive waiting facility is part of a package approach towards making stops welcoming to the individual. Location is crucial, and whilst safety in traffic terms is also important, locating stops in places where there is human activity deserves equal emphasis.
9.194 Staffing tram stops is not economically viable and the use of closed circuit television cameras is now widespread. However, there can be no single technical solution to the problems of ensuring complete passenger safety. CCTV is perceived by many as ‘reactive’ (that is, it may help convict an attacker but is not a great deal of help to the victim). An interchange with prominently located signs, citing the presence of discreetly positioned ‘see in the dark’ cameras, may however have a stronger deterrent effect. Panic buttons and PA links/help lines are possibly more reassuring for a passenger waiting alone at a remote suburban tram stop on a dark morning or night.
9.195 In summary, while all stops will be designed to high standards, the more remote ones may require mitigation facilities designed to ensure that they offer as great level of security as possible (including any street lighting or furniture to ensure safe approach to the tram stops). The tram stops have tended to be located in more accessible locations, therefore where the level of activity is greater and security higher. Although the tram stops will be unstaffed, they will be monitored by CCTV while all vehicles will provide high levels of security with the presence of inspectors.
9.196 The assessment of security for Edinburgh Tram was made qualitatively, considering the extent to which tram stops and vehicles are expected to provide, directly or indirectly, increased safety for tram travellers, according to the guidance in WebTAG 3.4.2. Table 9.29 summarises an assessment of the security impacts for each indicator, considering the changes in conditions between the existing and after implementation scenarios.
TABLE 9.29 SECURITY IMPACTS
Indicator Impact Assessment
Site perimeters, entrance and exits
Clear access to stops will not represent a risk to security. Neutral
Formal surveillance
CCTV system will be in place at all stops and on all vehicles. Signage indicating the presence of CCTVs will increase the perception of security for users and staff. No staff presence at stops.
Moderate beneficial
Informal surveillance
Good proximity of tram stops to retailers and other urban activities, with positive design. Inspectors will be present in all vehicles.
Moderate beneficial
Landscaping Design will fit in with urban form, minimising visual impact, with clear glass screens and unintrusive structures for greater visibility, maximising security.
Slight beneficial
Lighting and visibility
Light will be commensurate with securing a safe and secure environment both in vehicles and at stops.
Slight beneficial
Emergency call It is assumed that there will be help points at all stops, which is standard feature on modern systems.
Slight beneficial
9.197 The overall impact is considered moderate beneficial.

Edinburgh Tram Network STAG 2 Appraisal
C:\Documents and Settings\rfineman\My Documents\Edinburgh Tram STAG 2 compilation MASTER v7 (2).doc
158
Economy
Transport Economic Efficiency
9.198 TEE appraisal sets out the impact of the proposal on social welfare, as represented by the costs and benefits incurred by users and operators of the transport system, over a 60-year appraisal period. In essence, the analysis sets out the monetised value of changes in user travel time, charges (ie bus fares), vehicle operating costs and quality benefits, and costs and benefits accruing to private sector transport operators (capital and operating costs, revenues and any grant or subsidy payments).
9.199 Costs to the public sector are itemised separately (see paragraph 9.329 et al).
9.200 The TEE analysis for Edinburgh Tram has utilised the TUBA (Transport Users Benefit Appraisal) computer programme, developed for the DfT to undertake economic appraisal for multi-modal transport studies. TUBA undertakes a matrix-based appraisal and the respective trip, time, distance and charge matrices have been obtained from the JRC model employed in the forecasting process.
Costs
9.201 The capital costs employed within the appraisal are consistent with those presented in Chapter 7. The capital costs have been estimated by tie and include allowances for both risk and optimism bias. It should also be noted that £23.7m of the cost total for both scheme options is a sunk cost, and is therefore not included in the appraisal.
9.202 Similarly, the lifecycle and operating costs presented in Chapter 7 have been employed in the appraisal.
9.203 All costs have been converted to 2002 prices for the purposes of appraisal.
Economic Assumptions
9.204 The main economic assumptions used in economic appraisal are set out below:
• the opening date for the scheme is 2011; • the scheme is assessed for the period of 60 years from opening year; • all costs and benefits have been discounted to 2002 and are in 2002 prices; • discount rate 3.5% is applied for the first 30 years post operation, 3% thereafter; • for the first few years only a proportion of the benefits are included to reflect the
build-up in patronage of a new scheme (75%, 85%, 92%, 97%, 99% in the five years after opening); and
• monetary valuations for the benefits consistent with current DfT guidance.
Weighting of Walk and Wait Time for Business Users
9.205 Appraisal guidance recommends that walk and weight time benefits for business users should be ‘unweighted’, as the time accrue to businesses rather than individuals and are therefore and valued in terms of ‘actual’ rather than ‘perceived’ time. The forecasting models developed to generate scheme demand are based on ‘perceived’ time, as it is this that underpins users (including business users) behavioural response.

Edinburgh Tram Network STAG 2 Appraisal
C:\Documents and Settings\rfineman\My Documents\Edinburgh Tram STAG 2 compilation MASTER v7 (2).doc
159
It is difficult to separate out the walk and weight elements from this for all trips, and not possible to do this just for business users. We believe that the net effect is that the walk and wait time ‘un-weighting’ impact would be broadly neutral and is not distorting the result, as the walk and wait time element of journeys will be comparable in both the Do Something and Do Minimum.
Transport Demand, Revenues and Benefits
9.206 Transport demand, revenues and benefits have been forecast for two future years – 2011 and 2031. These are detailed in paragraphs 9.9 et al, and these have been run within TUBA to produce benefits over the appraisal period. Benefits between 2011 and 2031 have been interpolated using TUBA but a profile has also been added, with the effect that 39% of the growth between 2011 and 2031 is assumed to have occurred by 2011. Between 2031 onward growth assumed is at 1.5% per year until 2041 and then 1.0% per year until 2051. No further growth is assumed beyond 2051.
TEE analysis – Phase 1a
9.207 A Transport Economic Efficiency (TEE) table as included in Table 9.30. It sets out the economic results and presents the distribution of scheme benefits between business, consumers, and private sector providers.
TABLE 9.30 PHASE 1A TEE ANALYSIS
STAG Code
Total Public Transport
Road Users
User benefits - ConsumersTravel time (PV2) £279,188 £277,963 £1,225User Charges (PV3) £0 £0 £0Vehicle Operating Costs (PV4) £21,828 £0 £21,828Sub Total £301,016 £277,963 £23,053
User benefits - BusinessTravel time (PV2) £123,947 £117,496 £6,451User Charges (PV3) £0 £0 £0Vehicle Operating Costs (PV4) £4,607 £0 £4,607Sub Total £128,554 £117,496 £11,058
User benefits - TotalTravel time PV2 £403,135 £395,459 £7,676User Charges PV3 £0 £0 £0Vehicle Operating Costs PV4 £26,435 £0 £26,435Sub Total £429,571 £395,459 £34,111
Private Sector Provider Impacts Investment (Capital) Costs PV5 -£389,880 -£389,880Operating Costs: Tram PV6 £0 £0
Bus PV6 £0 £0Rail PV6 £0
Revenues: Tram PV6 £0 £0 £0Bus PV7 £9,943 £9,943Rail PV7 -£54,057 -£54,057Off-street Parking PV7 £0
Grant/ Subsidy PV8 £389,880 £389,880Developer Contribution PV8 £0
Sub Total -£44,115 -£44,115 £0
Total PVB £385,456
Notes:1. Disbenefits appear as negative2. All values are £000s Present Value, 2002 Values and Prices

Edinburgh Tram Network STAG 2 Appraisal
C:\Documents and Settings\rfineman\My Documents\Edinburgh Tram STAG 2 compilation MASTER v7 (2).doc
160
9.208 In total, the scheme delivers TEE benefits of £385m PV.
9.209 The scheme delivers £301m PV benefits to transport consumers. The majority of these benefits (£278m PV) accrue to public transport users, with the remaining £23m accounted for through time and vehicle operating cost savings to remaining car users, who benefit from a more decongested network resulting from car transfers to the tram.
9.210 The total benefit to business totals £129m PV, with £11m of these benefits to highway users and the remainder to public transport. The higher proportion of business benefits to highway users (compared to consumer benefits) reflects both the higher proportion of work trips undertaken by road (compared to public transport) and the higher value of time applied to these trips. An adjustment has also been made for airport trips only to reflect the higher proportion of business travellers for this segment.
9.211 Investment costs amount to £390m PV. The grant requirement is equivalent to the investment costs only and hence these two cancel out within this section of the TEE. There is a revenue loss to rail operators of £54m PV and a gain to private sector bus providers (non-TEL) of £9.9m PV. The latter reflects the potential for better journeys involving interchange with the tram as well as some secondary effects of the changes in TEL bus service patterns but this is a very small impact.
9.212 The total private sector provider impact is therefore equivalent to the bus and rail revenue loss impacts, totalling -£44m PV.
TEE analysis – Phase 1a+1b
9.213 The TEE Table for Scheme 1a + 1b is presented in Table 9.31.
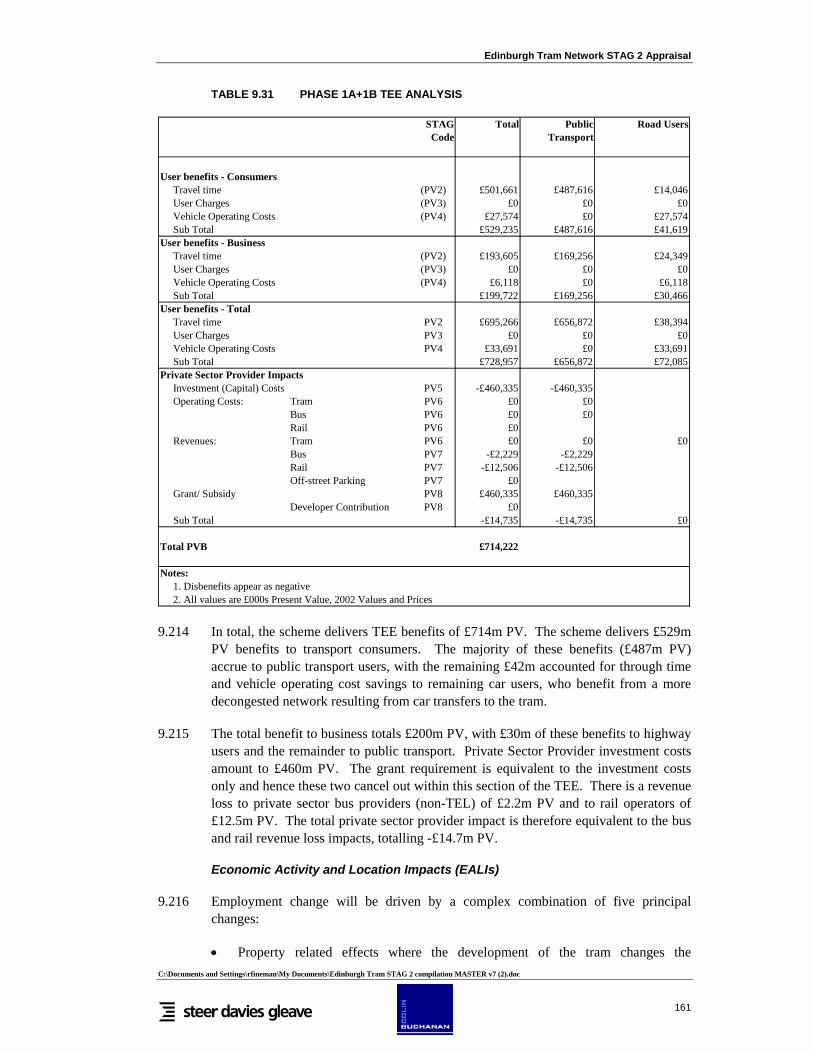
Edinburgh Tram Network STAG 2 Appraisal
C:\Documents and Settings\rfineman\My Documents\Edinburgh Tram STAG 2 compilation MASTER v7 (2).doc
161
TABLE 9.31 PHASE 1A+1B TEE ANALYSIS
STAG Code
Total Public Transport
Road Users
User benefits - ConsumersTravel time (PV2) £501,661 £487,616 £14,046User Charges (PV3) £0 £0 £0Vehicle Operating Costs (PV4) £27,574 £0 £27,574Sub Total £529,235 £487,616 £41,619
User benefits - BusinessTravel time (PV2) £193,605 £169,256 £24,349User Charges (PV3) £0 £0 £0Vehicle Operating Costs (PV4) £6,118 £0 £6,118Sub Total £199,722 £169,256 £30,466
User benefits - TotalTravel time PV2 £695,266 £656,872 £38,394User Charges PV3 £0 £0 £0Vehicle Operating Costs PV4 £33,691 £0 £33,691Sub Total £728,957 £656,872 £72,085
Private Sector Provider Impacts Investment (Capital) Costs PV5 -£460,335 -£460,335Operating Costs: Tram PV6 £0 £0
Bus PV6 £0 £0Rail PV6 £0
Revenues: Tram PV6 £0 £0 £0Bus PV7 -£2,229 -£2,229Rail PV7 -£12,506 -£12,506Off-street Parking PV7 £0
Grant/ Subsidy PV8 £460,335 £460,335Developer Contribution PV8 £0
Sub Total -£14,735 -£14,735 £0
Total PVB £714,222
Notes:1. Disbenefits appear as negative2. All values are £000s Present Value, 2002 Values and Prices
9.214 In total, the scheme delivers TEE benefits of £714m PV. The scheme delivers £529m PV benefits to transport consumers. The majority of these benefits (£487m PV) accrue to public transport users, with the remaining £42m accounted for through time and vehicle operating cost savings to remaining car users, who benefit from a more decongested network resulting from car transfers to the tram.
9.215 The total benefit to business totals £200m PV, with £30m of these benefits to highway users and the remainder to public transport. Private Sector Provider investment costs amount to £460m PV. The grant requirement is equivalent to the investment costs only and hence these two cancel out within this section of the TEE. There is a revenue loss to private sector bus providers (non-TEL) of £2.2m PV and to rail operators of £12.5m PV. The total private sector provider impact is therefore equivalent to the bus and rail revenue loss impacts, totalling -£14.7m PV.
Economic Activity and Location Impacts (EALIs)
9.216 Employment change will be driven by a complex combination of five principal changes:
• Property related effects where the development of the tram changes the

Edinburgh Tram Network STAG 2 Appraisal
C:\Documents and Settings\rfineman\My Documents\Edinburgh Tram STAG 2 compilation MASTER v7 (2).doc
162
development industry’s decisions about property development on sites within the tram corridor: this effect arises because the market is not wholly efficient and suffers from perceptual and other barriers which lead to perceived risks being unacceptably high. A new development especially of fixed infrastructure can alter perceptions and reduce risk levels such that development goes ahead where otherwise it would not, or where such development would be slower than would be the case with the new infrastructure.
• A land utilisation effect, which arises where the new public transport infrastructure is able to replace car travel by some residents and / or workers. By allocating less space to car parking, development can take place at a denser level than would otherwise happen.
• Cost reduction effects, which arise where businesses are able to save costs, which then result in lower output prices and hence increased sales: relatively large cost savings tend to be needed for this to generate employment growth, as smaller savings tend to accrue as increased profits where markets are not fully competitive.
• Employment related to productivity effects which will arise through denser development within the tram corridor: productivity effects increase disposable income and the expenditure of that income will drive further gains in the retail and leisure sectors in particular: this has been a very strong driver of growth in large urban economies. Productivity gains might also drive new employment which may be additional at the Scotland level.
• Distributional and social inclusion impacts
Property related effects
9.217 Property related effects can be considered where there are clearly market distortions which limit the supply of residential space available either for new workers to join a labour market that has excess demand for labour, or to provide space for businesses which have less space than required to meet the demands of customers.
9.218 CEC has provided estimates of where property development will take place and where levels of development will be changed by the tram, or where development will be accelerated by the tram. This shows that a small number of sites / locations would be affected, and at only one location, Granton Waterfront, would there be additional development. At all other sites, the effect of the tram is to bring forward development that will happen anyway. The locations for employment are shown in Table 9.32.
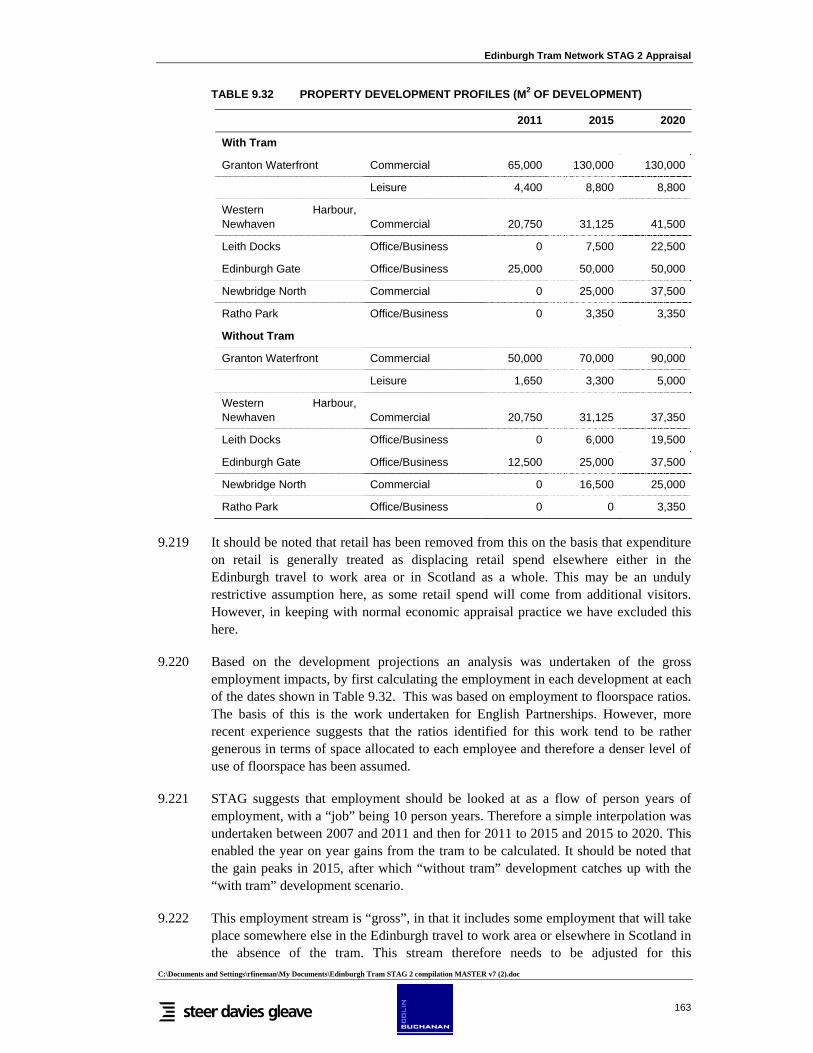
Edinburgh Tram Network STAG 2 Appraisal
C:\Documents and Settings\rfineman\My Documents\Edinburgh Tram STAG 2 compilation MASTER v7 (2).doc
163
TABLE 9.32 PROPERTY DEVELOPMENT PROFILES (M2 OF DEVELOPMENT)
2011 2015 2020
With Tram
Granton Waterfront Commercial 65,000 130,000 130,000
Leisure 4,400 8,800 8,800
Western Harbour, Newhaven Commercial 20,750 31,125 41,500
Leith Docks Office/Business 0 7,500 22,500
Edinburgh Gate Office/Business 25,000 50,000 50,000
Newbridge North Commercial 0 25,000 37,500
Ratho Park Office/Business 0 3,350 3,350
Without Tram
Granton Waterfront Commercial 50,000 70,000 90,000
Leisure 1,650 3,300 5,000
Western Harbour, Newhaven Commercial 20,750 31,125 37,350
Leith Docks Office/Business 0 6,000 19,500
Edinburgh Gate Office/Business 12,500 25,000 37,500
Newbridge North Commercial 0 16,500 25,000
Ratho Park Office/Business 0 0 3,350
9.219 It should be noted that retail has been removed from this on the basis that expenditure on retail is generally treated as displacing retail spend elsewhere either in the Edinburgh travel to work area or in Scotland as a whole. This may be an unduly restrictive assumption here, as some retail spend will come from additional visitors. However, in keeping with normal economic appraisal practice we have excluded this here.
9.220 Based on the development projections an analysis was undertaken of the gross employment impacts, by first calculating the employment in each development at each of the dates shown in Table 9.32. This was based on employment to floorspace ratios. The basis of this is the work undertaken for English Partnerships. However, more recent experience suggests that the ratios identified for this work tend to be rather generous in terms of space allocated to each employee and therefore a denser level of use of floorspace has been assumed.
9.221 STAG suggests that employment should be looked at as a flow of person years of employment, with a “job” being 10 person years. Therefore a simple interpolation was undertaken between 2007 and 2011 and then for 2011 to 2015 and 2015 to 2020. This enabled the year on year gains from the tram to be calculated. It should be noted that the gain peaks in 2015, after which “without tram” development catches up with the “with tram” development scenario.
9.222 This employment stream is “gross”, in that it includes some employment that will take place somewhere else in the Edinburgh travel to work area or elsewhere in Scotland in the absence of the tram. This stream therefore needs to be adjusted for this
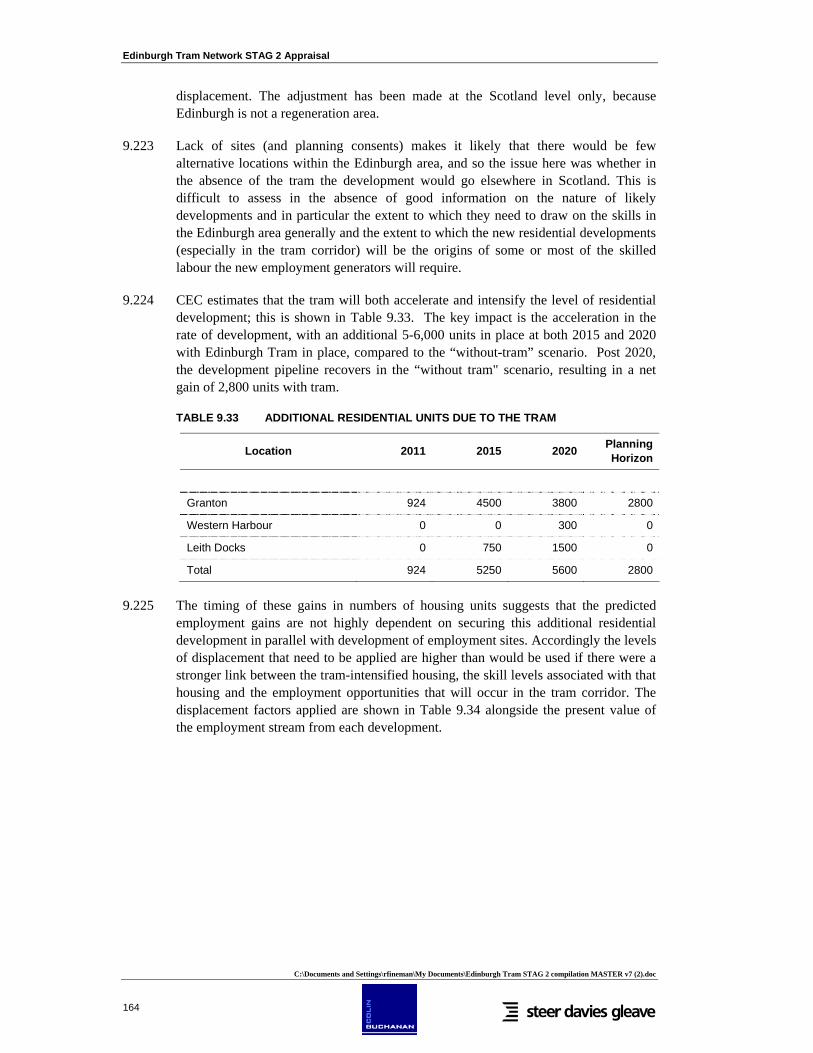
Edinburgh Tram Network STAG 2 Appraisal
C:\Documents and Settings\rfineman\My Documents\Edinburgh Tram STAG 2 compilation MASTER v7 (2).doc
164
displacement. The adjustment has been made at the Scotland level only, because Edinburgh is not a regeneration area.
9.223 Lack of sites (and planning consents) makes it likely that there would be few alternative locations within the Edinburgh area, and so the issue here was whether in the absence of the tram the development would go elsewhere in Scotland. This is difficult to assess in the absence of good information on the nature of likely developments and in particular the extent to which they need to draw on the skills in the Edinburgh area generally and the extent to which the new residential developments (especially in the tram corridor) will be the origins of some or most of the skilled labour the new employment generators will require.
9.224 CEC estimates that the tram will both accelerate and intensify the level of residential development; this is shown in Table 9.33. The key impact is the acceleration in the rate of development, with an additional 5-6,000 units in place at both 2015 and 2020 with Edinburgh Tram in place, compared to the “without-tram” scenario. Post 2020, the development pipeline recovers in the “without tram" scenario, resulting in a net gain of 2,800 units with tram.
TABLE 9.33 ADDITIONAL RESIDENTIAL UNITS DUE TO THE TRAM
Location 2011 2015 2020 Planning Horizon
Granton 924 4500 3800 2800
Western Harbour 0 0 300 0
Leith Docks 0 750 1500 0
Total 924 5250 5600 2800
9.225 The timing of these gains in numbers of housing units suggests that the predicted employment gains are not highly dependent on securing this additional residential development in parallel with development of employment sites. Accordingly the levels of displacement that need to be applied are higher than would be used if there were a stronger link between the tram-intensified housing, the skill levels associated with that housing and the employment opportunities that will occur in the tram corridor. The displacement factors applied are shown in Table 9.34 alongside the present value of the employment stream from each development.

Edinburgh Tram Network STAG 2 Appraisal
C:\Documents and Settings\rfineman\My Documents\Edinburgh Tram STAG 2 compilation MASTER v7 (2).doc
165
TABLE 9.34 DISPLACEMENT FACTORS FOR NEW EMPLOYMENT
Location Development type Displacement % Present value of
employment stream
Western Harbour, Newhaven Commercial 75 10
Leith Docks Office/Business 50 35
Edinburgh Gate Office/Business 50 482
Newbridge North Commercial 80 52
Ratho Park Office/Business 80 14
Sub-total Line 1 A 593
Granton Waterfront Commercial 80 325
Leisure 90 14
Sub-total Line 1 B 338
Total 1a + 1b 931
9.226 The above is based on several assumptions, including the assumption that the “middle” levels of development are achieved in each location. Clearly if the tram were to have a stronger effect on developer decisions resulting in higher levels of building and use for employment purposes the gross impacts would be higher. Similarly, the levels of displacement used are relatively generous, reflecting an assumption that some development in the corridor and in the waterfront in particular will be investment that will otherwise not come to Scotland because of the limited supply of competitive locations. This may be overly optimistic in the medium term for example as Glasgow’s Clyde corridor develops.
Land utilisation effect
9.227 In the above denser development on individual sites has not been factored in separately, as this appears to be captured within the CEC development projections.
Cost reduction effects
9.228 Employment effects through cost reductions are likely to be very limited. The principal savings are likely to come from the substitution of the tram for trips presently made by private car (some of which involve parking at the airport) and by taxi. Based on BAA and CAA data, there is a reasonable expectation of a total of 9m terminating passengers in the next year or so. On that basis there would be
• 781,000 UK business taxi trips to the airport (and probably broadly the same number from the airport) from the Lothians
• 1,077,000 UK business private car trips to the airport from the Lothians
9.229 At this point some broad assumptions are required:
• for taxi trips 70% are to / from the city 30% of these trips switch to tram
Edinburgh Tram Network STAG 2 Appraisal
C:\Documents and Settings\rfineman\My Documents\Edinburgh Tram STAG 2 compilation MASTER v7 (2).doc
166
the average saving is £12 per taxi trip • For car trips
35% are to / from the city 25% of these trips switch to tram
9.230 The average saving per trip is £40: this reflects a weighted average length of trip of just under 3 days and the costs of fuel and parking at the airport.
9.231 Assuming two thirds of the total cost savings accrue to Edinburgh firms, the total saving to the region is £5m in round numbers. This is a miniscule sum compared with the GVA of the city alone, which is of the order of £7.5 billion. Therefore even with what appear to be useful levels of savings in costs, it is unlikely that such savings will result in significant impacts. A simple analysis based on estimated business sector costs and an aggregate demand response to cost savings and subsequent cost reductions would yield an estimate of just under 50 jobs arising due to cost savings.
9.232 It should be noted that this effect can be added to the property impacts only where additional space can be found to employ these additional workers – in other words, the cost savings expand the demand for labour but will also expand demand for space. If space is not available, this demand will be unmet.
Supply side effects and productivity growth
9.233 This section discusses supply side effects which are expected to be positive but limited in the short to medium term, but which are expected to become more important as congestion increases. While a UK level methodology exists for estimating GVA impacts (but not a regional or Scotland level one), the methodology for estimating employment impacts from these effects has not been developed. Therefore we have made only a qualitative assessment at this time.
9.234 In the period 1990 to 2000, GDP per capita in Scotland grew on average by 1.83% per annum, driven largely by growth in GDP per employee of 1.56% per annum with a small additional contribution from the employment rate and the participation rate, which adds additional labour resource to the economy.
9.235 Post 2000 GDP per capita in Scotland grew by only 0.92% per annum, driven mostly by growth of 0.83% per annum in the employment rate and 0.7% per annum in the participation rate with a slightly declining GDP per employee. The principal factor underlying this decline was the loss of high added value electronics activity, which effectively collapsed in 2000 – 2001 due to restructuring and movement of activities to Eastern Europe. This would have had little effect on growth in the Edinburgh city region.
9.236 This most recent lower rate of growth rests within a positive longer term trend, however. Econometric forecasting work commissioned by the Scottish Executive has also predicted strong growth over next twenty years, for the Lothians region in particular, but a reasonable degree of uncertainty must be attached to any such forecasts.
9.237 Transport can increase both the attractiveness of work by reducing cost and travel barriers, and through processes which make businesses and hence workers more
Edinburgh Tram Network STAG 2 Appraisal
C:\Documents and Settings\rfineman\My Documents\Edinburgh Tram STAG 2 compilation MASTER v7 (2).doc
167
productive. Long run economic growth depends largely on supply side effects which expand factor productivity and increase the amount of factors of production available within the economy. Productivity growth in the UK has typically been relatively slow compared with other G8 countries, but at least has been sustained over the last 15 years or so thanks to reducing supply side rigidities and increasing labour and product markets flexibility.
9.238 Productivity growth does not necessarily create jobs directly. If Scottish firms become more productive they may use the gains to reward labour and capital, or they may reduce employment by substituting capital for labour while increasing labour earnings. However, a proportion of additional earnings and profits are spent within the economy, and this has been a factor in driving growth of services such as retail and leisure.
9.239 Where markets function competitively and do not fail (which is the basis of the property analysis above), transport affects GVA chiefly through the supply side, by enabling businesses and people to be more productive and by enabling more people to enter the labour market.
9.240 It is evident from recent research by DfT in England that the most significant contributor to GVA impacts is agglomeration. Transport schemes reduce the generalized costs of travel between zones and therefore promote the “effective densification” of an area. For example if businesses are located over a wide area and physical links between them are poor, they will tend to operate in relative isolation. In terms of economic performance this means they will not benefit from a whole array of interactions, from the exchange of ideas and sub-contracting relationships through to sharing a pool of mobile staff and having access to universities and other business resources.
9.241 Where the transport links are improved, these interactions increase, and there is evidence which shows that there is a relationship between effective density and productivity, and hence with GVA. This relationship varies by business sector. There is also a relationship between transport generalized cost and density.
9.242 The tram is likely to make a positive contribution to increasing effective density and hence productivity and GVA. This is because it links the financial services and business services areas of Edinburgh including Edinburgh Park and the RBS headquarters with the city centre financial and business services districts. At current levels of car travel and congestion this effect will be very limited, but, over time, growth in congestion is likely to arrest growth in business productivity and the tram will offset this by enabling effective density to be sustained or grow.
9.243 In the short to medium term the agglomeration benefits appear likely to be focussed on the city centre-airport route, as the northern leg does not currently include areas with concentrations of sectors likely to be affected by increased densification through transport links.
People moving to more productive employment
9.244 Where people working in areas of low productivity can be enabled to change jobs to work in areas where productivity is higher, there is a national GVA gain. This process

Edinburgh Tram Network STAG 2 Appraisal
C:\Documents and Settings\rfineman\My Documents\Edinburgh Tram STAG 2 compilation MASTER v7 (2).doc
168
is especially important in higher productivity areas that are growing and have continuing under-satisfied demands for labour. Without increased labour supply, wage rates will rise, increasing costs and making businesses in such areas less competitive, thereby choking off growth.
9.245 The available evidence suggests that the effect of transport on job location is generally fairly weak and that step changes in transport cost / time / quality are required to make people change job locations.
9.246 For bus users looking at employment prospects in the tram corridor and especially the Edinburgh Park – airport area, the tram could represent a step change in overall service attributes, and this might have a small but useful effect in terms of encouraging job movement towards the high productivity employers located in this corridor. However, the majority of high skill / high income employee types (who are the ones who make the real difference in terms of national / regional GVA) presently drive to work. At present levels of congestion, people driving to work in the corridor appear not to be experiencing levels of cost and inconvenience such that people are choosing to work in less productive areas. This would limit any job move effect of the tram in the short term, but, as with agglomeration effects, growth in congestion will enhance the effect of the tram in offsetting congestion effects, which otherwise would be likely to have a small but negative effect on job locations.
Expanding the labour supply.
9.247 In addition to people who are registered as unemployed, there are people who could join or rejoin the labour force; these include people on disability benefits who would like to work, and people (especially females) who may not be registered as unemployed but who would be likely to seek work if access to jobs were improved.
9.248 Better transport links reduce the generalized cost of accessing the labour market and by enabling access to a large market improve the chances of matching skills with employer requirements – in other words the numbers searching for work can be expanded and the probability of a successful match can be increased.
9.249 However, the available evidence suggests that the elasticity of labour supply with regard to transport improvements is low. The segments of the labour market where this effect is most likely will tend to be people for whom the alternative transport mode is the bus, and for much of the corridor the tram does not represent a very large gain over the bus. It is likely therefore that the tram will have a limited but positive impact in terms of numbers of people seeking to enter the labour market.
Distributional and social inclusion impacts
9.250 The tram is expected to have limited but positive and direct social inclusion benefits, by enabling residents of parts of north Edinburgh that suffer from multiple deprivation to have better access to both existing jobs and to an expanded number and range of employment opportunities that will arise in the future.
9.251 The total increase in employment associated with all of the sites identified for development could range from 40,000 to 55,000 jobs in round numbers, including retail employment which is likely to be around 6,000 – 7,000 jobs. However, this is a

Edinburgh Tram Network STAG 2 Appraisal
C:\Documents and Settings\rfineman\My Documents\Edinburgh Tram STAG 2 compilation MASTER v7 (2).doc
169
gross number and does not allow for losses of retail employment elsewhere in the region. In addition, the tram makes existing employment more accessible in some locations, including Edinburgh Park, the Airport and locations such as Ratho Park and Newbridge.
9.252 However, the tram also improves accessibility for residents of other areas, and so is likely to increase competition for jobs in some locations: if these other area residents are not residents of regeneration area, and they displace residents of regeneration area, then that would be regarded as a negative impact in terms of social inclusion.
9.253 This is not an issue for jobs where skills are in short supply, where the tram will make the labour market function better and expand the labour force by enabling some additional workers to join the labour force by reducing barriers. However it is an issue for low skill types of employment where there are generally more potential workers than jobs.
9.254 In looking at social inclusion impacts the focus has been on the Granton / Pilton / Muirhouse regeneration area. Based on accessibility plots and CEC data on development, the additional development shown in Table 9.35 would become more accessible from the regeneration area.
TABLE 9.35 DEVELOPMENT AND EMPLOYMENT WITH TRAM: AREAS WHERE REGENERATION AREA RESIDENTS ENJOY BETTER ACCESS
Location Type Size m2 Jobs
Edinburgh Gate Office / business 50,000 3,250
Newbridge North Commercial 50,000 2,500
Ratho Park Office / business 3,350 220
Edinburgh Park Office / business 200,000 13,000
Commercial 130,000 6,500
Retail 40,400 1,410 Granton Waterfront
Leisure 8,800 350
TOTAL 482,550 27,230
9.255 In principle, and over time, regeneration area residents will also be able to compete for existing employment opportunities as these turn over due to people leaving, retiring and so on.
9.256 The mix of skills that will be required will determine the limits on how many people with low or limited skills will be able to gain employment. From the 2001 Census it is noted that only 28% of the population of Granton and only 16% of those unemployed had higher level qualifications. The skills requirement across the whole corridor is difficult to predict at this time, and so it is necessary to make assumptions here. It is assumed that 15% of office, business and commercial jobs could be suitable for regeneration area residents and 35% of retail jobs. This reduces the effective number of suitable and in scope future jobs (in the with tram case) to
• 3,870 office, business and commercial jobs • 495 retail jobs.
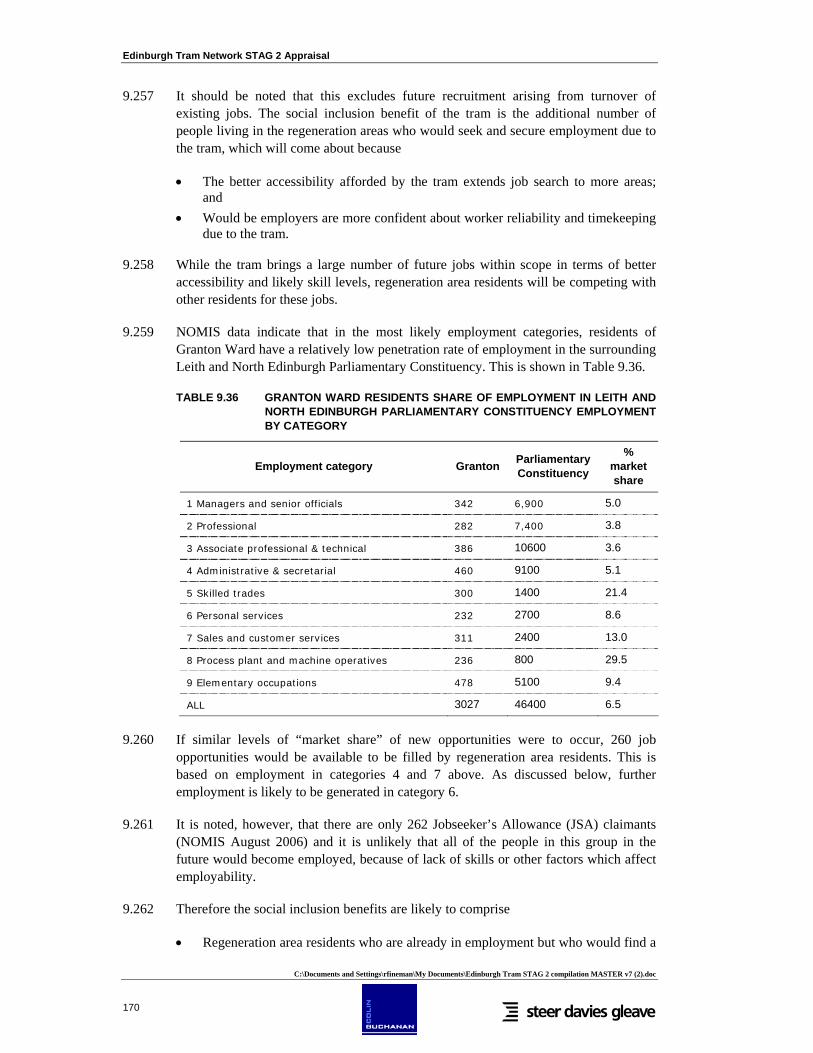
Edinburgh Tram Network STAG 2 Appraisal
C:\Documents and Settings\rfineman\My Documents\Edinburgh Tram STAG 2 compilation MASTER v7 (2).doc
170
9.257 It should be noted that this excludes future recruitment arising from turnover of existing jobs. The social inclusion benefit of the tram is the additional number of people living in the regeneration areas who would seek and secure employment due to the tram, which will come about because
• The better accessibility afforded by the tram extends job search to more areas; and
• Would be employers are more confident about worker reliability and timekeeping due to the tram.
9.258 While the tram brings a large number of future jobs within scope in terms of better accessibility and likely skill levels, regeneration area residents will be competing with other residents for these jobs.
9.259 NOMIS data indicate that in the most likely employment categories, residents of Granton Ward have a relatively low penetration rate of employment in the surrounding Leith and North Edinburgh Parliamentary Constituency. This is shown in Table 9.36.
TABLE 9.36 GRANTON WARD RESIDENTS SHARE OF EMPLOYMENT IN LEITH AND NORTH EDINBURGH PARLIAMENTARY CONSTITUENCY EMPLOYMENT BY CATEGORY
Employment category Granton Parliamentary Constituency
% market share
1 Managers and senior officials 342 6,900 5.0
2 Professional 282 7,400 3.8
3 Associate professional & technical 386 10600 3.6
4 Administrative & secretarial 460 9100 5.1
5 Skilled trades 300 1400 21.4
6 Personal services 232 2700 8.6
7 Sales and customer services 311 2400 13.0
8 Process plant and machine operatives 236 800 29.5
9 Elementary occupations 478 5100 9.4
ALL 3027 46400 6.5
9.260 If similar levels of “market share” of new opportunities were to occur, 260 job opportunities would be available to be filled by regeneration area residents. This is based on employment in categories 4 and 7 above. As discussed below, further employment is likely to be generated in category 6.
9.261 It is noted, however, that there are only 262 Jobseeker’s Allowance (JSA) claimants (NOMIS August 2006) and it is unlikely that all of the people in this group in the future would become employed, because of lack of skills or other factors which affect employability.
9.262 Therefore the social inclusion benefits are likely to comprise
• Regeneration area residents who are already in employment but who would find a

Edinburgh Tram Network STAG 2 Appraisal
C:\Documents and Settings\rfineman\My Documents\Edinburgh Tram STAG 2 compilation MASTER v7 (2).doc
171
better job because of the tram (A GVA impact rather than an employment one) • Regeneration area residents who otherwise would be unemployment and who find
employment • Regeneration area residents who are not employed and not in receipt of JSA, but
who are enabled to enter the workforce because of better accessibility.
9.263 The nature of the labour market and the way it is changing suggests that the former effect will dominate here, but both other effects could also contribute towards social inclusion impacts. In quantitative terms, the number of residents who become employed who are not currently employed is likely to be well below the potential level of 260.
9.264 A further effect which is more difficult to assess is related to the multiplier, whereby part time and possibly “hidden” (but legal) employment is created through additional expenditure by new residents in the immediate area – this could include jobs as cleaners and domestic helps, pet sitters, child minders and so on. These impacts would be less easy to track but can be important in revitalising an area by pumping in extra income which is recycled through local service providers such as shops and pubs.
9.265 Finally, these impacts are very difficult to quantify as outcomes depend on a range of unpredictable factors, including
• How Granton regeneration area residents respond to having a wider range of employment opportunities available through the tram
• The precise nature of the jobs that are generated in developing areas, the skill and other requirements and how the employers seeking staff respond to potential new recruits
• How residents of other areas, including other regeneration areas within the Edinburgh travel to work area, respond to accessibility changes.
9.266 It is noted that Granton Waterfront development, for example, is also likely to more accessible from other regeneration areas in the city, but also from other non-regeneration areas, where there are also people who would enter the labour market if transport barriers are removed. The mix between regeneration and non-regeneration area residents is important here, for only the former is normally regarded as a distributional gain.
Integration
9.267 The Scottish Executive views integration as one of its five key objectives for transport, as reflected by STAG. The 2004 Scottish Transport White Paper, Scotland’s Transport Future66, contains five objectives for transport, one of which is as follows:
“Improve integration by making journey planning and ticketing easier and working to ensure smooth connection between different forms of transport”
9.268 These objectives are also reflected in the Draft National Transport Strategy, published
66 Scottish Transport White Paper, Scotland’s Transport Future, 2004 http://www.scotland.gov.uk/library5/transport/stfwp-00.asp

Edinburgh Tram Network STAG 2 Appraisal
C:\Documents and Settings\rfineman\My Documents\Edinburgh Tram STAG 2 compilation MASTER v7 (2).doc
172
by the Scottish Executive in 200667.
9.269 Within this chapter, this section therefore deals with the following specific issues:
• transport integration – the degree to which a proposal fits with other transport infrastructure and services;
• transport-land-use integration – the fit between the proposal and established land-use plans and land-use/transport planning guidance; and
• policy integration – the appropriateness of the proposal in light of wider policies both of central and local Government.
Transport integration
9.270 An integrated transport system must operate as a true network across all modes in order that passengers can move easily from one service to another in a comfortable environment. Integrated transport can, thus, reduce the need to travel, tackle congestion and pollution and support a strong economy, a sustainable environment and a healthy and inclusive society.
9.271 Important elements which should be considered when planning integrated transport facilities include through ticketing/joint ticketing arrangements; enhanced connections and co-ordination of services; clear, accessible and wider availability of information; improved waiting facilities; appropriate location and accessibility for the elderly and mobility impaired.
9.272 The attractiveness of the public transport system as a whole in Edinburgh can be enhanced with the implementation of Edinburgh Tram Phase 1 by:
• The existence and quality of infrastructure facilities at stops, such as seating and waiting areas with weather protection (shelter) – slight beneficial;
• Maximising bus and rail interchange with tram at key locations, with greater opportunities for interchange, greater convenience and shorter distance between boarding points, and level floor boarding for all trams. In addition, there may be opportunities for the provision of cycle racks at some stops – moderate beneficial;
• Maximising public transport interchange with car at the Park and Ride location (Ingliston) – high beneficial; and
• Real-time passenger information at all stations – moderate beneficial.
9.273 Creation of reliable interchange facilities is a fundamental part of the design process. A specific part of SDS’s brief is design of reliable and effective interchange facilities. For an integrated public transport system to be fully exploited by the public, it must provide a truly “seamless” journey in which passengers can have sufficient confidence to use it as an alternative to the private car. Interchange facilities therefore form a key component of transport integration. SDS has specifically addressed the issue of interchange between bus and tram by carefully designing a number of interchange facilities along the tram line that will ensure a smooth transition between these public
67 Scotland’s National Transport Strategy: A Consultation, April 2006, http://www.scotland.gov.uk/Publications/2006/04/20084756/0
Edinburgh Tram Network STAG 2 Appraisal
C:\Documents and Settings\rfineman\My Documents\Edinburgh Tram STAG 2 compilation MASTER v7 (2).doc
173
transport modes.
9.274 The potential for a lack of transport service integration, or bus competition, to impact adversely on the benefits which should result from the introduction of the trams is recognised. To this end, CEC has established Transport Edinburgh Limited (“TEL”), to take on the responsibility for coordinating the services of Lothian Buses and the tram. TEL is the single economic entity under which both the tram and Lothian Buses will operate in a fully integrated transport network.
Transport integration – Phase 1a
9.275 Phase 1a offers interchange with bus, rail, air and Park and Ride. This will potentially have a significant impact on patronage and opportunities for feeder services to widen the catchment for the tram.
9.276 Specifically, Phase 1a provides interchange opportunities at Edinburgh Airport, Waverley and Haymarket Rail Stations, St Andrew Square Bus Station, and interchange facilities in the city centre in general. The western part of Phase 1a would allow a principally dedicated tram route, and would likely provide a competitive combination of service quality and journey times between the Airport and Haymarket: in particular, the tram would offer greatest predictability of journey time while serving intermediate locations. This section will interchange with the Edinburgh Park Rail Station and there is potential for interchange with buses at the Gyle Shopping Centre, the A8 bus halt at Gogarburn, Ocean Terminal, and the Foot of the Walk (Leith Walk) and St.Andrew Square.
9.277 Phase 1a will provide direct access to Edinburgh Airport with a stop immediately adjacent to the terminal entrance. Phase 1a of the tram, therefore, acts as a feeder mode from the Airport to Edinburgh Park and the City Centre. A high quality and fully accessible interchange will be provided at Edinburgh Airport. The role of this interchange would be further enhanced when the proposed Edinburgh Airport Rail Link opens.
9.278 The introduction of Phase 1a will enable the integration of journeys via car and public transport through the use of Park and Ride at Ingliston. The stop which serves both the Phase 1a and the potential Newbridge branch in Phase 3 has been located to maximise the use of the Park and Ride. This will therefore offer an attractive alternative to the congested route into the City Centre.
9.279 It can be summarised that the improvements in public transport brought about by Edinburgh Tram Phase 1a are expected to meet or support most local, regional and national policy objectives, in particular those related to sustainable travel (with increased use of public transport and reduced dependence on the car), regeneration and improving access, particularly for those dependent on public transport.
9.280 It is estimated that all users of Phase 1a will benefit, to varying degrees, from the various aspects of transport integration improvements identified above, when compared to the existing level of service. The overall impact of Edinburgh Tram Phase 1a on transport integration is expected to be moderate beneficial, leading to an improvement in the accessibility of the public transport network.
Edinburgh Tram Network STAG 2 Appraisal
C:\Documents and Settings\rfineman\My Documents\Edinburgh Tram STAG 2 compilation MASTER v7 (2).doc
174
Transport integration – Phase 1b
9.281 The transport interchange benefits that have been identified for Phase 1a will be enhanced further by the introduction of Phase 1b. The principal opportunity for transport interchange will be bus interchange at Crewe Toll (particularly with regards access to the Western General Hospital).
Land-use and transport integration
9.282 Overall, it can be said that Edinburgh Tram integrates well with land-use policy and proposals, as outlined below.
9.283 Recent developments in UK and Scottish Government policy have provided a clear framework for the integration of land use and transport planning with a general requirement to promote sustainability and reduce the need to travel to relevant existing or future developments.
9.284 The land-use transport integration sub-objective should consider whether:
• Any land required for the proposal is preserved for uses which are incompatible with transport (for example, protected or conservation areas);
• The proposal fits with the general policies of all authorities at all levels concerning transport and land use; and
• The proposal conflicts with any other existing or planned development.
9.285 Thus, there is a requirement for the identification of the land use policies or proposals conflicting with statutory planning documents at local, regional and national levels. This has been carried out to some extent during the STAG Part 1 process and any serious conflicts would have been identified at an earlier stage.
9.286 Edinburgh Tram Phase 1a and Phase 1b support a range of land use policy objectives at all levels. At the national level, the National Planning Framework (NPF) for Scotland68 gives guidance on the spatial development of Scotland in the future, whilst Scottish Planning Policy: SPP 17 – Planning for Transport69 sets out policies on land use and sustainable transport. The NPF stresses the important role of transport in planning future development, particularly sustainable modes such as the tram in Edinburgh. Integration is a key focus of SPP17, not only between land use and transport planning, but linking to economic development and environmental issues as well. One of the overarching integration objectives within SPP17 supported by the tram is:
“The maintenance and enhancement of the quality of urban life, particularly the vitality and viability of urban centres.”
9.287 The tram proposal also supports the following SPP17 principles of integration (more
68 National Planning Framework for Scotland: Guidance for the spatial development of Scotland to 2025, 2004, http://www.scotland.gov.uk/Publications/2004/04/19170/35317
69 Scottish Planning Policy: SPP 17 – Planning for Transport, http://www.scotland.gov.uk/Publications/2005/08/16154406/44078
Edinburgh Tram Network STAG 2 Appraisal
C:\Documents and Settings\rfineman\My Documents\Edinburgh Tram STAG 2 compilation MASTER v7 (2).doc
175
detailed guidance on how to achieve these are contained in the accompanying Planning Advice Note PAN 7570):
• reducing the need to travel; • promoting road safety and safety on public transport; • facilitating movement by public transport including provision of interchange
facilities between modes; • providing high quality public transport access, in order to encourage modal shift
away from car use to more sustainable forms of transport, and to fully support those without access to a car; and
• providing infrastructure for real time information on public transport.
9.288 The local and regional planning policy context is set within national guidance and particularly reflects priorities for sustainability and integration.
9.289 The Transport (Scotland) Act 2005 sets out the requirement for Regional Transport Partnerships (RTP) to prepare statutory Regional Transport Strategies (RTS). The South East Scotland Regional Transport Partnership (SESTRAN) is developing a formal Regional Transport Strategy for adoption in 2007. The existing RTS was created whilst RTPs were still voluntary partnerships, and will soon be superseded. However, the Act states that the RTS must consider how transport needs to be provided, developed or improved, taking into account future needs occasioned by land use changes.
9.290 The Finalised Edinburgh and Lothians Structure Plan 201571 makes clear that the delivery of a tram system is essential for the successful delivery of the plan's development strategy, in particular, to encourage major new economic development outwith Edinburgh city centre where development opportunities are viewed to be limited. That strategy includes identification of core areas where major new development will take place. The Phase 1a tram proposals will directly support the core development areas of the city centre, Leith, and Edinburgh Park/South Gyle/Sighthill. Phase 1b will directly support development in the Granton area.
9.291 Similarly, the Edinburgh and the Lothians Structure Plan presents the challenge to ensure that a sustainable future can be built in West Edinburgh and the wider area using Phase 1a as a key artery of business and community activity. Key principles of this policy are as follows:
• combating social exclusion by ensuring access between disadvantaged local communities and subsequent new employment opportunities situated in or adjacent to the proposed tram corridor;
• the need to ensure access to affordable transportation networks for all parts of the local community and particularly those in disadvantaged areas, such as West
70 Planning Advice Note: PAN 75 – Planning for transport, http://www.scotland.gov.uk/Publications/2005/08/16154453/44538
71 Edinburgh and the Lothians Structure Plan 2015, approved June 2004, http://www.edinburgh.gov.uk/CEC/City_Development/Planning_and_Strategy/Structure_Plan/EDINBURGH_AND_THE_LOTHIANS_STRUCTURE_PLAN_2001.HTML

Edinburgh Tram Network STAG 2 Appraisal
C:\Documents and Settings\rfineman\My Documents\Edinburgh Tram STAG 2 compilation MASTER v7 (2).doc
176
Edinburgh and West Lothian; and • support for controlled development and re-use of existing buildings and vacant,
derelict and brownfield sites where regeneration potential will be maximised through integration with the proposed tram line.
9.292 The West Edinburgh Planning Framework72 has been prepared by the Scottish Executive and provides policy guidance on planning, development and growth in West Edinburgh. A key element is that adequate transport provision is essential to enable any additional development in the area.
9.293 A series of Local Plans across Edinburgh implement structure plan policy at a more detailed level. The Finalised Rural West Edinburgh Local Plan73 identifies major new greenfield housing land sites for a total of 765 houses at Kirkliston North and Ratho Station to meet the requirements of the Structure Plan, which would likely be served by a future Phase 3 of the tram. However, the Rural West Edinburgh Local Plan does make reference to the importance of the proposed tram in supporting development in west Edinburgh as set out within the Scottish Executive’s West Edinburgh Planning Framework (ibid).
9.294 Alterations to the North East Edinburgh Local Plan (1998) were adopted in 200474. This Local Plan sets out CEC’s policies for development and use of land in the north east of the City, and the Alteration specifically focuses on a major development opportunity in Leith Docks Western Harbour, which Phase 1a will support.
9.295 The Draft West Edinburgh Local Plan75 (2001) focuses on the development opportunity at Granton Waterfront – Phase 1b will support a large proportion of this development.
9.296 The tram route corridor from Haymarket to the Airport integrates well with planning and transport policies by serving the Gyle Shopping Centre and avoiding further impacts on traffic congestion at Gogar Roundabout. However, the development of Green Belt land will be required at this location.
9.297 There will be some minor impacts where existing business and residential holdings will require to be compulsory purchased to accommodate the tram line.
9.298 The Roseburn – Carrick Knowe section of phase 1b will significantly impact upon residential properties on Roseburn Drive and residents along Baird Drive raised concerns regarding noise and visual impacts from the tram.
72 West Edinburgh Planning Framework, Scottish Executive, 2003 http://www.scotland.gov.uk/Publications/2003/03/16751/19944
73 Rural West Edinburgh Local Plan, 2004, City of Edinburgh Council http://www.edinburgh.gov.uk/CEC/City_Development/Planning_and_Strategy/RWELP/index.html
74 North East Edinburgh Local Plan Alterations – January 2004, City of Edinburgh Council http://www.edinburgh.gov.uk/CEC/City_Development/Planning_and_Strategy/NEELP/neelp.html
75 Draft West Edinburgh Local Plan, City of Edinburgh Council, 2001 http://www.edinburgh.gov.uk/CEC/City_Development/Planning/Draft_West_Edinburgh_Local_Plan/west_local_plan_contents.html

Edinburgh Tram Network STAG 2 Appraisal
C:\Documents and Settings\rfineman\My Documents\Edinburgh Tram STAG 2 compilation MASTER v7 (2).doc
177
9.299 In general, there is greater scope for development opportunities resulting from the routing of Edinburgh Tram Phase 1a and 1b.
9.300 The overall assessment of the land-use transport integration impacts can be considered moderate beneficial.
Policy Integration
9.301 The Transport White Paper, Scotland’s Transport Future (2005), quotes economic growth, social inclusion and environmental protection as key areas of concern when planning transport, recognising that transport decisions have wide impacts upon communities.
9.302 The Policy Integration criterion examines whether the proposed scheme contributes to, and is consistent with, other Government policies and legislation beyond transport. A review of relevant national policies is included in Chapter 2 of this report.
9.303 Edinburgh Tram Phase 1a and 1b can contribute to the following wider Government policies:
• Disability – The design of trams and stops, fully Disability Discrimination Act (1995) compliant and with level boarding, will provide easy access to wheel chairs and push chairs, thus facilitating access not only for those with mobility impairments but also the elderly and those with young children.
• Health – The expected modal shift from car to public transport for journeys by local residents and others travelling to local employment and recreational facilities will provide greater opportunities for increased walking and cycling trips to reach the new tram stops. In addition, the use of trams (as opposed to cars) will reduce the adverse environmental impacts of traffic, particularly harmful local emissions, with an overall positive effect on health.
• Rural affairs – The scheme may potentially benefit communities in the Rural West area of Edinburgh by providing access to the tram system through the Ingliston Park and Ride in particular.
• Social inclusion – the scheme fits in with policies to promote social inclusion, by enabling the socially deprived (particularly those with no access to a car) access to the public transport network.
9.304 In general, Phase 1a will integrate well with major employment, leisure and transport hubs, such as the city centre, Ocean Terminal, Waverley and Haymarket Rail Station, the Gyle Shopping Centre, Edinburgh Park, the RBS and Edinburgh Airport, thus contributing to sustainability and reducing the need to travel. In addition to this Phase 1b will offer the potential to integrate with, Craigleith Retail Park, and the Western General.
9.305 With regards economic development, the Phase 1a will provide a generally positive impact for the business community, principally through improving accessibility and also potential for increased trade custom. This is particularly relevant for businesses located in Leith, the city centre, Edinburgh Park, South Gyle, and Sighthill. Phase 1b will improve the accessibility of to businesses located in the Craigleith area.

Edinburgh Tram Network STAG 2 Appraisal
C:\Documents and Settings\rfineman\My Documents\Edinburgh Tram STAG 2 compilation MASTER v7 (2).doc
178
9.306 In the West of Edinburgh (Haymarket to the Airport), Phase 1a will provide additional public transport capacity. It is thus likely to have a positive impact on congestion, converting car users to public transport passengers utilising a highly efficient transport mode. The tram route will improve accessibility and social inclusion, particularly in relation to the less advantaged communities to the south of the route.
9.307 It can therefore be said that the scheme is consistent with national policies beyond transport.
Accessibility
Accessibility and Social Inclusion
9.308 The accessibility objective aims at identifying the extent to which proposals can help people access employment, education, shopping, services, health and leisure facilities and destinations (community accessibility). It is also important to analyse the distribution of impacts for particular disadvantaged groups in society (such as the unemployed, those on low-income or with no car available) and by location (comparative accessibility).
9.309 Increased accessibility levels can be measured in different ways, e.g. in terms of increased destination options within a study area, journey time reductions, changes in the number of people with walking access to the public transport network or number of people with access to certain destinations (e.g. employment). Transport models and GIS capability are usually used as mechanisms for the measurement of changes in accessibility conditions.
9.310 A measure of accessibility is relevant to establish whether an area is in particular need of assistance in the first place, and whether the scheme offers scope for appreciable gains or losses in relative terms. This can be measured by the proportion of the population with poor levels of accessibility and the extent to which the proposed scheme could alter it.
Community Accessibility
Public transport network coverage
9.311 The proposed scheme is expected to increase accessibility by public transport. Public transport network coverage is measured by the changes in the number of people with public transport access to key services and destinations (for work, education, shopping, health, leisure and other trips of local significance) within specific time bands.
9.312 This measure has been determined using results from the public transport model, which simulated the introduction of Edinburgh Tram onto the public transport network and the associated integration and optimisation of the bus network.
9.313 In terms of the key trip attractors, this was informed by the 2003/4 “Upfront Buses” project undertaken by CEC, which identified the following key local services and destinations:
• George Street / Frederick Street junction – representing the focal point of the city
Edinburgh Tram Network STAG 2 Appraisal
C:\Documents and Settings\rfineman\My Documents\Edinburgh Tram STAG 2 compilation MASTER v7 (2).doc
179
centre (employment, shopping, leisure and access to Waverley rail station with integration with bus and rail) in terms of overall public transport accessibility;
• Haymarket rail station (integration, interchange with bus and rail); • Foot of Leith Walk (employment, shopping, jobcentre); • Leith Ocean Terminal (employment); • Granton development area (employment, residential and education, with Telford
College – amalgamation of 4 campuses – and new school on waterfront site. There is also the potential for hotels and leisure activities);
• Crewe Toll/ Western General Hospital (employment, visiting relatives); • Edinburgh Airport (employment, transport interchange); • Gyle Centre (Shopping); • Edinburgh Park (employment); • Sighthill Industrial Estate (employment); and • Napier University Sighthill Campus (education).
9.314 The changes in public transport perceived travel time have been estimated by the transport model (accounting for walk time, wait time and interchange time, according to service frequencies) from all origins to each of the destinations identified above, considering the “without” (bus only) and “with” the scheme scenarios (bus and tram). Figure 9.18 to Figure 9.28 illustrate the changes in accessibility to each of the destinations for Phase 1a; for Phase 1a+1b, the accessibility impacts are shown in Figure 9.29 to Figure 9.39. (Note that due to the zonal basis of the data and the associated representation of walk networks, the results can sometimes appear lumpy and discontinuous. In practice the transition between accessibility changes would be smoother.)
9.315 In general, accessibility is improved for travel for most zones to all the selected destinations. Some destinations show a relatively neutral impact from the tram due to the already high levels of accessibility; this applies most to the George Street location.
9.316 By definition, the reductions in accessibility occur where the bus network is reconfigured with the introduction of tram, principally routes terminating in the city centre rather than running through to Leith and beyond. For example, access to the Foot of Leith Walk is poorer from the Slateford and Kingsknowe areas due to route 25 being terminated at St.Andrews Square, rather than running through to Leith and Restalrig. Similar effects can be seen for access to Ocean Terminal.
Access to local services
9.317 This criterion captures the local accessibility benefits for walk and cycling trips. Although the tram provides increased opportunities for walking and cycling as access modes to reach the tram system (already accounted for in the policy integration with health), it has limitations to promote further non-motorised trips to access local services.
9.318 There will be some improvement in walk and cycle access where the tram runs on-street as crossing facilities and pedestrian refuges will be included in the scheme. The relatively low frequency and predictable swept paths of trams mean that pedestrians are more confident in crossing tram-only streets than streets with buses or general

Edinburgh Tram Network STAG 2 Appraisal
C:\Documents and Settings\rfineman\My Documents\Edinburgh Tram STAG 2 compilation MASTER v7 (2).doc
180
traffic and this would lead to some improvement in local accessibility, particularly within the city centre.
9.319 Conversely, Edinburgh Tram could cause adverse effects on non-motorised accessibility, since pedestrians and cyclists could take longer to cross the street (part of which will be taken by the tram line), particularly if the mix of road and tram traffic causes additional perceived detriment to movement. This can be particularly the case if road and tram traffic clear at different moments, since they can have different patterns, potentially delaying the complete crossing when undertaken with safety. Further aspects of relevance include the crossing:
• Of wheel and push chair users as well as of other mobility impaired, since their movement is more sensitive to physical and psychological barriers; and
• At tram stops, when their design comprises waiting/seating areas, fencing or any other facility that can represent a barrier to street crossing (although as noted above stops may introduce additional pedestrian crossings which could contribute to a safer crossing, but possibly at the expense of additional delay.)
Notwithstanding the above, the design process will seek to minimise any adverse impacts on local access through the design process.
9.320 Overall the impact on local accessibility will be limited but the net effect is likely to be minor beneficial for both Phase 1a only and Phase 1a+1b.
Comparative accessibility
9.321 Some key benefits of the scheme will be realised by the socially disadvantaged. The distribution of accessibility impacts is relevant in that it identifies the extent to which the scheme benefits social groups or geographic locations most in need of access by public transport to essential activities
9.322 This analysis draws from the disaggregation of the community accessibility results (as in the previous section) by no-car ownership, with the aim to compare the accessibility benefits accrued by this group in relation to the community as a whole.
9.323 Table 9.42 summarises the results of the Phase 1a accessibility analysis for each selected location. It shows the impact on accessibility, by travel time change bands, for population, households and households without a car; the baseline data is from the 2001 Census for the City of Edinburgh, West Lothian, Midlothian and East Lothian. Negative changes indicate a reduction in travel time, with positive changes showing a disbenefit. The results for Phase 1a+1b are shown in Table 9.43.
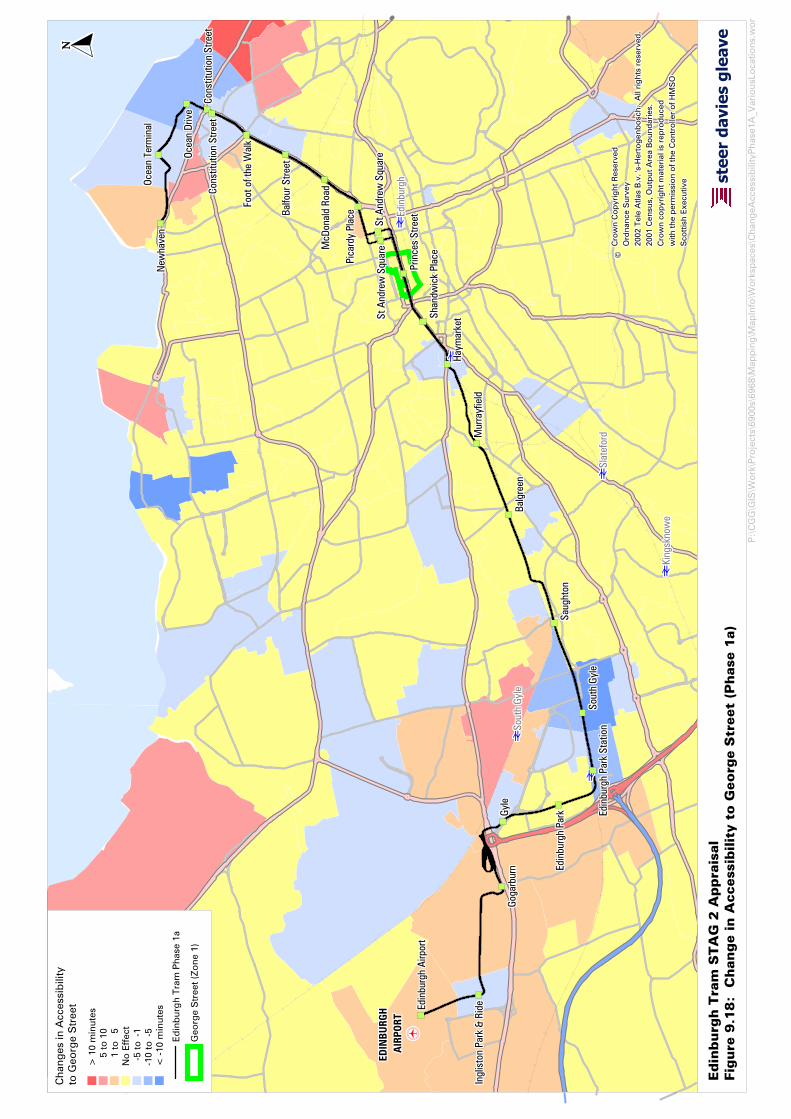
‡ ‡ ‡ ‡ ‡ ‡ ‡‡ ‡ ‡ ‡ ‡ ‡ ‡‡ ‡ ‡ ‡ ‡ ‡ ‡‡ ‡ ‡ ‡ ‡ ‡‡ ‡ ‡ ‡ ‡ ‡ ‡‡ ‡ ‡ ‡ ‡ ‡ ‡‡ ‡ ‡ ‡ ‡ ‡ ‡‡
è è è è è è èè è è è è è èè è è è è è èè è è è è èè è è è è è èè è è è è è èè è è è è è èè
è è è è è è èè è è è è è èè è è è è è èè è è è è èè è è è è è èè è è è è è èè è è è è è èèè è è è è è èè è è è è è èè è è è è è èè è è è è èè è è è è è èè è è è è è èè è è è è è èè
è è è è è è èè è è è è è èè è è è è è èè è è è è èè è è è è è èè è è è è è èè è è è è è èè
è è è è è è èè è è è è è èè è è è è è èè è è è è èè è è è è è èè è è è è è èè è è è è è èè
è è è è è è èè è è è è è èè è è è è è èè è è è è èè è è è è è èè è è è è è èè è è è è è èè
EDIN
BURG
H ED
INBU
RGH
EDIN
BURG
H ED
INBU
RGH
EDIN
BURG
H ED
INBU
RGH
EDIN
BURG
H ED
INBU
RGH
EDIN
BURG
H A
IRPO
RTA
IRPO
RTA
IRPO
RTA
IRPO
RTA
IRPO
RTA
IRPO
RTA
IRPO
RTA
IRPO
RTA
IRPO
RT
Cons
titut
ion
Stre
etCo
nstit
utio
n St
reet
Cons
titut
ion
Stre
etCo
nstit
utio
n St
reet
Cons
titut
ion
Stre
etCo
nstit
utio
n St
reet
Cons
titut
ion
Stre
etCo
nstit
utio
n St
reet
Cons
titut
ion
Stre
etCo
nstit
utio
n St
reet
Cons
titut
ion
Stre
etCo
nstit
utio
n St
reet
Cons
titut
ion
Stre
etCo
nstit
utio
n St
reet
Cons
titut
ion
Stre
etCo
nstit
utio
n St
reet
Cons
titut
ion
Stre
etCo
nstit
utio
n St
reet
Prin
ces
Stre
etPr
ince
s St
reet
Prin
ces
Stre
etPr
ince
s St
reet
Prin
ces
Stre
etPr
ince
s St
reet
Prin
ces
Stre
etPr
ince
s St
reet
Prin
ces
Stre
et
Shan
dwic
k Pl
ace
Shan
dwic
k Pl
ace
Shan
dwic
k Pl
ace
Shan
dwic
k Pl
ace
Shan
dwic
k Pl
ace
Shan
dwic
k Pl
ace
Shan
dwic
k Pl
ace
Shan
dwic
k Pl
ace
Shan
dwic
k Pl
ace
Pica
rdy
Plac
ePi
card
y Pl
ace
Pica
rdy
Plac
ePi
card
y Pl
ace
Pica
rdy
Plac
ePi
card
y Pl
ace
Pica
rdy
Plac
ePi
card
y Pl
ace
Pica
rdy
Plac
e
Ocea
n Te
rmin
alOc
ean
Term
inal
Ocea
n Te
rmin
alOc
ean
Term
inal
Ocea
n Te
rmin
alOc
ean
Term
inal
Ocea
n Te
rmin
alOc
ean
Term
inal
Ocea
n Te
rmin
alN
ewha
ven
New
have
nN
ewha
ven
New
have
nN
ewha
ven
New
have
nN
ewha
ven
New
have
nN
ewha
ven
Haym
arke
tHa
ymar
ket
Haym
arke
tHa
ymar
ket
Haym
arke
tHa
ymar
ket
Haym
arke
tHa
ymar
ket
Haym
arke
t
Balg
reen
Balg
reen
Balg
reen
Balg
reen
Balg
reen
Balg
reen
Balg
reen
Balg
reen
Balg
reen
Sout
h Gy
leSo
uth
Gyle
Sout
h Gy
leSo
uth
Gyle
Sout
h Gy
leSo
uth
Gyle
Sout
h Gy
leSo
uth
Gyle
Sout
h Gy
leEd
inbu
rgh
Park
Sta
tion
Edin
burg
h Pa
rk S
tatio
nEd
inbu
rgh
Park
Sta
tion
Edin
burg
h Pa
rk S
tatio
nEd
inbu
rgh
Park
Sta
tion
Edin
burg
h Pa
rk S
tatio
nEd
inbu
rgh
Park
Sta
tion
Edin
burg
h Pa
rk S
tatio
nEd
inbu
rgh
Park
Sta
tion
Saug
hton
Saug
hton
Saug
hton
Saug
hton
Saug
hton
Saug
hton
Saug
hton
Saug
hton
Saug
hton
Goga
rbur
nGo
garb
urn
Goga
rbur
nGo
garb
urn
Goga
rbur
nGo
garb
urn
Goga
rbur
nGo
garb
urn
Goga
rbur
n
Edin
burg
h Ai
rpor
tEd
inbu
rgh
Airp
ort
Edin
burg
h Ai
rpor
tEd
inbu
rgh
Airp
ort
Edin
burg
h Ai
rpor
tEd
inbu
rgh
Airp
ort
Edin
burg
h Ai
rpor
tEd
inbu
rgh
Airp
ort
Edin
burg
h Ai
rpor
t
Ingl
isto
n Pa
rk &
Rid
eIn
glis
ton
Park
& R
ide
Ingl
isto
n Pa
rk &
Rid
eIn
glis
ton
Park
& R
ide
Ingl
isto
n Pa
rk &
Rid
eIn
glis
ton
Park
& R
ide
Ingl
isto
n Pa
rk &
Rid
eIn
glis
ton
Park
& R
ide
Ingl
isto
n Pa
rk &
Rid
e
St A
ndre
w S
quar
eSt
And
rew
Squ
are
St A
ndre
w S
quar
eSt
And
rew
Squ
are
St A
ndre
w S
quar
eSt
And
rew
Squ
are
St A
ndre
w S
quar
eSt
And
rew
Squ
are
St A
ndre
w S
quar
e
Edin
burg
h Pa
rkEd
inbu
rgh
Park
Edin
burg
h Pa
rkEd
inbu
rgh
Park
Edin
burg
h Pa
rkEd
inbu
rgh
Park
Edin
burg
h Pa
rkEd
inbu
rgh
Park
Edin
burg
h Pa
rk
Ocea
n Dr
ive
Ocea
n Dr
ive
Ocea
n Dr
ive
Ocea
n Dr
ive
Ocea
n Dr
ive
Ocea
n Dr
ive
Ocea
n Dr
ive
Ocea
n Dr
ive
Ocea
n Dr
ive
St A
ndre
w S
quar
eSt
And
rew
Squ
are
St A
ndre
w S
quar
eSt
And
rew
Squ
are
St A
ndre
w S
quar
eSt
And
rew
Squ
are
St A
ndre
w S
quar
eSt
And
rew
Squ
are
St A
ndre
w S
quar
e
Foot
of t
he W
alk
Foot
of t
he W
alk
Foot
of t
he W
alk
Foot
of t
he W
alk
Foot
of t
he W
alk
Foot
of t
he W
alk
Foot
of t
he W
alk
Foot
of t
he W
alk
Foot
of t
he W
alk
Balfo
ur S
treet
Balfo
ur S
treet
Balfo
ur S
treet
Balfo
ur S
treet
Balfo
ur S
treet
Balfo
ur S
treet
Balfo
ur S
treet
Balfo
ur S
treet
Balfo
ur S
treet
McD
onal
d Ro
adM
cDon
ald
Road
McD
onal
d Ro
adM
cDon
ald
Road
McD
onal
d Ro
adM
cDon
ald
Road
McD
onal
d Ro
adM
cDon
ald
Road
McD
onal
d Ro
ad
Sout
h Gy
leSo
uth
Gyle
Sout
h Gy
leSo
uth
Gyle
Sout
h Gy
leSo
uth
Gyle
Sout
h Gy
leSo
uth
Gyle
Sout
h Gy
le
Slat
efor
dSl
atef
ord
Slat
efor
dSl
atef
ord
Slat
efor
dSl
atef
ord
Slat
efor
dSl
atef
ord
Slat
efor
d
King
skno
we
King
skno
we
King
skno
we
King
skno
we
King
skno
we
King
skno
we
King
skno
we
King
skno
we
King
skno
we
Edin
burg
hEd
inbu
rgh
Edin
burg
hEd
inbu
rgh
Edin
burg
hEd
inbu
rgh
Edin
burg
hEd
inbu
rgh
Edin
burg
h
Mur
rayf
ield
Mur
rayf
ield
Mur
rayf
ield
Mur
rayf
ield
Mur
rayf
ield
Mur
rayf
ield
Mur
rayf
ield
Mur
rayf
ield
Mur
rayf
ield
Gyle
Gyle
Gyle
Gyle
Gyle
Gyle
Gyle
Gyle
Gyle
stee
r da
vies
gle
ave
Edin
burg
h T
ram
STA
G 2
Appra
isal
Fig
ure
9.1
8:
Change in A
ccess
ibilit
y t
o G
eorg
e S
treet
(Phase
1a)
P:\
CG
G\G
IS\W
ork
\Pro
ject
s\69
00s\
6968
\Map
pin
g\M
apIn
fo\W
ork
spac
es\C
hang
eAcc
essi
bili
tyP
hase
1A_V
ario
usLo
catio
ns.w
or
Cha
nges
in A
cces
sib
ility
to
Geo
rge
Str
eet
> 1
0 m
inut
es5
to 1
01
to
5N
o E
ffec
t-5
to -
1-1
0 to
-5
< -
10 m
inut
es
© © ©© ©© © ©©C
row
n C
op
yrig
ht R
eser
ved
Cro
wn
Co
pyr
ight
Res
erve
dC
row
n C
op
yrig
ht R
eser
ved
Cro
wn
Co
pyr
ight
Res
erve
dC
row
n C
op
yrig
ht R
eser
ved
Cro
wn
Co
pyr
ight
Res
erve
dC
row
n C
op
yrig
ht R
eser
ved
Cro
wn
Co
pyr
ight
Res
erve
dC
row
n C
op
yrig
ht R
eser
ved
Ord
nanc
e S
urve
yO
rdna
nce
Sur
vey
Ord
nanc
e S
urve
yO
rdna
nce
Sur
vey
Ord
nanc
e S
urve
yO
rdna
nce
Sur
vey
Ord
nanc
e S
urve
yO
rdna
nce
Sur
vey
Ord
nanc
e S
urve
y20
02 T
ele
Atla
s B
.v. '
s-H
erto
genb
osc
h. A
ll ri
ghts
res
erve
d.
2002
Tel
e A
tlas
B.v
. 's-
Her
toge
nbo
sch.
All
righ
ts r
eser
ved
.20
02 T
ele
Atla
s B
.v. '
s-H
erto
genb
osc
h. A
ll ri
ghts
res
erve
d.
2002
Tel
e A
tlas
B.v
. 's-
Her
toge
nbo
sch.
All
righ
ts r
eser
ved
.20
02 T
ele
Atla
s B
.v. '
s-H
erto
genb
osc
h. A
ll ri
ghts
res
erve
d.
2002
Tel
e A
tlas
B.v
. 's-
Her
toge
nbo
sch.
All
righ
ts r
eser
ved
.20
02 T
ele
Atla
s B
.v. '
s-H
erto
genb
osc
h. A
ll ri
ghts
res
erve
d.
2002
Tel
e A
tlas
B.v
. 's-
Her
toge
nbo
sch.
All
righ
ts r
eser
ved
.20
02 T
ele
Atla
s B
.v. '
s-H
erto
genb
osc
h. A
ll ri
ghts
res
erve
d.
2001
Cen
sus,
Out
put
Are
a B
oun
dar
ies.
2001
Cen
sus,
Out
put
Are
a B
oun
dar
ies.
2001
Cen
sus,
Out
put
Are
a B
oun
dar
ies.
2001
Cen
sus,
Out
put
Are
a B
oun
dar
ies.
2001
Cen
sus,
Out
put
Are
a B
oun
dar
ies.
2001
Cen
sus,
Out
put
Are
a B
oun
dar
ies.
2001
Cen
sus,
Out
put
Are
a B
oun
dar
ies.
2001
Cen
sus,
Out
put
Are
a B
oun
dar
ies.
2001
Cen
sus,
Out
put
Are
a B
oun
dar
ies.
Cro
wn
cop
yrig
ht m
ater
ial i
s re
pro
duc
ed
Cro
wn
cop
yrig
ht m
ater
ial i
s re
pro
duc
ed
Cro
wn
cop
yrig
ht m
ater
ial i
s re
pro
duc
ed
Cro
wn
cop
yrig
ht m
ater
ial i
s re
pro
duc
ed
Cro
wn
cop
yrig
ht m
ater
ial i
s re
pro
duc
ed
Cro
wn
cop
yrig
ht m
ater
ial i
s re
pro
duc
ed
Cro
wn
cop
yrig
ht m
ater
ial i
s re
pro
duc
ed
Cro
wn
cop
yrig
ht m
ater
ial i
s re
pro
duc
ed
Cro
wn
cop
yrig
ht m
ater
ial i
s re
pro
duc
ed
with
the
per
mis
sio
n o
f the
Co
ntro
ller
of H
MS
Ow
ith th
e p
erm
issi
on
of t
he C
ont
rolle
r o
f HM
SO
with
the
per
mis
sio
n o
f the
Co
ntro
ller
of H
MS
Ow
ith th
e p
erm
issi
on
of t
he C
ont
rolle
r o
f HM
SO
with
the
per
mis
sio
n o
f the
Co
ntro
ller
of H
MS
Ow
ith th
e p
erm
issi
on
of t
he C
ont
rolle
r o
f HM
SO
with
the
per
mis
sio
n o
f the
Co
ntro
ller
of H
MS
Ow
ith th
e p
erm
issi
on
of t
he C
ont
rolle
r o
f HM
SO
with
the
per
mis
sio
n o
f the
Co
ntro
ller
of H
MS
OS
cott
ish
Exe
cutiv
eS
cott
ish
Exe
cutiv
eS
cott
ish
Exe
cutiv
eS
cott
ish
Exe
cutiv
eS
cott
ish
Exe
cutiv
eS
cott
ish
Exe
cutiv
eS
cott
ish
Exe
cutiv
eS
cott
ish
Exe
cutiv
eS
cott
ish
Exe
cutiv
e
Ed
inb
urgh
Tra
m P
hase
1a
Geo
rge
Str
eet (
Zo
ne 1
)
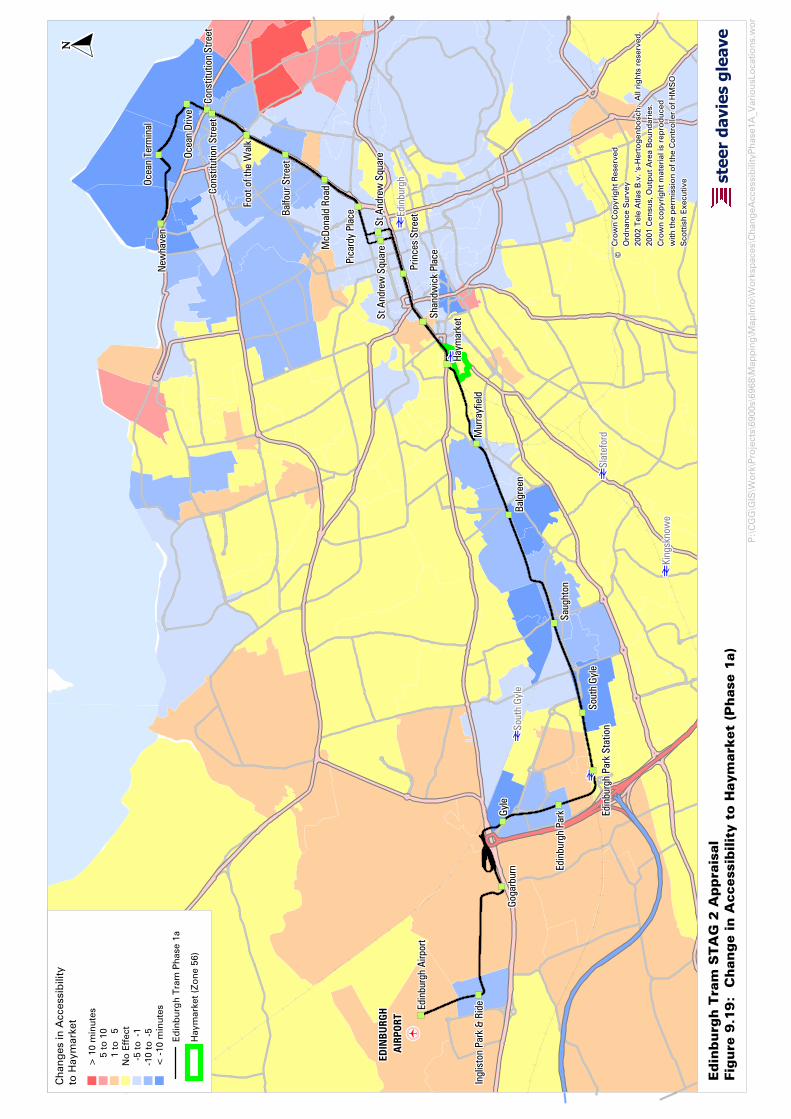
‡ ‡ ‡ ‡ ‡ ‡ ‡‡ ‡ ‡ ‡ ‡ ‡ ‡‡ ‡ ‡ ‡ ‡ ‡ ‡‡ ‡ ‡ ‡ ‡ ‡‡ ‡ ‡ ‡ ‡ ‡ ‡‡ ‡ ‡ ‡ ‡ ‡ ‡‡ ‡ ‡ ‡ ‡ ‡ ‡‡
è è è è è è èè è è è è è èè è è è è è èè è è è è èè è è è è è èè è è è è è èè è è è è è èè
è è è è è è èè è è è è è èè è è è è è èè è è è è èè è è è è è èè è è è è è èè è è è è è èèè è è è è è èè è è è è è èè è è è è è èè è è è è èè è è è è è èè è è è è è èè è è è è è èè
è è è è è è èè è è è è è èè è è è è è èè è è è è èè è è è è è èè è è è è è èè è è è è è èè
è è è è è è èè è è è è è èè è è è è è èè è è è è èè è è è è è èè è è è è è èè è è è è è èè
è è è è è è èè è è è è è èè è è è è è èè è è è è èè è è è è è èè è è è è è èè è è è è è èè
EDIN
BURG
H ED
INBU
RGH
EDIN
BURG
H ED
INBU
RGH
EDIN
BURG
H ED
INBU
RGH
EDIN
BURG
H ED
INBU
RGH
EDIN
BURG
H A
IRPO
RTA
IRPO
RTA
IRPO
RTA
IRPO
RTA
IRPO
RTA
IRPO
RTA
IRPO
RTA
IRPO
RTA
IRPO
RT
Cons
titut
ion
Stre
etCo
nstit
utio
n St
reet
Cons
titut
ion
Stre
etCo
nstit
utio
n St
reet
Cons
titut
ion
Stre
etCo
nstit
utio
n St
reet
Cons
titut
ion
Stre
etCo
nstit
utio
n St
reet
Cons
titut
ion
Stre
etCo
nstit
utio
n St
reet
Cons
titut
ion
Stre
etCo
nstit
utio
n St
reet
Cons
titut
ion
Stre
etCo
nstit
utio
n St
reet
Cons
titut
ion
Stre
etCo
nstit
utio
n St
reet
Cons
titut
ion
Stre
etCo
nstit
utio
n St
reet
Ocea
n Te
rmin
alOc
ean
Term
inal
Ocea
n Te
rmin
alOc
ean
Term
inal
Ocea
n Te
rmin
alOc
ean
Term
inal
Ocea
n Te
rmin
alOc
ean
Term
inal
Ocea
n Te
rmin
alN
ewha
ven
New
have
nN
ewha
ven
New
have
nN
ewha
ven
New
have
nN
ewha
ven
New
have
nN
ewha
ven
Pica
rdy
Plac
ePi
card
y Pl
ace
Pica
rdy
Plac
ePi
card
y Pl
ace
Pica
rdy
Plac
ePi
card
y Pl
ace
Pica
rdy
Plac
ePi
card
y Pl
ace
Pica
rdy
Plac
e
St A
ndre
w S
quar
eSt
And
rew
Squ
are
St A
ndre
w S
quar
eSt
And
rew
Squ
are
St A
ndre
w S
quar
eSt
And
rew
Squ
are
St A
ndre
w S
quar
eSt
And
rew
Squ
are
St A
ndre
w S
quar
e
Prin
ces
Stre
etPr
ince
s St
reet
Prin
ces
Stre
etPr
ince
s St
reet
Prin
ces
Stre
etPr
ince
s St
reet
Prin
ces
Stre
etPr
ince
s St
reet
Prin
ces
Stre
et
Shan
dwic
k Pl
ace
Shan
dwic
k Pl
ace
Shan
dwic
k Pl
ace
Shan
dwic
k Pl
ace
Shan
dwic
k Pl
ace
Shan
dwic
k Pl
ace
Shan
dwic
k Pl
ace
Shan
dwic
k Pl
ace
Shan
dwic
k Pl
ace
Haym
arke
tHa
ymar
ket
Haym
arke
tHa
ymar
ket
Haym
arke
tHa
ymar
ket
Haym
arke
tHa
ymar
ket
Haym
arke
t
Balg
reen
Balg
reen
Balg
reen
Balg
reen
Balg
reen
Balg
reen
Balg
reen
Balg
reen
Balg
reen
Saug
hton
Saug
hton
Saug
hton
Saug
hton
Saug
hton
Saug
hton
Saug
hton
Saug
hton
Saug
hton
Sout
h Gy
leSo
uth
Gyle
Sout
h Gy
leSo
uth
Gyle
Sout
h Gy
leSo
uth
Gyle
Sout
h Gy
leSo
uth
Gyle
Sout
h Gy
leEd
inbu
rgh
Park
Sta
tion
Edin
burg
h Pa
rk S
tatio
nEd
inbu
rgh
Park
Sta
tion
Edin
burg
h Pa
rk S
tatio
nEd
inbu
rgh
Park
Sta
tion
Edin
burg
h Pa
rk S
tatio
nEd
inbu
rgh
Park
Sta
tion
Edin
burg
h Pa
rk S
tatio
nEd
inbu
rgh
Park
Sta
tion
Goga
rbur
nGo
garb
urn
Goga
rbur
nGo
garb
urn
Goga
rbur
nGo
garb
urn
Goga
rbur
nGo
garb
urn
Goga
rbur
n
Edin
burg
h Ai
rpor
tEd
inbu
rgh
Airp
ort
Edin
burg
h Ai
rpor
tEd
inbu
rgh
Airp
ort
Edin
burg
h Ai
rpor
tEd
inbu
rgh
Airp
ort
Edin
burg
h Ai
rpor
tEd
inbu
rgh
Airp
ort
Edin
burg
h Ai
rpor
t
Edin
burg
h Pa
rkEd
inbu
rgh
Park
Edin
burg
h Pa
rkEd
inbu
rgh
Park
Edin
burg
h Pa
rkEd
inbu
rgh
Park
Edin
burg
h Pa
rkEd
inbu
rgh
Park
Edin
burg
h Pa
rk
Ocea
n Dr
ive
Ocea
n Dr
ive
Ocea
n Dr
ive
Ocea
n Dr
ive
Ocea
n Dr
ive
Ocea
n Dr
ive
Ocea
n Dr
ive
Ocea
n Dr
ive
Ocea
n Dr
ive
Ingl
isto
n Pa
rk &
Rid
eIn
glis
ton
Park
& R
ide
Ingl
isto
n Pa
rk &
Rid
eIn
glis
ton
Park
& R
ide
Ingl
isto
n Pa
rk &
Rid
eIn
glis
ton
Park
& R
ide
Ingl
isto
n Pa
rk &
Rid
eIn
glis
ton
Park
& R
ide
Ingl
isto
n Pa
rk &
Rid
e
St A
ndre
w S
quar
eSt
And
rew
Squ
are
St A
ndre
w S
quar
eSt
And
rew
Squ
are
St A
ndre
w S
quar
eSt
And
rew
Squ
are
St A
ndre
w S
quar
eSt
And
rew
Squ
are
St A
ndre
w S
quar
e
Foot
of t
he W
alk
Foot
of t
he W
alk
Foot
of t
he W
alk
Foot
of t
he W
alk
Foot
of t
he W
alk
Foot
of t
he W
alk
Foot
of t
he W
alk
Foot
of t
he W
alk
Foot
of t
he W
alk
Balfo
ur S
treet
Balfo
ur S
treet
Balfo
ur S
treet
Balfo
ur S
treet
Balfo
ur S
treet
Balfo
ur S
treet
Balfo
ur S
treet
Balfo
ur S
treet
Balfo
ur S
treet
McD
onal
d Ro
adM
cDon
ald
Road
McD
onal
d Ro
adM
cDon
ald
Road
McD
onal
d Ro
adM
cDon
ald
Road
McD
onal
d Ro
adM
cDon
ald
Road
McD
onal
d Ro
ad
Sout
h Gy
leSo
uth
Gyle
Sout
h Gy
leSo
uth
Gyle
Sout
h Gy
leSo
uth
Gyle
Sout
h Gy
leSo
uth
Gyle
Sout
h Gy
le
Slat
efor
dSl
atef
ord
Slat
efor
dSl
atef
ord
Slat
efor
dSl
atef
ord
Slat
efor
dSl
atef
ord
Slat
efor
d
King
skno
we
King
skno
we
King
skno
we
King
skno
we
King
skno
we
King
skno
we
King
skno
we
King
skno
we
King
skno
we
Edin
burg
hEd
inbu
rgh
Edin
burg
hEd
inbu
rgh
Edin
burg
hEd
inbu
rgh
Edin
burg
hEd
inbu
rgh
Edin
burg
h
Mur
rayf
ield
Mur
rayf
ield
Mur
rayf
ield
Mur
rayf
ield
Mur
rayf
ield
Mur
rayf
ield
Mur
rayf
ield
Mur
rayf
ield
Mur
rayf
ield
Gyle
Gyle
Gyle
Gyle
Gyle
Gyle
Gyle
Gyle
Gyle
stee
r da
vies
gle
ave
© © ©© ©© © ©©C
row
n C
op
yrig
ht R
eser
ved
Cro
wn
Co
pyr
ight
Res
erve
dC
row
n C
op
yrig
ht R
eser
ved
Cro
wn
Co
pyr
ight
Res
erve
dC
row
n C
op
yrig
ht R
eser
ved
Cro
wn
Co
pyr
ight
Res
erve
dC
row
n C
op
yrig
ht R
eser
ved
Cro
wn
Co
pyr
ight
Res
erve
dC
row
n C
op
yrig
ht R
eser
ved
Ord
nanc
e S
urve
yO
rdna
nce
Sur
vey
Ord
nanc
e S
urve
yO
rdna
nce
Sur
vey
Ord
nanc
e S
urve
yO
rdna
nce
Sur
vey
Ord
nanc
e S
urve
yO
rdna
nce
Sur
vey
Ord
nanc
e S
urve
y20
02 T
ele
Atla
s B
.v. '
s-H
erto
genb
osc
h. A
ll ri
ghts
res
erve
d.
2002
Tel
e A
tlas
B.v
. 's-
Her
toge
nbo
sch.
All
righ
ts r
eser
ved
.20
02 T
ele
Atla
s B
.v. '
s-H
erto
genb
osc
h. A
ll ri
ghts
res
erve
d.
2002
Tel
e A
tlas
B.v
. 's-
Her
toge
nbo
sch.
All
righ
ts r
eser
ved
.20
02 T
ele
Atla
s B
.v. '
s-H
erto
genb
osc
h. A
ll ri
ghts
res
erve
d.
2002
Tel
e A
tlas
B.v
. 's-
Her
toge
nbo
sch.
All
righ
ts r
eser
ved
.20
02 T
ele
Atla
s B
.v. '
s-H
erto
genb
osc
h. A
ll ri
ghts
res
erve
d.
2002
Tel
e A
tlas
B.v
. 's-
Her
toge
nbo
sch.
All
righ
ts r
eser
ved
.20
02 T
ele
Atla
s B
.v. '
s-H
erto
genb
osc
h. A
ll ri
ghts
res
erve
d.
2001
Cen
sus,
Out
put
Are
a B
oun
dar
ies.
2001
Cen
sus,
Out
put
Are
a B
oun
dar
ies.
2001
Cen
sus,
Out
put
Are
a B
oun
dar
ies.
2001
Cen
sus,
Out
put
Are
a B
oun
dar
ies.
2001
Cen
sus,
Out
put
Are
a B
oun
dar
ies.
2001
Cen
sus,
Out
put
Are
a B
oun
dar
ies.
2001
Cen
sus,
Out
put
Are
a B
oun
dar
ies.
2001
Cen
sus,
Out
put
Are
a B
oun
dar
ies.
2001
Cen
sus,
Out
put
Are
a B
oun
dar
ies.
Cro
wn
cop
yrig
ht m
ater
ial i
s re
pro
duc
ed
Cro
wn
cop
yrig
ht m
ater
ial i
s re
pro
duc
ed
Cro
wn
cop
yrig
ht m
ater
ial i
s re
pro
duc
ed
Cro
wn
cop
yrig
ht m
ater
ial i
s re
pro
duc
ed
Cro
wn
cop
yrig
ht m
ater
ial i
s re
pro
duc
ed
Cro
wn
cop
yrig
ht m
ater
ial i
s re
pro
duc
ed
Cro
wn
cop
yrig
ht m
ater
ial i
s re
pro
duc
ed
Cro
wn
cop
yrig
ht m
ater
ial i
s re
pro
duc
ed
Cro
wn
cop
yrig
ht m
ater
ial i
s re
pro
duc
ed
with
the
per
mis
sio
n o
f the
Co
ntro
ller
of H
MS
Ow
ith th
e p
erm
issi
on
of t
he C
ont
rolle
r o
f HM
SO
with
the
per
mis
sio
n o
f the
Co
ntro
ller
of H
MS
Ow
ith th
e p
erm
issi
on
of t
he C
ont
rolle
r o
f HM
SO
with
the
per
mis
sio
n o
f the
Co
ntro
ller
of H
MS
Ow
ith th
e p
erm
issi
on
of t
he C
ont
rolle
r o
f HM
SO
with
the
per
mis
sio
n o
f the
Co
ntro
ller
of H
MS
Ow
ith th
e p
erm
issi
on
of t
he C
ont
rolle
r o
f HM
SO
with
the
per
mis
sio
n o
f the
Co
ntro
ller
of H
MS
OS
cott
ish
Exe
cutiv
eS
cott
ish
Exe
cutiv
eS
cott
ish
Exe
cutiv
eS
cott
ish
Exe
cutiv
eS
cott
ish
Exe
cutiv
eS
cott
ish
Exe
cutiv
eS
cott
ish
Exe
cutiv
eS
cott
ish
Exe
cutiv
eS
cott
ish
Exe
cutiv
e
Edin
burg
h T
ram
STA
G 2
Appra
isal
Fig
ure
9.1
9:
Change in A
ccess
ibilit
y t
o H
aym
ark
et
(Phase
1a)
Cha
nges
in A
cces
sib
ility
to
Hay
mar
ket
> 1
0 m
inut
es5
to 1
01
to
5N
o E
ffec
t-5
to -
1-1
0 to
-5
< -
10 m
inut
es
Ed
inb
urgh
Tra
m P
hase
1a
P:\
CG
G\G
IS\W
ork
\Pro
ject
s\69
00s\
6968
\Map
pin
g\M
apIn
fo\W
ork
spac
es\C
hang
eAcc
essi
bili
tyP
hase
1A_V
ario
usLo
catio
ns.w
or
Hay
mar
ket (
Zo
ne 5
6)

‡ ‡ ‡ ‡ ‡ ‡ ‡‡ ‡ ‡ ‡ ‡ ‡ ‡‡ ‡ ‡ ‡ ‡ ‡ ‡‡ ‡ ‡ ‡ ‡ ‡‡ ‡ ‡ ‡ ‡ ‡ ‡‡ ‡ ‡ ‡ ‡ ‡ ‡‡ ‡ ‡ ‡ ‡ ‡ ‡‡
è è è è è è èè è è è è è èè è è è è è èè è è è è èè è è è è è èè è è è è è èè è è è è è èè
è è è è è è èè è è è è è èè è è è è è èè è è è è èè è è è è è èè è è è è è èè è è è è è èèè è è è è è èè è è è è è èè è è è è è èè è è è è èè è è è è è èè è è è è è èè è è è è è èè
è è è è è è èè è è è è è èè è è è è è èè è è è è èè è è è è è èè è è è è è èè è è è è è èè
è è è è è è èè è è è è è èè è è è è è èè è è è è èè è è è è è èè è è è è è èè è è è è è èè
è è è è è è èè è è è è è èè è è è è è èè è è è è èè è è è è è èè è è è è è èè è è è è è èè
EDIN
BURG
H ED
INBU
RGH
EDIN
BURG
H ED
INBU
RGH
EDIN
BURG
H ED
INBU
RGH
EDIN
BURG
H ED
INBU
RGH
EDIN
BURG
H A
IRPO
RTA
IRPO
RTA
IRPO
RTA
IRPO
RTA
IRPO
RTA
IRPO
RTA
IRPO
RTA
IRPO
RTA
IRPO
RT
Edin
burg
h Ai
rpor
tEd
inbu
rgh
Airp
ort
Edin
burg
h Ai
rpor
tEd
inbu
rgh
Airp
ort
Edin
burg
h Ai
rpor
tEd
inbu
rgh
Airp
ort
Edin
burg
h Ai
rpor
tEd
inbu
rgh
Airp
ort
Edin
burg
h Ai
rpor
t
Cons
titut
ion
Stre
etCo
nstit
utio
n St
reet
Cons
titut
ion
Stre
etCo
nstit
utio
n St
reet
Cons
titut
ion
Stre
etCo
nstit
utio
n St
reet
Cons
titut
ion
Stre
etCo
nstit
utio
n St
reet
Cons
titut
ion
Stre
etCo
nstit
utio
n St
reet
Cons
titut
ion
Stre
etCo
nstit
utio
n St
reet
Cons
titut
ion
Stre
etCo
nstit
utio
n St
reet
Cons
titut
ion
Stre
etCo
nstit
utio
n St
reet
Cons
titut
ion
Stre
etCo
nstit
utio
n St
reet
Pica
rdy
Plac
ePi
card
y Pl
ace
Pica
rdy
Plac
ePi
card
y Pl
ace
Pica
rdy
Plac
ePi
card
y Pl
ace
Pica
rdy
Plac
ePi
card
y Pl
ace
Pica
rdy
Plac
e
Prin
ces
Stre
etPr
ince
s St
reet
Prin
ces
Stre
etPr
ince
s St
reet
Prin
ces
Stre
etPr
ince
s St
reet
Prin
ces
Stre
etPr
ince
s St
reet
Prin
ces
Stre
et
Shan
dwic
k Pl
ace
Shan
dwic
k Pl
ace
Shan
dwic
k Pl
ace
Shan
dwic
k Pl
ace
Shan
dwic
k Pl
ace
Shan
dwic
k Pl
ace
Shan
dwic
k Pl
ace
Shan
dwic
k Pl
ace
Shan
dwic
k Pl
ace
Haym
arke
tHa
ymar
ket
Haym
arke
tHa
ymar
ket
Haym
arke
tHa
ymar
ket
Haym
arke
tHa
ymar
ket
Haym
arke
t
Balg
reen
Balg
reen
Balg
reen
Balg
reen
Balg
reen
Balg
reen
Balg
reen
Balg
reen
Balg
reen
Saug
hton
Saug
hton
Saug
hton
Saug
hton
Saug
hton
Saug
hton
Saug
hton
Saug
hton
Saug
hton
Sout
h Gy
leSo
uth
Gyle
Sout
h Gy
leSo
uth
Gyle
Sout
h Gy
leSo
uth
Gyle
Sout
h Gy
leSo
uth
Gyle
Sout
h Gy
le
St A
ndre
w S
quar
eSt
And
rew
Squ
are
St A
ndre
w S
quar
eSt
And
rew
Squ
are
St A
ndre
w S
quar
eSt
And
rew
Squ
are
St A
ndre
w S
quar
eSt
And
rew
Squ
are
St A
ndre
w S
quar
e
Ocea
n Te
rmin
alOc
ean
Term
inal
Ocea
n Te
rmin
alOc
ean
Term
inal
Ocea
n Te
rmin
alOc
ean
Term
inal
Ocea
n Te
rmin
alOc
ean
Term
inal
Ocea
n Te
rmin
alN
ewha
ven
New
have
nN
ewha
ven
New
have
nN
ewha
ven
New
have
nN
ewha
ven
New
have
nN
ewha
ven
Edin
burg
h Pa
rk S
tatio
nEd
inbu
rgh
Park
Sta
tion
Edin
burg
h Pa
rk S
tatio
nEd
inbu
rgh
Park
Sta
tion
Edin
burg
h Pa
rk S
tatio
nEd
inbu
rgh
Park
Sta
tion
Edin
burg
h Pa
rk S
tatio
nEd
inbu
rgh
Park
Sta
tion
Edin
burg
h Pa
rk S
tatio
n
Goga
rbur
nGo
garb
urn
Goga
rbur
nGo
garb
urn
Goga
rbur
nGo
garb
urn
Goga
rbur
nGo
garb
urn
Goga
rbur
n Edin
burg
h Pa
rkEd
inbu
rgh
Park
Edin
burg
h Pa
rkEd
inbu
rgh
Park
Edin
burg
h Pa
rkEd
inbu
rgh
Park
Edin
burg
h Pa
rkEd
inbu
rgh
Park
Edin
burg
h Pa
rk
Ocea
n Dr
ive
Ocea
n Dr
ive
Ocea
n Dr
ive
Ocea
n Dr
ive
Ocea
n Dr
ive
Ocea
n Dr
ive
Ocea
n Dr
ive
Ocea
n Dr
ive
Ocea
n Dr
ive
Ingl
isto
n Pa
rk &
Rid
eIn
glis
ton
Park
& R
ide
Ingl
isto
n Pa
rk &
Rid
eIn
glis
ton
Park
& R
ide
Ingl
isto
n Pa
rk &
Rid
eIn
glis
ton
Park
& R
ide
Ingl
isto
n Pa
rk &
Rid
eIn
glis
ton
Park
& R
ide
Ingl
isto
n Pa
rk &
Rid
e
St A
ndre
w S
quar
eSt
And
rew
Squ
are
St A
ndre
w S
quar
eSt
And
rew
Squ
are
St A
ndre
w S
quar
eSt
And
rew
Squ
are
St A
ndre
w S
quar
eSt
And
rew
Squ
are
St A
ndre
w S
quar
e
Foot
of t
he W
alk
Foot
of t
he W
alk
Foot
of t
he W
alk
Foot
of t
he W
alk
Foot
of t
he W
alk
Foot
of t
he W
alk
Foot
of t
he W
alk
Foot
of t
he W
alk
Foot
of t
he W
alk
Balfo
ur S
treet
Balfo
ur S
treet
Balfo
ur S
treet
Balfo
ur S
treet
Balfo
ur S
treet
Balfo
ur S
treet
Balfo
ur S
treet
Balfo
ur S
treet
Balfo
ur S
treet
McD
onal
d Ro
adM
cDon
ald
Road
McD
onal
d Ro
adM
cDon
ald
Road
McD
onal
d Ro
adM
cDon
ald
Road
McD
onal
d Ro
adM
cDon
ald
Road
McD
onal
d Ro
ad
Sout
h Gy
leSo
uth
Gyle
Sout
h Gy
leSo
uth
Gyle
Sout
h Gy
leSo
uth
Gyle
Sout
h Gy
leSo
uth
Gyle
Sout
h Gy
le
Slat
efor
dSl
atef
ord
Slat
efor
dSl
atef
ord
Slat
efor
dSl
atef
ord
Slat
efor
dSl
atef
ord
Slat
efor
d
King
skno
we
King
skno
we
King
skno
we
King
skno
we
King
skno
we
King
skno
we
King
skno
we
King
skno
we
King
skno
we
Edin
burg
hEd
inbu
rgh
Edin
burg
hEd
inbu
rgh
Edin
burg
hEd
inbu
rgh
Edin
burg
hEd
inbu
rgh
Edin
burg
h
Mur
rayf
ield
Mur
rayf
ield
Mur
rayf
ield
Mur
rayf
ield
Mur
rayf
ield
Mur
rayf
ield
Mur
rayf
ield
Mur
rayf
ield
Mur
rayf
ield
Gyle
Gyle
Gyle
Gyle
Gyle
Gyle
Gyle
Gyle
Gyle
© © ©© ©© © ©©C
row
n C
op
yrig
ht R
eser
ved
Cro
wn
Co
pyr
ight
Res
erve
dC
row
n C
op
yrig
ht R
eser
ved
Cro
wn
Co
pyr
ight
Res
erve
dC
row
n C
op
yrig
ht R
eser
ved
Cro
wn
Co
pyr
ight
Res
erve
dC
row
n C
op
yrig
ht R
eser
ved
Cro
wn
Co
pyr
ight
Res
erve
dC
row
n C
op
yrig
ht R
eser
ved
Ord
nanc
e S
urve
yO
rdna
nce
Sur
vey
Ord
nanc
e S
urve
yO
rdna
nce
Sur
vey
Ord
nanc
e S
urve
yO
rdna
nce
Sur
vey
Ord
nanc
e S
urve
yO
rdna
nce
Sur
vey
Ord
nanc
e S
urve
y20
02 T
ele
Atla
s B
.v. '
s-H
erto
genb
osc
h. A
ll ri
ghts
res
erve
d.
2002
Tel
e A
tlas
B.v
. 's-
Her
toge
nbo
sch.
All
righ
ts r
eser
ved
.20
02 T
ele
Atla
s B
.v. '
s-H
erto
genb
osc
h. A
ll ri
ghts
res
erve
d.
2002
Tel
e A
tlas
B.v
. 's-
Her
toge
nbo
sch.
All
righ
ts r
eser
ved
.20
02 T
ele
Atla
s B
.v. '
s-H
erto
genb
osc
h. A
ll ri
ghts
res
erve
d.
2002
Tel
e A
tlas
B.v
. 's-
Her
toge
nbo
sch.
All
righ
ts r
eser
ved
.20
02 T
ele
Atla
s B
.v. '
s-H
erto
genb
osc
h. A
ll ri
ghts
res
erve
d.
2002
Tel
e A
tlas
B.v
. 's-
Her
toge
nbo
sch.
All
righ
ts r
eser
ved
.20
02 T
ele
Atla
s B
.v. '
s-H
erto
genb
osc
h. A
ll ri
ghts
res
erve
d.
2001
Cen
sus,
Out
put
Are
a B
oun
dar
ies.
2001
Cen
sus,
Out
put
Are
a B
oun
dar
ies.
2001
Cen
sus,
Out
put
Are
a B
oun
dar
ies.
2001
Cen
sus,
Out
put
Are
a B
oun
dar
ies.
2001
Cen
sus,
Out
put
Are
a B
oun
dar
ies.
2001
Cen
sus,
Out
put
Are
a B
oun
dar
ies.
2001
Cen
sus,
Out
put
Are
a B
oun
dar
ies.
2001
Cen
sus,
Out
put
Are
a B
oun
dar
ies.
2001
Cen
sus,
Out
put
Are
a B
oun
dar
ies.
Cro
wn
cop
yrig
ht m
ater
ial i
s re
pro
duc
ed
Cro
wn
cop
yrig
ht m
ater
ial i
s re
pro
duc
ed
Cro
wn
cop
yrig
ht m
ater
ial i
s re
pro
duc
ed
Cro
wn
cop
yrig
ht m
ater
ial i
s re
pro
duc
ed
Cro
wn
cop
yrig
ht m
ater
ial i
s re
pro
duc
ed
Cro
wn
cop
yrig
ht m
ater
ial i
s re
pro
duc
ed
Cro
wn
cop
yrig
ht m
ater
ial i
s re
pro
duc
ed
Cro
wn
cop
yrig
ht m
ater
ial i
s re
pro
duc
ed
Cro
wn
cop
yrig
ht m
ater
ial i
s re
pro
duc
ed
with
the
per
mis
sio
n o
f the
Co
ntro
ller
of H
MS
Ow
ith th
e p
erm
issi
on
of t
he C
ont
rolle
r o
f HM
SO
with
the
per
mis
sio
n o
f the
Co
ntro
ller
of H
MS
Ow
ith th
e p
erm
issi
on
of t
he C
ont
rolle
r o
f HM
SO
with
the
per
mis
sio
n o
f the
Co
ntro
ller
of H
MS
Ow
ith th
e p
erm
issi
on
of t
he C
ont
rolle
r o
f HM
SO
with
the
per
mis
sio
n o
f the
Co
ntro
ller
of H
MS
Ow
ith th
e p
erm
issi
on
of t
he C
ont
rolle
r o
f HM
SO
with
the
per
mis
sio
n o
f the
Co
ntro
ller
of H
MS
OS
cott
ish
Exe
cutiv
eS
cott
ish
Exe
cutiv
eS
cott
ish
Exe
cutiv
eS
cott
ish
Exe
cutiv
eS
cott
ish
Exe
cutiv
eS
cott
ish
Exe
cutiv
eS
cott
ish
Exe
cutiv
eS
cott
ish
Exe
cutiv
eS
cott
ish
Exe
cutiv
e stee
r da
vies
gle
ave
Edin
burg
h T
ram
STA
G 2
Appra
isal
Fig
ure
9.2
0:
Change in A
ccess
ibilit
y t
o F
oot
of
Leit
h W
alk
(P
hase
1a)
Cha
nges
in A
cces
sib
ility
to
Fo
ot o
f Lei
th W
alk
> 1
0 m
inut
es5
to 1
01
to
5N
o E
ffec
t-5
to -
1-1
0 to
-5
< -
10 m
inut
es
Ed
inb
urgh
Tra
m P
hase
1a
P:\
CG
G\G
IS\W
ork
\Pro
ject
s\69
00s\
6968
\Map
pin
g\M
apIn
fo\W
ork
spac
es\C
hang
eAcc
essi
bili
tyP
hase
1A_V
ario
usLo
catio
ns.w
or
Foo
t of L
eith
Wal
k (Z
one
76)

‡ ‡ ‡ ‡ ‡ ‡ ‡‡ ‡ ‡ ‡ ‡ ‡ ‡‡ ‡ ‡ ‡ ‡ ‡ ‡‡ ‡ ‡ ‡ ‡ ‡‡ ‡ ‡ ‡ ‡ ‡ ‡‡ ‡ ‡ ‡ ‡ ‡ ‡‡ ‡ ‡ ‡ ‡ ‡ ‡‡
è è è è è è èè è è è è è èè è è è è è èè è è è è èè è è è è è èè è è è è è èè è è è è è èè
è è è è è è èè è è è è è èè è è è è è èè è è è è èè è è è è è èè è è è è è èè è è è è è èèè è è è è è èè è è è è è èè è è è è è èè è è è è èè è è è è è èè è è è è è èè è è è è è èè
è è è è è è èè è è è è è èè è è è è è èè è è è è èè è è è è è èè è è è è è èè è è è è è èè
è è è è è è èè è è è è è èè è è è è è èè è è è è èè è è è è è èè è è è è è èè è è è è è èè
è è è è è è èè è è è è è èè è è è è è èè è è è è èè è è è è è èè è è è è è èè è è è è è èè
EDIN
BURG
H ED
INBU
RGH
EDIN
BURG
H ED
INBU
RGH
EDIN
BURG
H ED
INBU
RGH
EDIN
BURG
H ED
INBU
RGH
EDIN
BURG
H A
IRPO
RTA
IRPO
RTA
IRPO
RTA
IRPO
RTA
IRPO
RTA
IRPO
RTA
IRPO
RTA
IRPO
RTA
IRPO
RT
New
have
nN
ewha
ven
New
have
nN
ewha
ven
New
have
nN
ewha
ven
New
have
nN
ewha
ven
New
have
nOc
ean
Term
inal
Ocea
n Te
rmin
alOc
ean
Term
inal
Ocea
n Te
rmin
alOc
ean
Term
inal
Ocea
n Te
rmin
alOc
ean
Term
inal
Ocea
n Te
rmin
alOc
ean
Term
inal
Cons
titut
ion
Stre
etCo
nstit
utio
n St
reet
Cons
titut
ion
Stre
etCo
nstit
utio
n St
reet
Cons
titut
ion
Stre
etCo
nstit
utio
n St
reet
Cons
titut
ion
Stre
etCo
nstit
utio
n St
reet
Cons
titut
ion
Stre
etCo
nstit
utio
n St
reet
Cons
titut
ion
Stre
etCo
nstit
utio
n St
reet
Cons
titut
ion
Stre
etCo
nstit
utio
n St
reet
Cons
titut
ion
Stre
etCo
nstit
utio
n St
reet
Cons
titut
ion
Stre
etCo
nstit
utio
n St
reet
McD
onal
d Ro
adM
cDon
ald
Road
McD
onal
d Ro
adM
cDon
ald
Road
McD
onal
d Ro
adM
cDon
ald
Road
McD
onal
d Ro
adM
cDon
ald
Road
McD
onal
d Ro
ad
Pica
rdy
Plac
ePi
card
y Pl
ace
Pica
rdy
Plac
ePi
card
y Pl
ace
Pica
rdy
Plac
ePi
card
y Pl
ace
Pica
rdy
Plac
ePi
card
y Pl
ace
Pica
rdy
Plac
e
St A
ndre
w S
quar
eSt
And
rew
Squ
are
St A
ndre
w S
quar
eSt
And
rew
Squ
are
St A
ndre
w S
quar
eSt
And
rew
Squ
are
St A
ndre
w S
quar
eSt
And
rew
Squ
are
St A
ndre
w S
quar
e
Prin
ces
Stre
etPr
ince
s St
reet
Prin
ces
Stre
etPr
ince
s St
reet
Prin
ces
Stre
etPr
ince
s St
reet
Prin
ces
Stre
etPr
ince
s St
reet
Prin
ces
Stre
et
Shan
dwic
k Pl
ace
Shan
dwic
k Pl
ace
Shan
dwic
k Pl
ace
Shan
dwic
k Pl
ace
Shan
dwic
k Pl
ace
Shan
dwic
k Pl
ace
Shan
dwic
k Pl
ace
Shan
dwic
k Pl
ace
Shan
dwic
k Pl
ace
Haym
arke
tHa
ymar
ket
Haym
arke
tHa
ymar
ket
Haym
arke
tHa
ymar
ket
Haym
arke
tHa
ymar
ket
Haym
arke
t
Balg
reen
Balg
reen
Balg
reen
Balg
reen
Balg
reen
Balg
reen
Balg
reen
Balg
reen
Balg
reen
Saug
hton
Saug
hton
Saug
hton
Saug
hton
Saug
hton
Saug
hton
Saug
hton
Saug
hton
Saug
hton
Sout
h Gy
leSo
uth
Gyle
Sout
h Gy
leSo
uth
Gyle
Sout
h Gy
leSo
uth
Gyle
Sout
h Gy
leSo
uth
Gyle
Sout
h Gy
leEd
inbu
rgh
Park
Sta
tion
Edin
burg
h Pa
rk S
tatio
nEd
inbu
rgh
Park
Sta
tion
Edin
burg
h Pa
rk S
tatio
nEd
inbu
rgh
Park
Sta
tion
Edin
burg
h Pa
rk S
tatio
nEd
inbu
rgh
Park
Sta
tion
Edin
burg
h Pa
rk S
tatio
nEd
inbu
rgh
Park
Sta
tion
Goga
rbur
nGo
garb
urn
Goga
rbur
nGo
garb
urn
Goga
rbur
nGo
garb
urn
Goga
rbur
nGo
garb
urn
Goga
rbur
n
Edin
burg
h Ai
rpor
tEd
inbu
rgh
Airp
ort
Edin
burg
h Ai
rpor
tEd
inbu
rgh
Airp
ort
Edin
burg
h Ai
rpor
tEd
inbu
rgh
Airp
ort
Edin
burg
h Ai
rpor
tEd
inbu
rgh
Airp
ort
Edin
burg
h Ai
rpor
t
Edin
burg
h Pa
rkEd
inbu
rgh
Park
Edin
burg
h Pa
rkEd
inbu
rgh
Park
Edin
burg
h Pa
rkEd
inbu
rgh
Park
Edin
burg
h Pa
rkEd
inbu
rgh
Park
Edin
burg
h Pa
rk
Ocea
n Dr
ive
Ocea
n Dr
ive
Ocea
n Dr
ive
Ocea
n Dr
ive
Ocea
n Dr
ive
Ocea
n Dr
ive
Ocea
n Dr
ive
Ocea
n Dr
ive
Ocea
n Dr
ive
Ingl
isto
n Pa
rk &
Rid
eIn
glis
ton
Park
& R
ide
Ingl
isto
n Pa
rk &
Rid
eIn
glis
ton
Park
& R
ide
Ingl
isto
n Pa
rk &
Rid
eIn
glis
ton
Park
& R
ide
Ingl
isto
n Pa
rk &
Rid
eIn
glis
ton
Park
& R
ide
Ingl
isto
n Pa
rk &
Rid
e
St A
ndre
w S
quar
eSt
And
rew
Squ
are
St A
ndre
w S
quar
eSt
And
rew
Squ
are
St A
ndre
w S
quar
eSt
And
rew
Squ
are
St A
ndre
w S
quar
eSt
And
rew
Squ
are
St A
ndre
w S
quar
e
Foot
of t
he W
alk
Foot
of t
he W
alk
Foot
of t
he W
alk
Foot
of t
he W
alk
Foot
of t
he W
alk
Foot
of t
he W
alk
Foot
of t
he W
alk
Foot
of t
he W
alk
Foot
of t
he W
alk
Balfo
ur S
treet
Balfo
ur S
treet
Balfo
ur S
treet
Balfo
ur S
treet
Balfo
ur S
treet
Balfo
ur S
treet
Balfo
ur S
treet
Balfo
ur S
treet
Balfo
ur S
treet
Sout
h Gy
leSo
uth
Gyle
Sout
h Gy
leSo
uth
Gyle
Sout
h Gy
leSo
uth
Gyle
Sout
h Gy
leSo
uth
Gyle
Sout
h Gy
le
Slat
efor
dSl
atef
ord
Slat
efor
dSl
atef
ord
Slat
efor
dSl
atef
ord
Slat
efor
dSl
atef
ord
Slat
efor
d
King
skno
we
King
skno
we
King
skno
we
King
skno
we
King
skno
we
King
skno
we
King
skno
we
King
skno
we
King
skno
we
Edin
burg
hEd
inbu
rgh
Edin
burg
hEd
inbu
rgh
Edin
burg
hEd
inbu
rgh
Edin
burg
hEd
inbu
rgh
Edin
burg
h
Mur
rayf
ield
Mur
rayf
ield
Mur
rayf
ield
Mur
rayf
ield
Mur
rayf
ield
Mur
rayf
ield
Mur
rayf
ield
Mur
rayf
ield
Mur
rayf
ield
Gyle
Gyle
Gyle
Gyle
Gyle
Gyle
Gyle
Gyle
Gyle
© © ©© ©© © ©©C
row
n C
op
yrig
ht R
eser
ved
Cro
wn
Co
pyr
ight
Res
erve
dC
row
n C
op
yrig
ht R
eser
ved
Cro
wn
Co
pyr
ight
Res
erve
dC
row
n C
op
yrig
ht R
eser
ved
Cro
wn
Co
pyr
ight
Res
erve
dC
row
n C
op
yrig
ht R
eser
ved
Cro
wn
Co
pyr
ight
Res
erve
dC
row
n C
op
yrig
ht R
eser
ved
Ord
nanc
e S
urve
yO
rdna
nce
Sur
vey
Ord
nanc
e S
urve
yO
rdna
nce
Sur
vey
Ord
nanc
e S
urve
yO
rdna
nce
Sur
vey
Ord
nanc
e S
urve
yO
rdna
nce
Sur
vey
Ord
nanc
e S
urve
y20
02 T
ele
Atla
s B
.v. '
s-H
erto
genb
osc
h. A
ll ri
ghts
res
erve
d.
2002
Tel
e A
tlas
B.v
. 's-
Her
toge
nbo
sch.
All
righ
ts r
eser
ved
.20
02 T
ele
Atla
s B
.v. '
s-H
erto
genb
osc
h. A
ll ri
ghts
res
erve
d.
2002
Tel
e A
tlas
B.v
. 's-
Her
toge
nbo
sch.
All
righ
ts r
eser
ved
.20
02 T
ele
Atla
s B
.v. '
s-H
erto
genb
osc
h. A
ll ri
ghts
res
erve
d.
2002
Tel
e A
tlas
B.v
. 's-
Her
toge
nbo
sch.
All
righ
ts r
eser
ved
.20
02 T
ele
Atla
s B
.v. '
s-H
erto
genb
osc
h. A
ll ri
ghts
res
erve
d.
2002
Tel
e A
tlas
B.v
. 's-
Her
toge
nbo
sch.
All
righ
ts r
eser
ved
.20
02 T
ele
Atla
s B
.v. '
s-H
erto
genb
osc
h. A
ll ri
ghts
res
erve
d.
2001
Cen
sus,
Out
put
Are
a B
oun
dar
ies.
2001
Cen
sus,
Out
put
Are
a B
oun
dar
ies.
2001
Cen
sus,
Out
put
Are
a B
oun
dar
ies.
2001
Cen
sus,
Out
put
Are
a B
oun
dar
ies.
2001
Cen
sus,
Out
put
Are
a B
oun
dar
ies.
2001
Cen
sus,
Out
put
Are
a B
oun
dar
ies.
2001
Cen
sus,
Out
put
Are
a B
oun
dar
ies.
2001
Cen
sus,
Out
put
Are
a B
oun
dar
ies.
2001
Cen
sus,
Out
put
Are
a B
oun
dar
ies.
Cro
wn
cop
yrig
ht m
ater
ial i
s re
pro
duc
ed
Cro
wn
cop
yrig
ht m
ater
ial i
s re
pro
duc
ed
Cro
wn
cop
yrig
ht m
ater
ial i
s re
pro
duc
ed
Cro
wn
cop
yrig
ht m
ater
ial i
s re
pro
duc
ed
Cro
wn
cop
yrig
ht m
ater
ial i
s re
pro
duc
ed
Cro
wn
cop
yrig
ht m
ater
ial i
s re
pro
duc
ed
Cro
wn
cop
yrig
ht m
ater
ial i
s re
pro
duc
ed
Cro
wn
cop
yrig
ht m
ater
ial i
s re
pro
duc
ed
Cro
wn
cop
yrig
ht m
ater
ial i
s re
pro
duc
ed
with
the
per
mis
sio
n o
f the
Co
ntro
ller
of H
MS
Ow
ith th
e p
erm
issi
on
of t
he C
ont
rolle
r o
f HM
SO
with
the
per
mis
sio
n o
f the
Co
ntro
ller
of H
MS
Ow
ith th
e p
erm
issi
on
of t
he C
ont
rolle
r o
f HM
SO
with
the
per
mis
sio
n o
f the
Co
ntro
ller
of H
MS
Ow
ith th
e p
erm
issi
on
of t
he C
ont
rolle
r o
f HM
SO
with
the
per
mis
sio
n o
f the
Co
ntro
ller
of H
MS
Ow
ith th
e p
erm
issi
on
of t
he C
ont
rolle
r o
f HM
SO
with
the
per
mis
sio
n o
f the
Co
ntro
ller
of H
MS
OS
cott
ish
Exe
cutiv
eS
cott
ish
Exe
cutiv
eS
cott
ish
Exe
cutiv
eS
cott
ish
Exe
cutiv
eS
cott
ish
Exe
cutiv
eS
cott
ish
Exe
cutiv
eS
cott
ish
Exe
cutiv
eS
cott
ish
Exe
cutiv
eS
cott
ish
Exe
cutiv
e stee
r da
vies
gle
ave
Edin
burg
h T
ram
STA
G 2
Appra
isal
Fig
ure
9.2
1:
Change in A
ccess
ibilit
y t
o C
rew
e T
oll (
Phase
1a)
Cha
nges
in A
cces
sib
ility
to
Cre
we
To
ll
> 1
0 m
inut
es5
to 1
01
to
5N
o E
ffec
t-5
to -
1-1
0 to
-5
< -
10 m
inut
es
Ed
inb
urgh
Tra
m P
hase
1a
P:\
CG
G\G
IS\W
ork
\Pro
ject
s\69
00s\
6968
\Map
pin
g\M
apIn
fo\W
ork
spac
es\C
hang
eAcc
essi
bili
tyP
hase
1A_V
ario
usLo
catio
ns.w
or
Cre
we
To
ll (Z
one
107
)

‡ ‡ ‡ ‡ ‡ ‡ ‡‡ ‡ ‡ ‡ ‡ ‡ ‡‡ ‡ ‡ ‡ ‡ ‡ ‡‡ ‡ ‡ ‡ ‡ ‡‡ ‡ ‡ ‡ ‡ ‡ ‡‡ ‡ ‡ ‡ ‡ ‡ ‡‡ ‡ ‡ ‡ ‡ ‡ ‡‡
è è è è è è èè è è è è è èè è è è è è èè è è è è èè è è è è è èè è è è è è èè è è è è è èè
è è è è è è èè è è è è è èè è è è è è èè è è è è èè è è è è è èè è è è è è èè è è è è è èèè è è è è è èè è è è è è èè è è è è è èè è è è è èè è è è è è èè è è è è è èè è è è è è èè
è è è è è è èè è è è è è èè è è è è è èè è è è è èè è è è è è èè è è è è è èè è è è è è èè
è è è è è è èè è è è è è èè è è è è è èè è è è è èè è è è è è èè è è è è è èè è è è è è èè
è è è è è è èè è è è è è èè è è è è è èè è è è è èè è è è è è èè è è è è è èè è è è è è èè
EDIN
BURG
H ED
INBU
RGH
EDIN
BURG
H ED
INBU
RGH
EDIN
BURG
H ED
INBU
RGH
EDIN
BURG
H ED
INBU
RGH
EDIN
BURG
H A
IRPO
RTA
IRPO
RTA
IRPO
RTA
IRPO
RTA
IRPO
RTA
IRPO
RTA
IRPO
RTA
IRPO
RTA
IRPO
RT
Ocea
n Te
rmin
alOc
ean
Term
inal
Ocea
n Te
rmin
alOc
ean
Term
inal
Ocea
n Te
rmin
alOc
ean
Term
inal
Ocea
n Te
rmin
alOc
ean
Term
inal
Ocea
n Te
rmin
alN
ewha
ven
New
have
nN
ewha
ven
New
have
nN
ewha
ven
New
have
nN
ewha
ven
New
have
nN
ewha
ven
Cons
titut
ion
Stre
etCo
nstit
utio
n St
reet
Cons
titut
ion
Stre
etCo
nstit
utio
n St
reet
Cons
titut
ion
Stre
etCo
nstit
utio
n St
reet
Cons
titut
ion
Stre
etCo
nstit
utio
n St
reet
Cons
titut
ion
Stre
etCo
nstit
utio
n St
reet
Cons
titut
ion
Stre
etCo
nstit
utio
n St
reet
Cons
titut
ion
Stre
etCo
nstit
utio
n St
reet
Cons
titut
ion
Stre
etCo
nstit
utio
n St
reet
Cons
titut
ion
Stre
etCo
nstit
utio
n St
reet
Pica
rdy
Plac
ePi
card
y Pl
ace
Pica
rdy
Plac
ePi
card
y Pl
ace
Pica
rdy
Plac
ePi
card
y Pl
ace
Pica
rdy
Plac
ePi
card
y Pl
ace
Pica
rdy
Plac
e
St A
ndre
w S
quar
eSt
And
rew
Squ
are
St A
ndre
w S
quar
eSt
And
rew
Squ
are
St A
ndre
w S
quar
eSt
And
rew
Squ
are
St A
ndre
w S
quar
eSt
And
rew
Squ
are
St A
ndre
w S
quar
ePr
ince
s St
reet
Prin
ces
Stre
etPr
ince
s St
reet
Prin
ces
Stre
etPr
ince
s St
reet
Prin
ces
Stre
etPr
ince
s St
reet
Prin
ces
Stre
etPr
ince
s St
reet
Haym
arke
tHa
ymar
ket
Haym
arke
tHa
ymar
ket
Haym
arke
tHa
ymar
ket
Haym
arke
tHa
ymar
ket
Haym
arke
t
Balg
reen
Balg
reen
Balg
reen
Balg
reen
Balg
reen
Balg
reen
Balg
reen
Balg
reen
Balg
reen
Saug
hton
Saug
hton
Saug
hton
Saug
hton
Saug
hton
Saug
hton
Saug
hton
Saug
hton
Saug
hton
Sout
h Gy
leSo
uth
Gyle
Sout
h Gy
leSo
uth
Gyle
Sout
h Gy
leSo
uth
Gyle
Sout
h Gy
leSo
uth
Gyle
Sout
h Gy
leEd
inbu
rgh
Park
Sta
tion
Edin
burg
h Pa
rk S
tatio
nEd
inbu
rgh
Park
Sta
tion
Edin
burg
h Pa
rk S
tatio
nEd
inbu
rgh
Park
Sta
tion
Edin
burg
h Pa
rk S
tatio
nEd
inbu
rgh
Park
Sta
tion
Edin
burg
h Pa
rk S
tatio
nEd
inbu
rgh
Park
Sta
tion
Goga
rbur
nGo
garb
urn
Goga
rbur
nGo
garb
urn
Goga
rbur
nGo
garb
urn
Goga
rbur
nGo
garb
urn
Goga
rbur
n
Edin
burg
h Ai
rpor
tEd
inbu
rgh
Airp
ort
Edin
burg
h Ai
rpor
tEd
inbu
rgh
Airp
ort
Edin
burg
h Ai
rpor
tEd
inbu
rgh
Airp
ort
Edin
burg
h Ai
rpor
tEd
inbu
rgh
Airp
ort
Edin
burg
h Ai
rpor
t
Edin
burg
h Pa
rkEd
inbu
rgh
Park
Edin
burg
h Pa
rkEd
inbu
rgh
Park
Edin
burg
h Pa
rkEd
inbu
rgh
Park
Edin
burg
h Pa
rkEd
inbu
rgh
Park
Edin
burg
h Pa
rk
Ocea
n Dr
ive
Ocea
n Dr
ive
Ocea
n Dr
ive
Ocea
n Dr
ive
Ocea
n Dr
ive
Ocea
n Dr
ive
Ocea
n Dr
ive
Ocea
n Dr
ive
Ocea
n Dr
ive
Ingl
isto
n Pa
rk &
Rid
eIn
glis
ton
Park
& R
ide
Ingl
isto
n Pa
rk &
Rid
eIn
glis
ton
Park
& R
ide
Ingl
isto
n Pa
rk &
Rid
eIn
glis
ton
Park
& R
ide
Ingl
isto
n Pa
rk &
Rid
eIn
glis
ton
Park
& R
ide
Ingl
isto
n Pa
rk &
Rid
e
Shan
dwic
k Pl
ace
Shan
dwic
k Pl
ace
Shan
dwic
k Pl
ace
Shan
dwic
k Pl
ace
Shan
dwic
k Pl
ace
Shan
dwic
k Pl
ace
Shan
dwic
k Pl
ace
Shan
dwic
k Pl
ace
Shan
dwic
k Pl
ace
St A
ndre
w S
quar
eSt
And
rew
Squ
are
St A
ndre
w S
quar
eSt
And
rew
Squ
are
St A
ndre
w S
quar
eSt
And
rew
Squ
are
St A
ndre
w S
quar
eSt
And
rew
Squ
are
St A
ndre
w S
quar
e
Foot
of t
he W
alk
Foot
of t
he W
alk
Foot
of t
he W
alk
Foot
of t
he W
alk
Foot
of t
he W
alk
Foot
of t
he W
alk
Foot
of t
he W
alk
Foot
of t
he W
alk
Foot
of t
he W
alk
Balfo
ur S
treet
Balfo
ur S
treet
Balfo
ur S
treet
Balfo
ur S
treet
Balfo
ur S
treet
Balfo
ur S
treet
Balfo
ur S
treet
Balfo
ur S
treet
Balfo
ur S
treet
McD
onal
d Ro
adM
cDon
ald
Road
McD
onal
d Ro
adM
cDon
ald
Road
McD
onal
d Ro
adM
cDon
ald
Road
McD
onal
d Ro
adM
cDon
ald
Road
McD
onal
d Ro
ad
Sout
h Gy
leSo
uth
Gyle
Sout
h Gy
leSo
uth
Gyle
Sout
h Gy
leSo
uth
Gyle
Sout
h Gy
leSo
uth
Gyle
Sout
h Gy
le
Slat
efor
dSl
atef
ord
Slat
efor
dSl
atef
ord
Slat
efor
dSl
atef
ord
Slat
efor
dSl
atef
ord
Slat
efor
d
King
skno
we
King
skno
we
King
skno
we
King
skno
we
King
skno
we
King
skno
we
King
skno
we
King
skno
we
King
skno
we
Edin
burg
hEd
inbu
rgh
Edin
burg
hEd
inbu
rgh
Edin
burg
hEd
inbu
rgh
Edin
burg
hEd
inbu
rgh
Edin
burg
h
Mur
rayf
ield
Mur
rayf
ield
Mur
rayf
ield
Mur
rayf
ield
Mur
rayf
ield
Mur
rayf
ield
Mur
rayf
ield
Mur
rayf
ield
Mur
rayf
ield
Gyle
Gyle
Gyle
Gyle
Gyle
Gyle
Gyle
Gyle
Gyle
© © ©© ©© © ©©C
row
n C
op
yrig
ht R
eser
ved
Cro
wn
Co
pyr
ight
Res
erve
dC
row
n C
op
yrig
ht R
eser
ved
Cro
wn
Co
pyr
ight
Res
erve
dC
row
n C
op
yrig
ht R
eser
ved
Cro
wn
Co
pyr
ight
Res
erve
dC
row
n C
op
yrig
ht R
eser
ved
Cro
wn
Co
pyr
ight
Res
erve
dC
row
n C
op
yrig
ht R
eser
ved
Ord
nanc
e S
urve
yO
rdna
nce
Sur
vey
Ord
nanc
e S
urve
yO
rdna
nce
Sur
vey
Ord
nanc
e S
urve
yO
rdna
nce
Sur
vey
Ord
nanc
e S
urve
yO
rdna
nce
Sur
vey
Ord
nanc
e S
urve
y20
02 T
ele
Atla
s B
.v. '
s-H
erto
genb
osc
h. A
ll ri
ghts
res
erve
d.
2002
Tel
e A
tlas
B.v
. 's-
Her
toge
nbo
sch.
All
righ
ts r
eser
ved
.20
02 T
ele
Atla
s B
.v. '
s-H
erto
genb
osc
h. A
ll ri
ghts
res
erve
d.
2002
Tel
e A
tlas
B.v
. 's-
Her
toge
nbo
sch.
All
righ
ts r
eser
ved
.20
02 T
ele
Atla
s B
.v. '
s-H
erto
genb
osc
h. A
ll ri
ghts
res
erve
d.
2002
Tel
e A
tlas
B.v
. 's-
Her
toge
nbo
sch.
All
righ
ts r
eser
ved
.20
02 T
ele
Atla
s B
.v. '
s-H
erto
genb
osc
h. A
ll ri
ghts
res
erve
d.
2002
Tel
e A
tlas
B.v
. 's-
Her
toge
nbo
sch.
All
righ
ts r
eser
ved
.20
02 T
ele
Atla
s B
.v. '
s-H
erto
genb
osc
h. A
ll ri
ghts
res
erve
d.
2001
Cen
sus,
Out
put
Are
a B
oun
dar
ies.
2001
Cen
sus,
Out
put
Are
a B
oun
dar
ies.
2001
Cen
sus,
Out
put
Are
a B
oun
dar
ies.
2001
Cen
sus,
Out
put
Are
a B
oun
dar
ies.
2001
Cen
sus,
Out
put
Are
a B
oun
dar
ies.
2001
Cen
sus,
Out
put
Are
a B
oun
dar
ies.
2001
Cen
sus,
Out
put
Are
a B
oun
dar
ies.
2001
Cen
sus,
Out
put
Are
a B
oun
dar
ies.
2001
Cen
sus,
Out
put
Are
a B
oun
dar
ies.
Cro
wn
cop
yrig
ht m
ater
ial i
s re
pro
duc
ed
Cro
wn
cop
yrig
ht m
ater
ial i
s re
pro
duc
ed
Cro
wn
cop
yrig
ht m
ater
ial i
s re
pro
duc
ed
Cro
wn
cop
yrig
ht m
ater
ial i
s re
pro
duc
ed
Cro
wn
cop
yrig
ht m
ater
ial i
s re
pro
duc
ed
Cro
wn
cop
yrig
ht m
ater
ial i
s re
pro
duc
ed
Cro
wn
cop
yrig
ht m
ater
ial i
s re
pro
duc
ed
Cro
wn
cop
yrig
ht m
ater
ial i
s re
pro
duc
ed
Cro
wn
cop
yrig
ht m
ater
ial i
s re
pro
duc
ed
with
the
per
mis
sio
n o
f the
Co
ntro
ller
of H
MS
Ow
ith th
e p
erm
issi
on
of t
he C
ont
rolle
r o
f HM
SO
with
the
per
mis
sio
n o
f the
Co
ntro
ller
of H
MS
Ow
ith th
e p
erm
issi
on
of t
he C
ont
rolle
r o
f HM
SO
with
the
per
mis
sio
n o
f the
Co
ntro
ller
of H
MS
Ow
ith th
e p
erm
issi
on
of t
he C
ont
rolle
r o
f HM
SO
with
the
per
mis
sio
n o
f the
Co
ntro
ller
of H
MS
Ow
ith th
e p
erm
issi
on
of t
he C
ont
rolle
r o
f HM
SO
with
the
per
mis
sio
n o
f the
Co
ntro
ller
of H
MS
OS
cott
ish
Exe
cutiv
eS
cott
ish
Exe
cutiv
eS
cott
ish
Exe
cutiv
eS
cott
ish
Exe
cutiv
eS
cott
ish
Exe
cutiv
eS
cott
ish
Exe
cutiv
eS
cott
ish
Exe
cutiv
eS
cott
ish
Exe
cutiv
eS
cott
ish
Exe
cutiv
e stee
r da
vies
gle
ave
Edin
burg
h T
ram
STA
G 2
Appra
isal
Fig
ure
9.2
2:
Change in A
ccess
ibilit
y t
o O
cean T
erm
inal (P
hase
1a)
Cha
nges
in A
cces
sib
ility
to
Oce
an T
erm
inal
> 1
0 m
inut
es5
to 1
01
to
5N
o E
ffec
t-5
to -
1-1
0 to
-5
< -
10 m
inut
es
Ed
inb
urgh
Tra
m P
hase
1a
P:\
CG
G\G
IS\W
ork
\Pro
ject
s\69
00s\
6968
\Map
pin
g\M
apIn
fo\W
ork
spac
es\C
hang
eAcc
essi
bili
tyP
hase
1A_V
ario
usLo
catio
ns.w
or
Oce
an T
erm
inal
(Zo
ne 1
14)

‡ ‡ ‡ ‡ ‡ ‡ ‡‡ ‡ ‡ ‡ ‡ ‡ ‡‡ ‡ ‡ ‡ ‡ ‡ ‡‡ ‡ ‡ ‡ ‡ ‡‡ ‡ ‡ ‡ ‡ ‡ ‡‡ ‡ ‡ ‡ ‡ ‡ ‡‡ ‡ ‡ ‡ ‡ ‡ ‡‡
è è è è è è èè è è è è è èè è è è è è èè è è è è èè è è è è è èè è è è è è èè è è è è è èè
è è è è è è èè è è è è è èè è è è è è èè è è è è èè è è è è è èè è è è è è èè è è è è è èèè è è è è è èè è è è è è èè è è è è è èè è è è è èè è è è è è èè è è è è è èè è è è è è èè
è è è è è è èè è è è è è èè è è è è è èè è è è è èè è è è è è èè è è è è è èè è è è è è èè
è è è è è è èè è è è è è èè è è è è è èè è è è è èè è è è è è èè è è è è è èè è è è è è èè
è è è è è è èè è è è è è èè è è è è è èè è è è è èè è è è è è èè è è è è è èè è è è è è èè
EDIN
BURG
H ED
INBU
RGH
EDIN
BURG
H ED
INBU
RGH
EDIN
BURG
H ED
INBU
RGH
EDIN
BURG
H ED
INBU
RGH
EDIN
BURG
H A
IRPO
RTA
IRPO
RTA
IRPO
RTA
IRPO
RTA
IRPO
RTA
IRPO
RTA
IRPO
RTA
IRPO
RTA
IRPO
RT
Ocea
n Te
rmin
alOc
ean
Term
inal
Ocea
n Te
rmin
alOc
ean
Term
inal
Ocea
n Te
rmin
alOc
ean
Term
inal
Ocea
n Te
rmin
alOc
ean
Term
inal
Ocea
n Te
rmin
alN
ewha
ven
New
have
nN
ewha
ven
New
have
nN
ewha
ven
New
have
nN
ewha
ven
New
have
nN
ewha
ven
Cons
titut
ion
Stre
etCo
nstit
utio
n St
reet
Cons
titut
ion
Stre
etCo
nstit
utio
n St
reet
Cons
titut
ion
Stre
etCo
nstit
utio
n St
reet
Cons
titut
ion
Stre
etCo
nstit
utio
n St
reet
Cons
titut
ion
Stre
etCo
nstit
utio
n St
reet
Cons
titut
ion
Stre
etCo
nstit
utio
n St
reet
Cons
titut
ion
Stre
etCo
nstit
utio
n St
reet
Cons
titut
ion
Stre
etCo
nstit
utio
n St
reet
Cons
titut
ion
Stre
etCo
nstit
utio
n St
reet
Pica
rdy
Plac
ePi
card
y Pl
ace
Pica
rdy
Plac
ePi
card
y Pl
ace
Pica
rdy
Plac
ePi
card
y Pl
ace
Pica
rdy
Plac
ePi
card
y Pl
ace
Pica
rdy
Plac
e
St A
ndre
w S
quar
eSt
And
rew
Squ
are
St A
ndre
w S
quar
eSt
And
rew
Squ
are
St A
ndre
w S
quar
eSt
And
rew
Squ
are
St A
ndre
w S
quar
eSt
And
rew
Squ
are
St A
ndre
w S
quar
ePr
ince
s St
reet
Prin
ces
Stre
etPr
ince
s St
reet
Prin
ces
Stre
etPr
ince
s St
reet
Prin
ces
Stre
etPr
ince
s St
reet
Prin
ces
Stre
etPr
ince
s St
reet
Haym
arke
tHa
ymar
ket
Haym
arke
tHa
ymar
ket
Haym
arke
tHa
ymar
ket
Haym
arke
tHa
ymar
ket
Haym
arke
t
Balg
reen
Balg
reen
Balg
reen
Balg
reen
Balg
reen
Balg
reen
Balg
reen
Balg
reen
Balg
reen
Saug
hton
Saug
hton
Saug
hton
Saug
hton
Saug
hton
Saug
hton
Saug
hton
Saug
hton
Saug
hton
Sout
h Gy
leSo
uth
Gyle
Sout
h Gy
leSo
uth
Gyle
Sout
h Gy
leSo
uth
Gyle
Sout
h Gy
leSo
uth
Gyle
Sout
h Gy
leEd
inbu
rgh
Park
Sta
tion
Edin
burg
h Pa
rk S
tatio
nEd
inbu
rgh
Park
Sta
tion
Edin
burg
h Pa
rk S
tatio
nEd
inbu
rgh
Park
Sta
tion
Edin
burg
h Pa
rk S
tatio
nEd
inbu
rgh
Park
Sta
tion
Edin
burg
h Pa
rk S
tatio
nEd
inbu
rgh
Park
Sta
tion
Goga
rbur
nGo
garb
urn
Goga
rbur
nGo
garb
urn
Goga
rbur
nGo
garb
urn
Goga
rbur
nGo
garb
urn
Goga
rbur
n
Edin
burg
h Ai
rpor
tEd
inbu
rgh
Airp
ort
Edin
burg
h Ai
rpor
tEd
inbu
rgh
Airp
ort
Edin
burg
h Ai
rpor
tEd
inbu
rgh
Airp
ort
Edin
burg
h Ai
rpor
tEd
inbu
rgh
Airp
ort
Edin
burg
h Ai
rpor
t
Edin
burg
h Pa
rkEd
inbu
rgh
Park
Edin
burg
h Pa
rkEd
inbu
rgh
Park
Edin
burg
h Pa
rkEd
inbu
rgh
Park
Edin
burg
h Pa
rkEd
inbu
rgh
Park
Edin
burg
h Pa
rk
Ocea
n Dr
ive
Ocea
n Dr
ive
Ocea
n Dr
ive
Ocea
n Dr
ive
Ocea
n Dr
ive
Ocea
n Dr
ive
Ocea
n Dr
ive
Ocea
n Dr
ive
Ocea
n Dr
ive
Ingl
isto
n Pa
rk &
Rid
eIn
glis
ton
Park
& R
ide
Ingl
isto
n Pa
rk &
Rid
eIn
glis
ton
Park
& R
ide
Ingl
isto
n Pa
rk &
Rid
eIn
glis
ton
Park
& R
ide
Ingl
isto
n Pa
rk &
Rid
eIn
glis
ton
Park
& R
ide
Ingl
isto
n Pa
rk &
Rid
e
Shan
dwic
k Pl
ace
Shan
dwic
k Pl
ace
Shan
dwic
k Pl
ace
Shan
dwic
k Pl
ace
Shan
dwic
k Pl
ace
Shan
dwic
k Pl
ace
Shan
dwic
k Pl
ace
Shan
dwic
k Pl
ace
Shan
dwic
k Pl
ace
St A
ndre
w S
quar
eSt
And
rew
Squ
are
St A
ndre
w S
quar
eSt
And
rew
Squ
are
St A
ndre
w S
quar
eSt
And
rew
Squ
are
St A
ndre
w S
quar
eSt
And
rew
Squ
are
St A
ndre
w S
quar
e
Foot
of t
he W
alk
Foot
of t
he W
alk
Foot
of t
he W
alk
Foot
of t
he W
alk
Foot
of t
he W
alk
Foot
of t
he W
alk
Foot
of t
he W
alk
Foot
of t
he W
alk
Foot
of t
he W
alk
Balfo
ur S
treet
Balfo
ur S
treet
Balfo
ur S
treet
Balfo
ur S
treet
Balfo
ur S
treet
Balfo
ur S
treet
Balfo
ur S
treet
Balfo
ur S
treet
Balfo
ur S
treet
McD
onal
d Ro
adM
cDon
ald
Road
McD
onal
d Ro
adM
cDon
ald
Road
McD
onal
d Ro
adM
cDon
ald
Road
McD
onal
d Ro
adM
cDon
ald
Road
McD
onal
d Ro
ad
Sout
h Gy
leSo
uth
Gyle
Sout
h Gy
leSo
uth
Gyle
Sout
h Gy
leSo
uth
Gyle
Sout
h Gy
leSo
uth
Gyle
Sout
h Gy
le
Slat
efor
dSl
atef
ord
Slat
efor
dSl
atef
ord
Slat
efor
dSl
atef
ord
Slat
efor
dSl
atef
ord
Slat
efor
d
King
skno
we
King
skno
we
King
skno
we
King
skno
we
King
skno
we
King
skno
we
King
skno
we
King
skno
we
King
skno
we
Edin
burg
hEd
inbu
rgh
Edin
burg
hEd
inbu
rgh
Edin
burg
hEd
inbu
rgh
Edin
burg
hEd
inbu
rgh
Edin
burg
h
Mur
rayf
ield
Mur
rayf
ield
Mur
rayf
ield
Mur
rayf
ield
Mur
rayf
ield
Mur
rayf
ield
Mur
rayf
ield
Mur
rayf
ield
Mur
rayf
ield
Gyle
Gyle
Gyle
Gyle
Gyle
Gyle
Gyle
Gyle
Gyle
© © ©© ©© © ©©C
row
n C
op
yrig
ht R
eser
ved
Cro
wn
Co
pyr
ight
Res
erve
dC
row
n C
op
yrig
ht R
eser
ved
Cro
wn
Co
pyr
ight
Res
erve
dC
row
n C
op
yrig
ht R
eser
ved
Cro
wn
Co
pyr
ight
Res
erve
dC
row
n C
op
yrig
ht R
eser
ved
Cro
wn
Co
pyr
ight
Res
erve
dC
row
n C
op
yrig
ht R
eser
ved
Ord
nanc
e S
urve
yO
rdna
nce
Sur
vey
Ord
nanc
e S
urve
yO
rdna
nce
Sur
vey
Ord
nanc
e S
urve
yO
rdna
nce
Sur
vey
Ord
nanc
e S
urve
yO
rdna
nce
Sur
vey
Ord
nanc
e S
urve
y20
02 T
ele
Atla
s B
.v. '
s-H
erto
genb
osc
h. A
ll ri
ghts
res
erve
d.
2002
Tel
e A
tlas
B.v
. 's-
Her
toge
nbo
sch.
All
righ
ts r
eser
ved
.20
02 T
ele
Atla
s B
.v. '
s-H
erto
genb
osc
h. A
ll ri
ghts
res
erve
d.
2002
Tel
e A
tlas
B.v
. 's-
Her
toge
nbo
sch.
All
righ
ts r
eser
ved
.20
02 T
ele
Atla
s B
.v. '
s-H
erto
genb
osc
h. A
ll ri
ghts
res
erve
d.
2002
Tel
e A
tlas
B.v
. 's-
Her
toge
nbo
sch.
All
righ
ts r
eser
ved
.20
02 T
ele
Atla
s B
.v. '
s-H
erto
genb
osc
h. A
ll ri
ghts
res
erve
d.
2002
Tel
e A
tlas
B.v
. 's-
Her
toge
nbo
sch.
All
righ
ts r
eser
ved
.20
02 T
ele
Atla
s B
.v. '
s-H
erto
genb
osc
h. A
ll ri
ghts
res
erve
d.
2001
Cen
sus,
Out
put
Are
a B
oun
dar
ies.
2001
Cen
sus,
Out
put
Are
a B
oun
dar
ies.
2001
Cen
sus,
Out
put
Are
a B
oun
dar
ies.
2001
Cen
sus,
Out
put
Are
a B
oun
dar
ies.
2001
Cen
sus,
Out
put
Are
a B
oun
dar
ies.
2001
Cen
sus,
Out
put
Are
a B
oun
dar
ies.
2001
Cen
sus,
Out
put
Are
a B
oun
dar
ies.
2001
Cen
sus,
Out
put
Are
a B
oun
dar
ies.
2001
Cen
sus,
Out
put
Are
a B
oun
dar
ies.
Cro
wn
cop
yrig
ht m
ater
ial i
s re
pro
duc
ed
Cro
wn
cop
yrig
ht m
ater
ial i
s re
pro
duc
ed
Cro
wn
cop
yrig
ht m
ater
ial i
s re
pro
duc
ed
Cro
wn
cop
yrig
ht m
ater
ial i
s re
pro
duc
ed
Cro
wn
cop
yrig
ht m
ater
ial i
s re
pro
duc
ed
Cro
wn
cop
yrig
ht m
ater
ial i
s re
pro
duc
ed
Cro
wn
cop
yrig
ht m
ater
ial i
s re
pro
duc
ed
Cro
wn
cop
yrig
ht m
ater
ial i
s re
pro
duc
ed
Cro
wn
cop
yrig
ht m
ater
ial i
s re
pro
duc
ed
with
the
per
mis
sio
n o
f the
Co
ntro
ller
of H
MS
Ow
ith th
e p
erm
issi
on
of t
he C
ont
rolle
r o
f HM
SO
with
the
per
mis
sio
n o
f the
Co
ntro
ller
of H
MS
Ow
ith th
e p
erm
issi
on
of t
he C
ont
rolle
r o
f HM
SO
with
the
per
mis
sio
n o
f the
Co
ntro
ller
of H
MS
Ow
ith th
e p
erm
issi
on
of t
he C
ont
rolle
r o
f HM
SO
with
the
per
mis
sio
n o
f the
Co
ntro
ller
of H
MS
Ow
ith th
e p
erm
issi
on
of t
he C
ont
rolle
r o
f HM
SO
with
the
per
mis
sio
n o
f the
Co
ntro
ller
of H
MS
OS
cott
ish
Exe
cutiv
eS
cott
ish
Exe
cutiv
eS
cott
ish
Exe
cutiv
eS
cott
ish
Exe
cutiv
eS
cott
ish
Exe
cutiv
eS
cott
ish
Exe
cutiv
eS
cott
ish
Exe
cutiv
eS
cott
ish
Exe
cutiv
eS
cott
ish
Exe
cutiv
e stee
r da
vies
gle
ave
Edin
burg
h T
ram
STA
G 2
Appra
isal
Fig
ure
9.2
3:
Change in A
ccess
ibilit
y t
o G
ranto
n (
Phase
1a)
Cha
nges
in A
cces
sib
ility
to
Gra
nto
n
> 1
0 m
inut
es5
to 1
01
to
5N
o E
ffec
t-5
to -
1-1
0 to
-5
< -
10 m
inut
es
Ed
inb
urgh
Tra
m P
hase
1a
P:\
CG
G\G
IS\W
ork
\Pro
ject
s\69
00s\
6968
\Map
pin
g\M
apIn
fo\W
ork
spac
es\C
hang
eAcc
essi
bili
tyP
hase
1A_V
ario
usLo
catio
ns.w
or
Gra
nto
n (Z
one
170
)
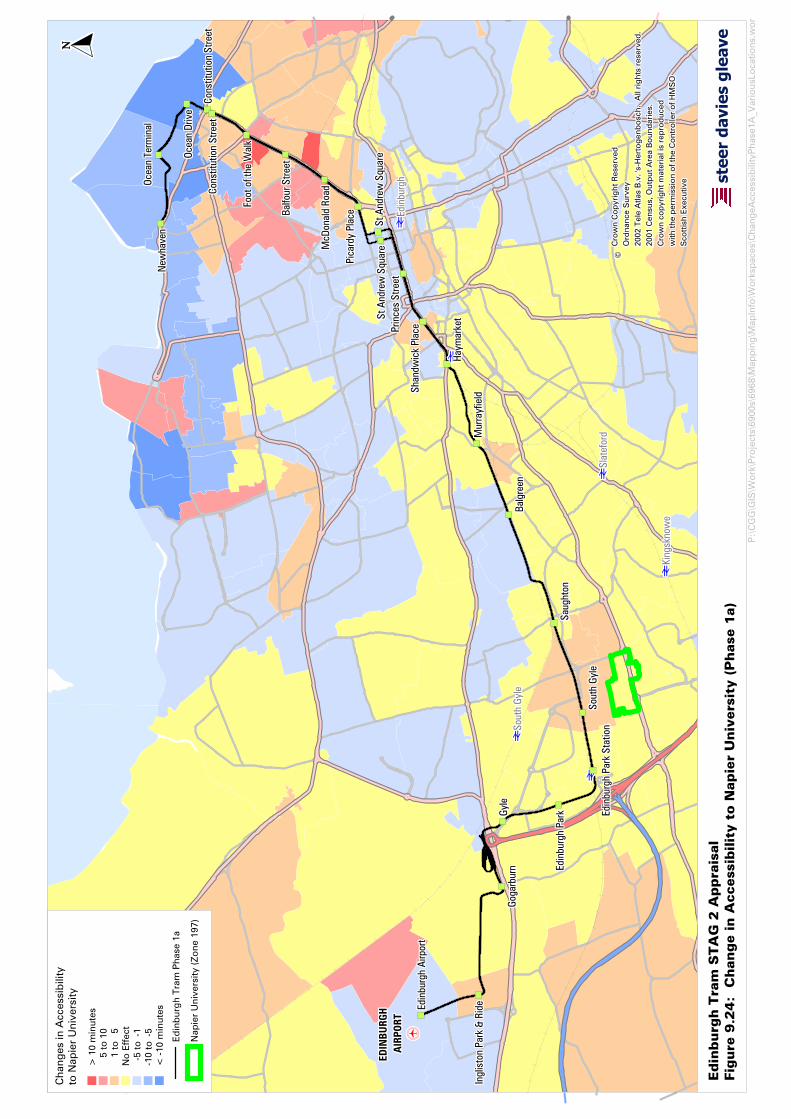
‡ ‡ ‡ ‡ ‡ ‡ ‡‡ ‡ ‡ ‡ ‡ ‡ ‡‡ ‡ ‡ ‡ ‡ ‡ ‡‡ ‡ ‡ ‡ ‡ ‡‡ ‡ ‡ ‡ ‡ ‡ ‡‡ ‡ ‡ ‡ ‡ ‡ ‡‡ ‡ ‡ ‡ ‡ ‡ ‡‡
è è è è è è èè è è è è è èè è è è è è èè è è è è èè è è è è è èè è è è è è èè è è è è è èè
è è è è è è èè è è è è è èè è è è è è èè è è è è èè è è è è è èè è è è è è èè è è è è è èèè è è è è è èè è è è è è èè è è è è è èè è è è è èè è è è è è èè è è è è è èè è è è è è èè
è è è è è è èè è è è è è èè è è è è è èè è è è è èè è è è è è èè è è è è è èè è è è è è èè
è è è è è è èè è è è è è èè è è è è è èè è è è è èè è è è è è èè è è è è è èè è è è è è èè
è è è è è è èè è è è è è èè è è è è è èè è è è è èè è è è è è èè è è è è è èè è è è è è èè
EDIN
BURG
H ED
INBU
RGH
EDIN
BURG
H ED
INBU
RGH
EDIN
BURG
H ED
INBU
RGH
EDIN
BURG
H ED
INBU
RGH
EDIN
BURG
H A
IRPO
RTA
IRPO
RTA
IRPO
RTA
IRPO
RTA
IRPO
RTA
IRPO
RTA
IRPO
RTA
IRPO
RTA
IRPO
RT
New
have
nN
ewha
ven
New
have
nN
ewha
ven
New
have
nN
ewha
ven
New
have
nN
ewha
ven
New
have
nOc
ean
Term
inal
Ocea
n Te
rmin
alOc
ean
Term
inal
Ocea
n Te
rmin
alOc
ean
Term
inal
Ocea
n Te
rmin
alOc
ean
Term
inal
Ocea
n Te
rmin
alOc
ean
Term
inal
Cons
titut
ion
Stre
etCo
nstit
utio
n St
reet
Cons
titut
ion
Stre
etCo
nstit
utio
n St
reet
Cons
titut
ion
Stre
etCo
nstit
utio
n St
reet
Cons
titut
ion
Stre
etCo
nstit
utio
n St
reet
Cons
titut
ion
Stre
etCo
nstit
utio
n St
reet
Cons
titut
ion
Stre
etCo
nstit
utio
n St
reet
Cons
titut
ion
Stre
etCo
nstit
utio
n St
reet
Cons
titut
ion
Stre
etCo
nstit
utio
n St
reet
Cons
titut
ion
Stre
etCo
nstit
utio
n St
reet
Pica
rdy
Plac
ePi
card
y Pl
ace
Pica
rdy
Plac
ePi
card
y Pl
ace
Pica
rdy
Plac
ePi
card
y Pl
ace
Pica
rdy
Plac
ePi
card
y Pl
ace
Pica
rdy
Plac
e
St A
ndre
w S
quar
eSt
And
rew
Squ
are
St A
ndre
w S
quar
eSt
And
rew
Squ
are
St A
ndre
w S
quar
eSt
And
rew
Squ
are
St A
ndre
w S
quar
eSt
And
rew
Squ
are
St A
ndre
w S
quar
ePr
ince
s St
reet
Prin
ces
Stre
etPr
ince
s St
reet
Prin
ces
Stre
etPr
ince
s St
reet
Prin
ces
Stre
etPr
ince
s St
reet
Prin
ces
Stre
etPr
ince
s St
reet
Haym
arke
tHa
ymar
ket
Haym
arke
tHa
ymar
ket
Haym
arke
tHa
ymar
ket
Haym
arke
tHa
ymar
ket
Haym
arke
t
Balg
reen
Balg
reen
Balg
reen
Balg
reen
Balg
reen
Balg
reen
Balg
reen
Balg
reen
Balg
reen
Saug
hton
Saug
hton
Saug
hton
Saug
hton
Saug
hton
Saug
hton
Saug
hton
Saug
hton
Saug
hton
Sout
h Gy
leSo
uth
Gyle
Sout
h Gy
leSo
uth
Gyle
Sout
h Gy
leSo
uth
Gyle
Sout
h Gy
leSo
uth
Gyle
Sout
h Gy
leEd
inbu
rgh
Park
Sta
tion
Edin
burg
h Pa
rk S
tatio
nEd
inbu
rgh
Park
Sta
tion
Edin
burg
h Pa
rk S
tatio
nEd
inbu
rgh
Park
Sta
tion
Edin
burg
h Pa
rk S
tatio
nEd
inbu
rgh
Park
Sta
tion
Edin
burg
h Pa
rk S
tatio
nEd
inbu
rgh
Park
Sta
tion
Goga
rbur
nGo
garb
urn
Goga
rbur
nGo
garb
urn
Goga
rbur
nGo
garb
urn
Goga
rbur
nGo
garb
urn
Goga
rbur
n
Edin
burg
h Ai
rpor
tEd
inbu
rgh
Airp
ort
Edin
burg
h Ai
rpor
tEd
inbu
rgh
Airp
ort
Edin
burg
h Ai
rpor
tEd
inbu
rgh
Airp
ort
Edin
burg
h Ai
rpor
tEd
inbu
rgh
Airp
ort
Edin
burg
h Ai
rpor
t
Edin
burg
h Pa
rkEd
inbu
rgh
Park
Edin
burg
h Pa
rkEd
inbu
rgh
Park
Edin
burg
h Pa
rkEd
inbu
rgh
Park
Edin
burg
h Pa
rkEd
inbu
rgh
Park
Edin
burg
h Pa
rk
Ocea
n Dr
ive
Ocea
n Dr
ive
Ocea
n Dr
ive
Ocea
n Dr
ive
Ocea
n Dr
ive
Ocea
n Dr
ive
Ocea
n Dr
ive
Ocea
n Dr
ive
Ocea
n Dr
ive
Ingl
isto
n Pa
rk &
Rid
eIn
glis
ton
Park
& R
ide
Ingl
isto
n Pa
rk &
Rid
eIn
glis
ton
Park
& R
ide
Ingl
isto
n Pa
rk &
Rid
eIn
glis
ton
Park
& R
ide
Ingl
isto
n Pa
rk &
Rid
eIn
glis
ton
Park
& R
ide
Ingl
isto
n Pa
rk &
Rid
e
Shan
dwic
k Pl
ace
Shan
dwic
k Pl
ace
Shan
dwic
k Pl
ace
Shan
dwic
k Pl
ace
Shan
dwic
k Pl
ace
Shan
dwic
k Pl
ace
Shan
dwic
k Pl
ace
Shan
dwic
k Pl
ace
Shan
dwic
k Pl
ace
St A
ndre
w S
quar
eSt
And
rew
Squ
are
St A
ndre
w S
quar
eSt
And
rew
Squ
are
St A
ndre
w S
quar
eSt
And
rew
Squ
are
St A
ndre
w S
quar
eSt
And
rew
Squ
are
St A
ndre
w S
quar
e
Foot
of t
he W
alk
Foot
of t
he W
alk
Foot
of t
he W
alk
Foot
of t
he W
alk
Foot
of t
he W
alk
Foot
of t
he W
alk
Foot
of t
he W
alk
Foot
of t
he W
alk
Foot
of t
he W
alk
Balfo
ur S
treet
Balfo
ur S
treet
Balfo
ur S
treet
Balfo
ur S
treet
Balfo
ur S
treet
Balfo
ur S
treet
Balfo
ur S
treet
Balfo
ur S
treet
Balfo
ur S
treet
McD
onal
d Ro
adM
cDon
ald
Road
McD
onal
d Ro
adM
cDon
ald
Road
McD
onal
d Ro
adM
cDon
ald
Road
McD
onal
d Ro
adM
cDon
ald
Road
McD
onal
d Ro
ad
Sout
h Gy
leSo
uth
Gyle
Sout
h Gy
leSo
uth
Gyle
Sout
h Gy
leSo
uth
Gyle
Sout
h Gy
leSo
uth
Gyle
Sout
h Gy
le
Slat
efor
dSl
atef
ord
Slat
efor
dSl
atef
ord
Slat
efor
dSl
atef
ord
Slat
efor
dSl
atef
ord
Slat
efor
d
King
skno
we
King
skno
we
King
skno
we
King
skno
we
King
skno
we
King
skno
we
King
skno
we
King
skno
we
King
skno
we
Edin
burg
hEd
inbu
rgh
Edin
burg
hEd
inbu
rgh
Edin
burg
hEd
inbu
rgh
Edin
burg
hEd
inbu
rgh
Edin
burg
h
Mur
rayf
ield
Mur
rayf
ield
Mur
rayf
ield
Mur
rayf
ield
Mur
rayf
ield
Mur
rayf
ield
Mur
rayf
ield
Mur
rayf
ield
Mur
rayf
ield
Gyle
Gyle
Gyle
Gyle
Gyle
Gyle
Gyle
Gyle
Gyle
© © ©© ©© © ©©C
row
n C
op
yrig
ht R
eser
ved
Cro
wn
Co
pyr
ight
Res
erve
dC
row
n C
op
yrig
ht R
eser
ved
Cro
wn
Co
pyr
ight
Res
erve
dC
row
n C
op
yrig
ht R
eser
ved
Cro
wn
Co
pyr
ight
Res
erve
dC
row
n C
op
yrig
ht R
eser
ved
Cro
wn
Co
pyr
ight
Res
erve
dC
row
n C
op
yrig
ht R
eser
ved
Ord
nanc
e S
urve
yO
rdna
nce
Sur
vey
Ord
nanc
e S
urve
yO
rdna
nce
Sur
vey
Ord
nanc
e S
urve
yO
rdna
nce
Sur
vey
Ord
nanc
e S
urve
yO
rdna
nce
Sur
vey
Ord
nanc
e S
urve
y20
02 T
ele
Atla
s B
.v. '
s-H
erto
genb
osc
h. A
ll ri
ghts
res
erve
d.
2002
Tel
e A
tlas
B.v
. 's-
Her
toge
nbo
sch.
All
righ
ts r
eser
ved
.20
02 T
ele
Atla
s B
.v. '
s-H
erto
genb
osc
h. A
ll ri
ghts
res
erve
d.
2002
Tel
e A
tlas
B.v
. 's-
Her
toge
nbo
sch.
All
righ
ts r
eser
ved
.20
02 T
ele
Atla
s B
.v. '
s-H
erto
genb
osc
h. A
ll ri
ghts
res
erve
d.
2002
Tel
e A
tlas
B.v
. 's-
Her
toge
nbo
sch.
All
righ
ts r
eser
ved
.20
02 T
ele
Atla
s B
.v. '
s-H
erto
genb
osc
h. A
ll ri
ghts
res
erve
d.
2002
Tel
e A
tlas
B.v
. 's-
Her
toge
nbo
sch.
All
righ
ts r
eser
ved
.20
02 T
ele
Atla
s B
.v. '
s-H
erto
genb
osc
h. A
ll ri
ghts
res
erve
d.
2001
Cen
sus,
Out
put
Are
a B
oun
dar
ies.
2001
Cen
sus,
Out
put
Are
a B
oun
dar
ies.
2001
Cen
sus,
Out
put
Are
a B
oun
dar
ies.
2001
Cen
sus,
Out
put
Are
a B
oun
dar
ies.
2001
Cen
sus,
Out
put
Are
a B
oun
dar
ies.
2001
Cen
sus,
Out
put
Are
a B
oun
dar
ies.
2001
Cen
sus,
Out
put
Are
a B
oun
dar
ies.
2001
Cen
sus,
Out
put
Are
a B
oun
dar
ies.
2001
Cen
sus,
Out
put
Are
a B
oun
dar
ies.
Cro
wn
cop
yrig
ht m
ater
ial i
s re
pro
duc
ed
Cro
wn
cop
yrig
ht m
ater
ial i
s re
pro
duc
ed
Cro
wn
cop
yrig
ht m
ater
ial i
s re
pro
duc
ed
Cro
wn
cop
yrig
ht m
ater
ial i
s re
pro
duc
ed
Cro
wn
cop
yrig
ht m
ater
ial i
s re
pro
duc
ed
Cro
wn
cop
yrig
ht m
ater
ial i
s re
pro
duc
ed
Cro
wn
cop
yrig
ht m
ater
ial i
s re
pro
duc
ed
Cro
wn
cop
yrig
ht m
ater
ial i
s re
pro
duc
ed
Cro
wn
cop
yrig
ht m
ater
ial i
s re
pro
duc
ed
with
the
per
mis
sio
n o
f the
Co
ntro
ller
of H
MS
Ow
ith th
e p
erm
issi
on
of t
he C
ont
rolle
r o
f HM
SO
with
the
per
mis
sio
n o
f the
Co
ntro
ller
of H
MS
Ow
ith th
e p
erm
issi
on
of t
he C
ont
rolle
r o
f HM
SO
with
the
per
mis
sio
n o
f the
Co
ntro
ller
of H
MS
Ow
ith th
e p
erm
issi
on
of t
he C
ont
rolle
r o
f HM
SO
with
the
per
mis
sio
n o
f the
Co
ntro
ller
of H
MS
Ow
ith th
e p
erm
issi
on
of t
he C
ont
rolle
r o
f HM
SO
with
the
per
mis
sio
n o
f the
Co
ntro
ller
of H
MS
OS
cott
ish
Exe
cutiv
eS
cott
ish
Exe
cutiv
eS
cott
ish
Exe
cutiv
eS
cott
ish
Exe
cutiv
eS
cott
ish
Exe
cutiv
eS
cott
ish
Exe
cutiv
eS
cott
ish
Exe
cutiv
eS
cott
ish
Exe
cutiv
eS
cott
ish
Exe
cutiv
e stee
r da
vies
gle
ave
Edin
burg
h T
ram
STA
G 2
Appra
isal
Fig
ure
9.2
4:
Change in A
ccess
ibilit
y t
o N
apie
r U
niv
ers
ity (
Phase
1a)
Cha
nges
in A
cces
sib
ility
to
Nap
ier
Uni
vers
ity
> 1
0 m
inut
es5
to 1
01
to
5N
o E
ffec
t-5
to -
1-1
0 to
-5
< -
10 m
inut
es
Ed
inb
urgh
Tra
m P
hase
1a
P:\
CG
G\G
IS\W
ork
\Pro
ject
s\69
00s\
6968
\Map
pin
g\M
apIn
fo\W
ork
spac
es\C
hang
eAcc
essi
bili
tyP
hase
1A_V
ario
usLo
catio
ns.w
or
Nap
ier
Uni
vers
ity (Z
one
197
)