staff report c70 - slc.ca.gov · 12-01-2019 · activities include costs for professional and...
TRANSCRIPT
-1-
STAFF REPORT
C70 A 70 12/03/18 W 17166 S 33, 34 E. Tajer
CONSIDER ACCEPTANCE OF THE FINAL REPORT AND CLOSING STATEMENT FOR THE LONG BEACH UNIT ANNUAL PLAN
(JULY 1, 2017, THROUGH JUNE 30, 2018), LONG BEACH UNIT, WILMINGTON OIL FIELD,
LOS ANGELES COUNTY GRANTEE: City of Long Beach BACKGROUND:
The City of Long Beach submitted its Final Report and Closing Statement for the Annual Plan, Long Beach Unit, for Fiscal Year 2017-2018 (Report), covering the period July 1, 2017, through June 30, 2018, to the Commission, as required by section 10 of Chapter 138, Statutes of 1964, 1st Extraordinary Session. Although Commission action on the Report is not a requirement under the statute or various Long Beach Unit agreements, the City of Long Beach has requested the Commission’s concurrence with and acceptance of the Report by letter dated October 30, 2018 (Exhibit C, attached). This Report provides the actual performance for the full Fiscal Year 2017-2018. Total expenditures for the Long Beach Unit were $257.5 million, which was $32.4 million less than the approved budget for Fiscal Year 2017-2018. Total unit costs were less than planned due to lower than anticipated drilling development, and lower facility, tax, permits, and administrative overhead costs during the fiscal year. The Unit’s net profit for Fiscal Year 2017-2018 was $188.9 million, which was $134.6 million higher than the approved budget estimate. The higher-than-planned net profit was the result of the higher realized oil price of $60.01 per barrel compared to the original estimated price of $45.00 per barrel.
The average oil and gas rates for Fiscal Year 2017-2018 were reported to be 20,188 barrels (bbls)/day of oil (419 bbls/day less than the Plan estimate) and 7,246 thousand cubic feet (MCF)/day of gas (686 MCF/day lower than the Plan estimate). The cumulative recoveries and injection through June 2018 are as follows:

STAFF REPORT NO. C70 (CONT'D)
-2-
Oil Production 1,058,972,000 barrels
Gas Production 287,597 million cubic feet (MMCF)
Water Production 10,820,411,000 barrels
Water Injection 13,095,786,000 barrels
Cumulative Injection - Gross Production Ratio is 1.10 bbls/bbl.
The approved budget forecast assumed an oil price of $45.00/bbl and a gas price of $2.00/MCf, whereas the actual prices averaged $60.01/bbl for oil and $1.82/MCf for gas for the fiscal year. See the tables below for additional details.
ACTUAL OIL AND GAS PRICES, EXPENDITURES, AND NET PROFIT FOR FY 2017-2018
(IN MILLIONS OF DOLLARS)
ACTUAL FIRST
QUARTER FY 17/18
ACTUAL SECOND
QUARTER FY 17/18
ACTUAL THIRD
QUARTER FY 17/18
ACTUAL FOURTH
QUARTER FY 17/18
ACTUAL FY 17/18
Oil Revenue 89.1 107.4 116 129.1 441.6 Gas Revenue 1.4 1.2 1.4 0.8 4.8
Expenditures 60.8 65.6 68.8 62.3 257.5 Net Profit 29.7 43.0 48.6 67.6 188.9
Oil Price $/BBL 47.1 57.6 64.7 70.9 60.01
Gas Price $/MCF 2.03 1.91 2.15 1.21 1.82
ORIGINAL BUDGET NET PROFIT AND CHANGE FOR FY 2017-2018
(IN MILLIONS OF DOLLARS) FIRST
QUARTER FY 17-18
SECOND QUARTER FY 17-18
THIRD QUARTER FY 17-18
FOURTH QUARTER FY 17-18
TOTAL FY 17-18
Original Budget Net Profit
21.1 24.3 0.9 7.9 54.3
Actual Net Profit 29.7 43.0 48.6 67.6 188.9
Staff reviewed the Report, including production, injection, expenditures and revenue figures, and has prepared Exhibits A and B, attached, to represent graphically the actual fiscal year performance compared to the approved budget.
OTHER PERTINENT INFORMATION:
1. This action is consistent with Strategy 1.5 of the Commission’s Strategic Plan to ensure the highest level of environmental protection and public safety in the production and transportation of oil and gas resources, by

STAFF REPORT NO. C70 (CONT'D)
-3-
applying Key Action 1.5.2 to ensure lease and contract compliance with sound oil and gas development practices in compliance with regulatory and statutory requirements.
2. Acceptance of the Final Report and Closing Statement is not a project as defined by the California Environmental Quality Act because it is an administrative action that will not result in direct or indirect physical changes in the environment.
Authority: Public Resources Code section 21065 and California Code of Regulations, title 14, sections 15378, subdivision (b)(5).
EXHIBITS:
A. LBU Financial Performance, FY 2017-2018, Annual Plan vs. Actual B. LBU Oil Rate Performance, FY 2017-2018, Annual Plan vs. Actual C. Letter from the City of Long Beach requesting acceptance of the Final
Closing Statement to the Annual Plan
RECOMMENDED ACTION: It is recommended that the Commission:
AUTHORIZATION: Accept for filing the Final Report and Closing Statement for the Long Beach Unit Annual Plan, for the period July 1, 2017, through June 30, 2018, Long Beach Unit, Wilmington Oil Field, Los Angeles County.


Exhibit C W 17166


Budget to Actual Variance
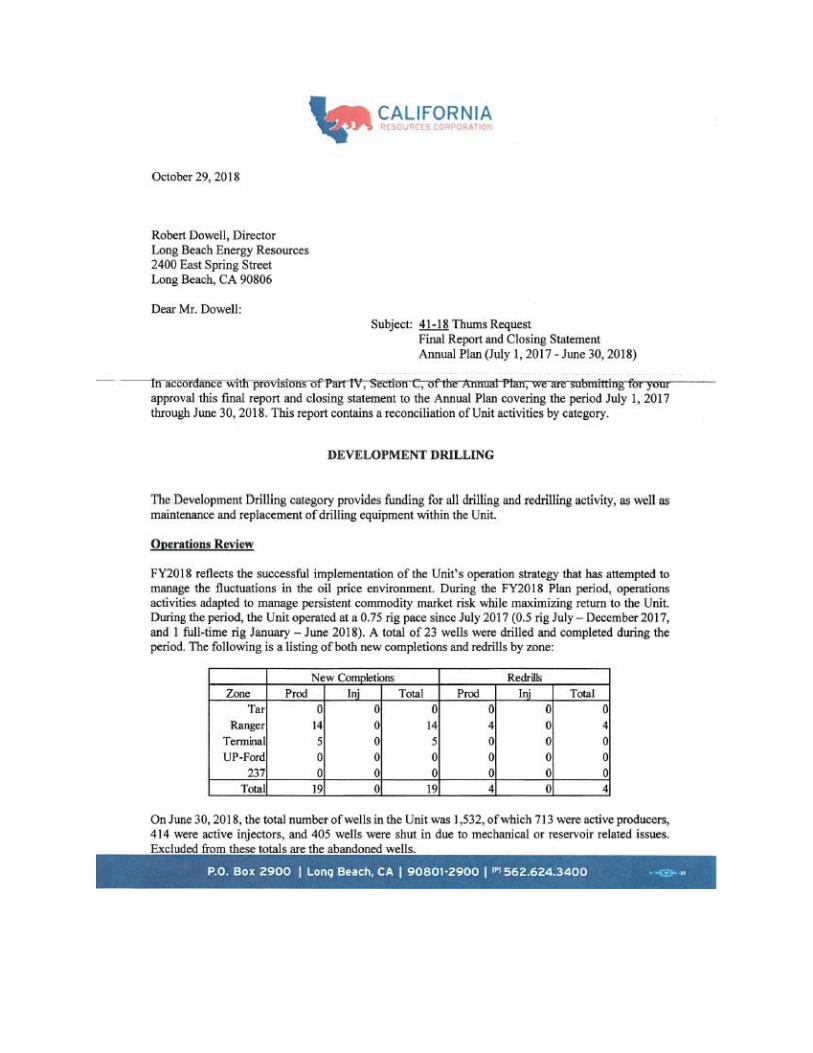
The Plan provided funds for 45 new and redrilled wells that were to be drilled with 1.5 full-time
drilling rigs. The actual number of wells drilled and completed was 23 using a 0.75 drilling rig
pace.
The budget for the Development Drilling Category was $70.7 million, while actual spend was
42.3% lower at $40.8 million. The lower spending level was primarily due to reduced drilling rig
pace.
OPERATING EXPENSE
The Operating Expense Category provides funding for the ongoing cost of day-to-day well
production and injection operations necessary for producing, processing, and delivering crude oil
and gas, and for all electric power costs and abandonment costs.
Operations Review
• Unit oil production during the Plan period averaged 20,188 bbls/day, which was 419 bbls/day
lower than the Plan estimate.
• Gas production averaged 7,246 mcf/day, which was 686 mcf/day lower than the Plan estimate.
• Water injection averaged 1,175,951 bbls/day, which was 68,434 bbls/day lower than originally
estimated in the Plan. Water production averaged 1,114,697 bbls/day, which was 55,275
bbls/day less than the Plan estimate.
• The average price for Unit crude was $60.01/bbl during the Plan period. The Plan was based
on $45.00/bbl crude. The average price for Unit gas was $1.82/mcf and the Plan was based on
$2.00/mcf.
Budget to Actual Variance
Total spending for Operating Expense was $96.2 million, compared to $92.8 million approved
budget. The spending was 3.7% higher than Plan and primarily driven by a higher capital
workover pace and increased spending on downhole production equipment.

FACILITIES, MAINTENANCE AND PLANT
The Facilities, Maintenance and Plant Category provides funds for maintenance, repairs,
upgrades, additions of surface facilities and pipelines, and costs for general field services.
Operations Review
Projects with significant expenditures during the fiscal year include the following:
• Power Plant Upgrades
• White Water Transfer Pump Piping
• Chaffee Injection Piping Replacement
• Pier G to J Double Track
• B&M Oil Shipping Line Replacements
• Smart Pigging
Budget to Actual Variance
The Facilities, Maintenance and Plant Category had a budget of $53.6 million, of which $49.7
million, or 92.7%, was spent. The lower spending level was primarily related to project timing
and the reduced facility project scope.
UNIT FIELD LABOR AND ADMINISTRATIVE
The Unit Field Labor and Administrative Category provides funding for salaries, benefits, training,
and other expenses of all Unit personnel, and costs for other Unit support activities. Unit support
activities include costs for professional and temporary services, data processing and general office
equipment and materials, Unit Operator billable costs, California Resources Long Beach Inc.
billable costs, management projects, extraordinary losses and claims, and prior year adjustments.
Budget to Actual Variance
The Unit Field Labor and Administrative Category had a budget of $43.0 million. Actual spend
was 4.2% lower at $41.2 million. The overall spending for this category was consistent with the
budget assumptions.
TAXES, PERMITS, AND ADMINISTRATIVE OVERHEAD
The Taxes, Permits, and Administrative Overhead Category provides funding for specific taxes,
permits, licenses, land leases, and all administrative overhead costs for the Unit.

Budget to Actual Variance
The Taxes, Permits, and Administrative Overhead Category had a budget of $29.9 million, while
actual spend was 0.8% lower at $29.7 million. The overall spending for this category was consistent
with the budget assumptions.
SUMMARY
The Long Beach Unit FY2018 budget was $289.9 million, of which $257.5 million, or 89%, was
spent. Due to higher realized oil price than built into the Plan as well as lower spending, fiscal year
profit was $188.9 million in comparison to $54.3 million originally estimated in the Plan.
Significant effort was made during the Plan period to achieve best-in-class waterflood
performance, which is paramount to increasing long-term value for the Unit. The development
program was successfully implemented, which was optimized for capital investment, cash flow
and market volatility, while maintaining focus on health, environment and safety. Your
concurrence with this Final Report and Closing Statement of the Annual Plan is requested.
Yours very truly,
Bob Grundstrom
Leader – LA Basin
California Resources Corporation
APPROVED:
Robert Dowell Date
PR
Attachments
cc: Management Team

Economic Projections
Data in Thousands of $
ACTUAL
FIRST
QUARTER
FY18
ACTUAL
SECOND
QUARTER
FY18
ACTUAL
THIRD
QUARTER
FY18
ACTUAL
FOURTH
QUARTER
FY18
ACTUAL
TOTAL
FISCAL YEAR
FY18
BUDGET
TOTAL
FISCAL YEAR
FY18
% ACTUAL
OVER/UNDER
(-) BUDGET
FY18
ESTIMATED REVENUE
Oil Revenue 89,090$ 107,430$ 115,982$ 129,103$ 441,605$ 338,472$ 30.5%
Gas Revenue 1,357$ 1,240$ 1,408$ 808$ 4,814$ 5,791$ -16.9%
TOTAL REVENUE 90,447$ 108,670$ 117,390$ 129,911$ 446,419$ 344,263$ 29.7%
ESTIMATED EXPENDITURES
Development Drilling 6,345$ 8,952$ 9,738$ 15,735$ 40,769$ 70,680$ -42.3%
Operating Expense 23,909$ 26,662$ 27,629$ 17,999$ 96,198$ 92,760$ 3.7%
Facilities & Maintenance 11,811$ 12,908$ 10,651$ 14,324$ 49,695$ 53,580$ -7.3%
Unit Field Labor & Admin 10,447$ 10,283$ 12,495$ 7,948$ 41,173$ 42,998$ -4.2%
Taxes, Permits & Admin Overhead 8,265$ 6,823$ 8,295$ 6,269$ 29,651$ 29,905$ -0.8%
TOTAL EXPENDITURES 60,776$ 65,627$ 68,809$ 62,274$ 257,486$ 289,922$ -11.2%
NET PROFIT 29,671$ 43,043$ 48,582$ 67,637$ 188,932$ 54,341$ 247.7%
Major Planning Assumptions
ACTUAL
FIRST
QUARTER
FY18
ACTUAL
SECOND
QUARTER
FY18
ACTUAL
THIRD
QUARTER
FY18
ACTUAL
FOURTH
QUARTER
FY18
ACTUAL
TOTAL
FISCAL YEAR
FY18
BUDGET
TOTAL
FISCAL YEAR
FY18
% ACTUAL
OVER/UNDER
(-) BUDGET
FY18
OIL PRODUCTION :
QUARTERLY (1,000 BBL) 1,891 1,863 1,793 1,822 7,369 7,522
AVERAGE B/D 20,557 20,248 19,919 20,019 20,188 20,607 -2.0%
GAS PRODUCTION :
QUARTERLY (MMCF) 670 651 657 667 2,645 2,895
AVERAGE MCF/D 7,285 7,071 7,295 7,334 7,246 7,933 -8.7%
WATER PRODUCTION :
QUARTERLY (1,000 BBL) 101,599 102,668 101,431 101,167 406,864 427,040
AVERAGE B/D 1,104,335 1,115,954 1,127,009 1,111,725 1,114,697 1,169,972 -4.7%
WATER INJECTION :
QUARTERLY (1,000 BBL) 107,782 109,073 106,614 105,754 429,222 454,201
AVERAGE B/D 1,171,539 1,185,579 1,184,599 1,162,126 1,175,951 1,244,385 -5.5%
AVG. OIL PRICE ($/BBL) 47.10 57.63 64.69 70.86 60.01 45.00 33.4%
AVG GAS PRICE ($/MCF) 2.03 1.91 2.15 1.21 1.82 2.00 -8.8%

Oil Production Gas Production
Average B/D Cumulative Mbbls Average MCF/D Cumulative MMCF
Location 7/1/17 - 6/30/18 6/30/2018 7/1/17 - 6/30/18 6/30/2018
Grissom 5,233 201,602 1,096 32,841
White 4,320 185,193 2,081 51,682
Chaffee 4,508 231,096 2,080 77,770
Freeman 3,538 287,294 1,207 96,599
Pier J 2,588 153,787 783 28,704
Total 20,188 1,058,972 7,246 287,597
ReservoirSHALLOW GAS 0 0 0 0
TAR 234 2,350 118 1,010
RANGER 15,244 787,730 5,749 187,274
TERMINAL 3,131 155,167 842 32,440
Union-pac-ford 1,579 109,444 536 61,888
237 0 4,281 0 4,986
Total 20,188 1,058,972 7,246 287,597
Water Production Water Injection
Average B/D Cumulative Mbbls Average B/D Cumulative Mbbls
Location 7/1/17 - 6/30/18 6/30/2018 7/1/17 - 6/30/18 6/30/2018
Grissom 285,306 2,662,538 291,706 3,203,236
White 249,905 2,121,611 212,761 2,479,223
Chaffee 204,576 1,868,495 211,438 2,637,087
Freeman 222,444 2,513,099 288,774 2,771,861
Pier J 152,466 1,654,668 171,273 2,004,378
Total 1,114,697 10,820,411 1,175,951 13,095,786
ReservoirSHALLOW GAS 0 0 0 0
TAR 4,225 15,383 8,601 34,626
RANGER 892,978 8,935,898 938,190 10,796,701
TERMINAL 158,995 1,350,299 171,720 1,626,753
Union-pac-ford 58,498 513,671 57,440 637,705
237 0 5,161 0 0
Total 1,114,697 10,820,411 1,175,951 13,095,786

By Location Producer Injectors Total
Grissom 234 107 341
White 212 128 340
Chaffee 209 137 346
Freeman 212 121 333
Pier J 107 65 172
Total 974 558 1,532
By ReservoirSHALLOW GAS 2 0 2
TAR 17 3 20
RANGER 690 402 1,092
TERMINAL 166 92 258
UP-Ford 95 61 156
237 4 0 4
Total 974 558 1,532
Number of wellsAs of June 30, 2018