stadium view trip generation report - ite western district - msu.pdf · stadium view trip...
TRANSCRIPT

Stadium View Trip Generation Report
2017-2018
Institute of Transportation Engineers at Montana State University

Table of Contents
Stadium View Trip Generation Report
Table of Contents
Chapter 1. Introduction ................................................................................................................................. 1
1.1. Scope of Work ..................................................................................................................................... 1
1.2. Site Description ................................................................................................................................... 2
Chapter 2. Study Methodology...................................................................................................................... 3
2.1. Level of Efforts .................................................................................................................................... 4
Chapter 3. Study Results ................................................................................................................................ 5
3.1. Vehicle Traffic ..................................................................................................................................... 6
3.2. Pedestrian Traffic ................................................................................................................................ 7
3.3. Bicycle Traffic ...................................................................................................................................... 9
3.4. Parking .............................................................................................................................................. 10
Chapter 4. Conclusion .................................................................................................................................. 12
4.1. Special Thanks ................................................................................................................................... 13
Appendix A. Trip Generation Forms ............................................................................................................ 14
Appendix B. Parking Forms .......................................................................................................................... 27

Introduction
Stadium View Trip Generation Report
1
Chapter 1. Introduction
This report summarizes the work performed by ITE @ MSU for the ITE Western District Student Data
Collection Program. The project was performed in southwest Montana’s city of Bozeman. Although ITE
@ MSU has a storied history, we have been fairly dormant over the last few years due to a high level of
student turnover. However, the club currently has a strong base of students passionate in transportation
engineering and we are excited for what our future holds. In the fall semester, we hosted ITE
International President-elect, Michael Sanderson, for a large transportation presentation. We also held
an informational session by representatives from the design and planning firm, Kittelson & Associates.
The club was able to reach out to middle school students in town at an interactive station at MSU’s
annual Engineer-A-Thon. For the first time in our club’s history, we sent student members to the ITE
Student Leadership Summit. We are also thrilled to be further involved with the upcoming annual
conferences of the ITE Western District and the ITE Intermountain Section. We are currently involved in
a pilot project involving the addition of bike lanes at Montana State University on existing campus
sidewalks. With all the new knowledge our members will gain from these events and projects, we plan
on giving back to our university by supporting transportation initiatives such as bike safety, better
parking, and additional public transportation. Multiple members of the club were involved with this data
collection project, as provided in section 4.1 of this report.
1.1. Scope of Work
This project included two main activities:
• Collection of continuous trip generation data for vehicles, bicycles, and pedestrians, grouped
into 15-minute intervals.
• Collection of parking lot occupancy every hour throughout the duration of study.
This work occurred over three different days of study, Wednesday February 21st, Thursday February
22nd, and Saturday February 24th. Data collection occurred between 7 AM and 6 PM.

Introduction
Stadium View Trip Generation Report
2
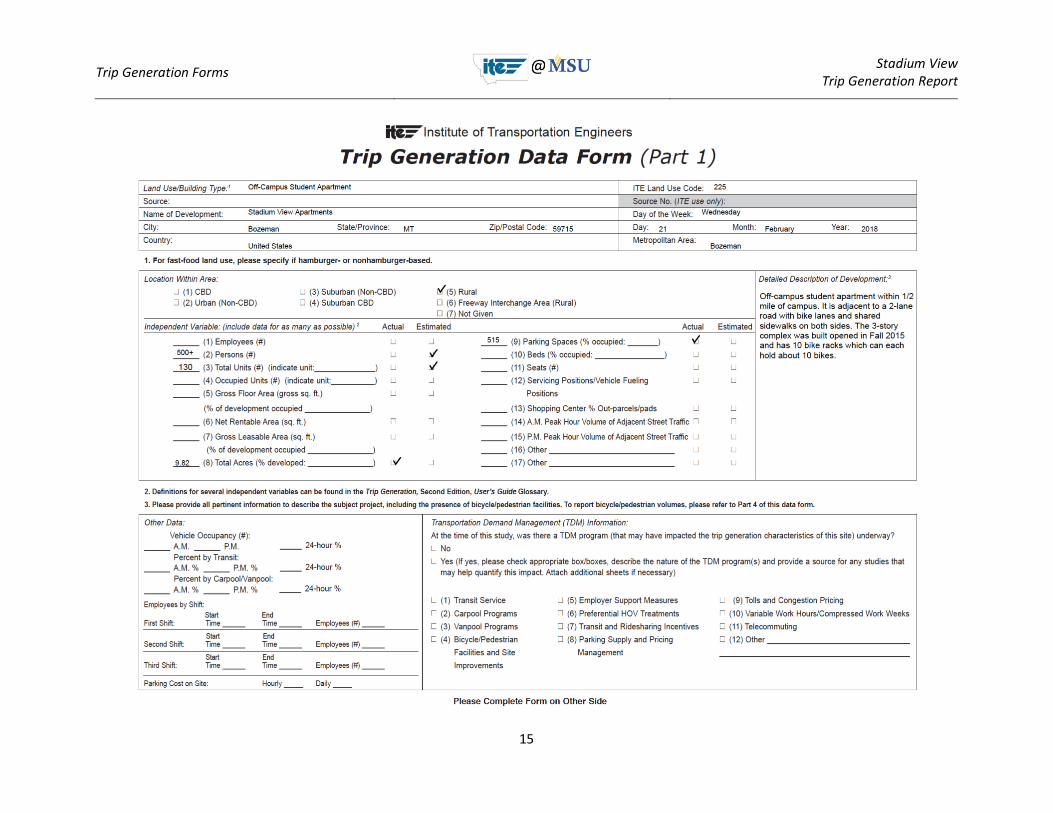
1.2. Site Description
The study site was the Stadium View apartment complex, following
Land Use Code 225: Off-Campus Student Apartment. As shown in
Figure 1, the complex is located directly west of the MSU football
stadium on South 11th Avenue. It is a half mile south of the
intersection of S. 11th Ave. and W. Grant St., the major
intersection on the southwest corner of the MSU campus. This
apartment complex was built in 2015 and serves primarily as off-
campus student lodging. It currently houses approximately 500
residents and encompasses an area of six city blocks. Stadium View
also has a sandwich shop on the first floor facing S. 11th Ave. There
is on-street public parking along S. 11th Ave and private, permit-only
parking for residents on-site.
Bozeman’s only public transportation system, the Streamline bus service, does not serve the complex.
The nearest bus stop is one mile away at MSU’s student union building. Because most bus routes in
south Bozeman are designed to service the university, the complex was deemed too close to justify
being included in a route.
This site was of interest because MSU, and Bozeman in general, has a rising population trend. Bozeman
was recently ranked as the fastest growing “micropolitan” area in the United States (2018 U.S. Census
Bureau). In addition, MSU set the 10th straight spring enrollment record in 2018, at a growth rate of 37%
(February 14, 2018 Bozeman Daily Chronicle). New housing developments will continue to be built
around the city, creating new concentrations of trip generations. In addition to ITE, the data collected
will be helpful to planners who seek to incorporate popular modes of transportation into new
developments.
Table 1: Statistics of Stadium View Apartments
Buildings 8
Stories 3
Apartments (approx.) 130
Residents (approx.) 500
Parking Spaces 515
Bike Racks* 10 * Bike racks each hold approximately 10 bicycles.
Stadium View
Apartments
11th
Ave
To
MSU
Vehicle
Vehicle
Veh
icle
Ped/Bike
Kagy Blvd
Figure 1: Site Overview (image taken from Google Maps).
N
Study Methodology
Stadium View Trip Generation Report
3
Table 1 shows relevant statistics of the Stadium View apartment complex. There are a variety of
apartment sizes within the complex including studio, 1, 2, 3, 4, and 5-bedrooms. The exact number of
each apartment size was not readily available, however there are approximately 3.8 bedrooms per
apartment. The vast majority of bedrooms within the complex contain only one resident. Therefore, it
was assumed that there are approximately 500 bedrooms within the complex. Due to the high demand
for housing in Bozeman, the complex has been fully occupied since it opened.
Chapter 2. Study Methodology
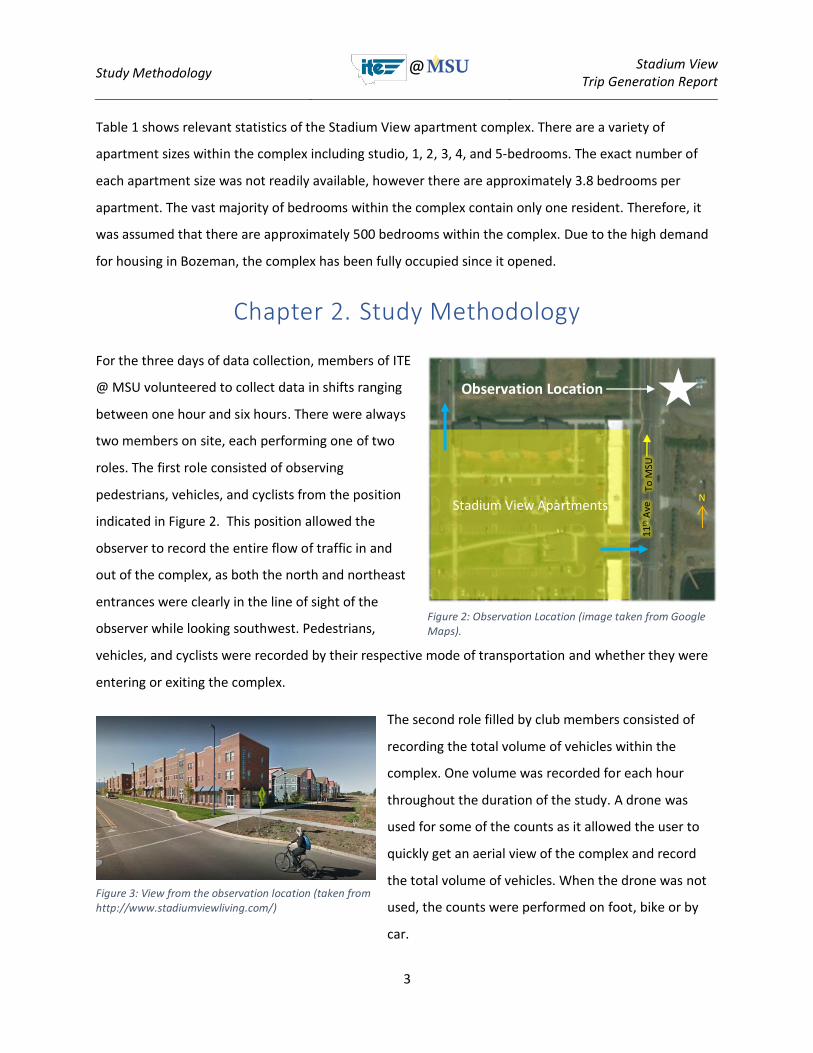
For the three days of data collection, members of ITE
@ MSU volunteered to collect data in shifts ranging
between one hour and six hours. There were always
two members on site, each performing one of two
roles. The first role consisted of observing
pedestrians, vehicles, and cyclists from the position
indicated in Figure 2. This position allowed the
observer to record the entire flow of traffic in and
out of the complex, as both the north and northeast
entrances were clearly in the line of sight of the
observer while looking southwest. Pedestrians,
vehicles, and cyclists were recorded by their respective mode of transportation and whether they were
entering or exiting the complex.
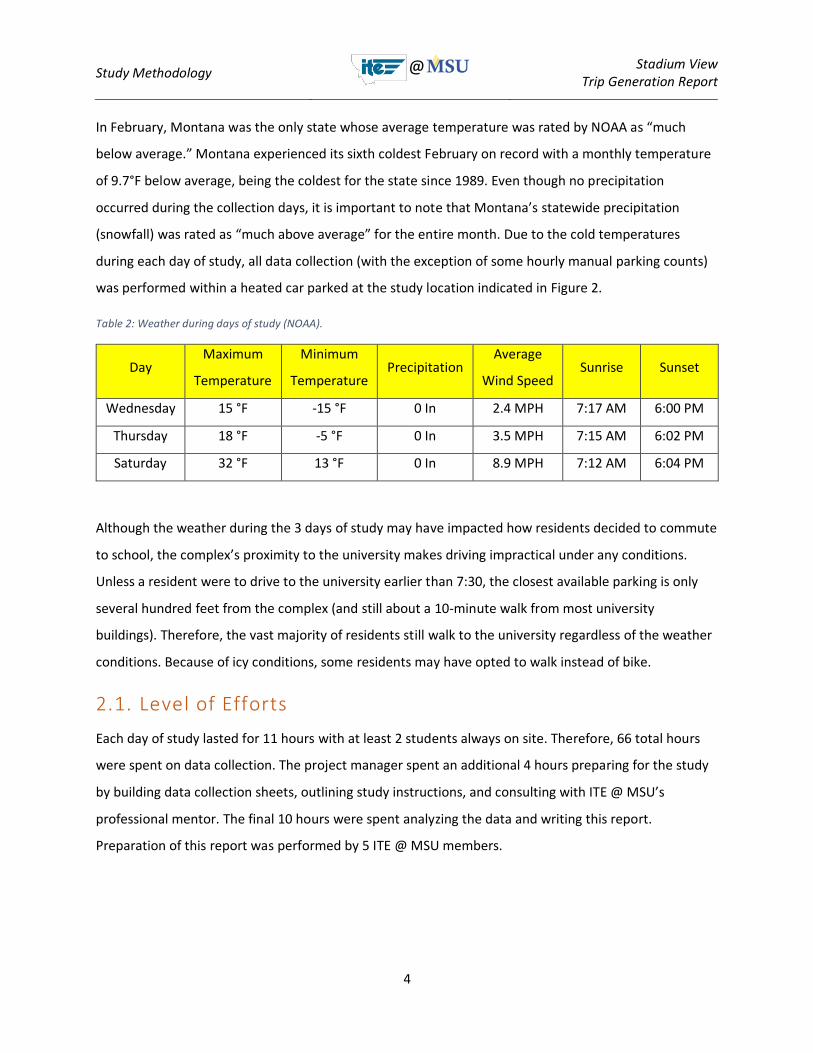
The second role filled by club members consisted of
recording the total volume of vehicles within the
complex. One volume was recorded for each hour
throughout the duration of the study. A drone was
used for some of the counts as it allowed the user to
quickly get an aerial view of the complex and record
the total volume of vehicles. When the drone was not
used, the counts were performed on foot, bike or by
car.
Stadium View Apartments
11th
Ave
To
MSU
Observation Location
Figure 2: Observation Location (image taken from Google Maps).
Figure 3: View from the observation location (taken from http://www.stadiumviewliving.com/)
N
Study Methodology
Stadium View Trip Generation Report
4
In February, Montana was the only state whose average temperature was rated by NOAA as “much
below average.” Montana experienced its sixth coldest February on record with a monthly temperature
of 9.7°F below average, being the coldest for the state since 1989. Even though no precipitation
occurred during the collection days, it is important to note that Montana’s statewide precipitation
(snowfall) was rated as “much above average” for the entire month. Due to the cold temperatures
during each day of study, all data collection (with the exception of some hourly manual parking counts)
was performed within a heated car parked at the study location indicated in Figure 2.
Table 2: Weather during days of study (NOAA).
Day Maximum
Temperature
Minimum
Temperature Precipitation
Average
Wind Speed Sunrise Sunset
Wednesday 15 °F -15 °F 0 In 2.4 MPH 7:17 AM 6:00 PM
Thursday 18 °F -5 °F 0 In 3.5 MPH 7:15 AM 6:02 PM
Saturday 32 °F 13 °F 0 In 8.9 MPH 7:12 AM 6:04 PM
Although the weather during the 3 days of study may have impacted how residents decided to commute
to school, the complex’s proximity to the university makes driving impractical under any conditions.
Unless a resident were to drive to the university earlier than 7:30, the closest available parking is only
several hundred feet from the complex (and still about a 10-minute walk from most university
buildings). Therefore, the vast majority of residents still walk to the university regardless of the weather
conditions. Because of icy conditions, some residents may have opted to walk instead of bike.
2.1. Level of Efforts
Each day of study lasted for 11 hours with at least 2 students always on site. Therefore, 66 total hours
were spent on data collection. The project manager spent an additional 4 hours preparing for the study
by building data collection sheets, outlining study instructions, and consulting with ITE @ MSU’s
professional mentor. The final 10 hours were spent analyzing the data and writing this report.
Preparation of this report was performed by 5 ITE @ MSU members.

Study Results
Stadium View Trip Generation Report
5
Chapter 3. Study Results
A full summary of counted trips by mode and day can be seen in Table 3. Note that the numbers reflect
11 hours of total data collection (7 AM – 6 PM) for each day. The total number of trips generated over
the three-day period is 3,568. The number of vehicles (2,110) and pedestrians (1,360) are far greater
than those on bicycles (98). The different modes of transportation percentages are summarized in
Table 4. The weekdays had much larger trip generation (1,297 on Wednesday and 1,581 on Thursday)
than the weekend (690). Note that for the vehicle trips in Table 3, the numbers shown represent only
the number of vehicles that were counted and does not consider the occupancy of each vehicle. Vehicle
occupancy was not counted in this study, however the average occupancy rate was likely close to 1.
Table 3: Summary of peak hour and daily averages of trips/h.
Table 4: Percentage of transportation modes for each day.
Mode Split
Day Vehicle Walking Bicycle
Wednesday 49 % 47% 4%
Thursday 55% 42% 3%
Saturday 87% 12% 1%
Among the ITE Trip Generation Data Forms, part 2 had cells to provide AM and PM Peak Hour of
adjacent street traffic. The peak hours were determined by data collection done by Sanderson Stewart
(civil engineering design firm) on Wednesday, January 11th, 2018. The counts were collected at the
intersection of S. 11th Ave. and W. Kagy Blvd., just north of Stadium View Apartments.
Mode
Wednesday, February 21 Thursday, February 22 Saturday, February 24
AM
Pea
k (t
rip
s/h
)
PM
Pea
k
(tri
ps/
h)
Dai
ly R
ate
(tri
ps/
h)
Tota
l Tr
ips
AM
Pea
k
(tri
ps/
h)
PM
Pea
k (t
rip
s/h
)
Dai
ly R
ate
(tri
ps/
h)
Tota
l Tr
ips
AM
Pea
k
(tri
ps/
h)
PM
Pea
k (t
rip
s/h
)
Dai
ly R
ate
(tri
ps/
h)
Tota
l
Trip
s
Vehicle 50 94 58 637 92 102 79 870 61 101 55 603
Walking 75 61 56 612 75 82 61 666 13 12 7 82
Bicycle 7 7 4 48 9 7 4 45 1 3 0.5 5
All Modes 132 162 118 1297 176 191 144 1581 75 116 62.5 690
Study Results
Stadium View Trip Generation Report
6
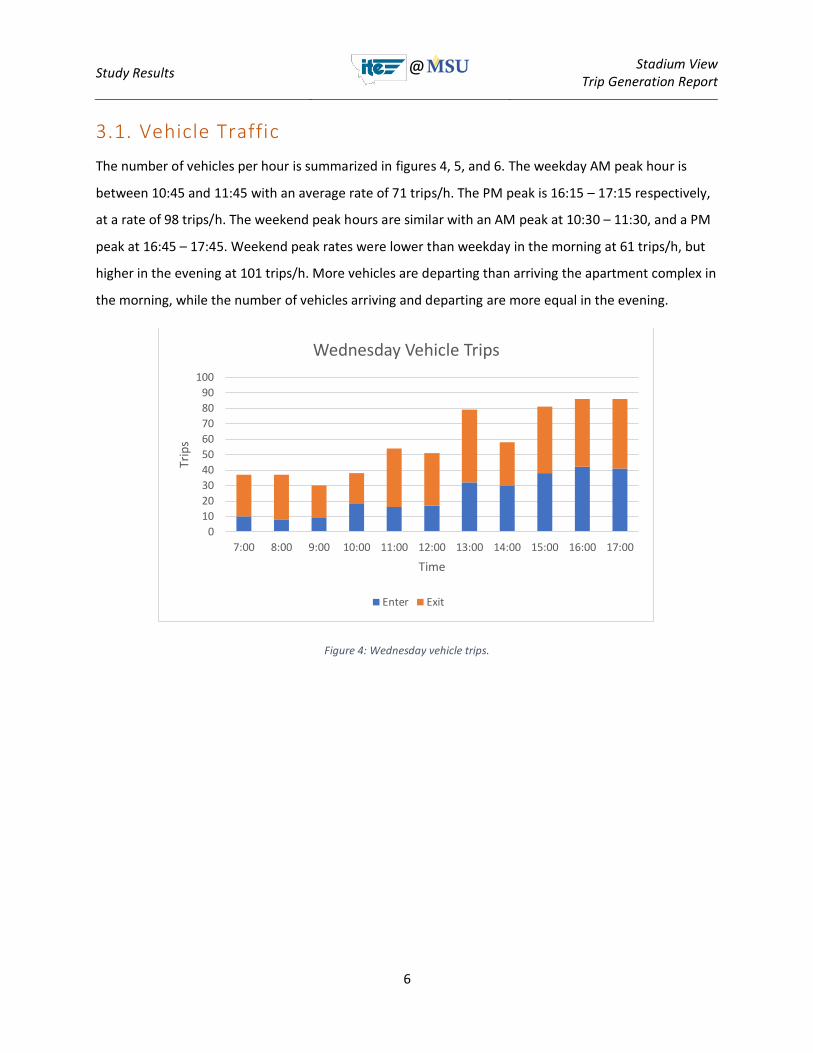
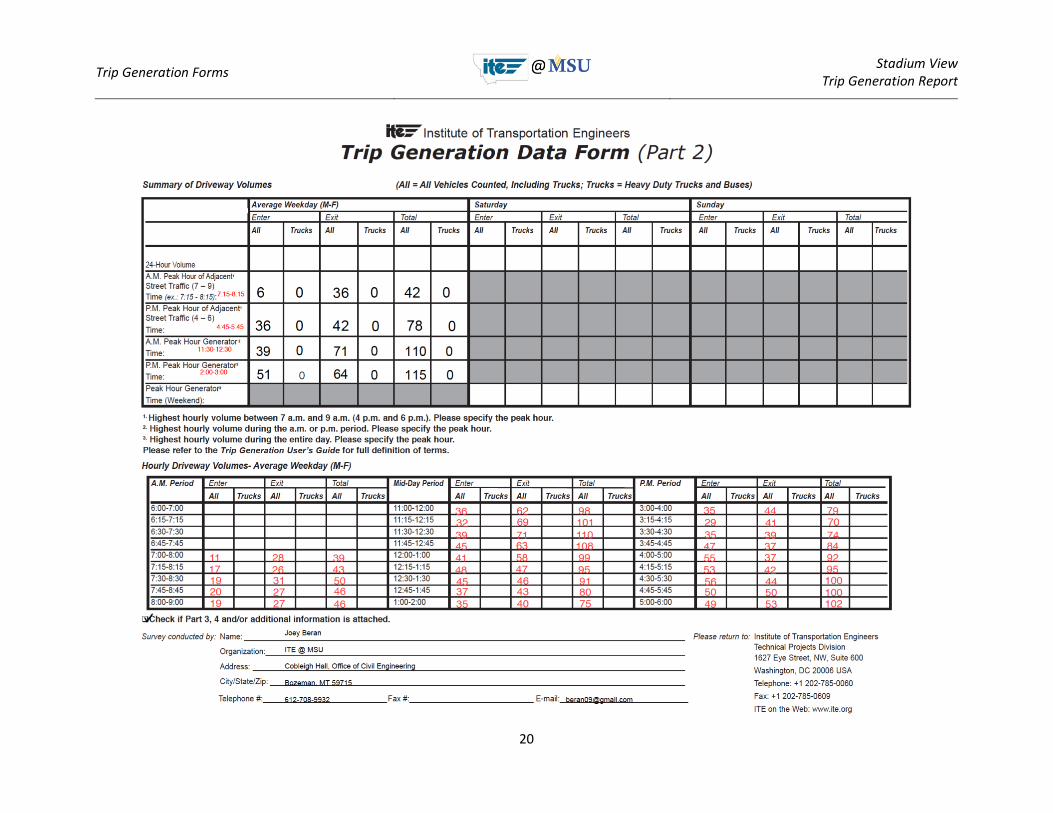
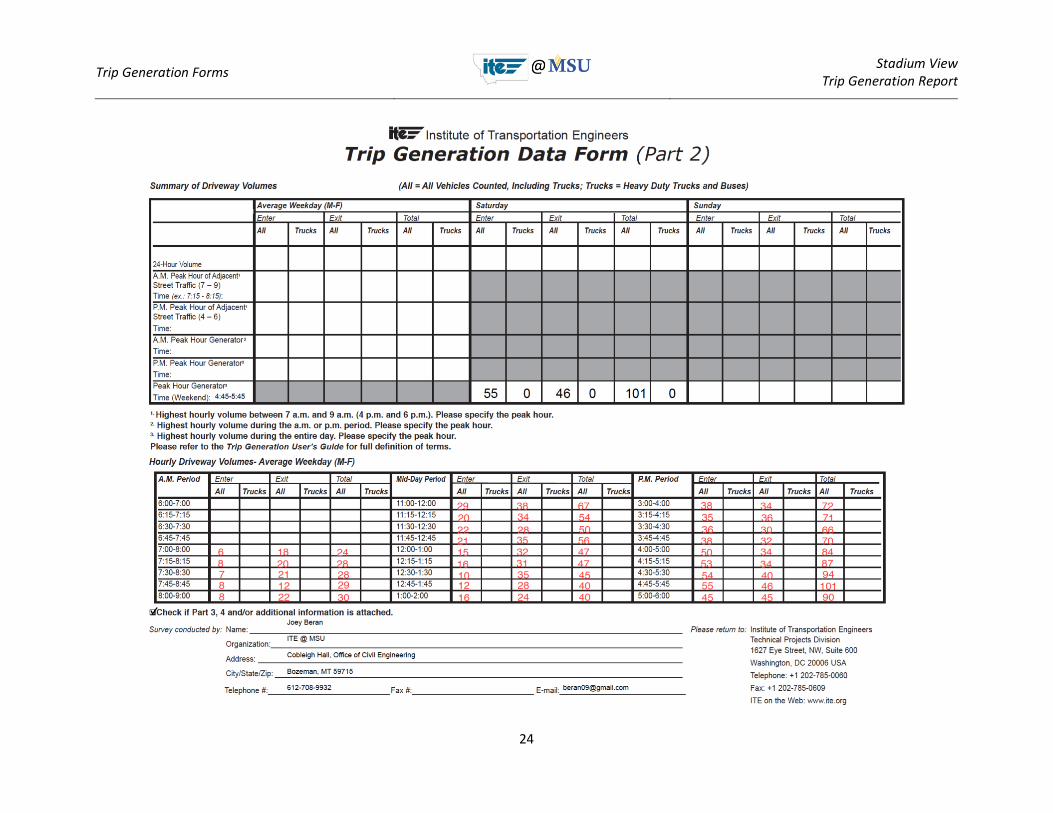
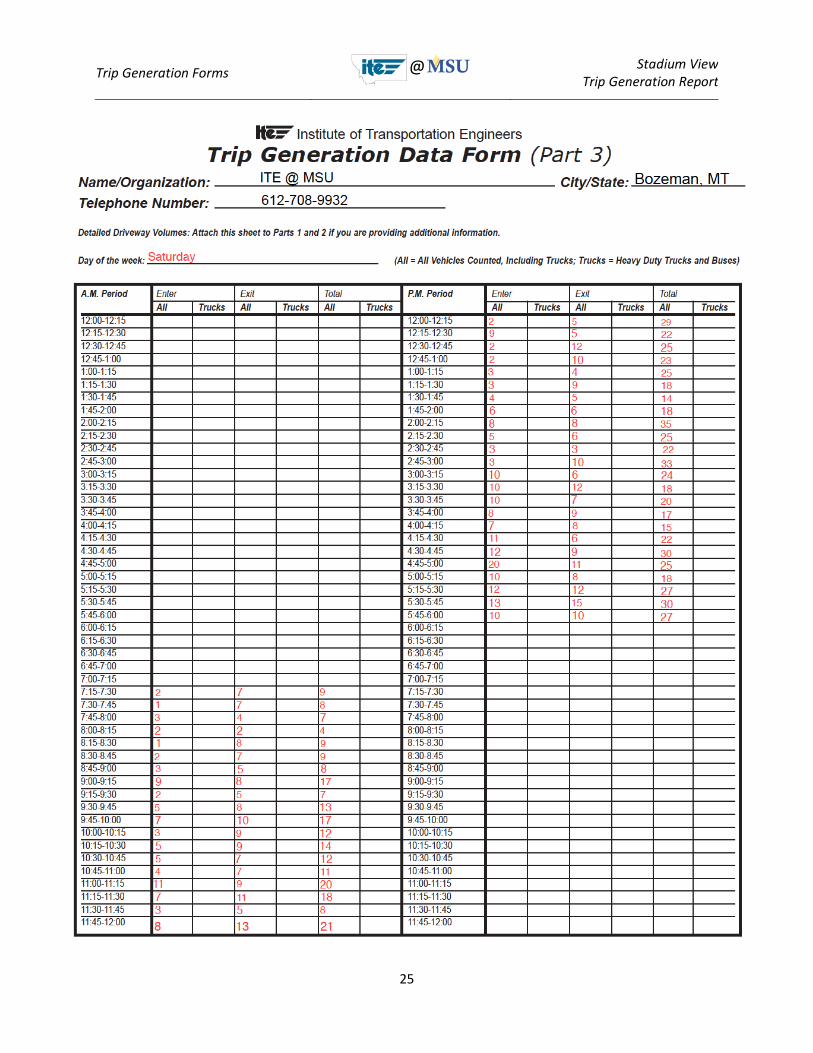
3.1. Vehicle Traffic
The number of vehicles per hour is summarized in figures 4, 5, and 6. The weekday AM peak hour is
between 10:45 and 11:45 with an average rate of 71 trips/h. The PM peak is 16:15 – 17:15 respectively,
at a rate of 98 trips/h. The weekend peak hours are similar with an AM peak at 10:30 – 11:30, and a PM
peak at 16:45 – 17:45. Weekend peak rates were lower than weekday in the morning at 61 trips/h, but
higher in the evening at 101 trips/h. More vehicles are departing than arriving the apartment complex in
the morning, while the number of vehicles arriving and departing are more equal in the evening.
Figure 4: Wednesday vehicle trips.
0
10
20
30
40
50
60
70
80
90
100
7:00 8:00 9:00 10:00 11:00 12:00 13:00 14:00 15:00 16:00 17:00
Trip
s
Time
Wednesday Vehicle Trips
Enter Exit
Study Results
Stadium View Trip Generation Report
7
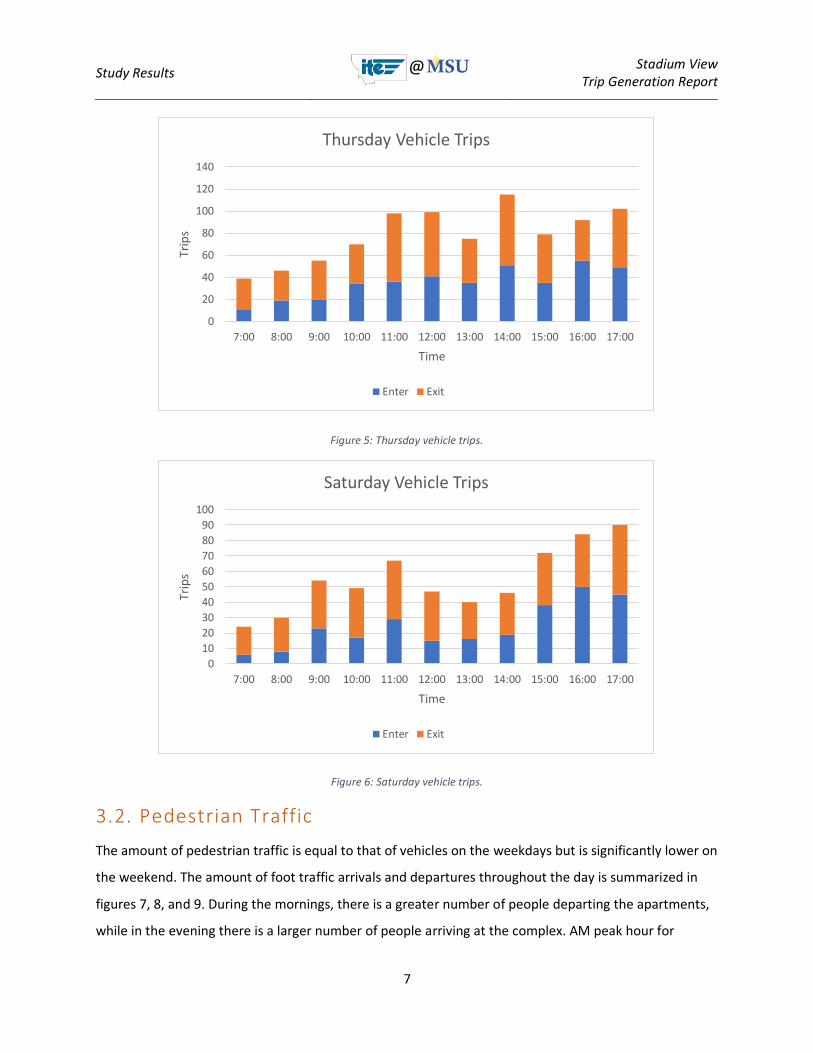
Figure 5: Thursday vehicle trips.
Figure 6: Saturday vehicle trips.
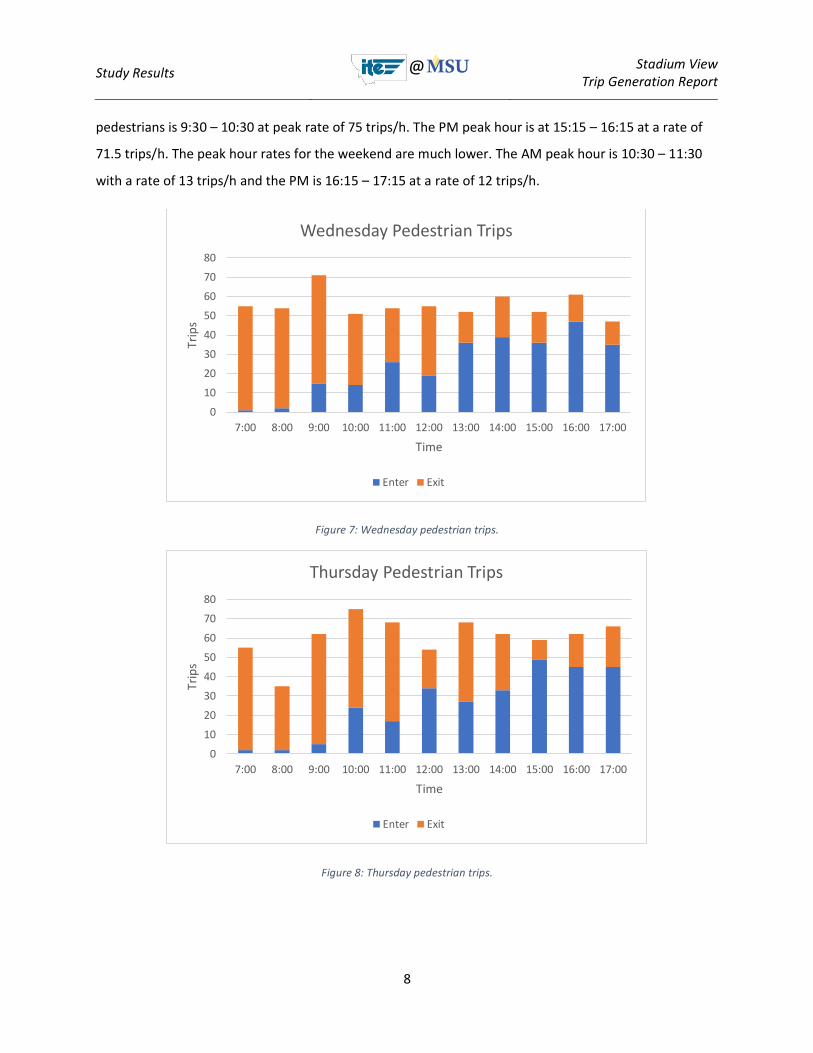
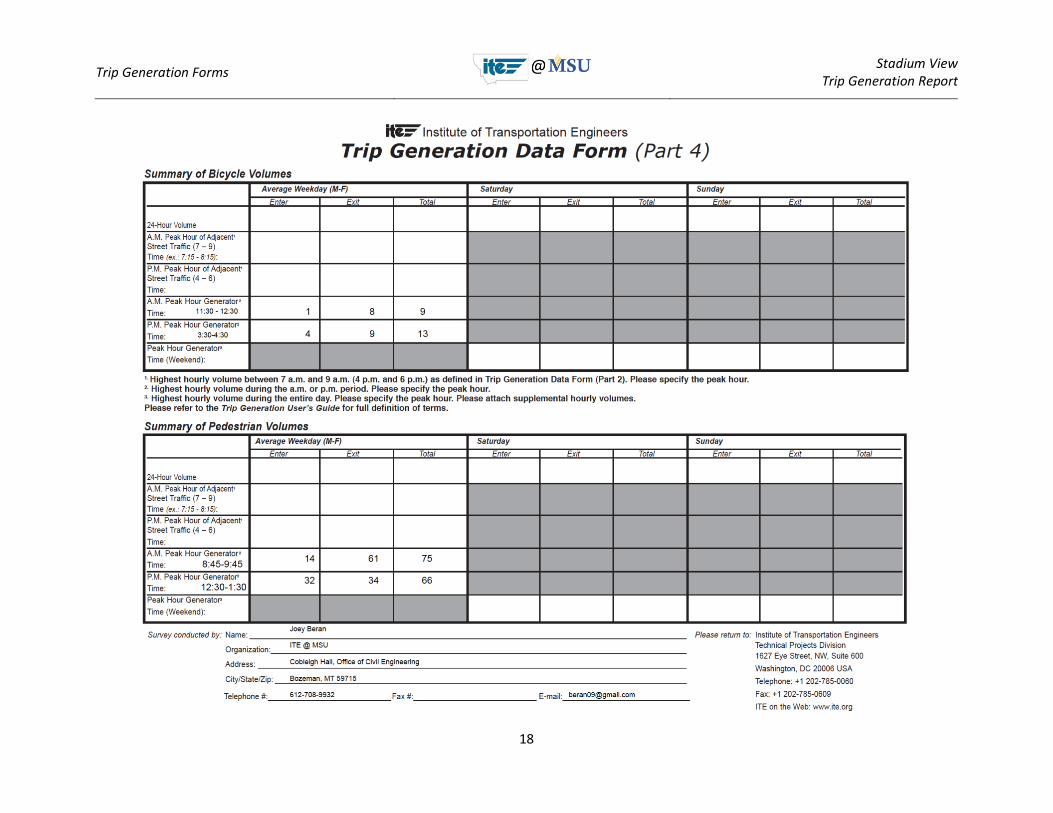
3.2. Pedestrian Traffic
The amount of pedestrian traffic is equal to that of vehicles on the weekdays but is significantly lower on
the weekend. The amount of foot traffic arrivals and departures throughout the day is summarized in
figures 7, 8, and 9. During the mornings, there is a greater number of people departing the apartments,
while in the evening there is a larger number of people arriving at the complex. AM peak hour for
0
20
40
60
80
100
120
140
7:00 8:00 9:00 10:00 11:00 12:00 13:00 14:00 15:00 16:00 17:00
Trip
s
Time
Thursday Vehicle Trips
Enter Exit
0
10
20
30
40
50
60
70
80
90
100
7:00 8:00 9:00 10:00 11:00 12:00 13:00 14:00 15:00 16:00 17:00
Trip
s
Time
Saturday Vehicle Trips
Enter Exit
Study Results
Stadium View Trip Generation Report
8
pedestrians is 9:30 – 10:30 at peak rate of 75 trips/h. The PM peak hour is at 15:15 – 16:15 at a rate of
71.5 trips/h. The peak hour rates for the weekend are much lower. The AM peak hour is 10:30 – 11:30
with a rate of 13 trips/h and the PM is 16:15 – 17:15 at a rate of 12 trips/h.
Figure 7: Wednesday pedestrian trips.
Figure 8: Thursday pedestrian trips.
0
10
20
30
40
50
60
70
80
7:00 8:00 9:00 10:00 11:00 12:00 13:00 14:00 15:00 16:00 17:00
Trip
s
Time
Wednesday Pedestrian Trips
Enter Exit
0
10
20
30
40
50
60
70
80
7:00 8:00 9:00 10:00 11:00 12:00 13:00 14:00 15:00 16:00 17:00
Trip
s
Time
Thursday Pedestrian Trips
Enter Exit

Study Results
Stadium View Trip Generation Report
9
Figure 9: Saturday pedestrian trips.
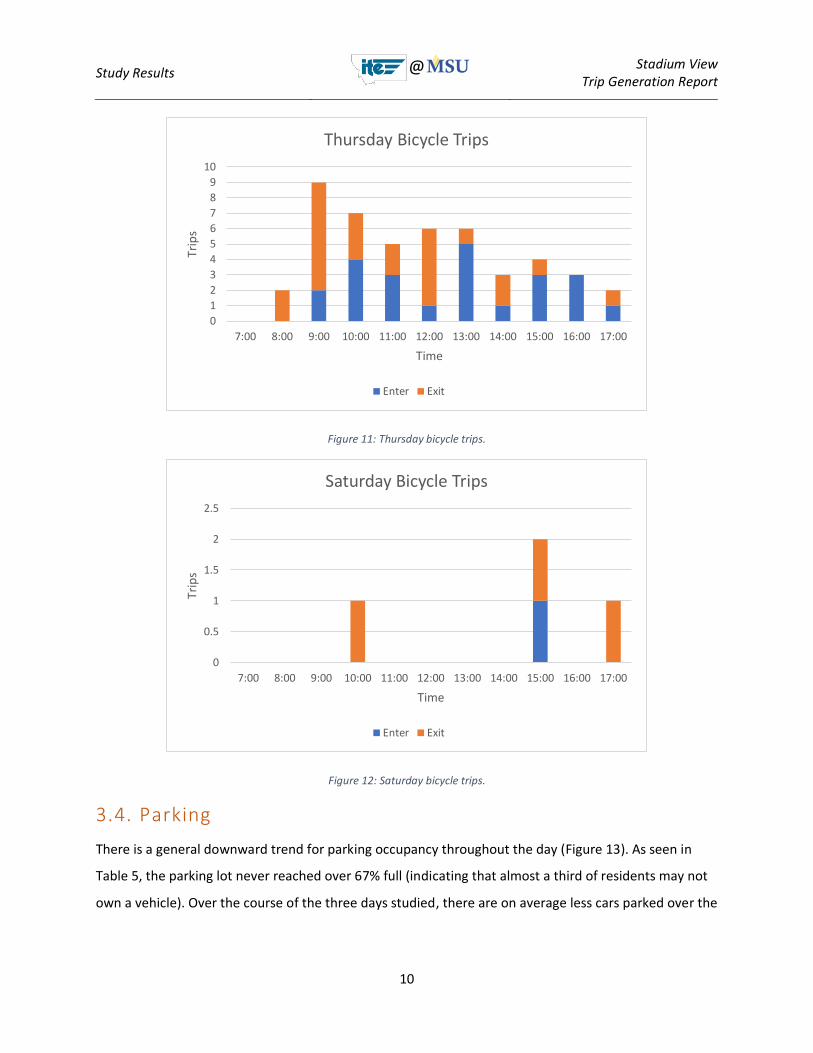
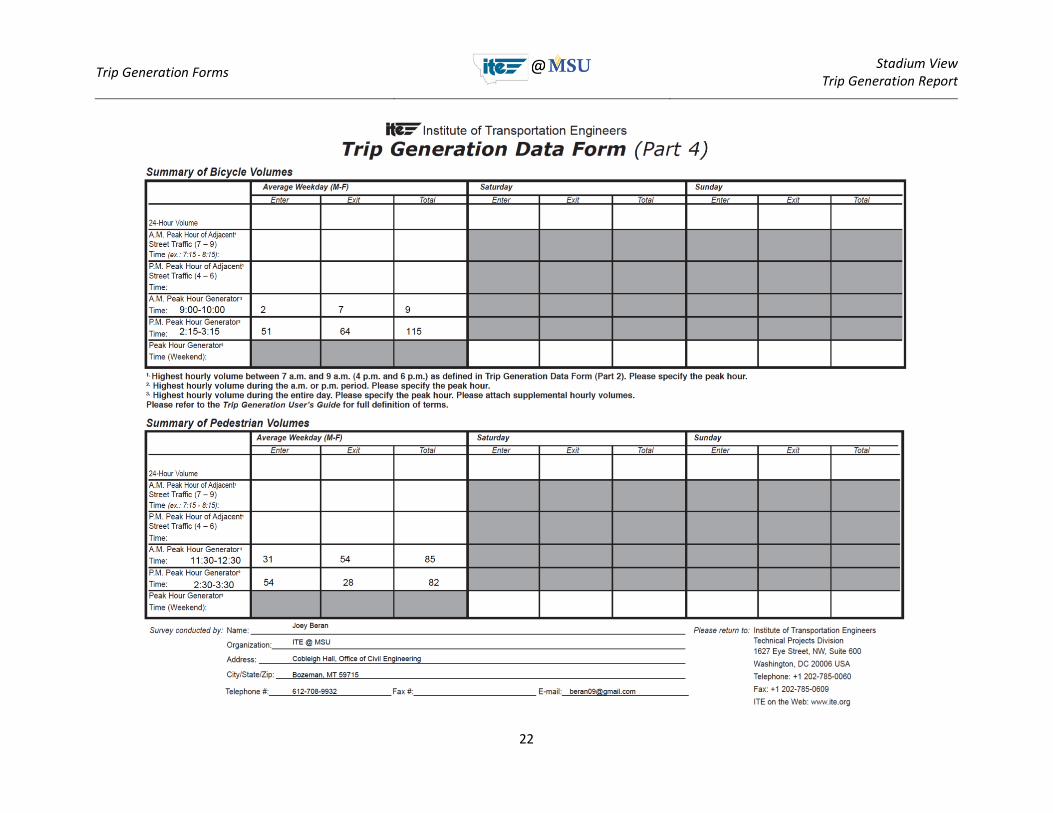
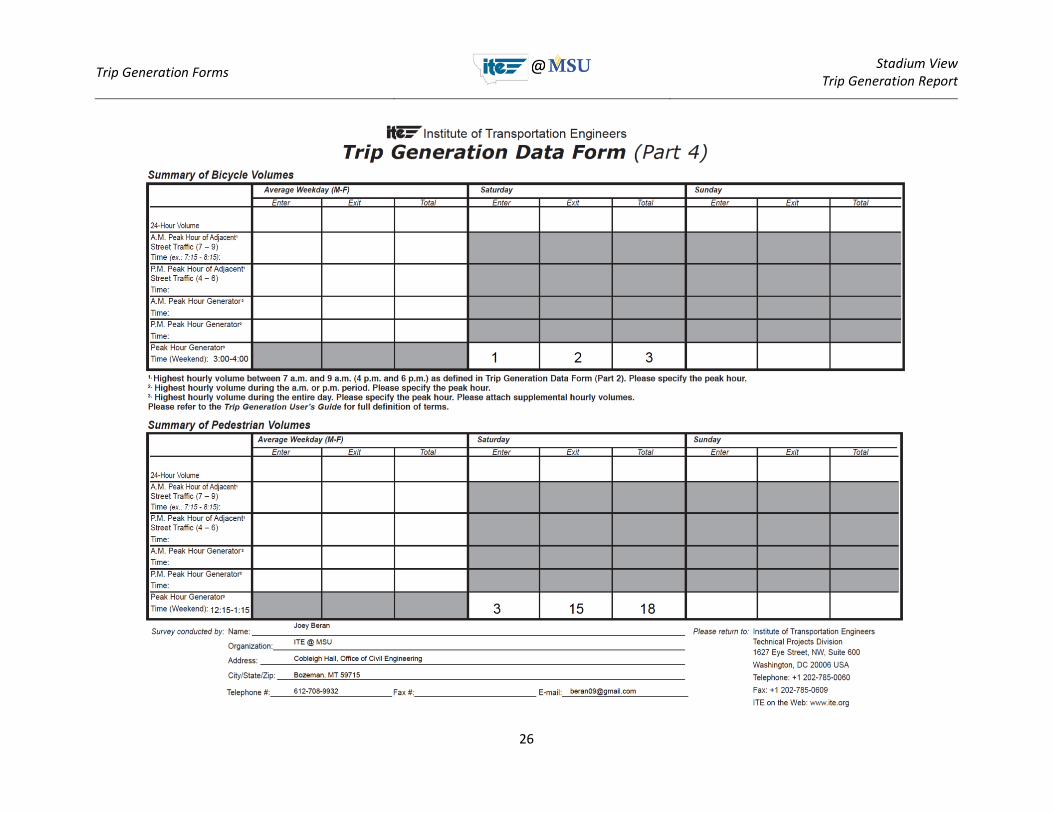
3.3. Bicycle Traffic
The amount of bicycle traffic had much lower trip generation compared to the other two modes of
transportation. The AM peak hour during the week is at 9:00 – 10:00 with a rate of 8 trips/h. The PM
peak hour is at 14:15 – 15:15 at a rate of 7 trips/h. There was minimal bicycle traffic during the weekend
with a total of 5 trips throughout the day.
Figure 10: Wednesday bicycle trips.
0
2
4
6
8
10
12
14
16
7:00 8:00 9:00 10:00 11:00 12:00 13:00 14:00 15:00 16:00 17:00
Trip
s
Time
Saturday Pedestrian Trips
Enter Exit
0
2
4
6
8
10
12
7:00 8:00 9:00 10:00 11:00 12:00 13:00 14:00 15:00 16:00 17:00
Trip
s
Time
Wednesday Bicycle Trips
Enter Exit
Study Results
Stadium View Trip Generation Report
10
Figure 11: Thursday bicycle trips.
Figure 12: Saturday bicycle trips.
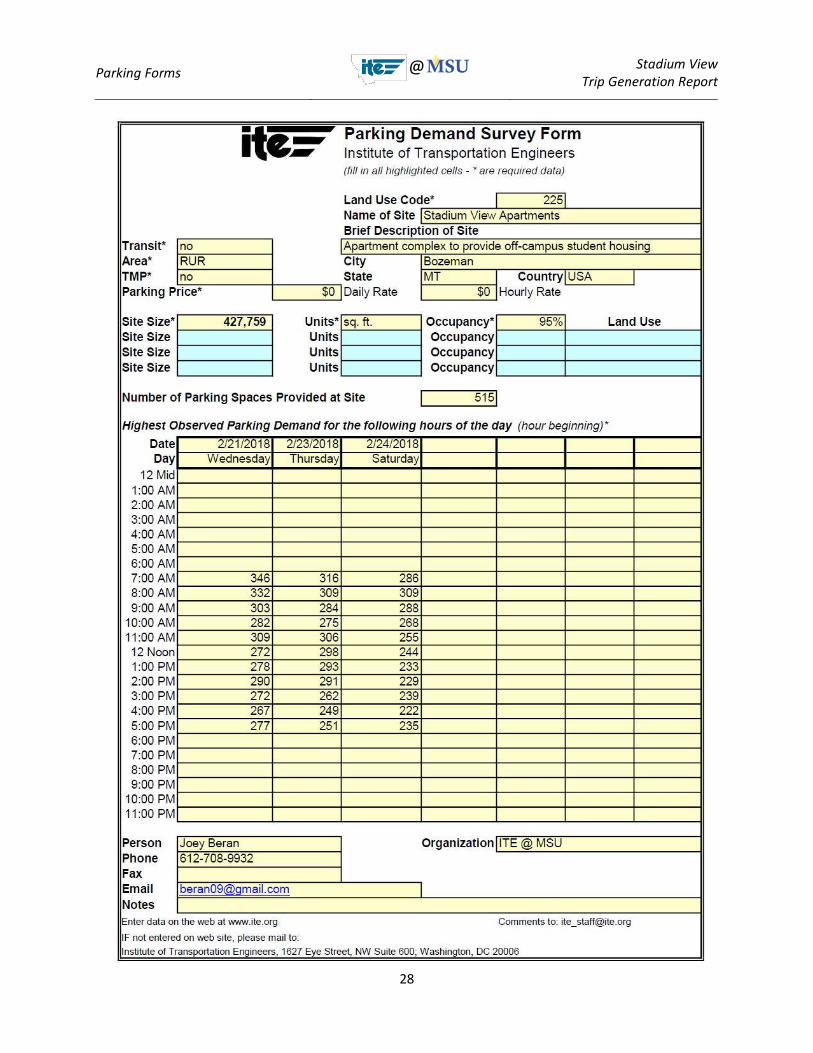
3.4. Parking
There is a general downward trend for parking occupancy throughout the day (Figure 13). As seen in
Table 5, the parking lot never reached over 67% full (indicating that almost a third of residents may not
own a vehicle). Over the course of the three days studied, there are on average less cars parked over the
0
1
2
3
4
5
6
7
8
9
10
7:00 8:00 9:00 10:00 11:00 12:00 13:00 14:00 15:00 16:00 17:00
Trip
s
Time
Thursday Bicycle Trips
Enter Exit
0
0.5
1
1.5
2
2.5
7:00 8:00 9:00 10:00 11:00 12:00 13:00 14:00 15:00 16:00 17:00
Trip
s
Time
Saturday Bicycle Trips
Enter Exit

Study Results
Stadium View Trip Generation Report
11
weekend than during the week. Note that with 515 spaces provided for 130 dwelling units, there is a
parking supply ratio of 4 spaces per dwelling unit.
ITE Parking Generation does not have student housing as a land use category. Land use category 221:
Low/Mid-Rise Apartments for suburban land use has an 85th percentile parking demand ratio of 1.94
vehicles/DU, which is below the observed demand ratios for this site.
Figure 13: Parking lot occupancy for each hour of study.
Table 5: Maximum parking supply ratio for each day.
Date Peak
Parking Observed
Parking Supply
(# of spaces)
Parking Occupancy
%
Parking Demand Ratio
(Per Dwelling Unit)
Wednesday 346 515 67% 2.7
Thursday 316 515 61% 2.4
Saturday 309 515 60% 2.4 * Parking Generation for Land Use Code 225 not found
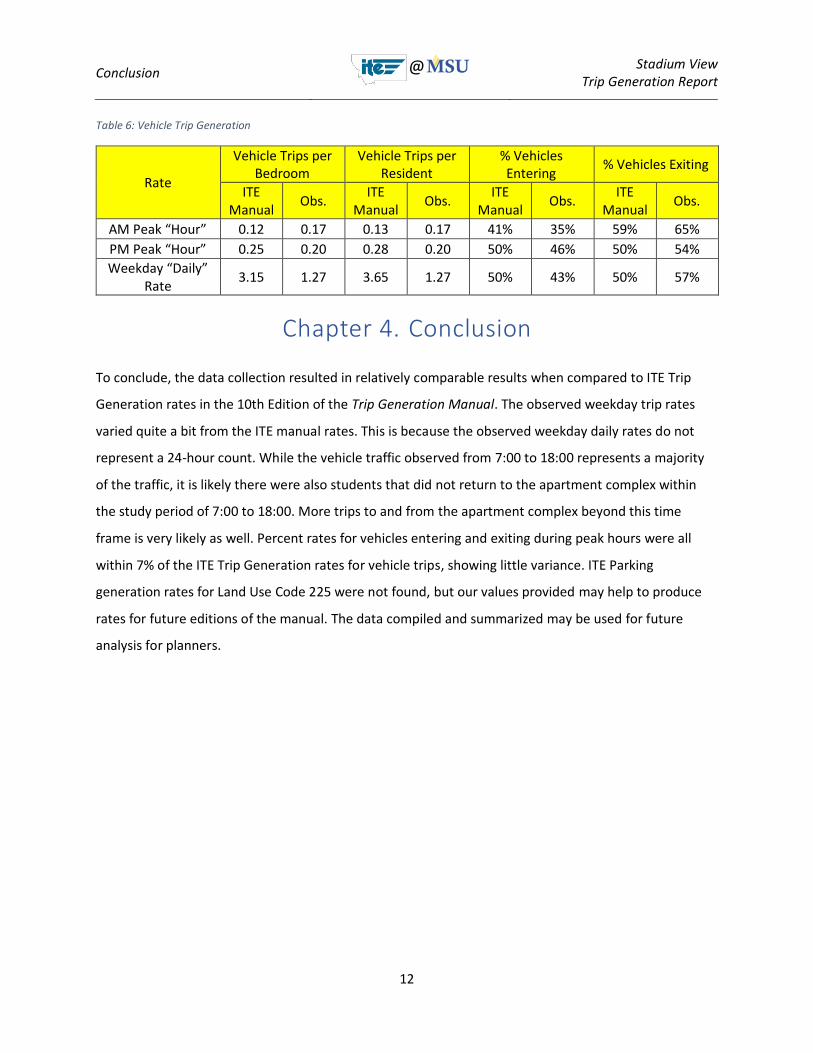
Below in Table 6 is the Vehicle Trip Generation Peak Hour Generator values using the 10th Edition of the
ITE Trip Generation Manual. This was done based Land Use Code 225: Off-Campus Student Apartment.
Unfortunately there is no data from ITE that provides person trips for this specific land use. Therefore,
only comparison between vehicle trips was done.
200
220
240
260
280
300
320
340
7:00 8:00 9:00 10:00 11:00 12:00 13:00 14:00 15:00 16:00 17:00
Veh
icle
s
Time of Day
Parking Occupancy
Wednesday
Thursday
Saturday
Average
Conclusion
Stadium View Trip Generation Report
12
Table 6: Vehicle Trip Generation
Rate
Vehicle Trips per Bedroom
Vehicle Trips per Resident
% Vehicles Entering
% Vehicles Exiting
ITE Manual
Obs. ITE
Manual Obs.
ITE Manual
Obs. ITE
Manual Obs.
AM Peak “Hour” 0.12 0.17 0.13 0.17 41% 35% 59% 65%
PM Peak “Hour” 0.25 0.20 0.28 0.20 50% 46% 50% 54%
Weekday “Daily” Rate
3.15 1.27 3.65 1.27 50% 43% 50% 57%
Chapter 4. Conclusion
To conclude, the data collection resulted in relatively comparable results when compared to ITE Trip
Generation rates in the 10th Edition of the Trip Generation Manual. The observed weekday trip rates
varied quite a bit from the ITE manual rates. This is because the observed weekday daily rates do not
represent a 24-hour count. While the vehicle traffic observed from 7:00 to 18:00 represents a majority
of the traffic, it is likely there were also students that did not return to the apartment complex within
the study period of 7:00 to 18:00. More trips to and from the apartment complex beyond this time
frame is very likely as well. Percent rates for vehicles entering and exiting during peak hours were all
within 7% of the ITE Trip Generation rates for vehicle trips, showing little variance. ITE Parking
generation rates for Land Use Code 225 were not found, but our values provided may help to produce
rates for future editions of the manual. The data compiled and summarized may be used for future
analysis for planners.
Conclusion
Stadium View Trip Generation Report
13
4.1. Special Thanks
ITE @ MSU would like to give special thanks to the following individuals for their valuable help in
completing this project.
Danae Giannetti - Project Mentor, Montana Dept. of Transportation-Bozeman Design Unit
ITE @ MSU Members
• Joey Beran
• Matthew Campbell
• Matthew Bell
• Alia Peterson
• Bryce Grame
• Madeline Pernat
• Jaden Stewart
• Aldo Videa
• Wilson D’Souza
Faculty Mentors – MSU
• Ahmed Al-Kaisy
• Yiyi Wang
Doug Smith - MSU Surveying Instructor
Sanderson Stewart – Bozeman, MT office
ITE Professionals
• Lisa Fischer - Montana Chapter Vice President
• Cameron Waite - Intermountain District Past President
MSU Students
• Sarah Forseth
• Abram French
• Daniel Smithgall
• Nathan Ellis
• Audrey Stoltzfus
Trip Generation Forms
Stadium View Trip Generation Report
14
Appendix A. Trip Generation Forms
Trip Generation Forms
Stadium View Trip Generation Report
15

Trip Generation Forms
Stadium View Trip Generation Report
16

Trip Generation Forms
Stadium View Trip Generation Report
17
Trip Generation Forms
Stadium View Trip Generation Report
18

Trip Generation Forms
Stadium View Trip Generation Report
19
Trip Generation Forms
Stadium View Trip Generation Report
20

Trip Generation Forms
Stadium View Trip Generation Report
21
Trip Generation Forms
Stadium View Trip Generation Report
22

Trip Generation Forms
Stadium View Trip Generation Report
23
Trip Generation Forms
Stadium View Trip Generation Report
24
Trip Generation Forms
Stadium View Trip Generation Report
25
Trip Generation Forms
Stadium View Trip Generation Report
26
Parking Forms
Stadium View Trip Generation Report
27
Appendix B. Parking Forms
Parking Forms
Stadium View Trip Generation Report
28