stable-isotope labeling by amino acids in cell culture … · possible to use mass analyzers that...
TRANSCRIPT

Swammerdam Institute for Life Sciences
Stable-isotope labeling by amino acids in
cell culture (SILAC)
Literature thesis MSc Chemistry, track Analytical Sciences
15 June 2009
Robin van der Ploeg (0312592)
Supervisor: Prof. dr. C.G. de Koster
Second reviewer: dr. W. Th. Kok

2
Abstract
Stable isotope labeling by amino acids in cell culture (SILAC) is a relatively new mass
spectrometry-based method in proteomics. In a typical SILAC experiment, a cell culture
is grown on a medium with isotope labeled amino acids. During the time the cell culture
spends on the medium, proteins will be synthesized from the labeled amino acids. The
ratios of peak abundances of labeled and unlabeled peptides in the mass spectra can be
used to quantify protein turnover. In this literature thesis the reliability of published
SILAC measurements will be investigated. Also, dynamic SILAC experiments and
applications in biology and medicine will be discussed.
Samenvatting
Stable isotope labeling by amino acids in cell culture (SILAC) is een relatief nieuwe, op
massaspectrometrie gebaseerde methode in proteomics. In een typisch SILAC experiment
wordt een cultuur cellen gekweekt op een medium met isotoopgelabelde aminozuren.
Gedurende de tijd dat de cellen op het medium groeien worden de nieuwe eiwitten
gesynthetiseerd uit gelabelde aminozuren. De piekverhoudingen tussen de gelabelde en
de ongelabelde peptiden in de massaspectra kunnen gebruikt worden om de omzetting
van eiwitten te kwantificeren. In deze literatuurscriptie zal de betrouwbaarheid van
gepubliceerde SILAC metingen onderzocht worden. Ook zullen dynamische (tijd
opgeloste) SILAC experimenten en toepassingen in biologie en geneeskunde worden
besproken.

3
Table of contents
Abstract ............................................................................................................................... 2
Samenvatting....................................................................................................................... 2 Table of contents ................................................................................................................. 3 1. Introduction ................................................................................................................. 4
1.1 Classical protein analysis .......................................................................................... 4 1.2 Chemical labeling techniques ................................................................................... 5
2. Description of SILAC .................................................................................................. 7
3. Research question ...................................................................................................... 10 4. Analytical Parameters ................................................................................................ 11
4.1 Experimental errors introduced by sample preparation .......................................... 12 4.2 Role of the mass analyzer ....................................................................................... 13 4.3 Accuracy study with
13C6-arginine ......................................................................... 14
4.4 Absolute quantitation and the dynamic range ......................................................... 16
5. The heat shock response as a potential application field for SILAC ............................ 17 5.1 Quantitation of dynamic SILAC measurements ..................................................... 18
5.2 Some examples of dynamic SILAC ........................................................................ 19 6. Static SILAC.............................................................................................................. 24 7. Applications in biology and medicine ....................................................................... 26
8. Conclusions ............................................................................................................... 27
9. References ................................................................................................................. 28

4
1. Introduction
The collection of genes in a cell is called the genome. Humans have 24,000 genes made
up of 3,200,000,000 base pairs [1]. The genome itself is only able to store and replicate
genetic information. Cells have the ability to transcribe the genetic information encoded
in the DNA (deoxyribonucleic acid) to messenger RNA (ribonucleic acid). The entire
collection of the mRNA molecules in a cell is called the transcriptome. The mRNA is
then translated into proteins, which can fulfill tasks inside the cell such as catalyzing
metabolic reactions, being a part of signaling networks, serve as chemical sensors or form
structural elements.
The proteome is the entire collection of proteins that are expressed in a cell. As a result of
alternative splicing and post-translational modifications, the human proteome is at least
ten times larger than the genome. The expressed proteins differ in copy number, place in
the cell and in time. In human serum for example, it has a dynamic range in
concentrations of 1012
and changes every moment as a result of external and internal
stimuli [2].
The genomes of many organisms have been sequenced and the mRNA of the
transcriptome can be studied with micro array technology. However, there are several
reasons why the use of mRNA measurements has its limitations [3]. Firstly, there is no
1:1 correlation between the presence of mRNA and the protein concentration. Secondly,
certain disease processes only involve changes in protein activity and none in mRNA
activity. Drugs acting on disease mechanisms are normally designed to target proteins,
not mRNA. Thirdly, protein concentrations in clinical samples are more stable than
mRNA concentrations. Fourthly, proteins fulfill a variety of functions in a cell, whereas
mRNA is, as the name implies, just a messenger.
1.1 Classical protein analysis
All proteins have residues that can be neutral, positively or negatively charged. For every
protein there exists a pH at which the average charge is zero. This is called the isoelectric
point (pI). With isoelectric focusing (IEF) proteins can be separated according to their pI.
It is performed by casting a gel made of either agarose or polyacrylamide with a pH
gradient. This can be done by either suspending amphoteric molecules in the gel or
charging the side groups of the polyacrylamide with a gradient of strong acid or base. The
protein mixture is injected into the gel and a voltage is applied. As a result of their net
charge the proteins will move to the region in the gel where the pH equals their pI.
Proteins can also be separated with a technique called SDS polyacrylamide-gel
electrophoresis (SDS-PAGE). It involves injecting the protein sample into a gel
consisting of a cross-linked polyacrylamide. The proteins are solubilized with SDS, a
negatively charged surfactant. The solubilized proteins are injected into the gel and when
a voltage is applied, the proteins start migrating towards the cathode (positive pole). The
friction that each protein endures is dependent on the pore size of the gel and the size of

5
the proteins. Small proteins endure less friction and migrate further through the gel than
large proteins. The method can be calibrated with standard mixtures of proteins of known
molecular weights (MWs).
More proteins can be analyzed at once when these two techniques are combined. IEF can
be used as a first-dimension separation and SDS-PAGE as second dimension separation
to form Two-dimensional Gel Electrophoresis (2D-E) [4]. 2D-E was developed by
O‟Farrel in 1975 [5] and can separate up to 2500 proteins. The proteins can be made
visible selectively with Western blotting, or non-selectively with for example Coomassie
Blue.
2D-E however, has its limitations. First, membrane proteins are hydrophobic and
aggregate in the first dimension gels, leaving them out of the analysis. Second, only the
most abundant proteins can be seen with the staining technique. The large dynamic range
of the proteome causes the least abundant proteins to be invisible with this technique.
Quantification based on blot intensities has a limited precision. Third, very basic and very
acidic proteins fall outside the pI range that can be separated.
At present, mass spectrometry (MS) is the technique of choice for qualitative and
quantitative measurements in proteomes. The ionization techniques most often used for
biomacromolecules are matrix-assisted laser desorption-ionisation (MALDI) and
(nano)electrospray ionization ((n)ESI). 2D-E is often combined with MS by cutting out a
spot of interest in the gel, subjecting it to trypsine digestion and either directly placing the
sample on a MALDI plate or first subjecting the peptide mixture to a separation in the
liquid phases before mass spectrometric detection (LC-MS). In the latter mode it is also
possible to use mass analyzers that allow several mass analysis steps to form LC-MS/MS
or LC-MSn.
1.2 Chemical labeling techniques
Mass spectrometry is not in itself inherently quantitative. Different molecules in a sample
have different ionization efficiencies, resulting in different sensitivities. Stable isotope
labeled analogs of substances have been used as standards for quantitative measurements
with mass spectrometry for a long time. Because isotope labeled molecules have similar
physical, chemical and biological properties as the natural form, they are ideal as internal
standards.
Chemical techniques that enable quantitative protein analysis in mass spectrometry have
recently been developed and the following will be discussed below: Isotope-encoded
affinity tags (ICAT), 18
O labeling and Stable Isotope Labeling by Amino Acids in Cell
cultures (SILAC). Isobaric Tag for Relative and Absolute Quantitation (iTRAQ) is also a
chemical labeling technique but will not be discussed in this work.

6
ICAT was developed by Aebersold et al. in 1999 [6]. It exists of three elements (Figure
1): the biotina end group, a linker that can be labeled with heavy or light isotopes and a
group that is reactive towards the thiol group in cysteine.
Figure 1: ICAT reagent [6]
In an ICAT experiment, two cell cultures are grown in parallel (Figure 3). After
extraction, the protein contents are reduced so that cysteine residues exist as free thiol
groups. The heavy and light isotope labeled ICAT reagents are added to the two cell
cultures respectively. After the labeling step, the two samples are combined and the
proteins are digested with a proteolytic enzyme. The resulting lysate is purified by
affinity chromatography using an avidinb column. The purified peptides are then analyzed
with LC-MS. Using the extracted ion chromatograms (XIC), the ratio between peak
intensities of the light reagent in the one cell culture and the heavy reagent in the other
culture can be used to determine the fold ratio of protein concentrations in the two cell
cultures (Figure 2).
Figure 2: determination of fold ratios from the XIC [7]
Another technique for isotope labeling is by enzymatic degradation in 18
O labeled water
[8]. Again, two cell cultures are grown in two different states. The proteins of one cell
culture are digested with trypsin in water with a natural H218
O / H216
O ratio and the other
a Biotin is also known as vitamin H or B7.
b Avidin is a biotin binding protein that naturally occurs in the oviducts of birds, reptiles and amphibians.

7
is digested with trypsin in water with an artificially high H218
O / H216
O ratio. Upon
digestion, 16
O atoms are built into the peptides in the one sample and 18
O atoms into the
other. The cell lysate can be analyzed with LC-MS and from the XICs of the peptides the
fold ratios of the 18
O / 16
O peptides, the fold ratio of the proteins can be determined.
2. Description of SILAC
In the techniques described above the molecules of interest are subjected to chemical
reactions. This introduces a source of errors, id est the efficiency of the derivatization
reaction can be lower than 100%. Other ways to incorporate a label into living organisms
is by metabolic labeling. This has historically been done with unstable isotopes of amino
acids of which the radioactive decay could be measured in time, so-called pulse-chase
labeling. 35
S labeled methionine can be used for this purpose. In such an experiment [9], a
cell culture is first starved on a methonine-free medium for some time and then briefly
placed on a 35
S methionine containing medium (the pulse). Samples are taken in time and
from the increase in radioactivity, synthesis constants can be determined.
In the chase mode, the cell culture is grown on 35
S labeled methionine until all
methionines are labeled. The cells are then resuspended into a medium with unlabeled
amino acids. From the decrease in radioactivity of a time series of samples, the
degradation constants can be determined. The measurements in both cases can be done by
precipitating the whole protein contents of the samples or by first separating the proteins
by 2-DE and selecting a certain proteins of interest.
When grown on 15
N containing salts, simple organisms like bacteria and yeast will
incorporate 15
N into their proteins which can be measured with MS [7]. This method has
the limitation that the mass difference in peptides depends on the amino acid sequence of
the peptide.
In the technique stable isotope labeling by amino acids in cell culture, SILAC, stable
isotopes are incorporated in the cells via the metabolism. SILAC was first described by
Ong et al. [10] in 2002.
A typical SILAC experiment starts with growing two cell cultures. One cell culture is
grown in a medium in which one or two amino acids are replaced by a stable isotope
labeled amino acid. A wide variety has been used in the literature: 13
C6-arginine, D3-
leucine, D10-leucine, D4-lysine 13
C6-lysine or D8-valine are examples where one element
is labeled with a heavy isotope. 15
N212
C6-lysine, 15
N213
C6- lysine and 15
N413
C6-arginine
are examples where two different elements are labeled. The choice of isotope labeled
amino acid is not arbitrary. Four factors are taken into account. First, arginine and lysine
are often used because trypsin cleaves proteins and peptides after the carboxyl ends of
these amino acids except when it is adjacent to a proline. Second, the abundance in
peptides matters. Arginine for example occurs in 52% of all peptides of five amino acids
or longer. Third, when a reversed phase separation step is used in the analysis, the labeled
and the unlabeled peptides of arginine coelute, thus facilitating the analysis. With leucine
this is not the case: the labeled and the unlabeled peptides can differ in retention time,

8
caused by the replacement of hydrogen atoms by deuterium atoms. Fourth, the mass
accuracy of the mass analyzer is taken into account. The mass difference between leucine
and D3 leucine is 3 Da whereas between arginine and 13
C6-arginine it is 6 Da. A larger
mass difference minimizes the chance of overlapping signals in the mass spectrum.
The other cell culture is grown with native, unlabeled amino acids. During the time the
cells spend in the medium, the cell‟s metabolism incorporates the labeled amino acids
into the proteins it synthesizes. The newly formed proteins have a predictable mass
difference, for example plus 3 Da for every D3-leucine.
Essential amino acids (those that cannot be synthesized by the cell itself) such as arginine
will be incorporated. Non-essential amino acids will also be incorporated if available in
high concentrations.
One exception of an amino acid that is often used in SILAC that can be metabolized into
proline is arginine [11]. This is however not a problem in quantitation: the labeled
prolines that are found in MS are distinguishable from natural proline.
After several cell doublings, the complete proteome of the cells will contain the kind of
labeled or unlabeled amino acids that are available in the medium. After optional
purification by for example ultrafiltration, the samples are combined and digested with
trypsin. The resulting tryptic digest is analyzed by LC-MS. The labeled and the unlabeled
peptides are separated in the mass analyzer. A labeled peptide with one leucine for
example will have a peak 3 Da higher than its unlabeled counterpart, see Figure 4.
In contrast to ICAT, no chemical labeling step or affinity purification step is required.
The workflows of SILAC and ICAT are shown next to each other in Figure 3 to show the
difference in required steps. Note that in SILAC the sample handling of the cell cultures
is done simultaneously whereas in ICAT the handling has to be done parallel and exactly
in the same way to allow relative quantitation. This results in a better chance of
reproducing experiments accurately. Another difference is that SILAC uses the
metabolism of a cell whereas ICAT can also be used on a nonliving biological sample.
Isotope-labeled amino acids are commercially available and quantitation is
straightforward, see Figure 4. The peak intensities can be compared in time, thus giving a
measure for how fast a protein is synthesized or degraded. The time resolved variant of
SILAC, or dynamic SILAC will be discussed in paragraph 5.

9
Figure 3: Comparison of SILAC and ICAT labeling [10]

10
Figure 4: Incorporation of D3-leucine in a protein in a SILAC experiment [10]. The peptide in
question is the triply charged APEEHPVLLTEAPLNPK, containing 3 leucines. The signal marked
with the * is an unrelated peptide.
3. Research question
An important issue that has been identified is the reliability of the experiments. In this
work it will be assessed whether there is an agreed way to report the reliability of data.
More questions rose and will also be discussed. What is the effect of sample preparation
on the experimental error in the intensity ratio measurements? How can experimental
errors be reduced to a minimum? Which mass analyzer is to be preferred? Several studies
will be evaluated regarding how they report analytical parameters such as precision and
dynamic range.
There is a need for techniques that obtain time resolved quantitative information about
the concentration of proteins in a cell. The heat shock response (HSR) will be introduced
as a potential application field for SILAC. The events in this pathway take place in on a
timescale of several minutes. However, in many SILAC experiments the timescales are in
the order of days rather than minutes. The suitability of SILAC as an analytical technique
for this phenomenon will be evaluated by looking at the timescales of several studies
Because there has also been a substantial amount of SILAC research wherein two cell
cultures are compared in a steady-state fashion, experiments of this type will also be
discussed.

11
4. Analytical Parameters
The International Union of Pure and Applied Chemistry (IUPAC) has devised standards
to report numerical outcomes and the statistical certainty of experimental work
unambiguously. Definitions used in this work are stated in Table 1.
Table 1: IUPAC definitions for the presentations of results
Term Definition Source
Accuracy The closeness of agreement between a test result and the true
value.
[12]
Precision The closeness of agreement between independent test results
obtained by applying the experimental procedure under
stipulated conditions. A measure of precision (or
imprecision) is the standard deviation.
[12]
Repeatability The closeness of agreement between independent results
obtained with the same method on identical test material,
under the same conditions (same operator, same apparatus,
same laboratory and after short intervals of time).
[12]
Reproducibil
ity
The closeness of agreement between independent results
obtained with the same method on identical test material but
under different conditions (different operators, different
apparatus, different laboratories and/or after different
intervals of time).
[12]
Sensitivity in
analytical
chemistry
The slope of the calibration curve. If the curve is in fact a
„curve‟, rather than a straight line, then of course sensitivity
will be a function of analyte concentration or amount.
http://www.iu
pac.org/goldbo
ok/S05606.pdf
Sensitivity in
MS
IUPAC has the following addition to the definition of
sensitivity in MS: “[Sensitivity] depends upon the observed
change in ion current for a particular amount or change of
flow rate of sample though the ion source.”
http://goldboo
k.iupac.org/S0
5605.html
Dynamic
range
The ratio between the maximum usable indication and the
minimum usable indication (detection limit). A distinction
may be made between the linear dynamic range, where the
response is directly proportional to concentration, and the
dynamic range where the response may be non-linear,
especially at higher concentrations.
http://goldboo
k.iupac.org/D0
1874.html
Mass
accuracy
The mass accuracy indicates the accuracy of the m/z
provided by the mass analyzer and is often expressed in
parts per million (ppm). It is largely dependent on the
resolution.
[13]
Resolution R = m / Δm where m is the mass and Δm is the width of the
peak at 50% of its maximum.
[13]
In the context of SILAC, actual repeatability is ideally measured by repeating both the
instrumental part (i.e. the gel electrophoresis separation and LC-MS(-MS)) and the
biological part (the growing of cell cultures under specific conditions) of the experiment.
12
In reality, this is not always the case. Blagoev et al. [14] for example, report SILAC
ratios with relative standard deviations of proteins based on the SILAC ratios of the
peptides belonging to the proteins. No mention is made of repeating the biological part of
the experiment.
Reproducibility is measured under different conditions as can be read in Table 1. There
are many examples in the literature where the authors deviate from this definition and
write about reproducibility where repeatability is actually the better term according to the
IUPAC definition. Kim et al. [15] for example compare quantitative results between
different labeling strategies SILAC, ICAT and decoupled labeling. No other labs are
mentioned in the article, so it is assumed that they actually intended to investigate
repeatability.
4.1 Experimental errors introduced by sample preparation
Zhang et al. [16] have investigated the errors in measured SILAC ratios introduced with
sample preparation steps by experimental design. Since the sample preparation of the
labeled and unlabeled cell culture are mixed and done in one go, the experimental error
can be smaller than with chemical labeling techniques where the sample preparation is
done in parallel. The more steps are performed the larger the error. Although
experimental errors can never be completely eliminated, it is desirable to estimate how
large they are. In their work Zhang et al. investigate the experimental error of three
consecutive sample preparation steps: immunoprecipitation (IP), SDS-PAGE
fractionation and in-gel digestion.
In the experiment, two cultures of NG108 cells (mouse neuroblastoma and rat glioma
hybrid) were grown. In one medium, 13
C6-arginine and 13
C6-lysine were used as heavy
labeled amino acids and in the other normal isotopic arginine and lysine were used as
light amino acids. Apart from the isotope labels, the conditions were identical. After 1:1
combination, the cell lysates were analyzed with LC-MS/MS using a linear ion trap-
Orbitrap (LTQ-Orbitrap). As the conditions were identical, the expected SILAC ratio for
each and every protein was 1. Data analysis was done using MaxQuant software. Proteins
were identified and quantified based on two or more peptides. The number of proteins
identified and quantified varied per experiment, ranging from 240 to over 700.
The authors determined the variability as a relative standard deviation (rsd) of several
replicates of IP, SDS-PAGE fractionation and in-gel digestion and of the whole
procedure. According to the IUPAC definition (Table 1) this would be called the
repeatability of the individual steps and of the whole method. This study is thorough in
determining the precision of sample preparation steps, but no mention is made of growing
the cell culture multiple times as should be the case when biological variation is taken
into account.
First, IP with anti-phosphotyrosine of cell lysate was repeated N times (N = 1, 3 and 6).
The rsd of the SILAC ratios was the smallest when the results of N = 6 were pooled. The
difference between the N = 3 and N = 6 experiment was very small, so the authors
conclude that N = 3 is sufficient for IP. Second, they investigate the error of in-gel
digestion by N repetitions. The samples were separated by one-dimensional SDS-PAGE,
selected gel bands were subjected to digestion with trypsin. The rsds in SILAC ratios

13
were very similar for all N. The authors conclude that N = 1 is sufficient for in-gel
digestion. Third, the optimal number of repetitions for SDS-PAGE fractionation is
determined using N = 3 for IP and N = 3 for in-gel precipitation. The rsd was the smallest
for N = 6, but virtually indistinguishable from N = 4. The authors conclude that the
optimal number of sample preparation steps can be determined by employing
experimental design.
4.2 Role of the mass analyzer
In their research to Erythropoietin-producing carcinoma B (EphB) pathway, Zhang et al.
have screened for interacting proteins using SILAC with a quadrupole time-of-flight
(QTOF) mass analyzer [17] and an LTQ-Orbitrap [18]. Again, NG108 cells were labeled
with 13
C6-arginine and 13
C6-lysine as heavy labeled amino acids.
They report two biological replicates. In one replicate they identified 683 proteins and in
the other 532. 411 proteins were identified in both replicates. The LTQ-Orbitrap based
method could quantify 777 proteins, whereas the QTOF based method could only
quantify 127. The LTQ-Orbitrap based method performed strikingly better than the
QTOF based method. It had a larger dynamic range and a lower noise level. From the 95
proteins that could be quantified with both methods, the SILAC ratios from the LTQ-
Orbitrap based method were higher than determined with the QTOF based method. This
is a result of the lower noise levels in the Orbitrap mass analyzer [18]. An example of the
difference in SILAC ratio L/H found with the two different mass analyzers is given in
Figure 5.
Figure 5: Illustration of the lower noise level in the Orbitrap as compared to the QTOF [18].

14
De Godoy et al. [19] report the use of a hybrid linear ion trap-Fourier transform mass
spectrometer (LTQ-FT), combining the trapping capability of the LTQ with an ion
cyclotron resonance trap (ICR) for sensitive detection.
Two cultures of yeast cells (Saccharomyces cerevisiae) were grown in media, containing
either 15
N213
C6- lysine as heavy labeled amino acid or normal lysine.
In their analysis of the whole yeast cell proteome they identified about 2000 proteins and
the dynamic range was 1000. These are the highest reported numbers for a SILAC
experiment. The method had effective sensitivity to 500 femtomoles (10-15
moles).
4.3 Accuracy study with 13C6-arginine
Ong et al. [11] investigate the variability in quantification of SILAC in NIH 3T3 mouse
fibroblast cells using 13
C6-arginine and an LC-MS/MS method. The mass analyzer was a
QTOF. To assess the analytical properties of quantification of their method the authors
mixed labeled and unlabeled cell lysates in ratios 1:1, 1:5, 1:10 and 5:1 and separated
them by one-dimensional SDS-PAGE. Gel bands around 200 kDa were cut out and
digested with trypsin. An 80 minute LC-MS/MS analysis was done on the tryptic digest.
Quantification was done by integrating the peaks of a specific peptide in the XIC as
shown in Figure 6.

15
Figure 6: Extracted Ion Chromatograms (XIC) of the peptide VVFQEFR at different mixing ratios
[11].
Relative standard deviations of the measurements were calculated at two levels. First, the
rsd‟s of peptides were calculated from the different measuring points across the XIC
peaks. Second, the rsd‟s of proteins were calculated from the rsd‟s of the peptides that are
part of the proteins in question. This was done for over 60 proteins.
Note that this rsd was calculated based on one LC-MS/MS run. The authors comment
that this rsd is much smaller than possible biological or sample preparation errors, but

16
don‟t give a suggestion of approximately how much smaller that is. They also identify
possible pitfalls in quantification. Peptides that are present in the tryptic digest in low
abundances may give rise to MS signals in very few scans, thus increasing the chance of
inaccurate quantification and a larger rsd than with an abundant peptide that is present in
twenty scans. The dynamic range of the mass spectrometer plays a role in the accuracy of
quantification. When a peptide signal is present, but the intensity is comparable to the
background noise, the abundance is less accurate. Similarly, if a peptide is so abundant
that it saturates the detector, the concentration of the abundant peptide can be
underestimated. In the analysis, also some fully 13
C-labeled proline showed up. It is
known that some cell lines are able to metabolize argine to proline. This is especially so
in the presence of high arginine concentrations. However, when this is known, the results
can be corrected by adding the peak intensity of the heavy proline peptide to the light
one.
4.4 Absolute quantitation and the dynamic range
Hanke et al. [20] have showed that SILAC can accurately quantify proteins down to 150
attomoles (10-18
moles) in cell lysate using an Orbitrap mass spectrometer without
fractionation prior to LC-MS analysis. 13
C615
N4-arginine and 13
C615
N2-lysine were used
as heavy labeled amino acids.
The linear range of SILAC ratios between 1:300 and 300:1 was investigated for maltose
binding protein (MBP) in E. coli AT713, a strain that is auxotrophic for arginine and
lysine, by keeping the amount of MBP constant at 150 fmol. The linearity was excellent
between 1:100 and 100:1, showing that SILAC can have a dynamic range of four orders
of magnitude (104). The rsd of ratio measurements was typically < 5 %. The precision of
the measurements is mostly dependent on the S/N, so the most abundant peaks could be
quantified more accurately.
Having shown that absolute and quantitative SILAC is possible in a model system, an
LTQ-Orbitrap method was developed to cope with the complexity of real biological
samples. When a protein of interest is recognized as a peptide in the full-scan mode, the
mass analyzer is automatically switched to the Selected Ion Monitoring (SIM) mode and
uses the ability of the LTQ-Orbitrap to enrich the ions of light isotopic peptide thus
increasing the S/N. This acquisition strategy is schematically shown in Figure 7.
Figure 7: Acquisition strategy of the LTQ-Orbitrap method [20].
Using this method the authors were able to determine the number of Grb2 protein
molecules in several cell lines. Grb2 is a 25 kDa protein that plays a key role in the

17
transduction of growth signals from receptors to intracellular effectors. The experiment
for each cell line was repeated five times and 7 to 14 peptides were quantified. HeLa cells
had 5.55 ± 0.26 x 10⁵ copies of Grb2, HepG2 liver cells 8.80 ± 0.12 x 10
5 copies and
C2C12 murine muscle cells 5.67 ± 0.20 x 10⁵ copies. The number of copies of a protein
in a cell can be used as input for computational systems biology models.
5. The heat shock response as a potential application field for SILAC
A well studied phenomenon in molecular cell biology is the heat shock response (HSR).
As a reaction to a sudden increase in temperature, a collection of proteins called heat
shock proteins (hsp‟s) are upregulated. In E. coli, the transcription of hsp‟s is initiated by
one protein, the sigma factor σ32
[21]. The level and activity of σ32
is regulated at three
levels of feedback loops. At temperatures ≥ 37 ºC, σ32
is upregulated. Then, degradation,
which keeps the amount of σ32
low, is inhibited. Finally, the activity of σ32
is negatively
regulated (Figure 8). Each of these feedback loops has been modeled. The process of heat
shock response takes place at a timescale of several minutes. It would be desirable to
have a method that is able to measure the concentrations of σ32
and the other proteins in
the HSR pathway in a time-resolved way. SILAC has been used to do time resolved
experiments. A research question that will be investigated in this thesis will be: is SILAC
suitable for quantitative proteomics experiments on a timescale as short as the HSR?
Figure 8: activity and amount of sigma factor σ
32 upon temperature increase [21]

18
5.1 Quantitation of dynamic SILAC measurements
The dynamics of protein concentration in a cell can be approximated to the following
equation. The concentration of a protein B is dependent on the rate of synthesis, k1 and
the rate of degradation k2.
][][][ 21 CBA kk Equation 1
Where [A] is the concentration of precursor to protein B and [C] is the concentration of
degradation products. Pratt et al. [22] describe an approach to determine the degradation
constants k2 of proteins in vivo. In their experiment they grew haploid yeast cells on a
D10-leucine medium in a chemostat for at least seven cell doublings to ensure full
labeling. At t = 0 they placed the cells in a medium with light leucine and from that
moment onwards the cell started to break down the labeled proteins and synthesize
unlabeled proteins. Samples were taken at t = 0, 0.167, 0.667, 1, 2, 4, 6, 8, 10, 12, 24.5
and 51 hours. The lysates of the samples were subjected to 2-DE and spots of interest
were sliced out of the gel and analyzed by MALDI-TOF MS. At each time point the RIAt
was measured as defined in Equation 2.
)( HL
Ht
AA
ARIA
Equation 2
Where AH is the monoisotopic intensity of the heavy peptide and AL is the intensity of the
monoisotopic light peptide.
The RIA changes over time as a result of the degradation of labeled proteins and the
dilution of the chemostat (cells are lost because they flow out of the chemostat). The
formula for RIAt can be written generically as:
)exp()( 0 tkRIARIARIARIA losst Equation 1
Pratt et al. simplified the formula by fixing values of RIA0 and RIA∞ at their average
measured values, leaving kloss as the only variable in the formula.
)exp(985.0 tkRIA losst Equation 2
The RIAt values were measured at different time points and fitted into a nonlinear curve.
Values for kloss were determined.
tRIAk tloss /)985.0/ln( Equation 3
Finally the correction for dilution in the chemostat was made to obtain k2.
Dkk loss 2 Equation 4

19
A schematic overview of the quantification strategy is shown in Figure 9.
Figure 9: chase experiment with deuterated leucine. Note that kdeg is k2 in this work.
With the described method the authors were able to determine k2 values for 52 abundant
proteins in h-1
with rsd‟s of around 5%.
5.2 Some examples of dynamic SILAC
As mentioned in the introduction, there are several ways in which the cellular proteome is
complex. Differences in protein concentrations by location in the cell (i.e. by organelle)
can be tackled by prefractionating the cell lysate with ultrafiltration. Differences in time
can be tackled by doing time-resolved experiments and these will be described in this
paragraph.
Doherty et al. [23] describe an experiment in which they measure protein turnover in
intact organisms. Layer chickens (Gallus gallus) were fed a synthetic diet containing a
sufficient amount of essential amino acids for optimal growth. At t = 0, the valine in the
diet was replaced with a 50:50 mixture light valine : D8-valine. Pectoral muscle was
sampled at t = 0, 1, 2, 4, 8, 14, 24, 30, 32, 48, 55, 72, 96 and 120 hours. The samples
were homogenized and the protein contents were separated by SDS-PAGE. The 20 most
abundant proteins were analyzed by MALDI-TOF. Since the mass range used was 950-
3500 Th, the ratio calculations were corrected for longer peptides in which more than one
heavy valine was incorporated. Error margins of RIAs in proteins were based on the
consistency of the intensity ratios of different peptides of a protein. The authors conclude

20
that they have proven that SILAC can not only be used for cell cultures, but also for
intact complex organisms.
More recently, Doherty et al. [24] describe a SILAC experiment on relatively short
timescales with human adenocarcinoma A549 cells. The cell culture is labeled with 13
C6-
arginine and at t = 0 switched to light arginine. Sampling was done at 0, 0.25, 0.50, 1, 2,
4 and 8 hours. The lysates were separated by SDS-PAGE and the lanes were divided into
40 slices that were each analyzed with LC-MS/MS with an LTQ as the mass analyzer.
Degradation constants k2 of 576 proteins could be determined, ranging from 2 x 10⁻⁵
± 9 x
10-7
to 5.4 ± 0.4 h-1
. Using the degradation constants and identifications of proteins
several hypotheses about what triggers protein degradation could be tested. They did not
find a correlation between degradation speed and molecular weight, pI, gene ontology
classification, the presence of stabilizing residues, the presence of PEST sequencesc. The
degree of structural order did seem to make a difference. Proteins that consisted
completely of disordered residues were degraded more rapidly than proteins that
contained no disordered residues. By structural disorder, the lack of a well defined 3D
structure is meant [25]. The turnover of different subunits of large protein complexes was
also examined. The turnover rates of proteins belonging to the 40S and 60S ribosomal
subunits were not all equal. A drawback of the method used by the authors is that it
provides no information about whether or not a subunit is assembled in a complex or
present in solution as a „spare part‟.
The authors stress that the results do not apply for other cell lines or conditions.
Mintz et al. [26] investigated protein turnover in the endoplasmic reticulum (ER) under
the influence of stress inducers tunicamycin (Tun) and thapsigargin (Thp) of human
primary fibroblast cells. One cell culture was not subjected to the stress factors and was
grown on heavy 13
C615
N2-lysine and 13
C6-arginine. The other cell culture was subjected to
the stress factors and was grown on light, 12
C614
N2-lysine and 12
C6-arginine. Two heavy
labeled amino acids are used to be able to quantify more peptides than with only one
labeled amino acid. Samples were taken at 0, 6, 12 and 24 hours. The samples are mixed
1:1 and the ER is separated from the other organelles by centrifugation. The protein
contents are analyzed by SDS PAGE followed by LC-MS/MS using an LTQ mass
analyzer. Peak intensity ratios of ER proteins from the treated and untreated cells were
plotted. Significant fold change as a reaction to the stress inducers could be measured for
22 abundant proteins (Figure 10). Quantification of lower abundance proteins however
was not “reproducible”. The authors probably mean repeatable by the IUPAC definition
(Table 1).
c A PEST sequence is a peptide motif rich in proline, glutamate, serine and threonine that is recognized by
the cell‟s protease machinery and triggers degradation.

21
Figure 10: Change in abundance ratios of 22 abundant ER proteins as a result of Thp and Tun
induced stress after 24 hours [26].
To investigate protein degradation of the human Major Histocompatibility Complex
(MHC), Milner et al. [27] grew human cancer cell line UCI-107 labeled with D3-leucine
for 7 days. On t = 0 the medium was changed to light leucine. After cell lysis and affinitiy
purification, the proteins were digested with trypsin and analyzed with LC-MS/MS using
an ion trap as a mass analyzer. Degradation profiles of several proteins could be drawn
based on the relative abundance of heavy leucine (Figure 11). Note that the sampling
interval (t = 0, 3, 6, 9, 12, 18, 24, 48, 96) is not optimal for peptides with fast turnover
rates.
Figure 11: Degradation profile of three MHC peptides with different turnover times [27].

22
Blagoev et al. [28] report a dynamic SILAC experiment with the shortest reported
timescale. They focus on time resolved phosphorylation of tyrosine residues in HeLa cell
cultures that were treated with epidermal growth factor (EGF) for a certain amount of
time. Isotopic labeling occurred in a slightly modified way. Rather than having two
isotopic species, the authors use three: light 12
C614
N4-arginine, medium 13
C614
N4-arginine
and heavy 13
C615
N4-arginine. Two three-state experiments were carried out. In the first
experiment three cell cultures were grown on light, medium and heavy arginine
respectively and treated with EGF for 0, 1 and 10 minutes respectively. In the second
experiment three other cell cultures were treated with EGF for 0, 5 and 20 minutes. The
cells are lysed and the lysates are mixed 1:1:1. After affinity purification, the proteins are
digested with trypsin. The tryptic digest is analyzed with LC-MS using a QTOF mass
analyzer (Figure 12a). The mass spectrum of each peptide in the experiment shows three
isotope peaks (Figure 12b).
Figure 12:a) schematic overview a three-state experiment, b) mass spectra of three peptides of
different proteins [28].
Activation profiles of some important proteins in the EGF receptor signaling network are
shown in Figure 13.

23
Figure 13: activation profiles of some important proteins in the EGF receptor signaling network. The
profiles were generated by interpolating protein ratio’s with KaleidaGraph software using the
Stineman function [28].
Each measurement was done relative to the common zero point (i.e. the amount in
unstimulated cells). Absolute copy numbers were not measured. The profiles that could
be seen were obtained by intrapolating the measured values into systems of rate equations
such as the one in Equation 2. It can be seen that the activity of EGF receptor EGFR
increases rapidly within the first minute of stimulation, stays constant for 5 minutes and
finally steadily declines. Eps15 and c-Cbl are related to the early stage of the pathway
and follow the same trend, but their activation peaks at a lower level. Ubiquitin is
involved in the next step, and consecutively ubiquitinilation is recognized by Hrs and
STAM2. The order in which protein activities peak is in line with what is known about
this pathway in the literature. The results were verified by Western blotting.
Activation profiles of 202 proteins were obtained. 81 of these were significantly
upregulated upon EGF stimulation. The reliability of ratio measurements was
investigated for some proteins. Variability of the ratio measurements of different peptides
within a protein had rsd‟s of <20%. Ratios >25 had higher rsd‟s of up to 30%.
The studies described in this paragraph show examples of time-resolved SILAC
experiments that can be done. We will now evaluate whether they can be applied on the
heat shock reaction.
The three phases of the heat shock response of σ32
take 15 minutes (Figure 8). When the
method as described by Blagoev et al. is used it will give only four measurements: 0, 1, 5
and 10 minutes. Preferably the concentration of σ32
is measured at around 9 time points,
e.g. 0, 1, 3, 5, 7, 9, 11, 13 and 15 minutes. Although it is the method with the shortest
timescale yet reported, it is still not sufficient for σ32
. Another potential limiting factor for
the method is the time it takes before a measured ratio is significantly different from the
initial value. If the S/N is low, it can take long before an emerging signal is noted.

24
6. Static SILAC
Most of the SILAC studies reported in the literature are static SILAC experiments. Two
states are compared, for example, disease influenced cells and healthy cells. This will be
discussed briefly in the next paragraph. In this paragraph, a special application of static
SILAC will be discussed.
Schwanhäusser et al. describe a technique called pulsed SILAC. In their approach, HeLa
cells are grown in light (L) amino acids lysine and arginine and at t = 0 the medium is
changed to either medium (M) amino acids D4-lysine and 13
C6-arginine or heavy (H)
amino acids 13
C615
N2-lysine and 13
C615
N4-arginine. Samples were taken at t = 2 and 10
hours.
The protein contents of the cells were separated by SDS-PAGE and digested with trypsin.
The tryptic digests were analyzed with LC-MS/MS using and LTQ-Orbitrap instrument.
In the mass spectra different peaks occur for the H, M and L peptides. The H/L ratio
provides information about the turnover rate, but no information about the translation
rate. The H/M ratio on the other hand is a measure for translation rate, because from t = 0
all new proteins in each state will consist of H or M labeled amino acids (Figure 14).
Degradation also takes place, but this is assumed equal for each state.
Figure 14: pulsed SILAC approach [29]
The method was compared to the luciferase system, in which the expression of luciferase
is measured as the intensity of luminescence. They find that pulsed SILAC can determine
differences in translation rates in complex mixtures over at least two orders of magnitude.

25
The method was validated with more proteins, now using yeast cells. Yeast cells were
mixed in four different L/M/H ratios (0.5:1:1, 0.5:1:2, 0.5:1:4, 0.5:1:8). Of each protein
the log2 fold H/M ratiod and total peptide intensities in the mass spectrum were as a point
in the graph in Figure 15.
Figure 15: validation of the pulsed SILAC method with different H/M ratios [29]
First, it can be seen that proteins with higher abundances can be quantified more
accurately. Second, proteins with lower abundances don‟t often deviate more than 0.3log2
times from their true value.
The method was applied in a system where the iron homeostasis of HeLa cells was
investigated. One cell culture was grown on H amino acids and was treated with iron in
the form of ferric ammonium citrate. The other cell culture was grown on M amino acids
and was not treated with iron. The H/M ratios could be used to determine which proteins
d An H/M ratio of 4:1 for example corresponds with log2 fold change of log2 4 = log 4 / log 2 = 2

26
in the iron homeostasis pathway were upregulated and which proteins were
downregulated as a result of the iron treatment.
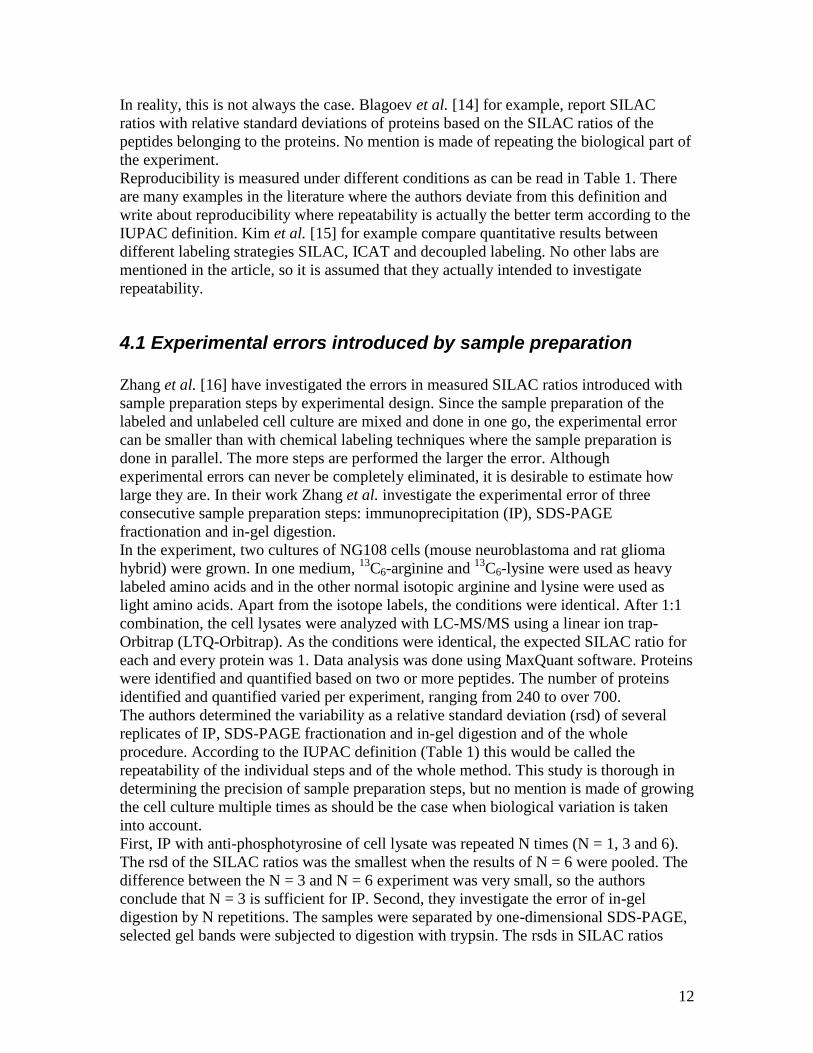
7. Applications in biology and medicine
The analytical development of SILAC is strongly influenced by the demand for
techniques from the molecular biology community. It is beyond the scope of this work to
discuss all the available literature. In this paragraph a number of applications will be
presented in Table 2. The articles are listed by three themes: first, articles in which
specific proteins or pathways are analyzed, second, articles in which the whole proteome
is screened, and third, articles that are applied to cancer researche.
Table 2: SILAC applications
Short description Reference
Targeted pathways and proteins
New hydroxylation sites were found on Factor Inhibiting
Hypoxia inducible factor (HIF) substrates.
[30]
Phosphorylation in the insulin pathway. [31]
The interaction between proteins and DNA. [32]
Protein methylation in the proteome of HeLa cells. [33]
Phosphorylation in the yeast pheromone signaling pathway. [34]
The functioning of red blood cells of isotope labeled knockout
mice.
[35]
The interaction of O-GlcNAcylation and O-phosphorylation. [36]
Tyrosine phosphorylation of the ErbB receptor family. [37]
The phosphorylation of a potassium ion channel. [38]
Protein-protein interactions of the ubiquitin proteasome. [39]
Phosphorylation in human embryonic kidney cells. [40]
Methylation, phosphorylation and acetylation of human
histones.
[41]
Global analysis
The proteome of differentiating adypocytes. [42]
Comparison of protein expression in cell cultures and tissues. [43]
Comparison of protein expression in differentiating stem cells.
and self-renewing stem cells.
[44]
Comparison of membrane proteins in whole cell membrane and
detergent resistant membrane.
[45]
Global analysis of protein-protein analysis. [46]
Cell differentiation in B lymphocytes. [47]
Global analysis of rat liver cells. [48]
e Cancer was the number one cause of death in the Netherlands in 2008. http://www.cbs.nl/nl-
NL/menu/themas/gezondheid-welzijn/publicaties/artikelen/archief/2009/2009-2687-wm.htm
27
Cancer research
Substrates for metalloproteases involved in tumor metastasis. [49]
The whole proteome of hepatocellular carcinoma cells with
high and low metastasis potential.
[50]
The treatment of human retinal pigment epithelial cells with
Tumor Necrosis Factor alpha.
[51]
The nuclear proteome of T leukemia cells were screened for
proteins involved in apoptosis.
[52]
Secreted proteins from pancreatic cancer derived cells and
healthy cancer cells were screened for biomarkers.
[53]
The whole proteome of prostate cancer cells were compared to
those of healthy cells.
[54]
8. Conclusions
SILAC offers benefits compared to chemical labeling techniques in that the sample
handling requires fewer steps. It can be applied to living cells as well as whole living
organisms. The labeling is done through the metabolism as opposed to a chemical
reaction that might be incomplete.
SILAC is already widely used by molecular biologists to study whole proteomes, specific
pathways, post-translational modifications and is used in cancer research.
The precision of SILAC ratios is the highest (rsd‟s of <5%) when the true value is close
to 1:1 and several peptides are used. A high abundance in the mass spectrum also benefits
the precision of the ratio measurements.
Very low amounts down to 150 amol of proteins can be analyzed and a dynamic range of
104 could be attained using the hybrid LTQ-Orbitrap mass analyzer. The highest number
of identified and quantified proteins reported was achieved using a hybrid LTQ-FT mass
analyzer.
When an approach based on the multiple state approach of Blagoev et al. [28] is used,
SILAC can possibly be used to do measurements on the heat shock response protein σ32
if the S/N is high enough to be able to measure an upcoming signal shortly after the start
of the experiment.
True studies of the reproducibility of SILAC i.e. with different instruments, different
analysts in different labs have not been reported.

28
9. References
1. Alberts B, J.A., Lewis J, Raff M, Roberts K, Walter P, Molecular Biology of the
Cell. Fifth ed. 2008, New York: Garland Science, Taylor & Francis Group LLC.
2. Krijgsveld, J., et al., Quantitative proteomics of fruit fly development by metabolic
labeling. Molecular & Cellular Proteomics, 2005. 4(8): p. S324-S324.
3. Anderson, N.L. and N.G. Anderson, Proteome and proteomics: New technologies,
new concepts and new words. Electrophoresis, 1998. 19(11): p. 1853-1861.
4. de Koster, C., University of Amsterdam M.Sc. Course Mass Spectrometry Lecture
Notes. 2007.
5. O'Farrell, P., High resolution two-dimensional electrophoresis of proteins.
Journal of Biological Chemistry, 1975. 250(10): p. 4007-4021.
6. Gygi, S.P., et al., Quantitative analysis of complex protein mixtures using isotope-
coded affinity tags. Nat Biotechnol, 1999. 17(10): p. 994-9.
7. Ong, S.E. and M. Mann, Mass spectrometry-based proteomics turns quantitative.
Nat Chem Biol, 2005. 1(5): p. 252-62.
8. Stewart, I.I., T. Thomson, and D. Figeys, O-18 Labeling: a tool for proteomics.
Rapid Communications in Mass Spectrometry, 2001. 15(24): p. 2456-2465.
9. Fisher, D.E., Pulse labeling of small nuclear ribonucleoproteins in vivo reveals
distinct patterns of antigen recognition by human autoimmune antibodies. Proc.
Natl. Acad. Sci. USA, 1984. 81(10): p. 3185-3189.
10. Ong, S.E., et al., Stable isotope labeling by amino acids in cell culture, SILAC, as
a simple and accurate approach to expression proteomics. Mol Cell Proteomics,
2002. 1(5): p. 376-86.
11. Ong, S.E., I. Kratchmarova, and M. Mann, Properties of 13C-substituted arginine
in stable isotope labeling by amino acids in cell culture (SILAC). J Proteome Res,
2003. 2(2): p. 173-81.
12. Currie, L.A. and G. Svehla, Nomenclature for the presentation of results of
chemical analysis (IUPAC Recommendations 1994). Pure & Appl. Chem., 1994.
66(3): p. 595-608.
13. De Hoffmann, E. and V. Stroobant, Mass Spectrometry: Principles and
Applications. Third ed. 2007, Chichester, UK: John Wiley & Sons Ltd.
14. Blagoev, B., et al., A proteomics strategy to elucidate functional protein-protein
interactions applied to EGF signaling. Nat Biotechnol, 2003. 21(3): p. 315-8.
15. Kim, Y.J., et al., Reproducibility assessment of relative quantitation strategies for
LC-MS based proteomics. Analytical Chemistry, 2007. 79(15): p. 5651-5658.
16. Zhang, G., Evaluation of the Variation in Sample Preparation for Comparative
Proteomics Using Stable Isotope Labeling by Amino Acids in Cell Culture. J
Proteome Res, 2009. 8(3): p. 1285-1292.
17. Zhang, G., et al., Quantitative phosphotyrosine proteomics of EphB2 signaling by
stable isotope labeling with amino acids in cell culture (SILAC). J Proteome Res,
2006. 5(3): p. 581-8.
18. Zhang, G., D. Fenyo, and T.A. Neubert, Screening for EphB signaling effectors
using SILAC with a linear ion trap-orbitrap mass spectrometer. J Proteome Res,
2008. 7(11): p. 4715-26.

29
19. de Godoy, L.M., et al., Status of complete proteome analysis by mass
spectrometry: SILAC labeled yeast as a model system. Genome Biol, 2006. 7(6):
p. R50.
20. Hanke, S., et al., Absolute SILAC for accurate quantitation of proteins in complex
mixtures down to the attomole level. J Proteome Res, 2008. 7(3): p. 1118-30.
21. Guisbert, E., et al., Convergence of molecular, modeling, and systems approaches
for an understanding of the Escherichia coli heat shock response. Microbiol Mol
Biol Rev, 2008. 72(3): p. 545-54.
22. Pratt, J.M., et al., Stable isotope labelling in vivo as an aid to protein
identification in peptide mass fingerprinting. Proteomics, 2002. 2(2): p. 157-63.
23. Doherty, M.K., et al., Proteome dynamics in complex organisms: using stable
isotopes to monitor individual protein turnover rates. Proteomics, 2005. 5(2): p.
522-33.
24. Doherty, M.K., et al., Turnover of the Human Proteome: Determination of
Protein Intracellular Stability by Dynamic SILAC. J Proteome Res, 2008.
25. Tompa, P., Structural disorder serves as a weak signal for intracellular protein
degradation. Proteins, 2008. 71(2): p. 903-909.
26. Mintz, M., et al., Time series proteome profiling to study endoplasmic reticulum
stress response. J Proteome Res, 2008. 7(6): p. 2435-44.
27. Milner, E., et al., The turnover kinetics of major histocompatibility complex
peptides of human cancer cells. Mol Cell Proteomics, 2006. 5(2): p. 357-65.
28. Blagoev, B., et al., Temporal analysis of phosphotyrosine-dependent signaling
networks by quantitative proteomics. Nat Biotechnol, 2004. 22(9): p. 1139-45.
29. Schwanhausser, B., et al., Global analysis of cellular protein translation by
pulsed SILAC. Proteomics, 2008. 9(1): p. 205-209.
30. Cockman, M.E., et al., Proteomic-based identification of novel factor inhibiting
HIF (FIH) substrates indicates widespread asparaginyl hydroxylation of ankyrin
repeat domain-containing proteins. Mol Cell Proteomics, 2008.
31. Hanke, S. and M. Mann, The phosphotyrosine interactome of the insulin receptor
family and its substrates IRS-1 and IRS-2. Mol Cell Proteomics, 2008.
32. Mittler, G., F. Butter, and M. Mann, A SILAC-based DNA protein interaction
screen that identifies candidate binding proteins to functional DNA elements.
Genome Res, 2009.
33. Ong, S.E., G. Mittler, and M. Mann, Identifying and quantifying in vivo
methylation sites by heavy methyl SILAC. Nat Methods, 2004. 1(2): p. 119-26.
34. Gruhler, A., et al., Quantitative phosphoproteomics applied to the yeast
pheromone signaling pathway. Mol Cell Proteomics, 2005. 4(3): p. 310-27.
35. Kruger, M., et al., SILAC mouse for quantitative proteomics uncovers kindlin-3 as
an essential factor for red blood cell function. Cell, 2008. 134(2): p. 353-64.
36. Wang, Z., A. Pandey, and G.W. Hart, Dynamic interplay between O-linked N-
acetylglucosaminylation and glycogen synthase kinase-3-dependent
phosphorylation. Mol Cell Proteomics, 2007. 6(8): p. 1365-79.
37. Schulze, W.X., L. Deng, and M. Mann, Phosphotyrosine interactome of the ErbB-
receptor kinase family. Mol Syst Biol, 2005. 1: p. 2005 0008.
38. Park, K.S., et al., Graded regulation of the Kv2.1 potassium channel by variable
phosphorylation. Science, 2006. 313(5789): p. 976-9.

30
39. Guerrero, C., et al., An integrated mass spectrometry-based proteomic approach:
quantitative analysis of tandem affinity-purified in vivo cross-linked protein
complexes (QTAX) to decipher the 26 S proteasome-interacting network. Mol
Cell Proteomics, 2006. 5(2): p. 366-78.
40. Ibarrola, N., et al., A proteomic approach for quantitation of phosphorylation
using stable isotope labeling in cell culture. Analytical Chemistry, 2003. 75(22):
p. 6043-6049.
41. Bonenfant, D., et al., Analysis of dynamic changes in post-translational
modifications of human histones during cell cycle by mass spectrometry. Mol Cell
Proteomics, 2007. 6(11): p. 1917-32.
42. Molina, H., et al., Temporal Profiling of the Adipocyte Proteome during
Differentiation Using a Five-Plex SILAC Based Strategy. J Proteome Res, 2008.
43. Pan, C., et al., Comparative proteomic phenotyping of cell lines and primary cells
to assess preservation of cell type specific functions. Mol Cell Proteomics, 2008.
44. Prokhorova, T.A., et al., SILAC-labeling and quantitative comparison of the
membrane proteomes of self-renewing and differentiating human embryonic stem
cells. Mol Cell Proteomics, 2009.
45. Zheng, Y.Z., K.B. Berg, and L.J. Foster, Mitochondria do not contain lipid rafts
and lipid rafts do not contain mitochondrial proteins. J Lipid Res, 2009.
46. Trinkle-Mulcahy, L., et al., Identifying specific protein interaction partners using
quantitative mass spectrometry and bead proteomes. J Cell Biol, 2008. 183(2): p.
223-39.
47. Romijn, E.P., et al., Expression clustering reveals detailed co-expression patterns
of functionally related proteins during B cell differentiation: a proteomic study
using a combination of one-dimensional gel electrophoresis, LC-MS/MS, and
stable isotope labeling by amino acids in cell culture (SILAC). Mol Cell
Proteomics, 2005. 4(9): p. 1297-310.
48. Wu, C.C., et al., Metabolic labeling of mammalian organisms with stable isotopes
for quantitative proteomic analysis. Anal Chem, 2004. 76(17): p. 4951-9.
49. Esselens, C.W., et al., Metastasis-associated C4.4A, a GPI-anchored protein
cleaved by ADAM10 and ADAM17. Biol Chem, 2008. 389(8): p. 1075-84.
50. Chen, N., et al., Quantitative proteome analysis of HCC cell lines with different
metastatic potentials by SILAC. Proteomics, 2008. 8(23-24): p. 5108-18.
51. An, E., H. Gordish-Dressman, and Y. Hathout, Effect of TNF-alpha on human
ARPE-19-secreted proteins. Mol Vis, 2008. 14: p. 2292-303.
52. Hwang, S.I., et al., Systematic characterization of nuclear proteome during
apoptosis: a quantitative proteomic study by differential extraction and stable
isotope labeling. Mol Cell Proteomics, 2006. 5(6): p. 1131-45.
53. Gronborg, M., et al., Biomarker discovery from pancreatic cancer secretome
using a differential proteomic approach. Mol Cell Proteomics, 2006. 5(1): p. 157-
71.
54. Everley, P.A., et al., Quantitative cancer proteomics: stable isotope labeling with
amino acids in cell culture (SILAC) as a tool for prostate cancer research. Mol
Cell Proteomics, 2004. 3(7): p. 729-35.