sta annual mtg syllabus and abstracts
TRANSCRIPT

6737 W. Washington St., Suite 1300 | Milwaukee, WI 53214 | 414-389-8600 | www.stahq.org
2015 Annual Meeting
Syllabus
Society for Technology in Anesthesia
Anesthesia: Beyond the Horizon
January 7-10, 2015Royal Palms Resort & Spa
Phoenix, Arizona16.75 AMA PRA Category 1 CreditsTM

Welcome
Mission Statement
Dear STA Members and Attendees,
Welcome to the 24th Society for Technology in Anesthesia (STA) Annual Meeting – an ex-ceptional and unique gathering for physicians, engineers and industry representatives. It is truly stimulating to come to the STA each year to reconnect with our friends and colleagues, relax in a temperate setting and take advantage of the outstanding lectures and events.
The future of informatics in healthcare, advances in safety and innovation, AIMS, surgical periop-erative home and costs of doing business in the IT world, are a few of the interesting topics we’ll have the opportunity to hear about this week. The STA-FAER joint session on safety and innova-tion is once again a part of our 2015 program.
We’d like to extend a big “thank you” to Dr. Allan Simpao for all his work in creating and organizing the wonderful Anesthesia: Beyond the Horizon program.
Another special thank you is owed to all of the STA members and industry that continue to keep the Society alive and well with their commitment of time, dedication and generous financial sup-port.
I look forward to seeing you all soon.
Sincerely,
Joan Spiegel, MD President Society for Technology in Anesthesia
Save the Date!The Society’s mission is to improve the quality of patient care by improving technology and its application. The Society promotes education and research, collaborates with local, national, and international organizations, sponsors meetings and exhibitions, awards grants, and recognizes achievement.
2016 Annual MeetingJanuary 6-9, 2016
Four Seasons Resort Palm Beach, Florida

Activity OverviewThe Society for Technology in Anesthesia (STA) 2015 Annual Meeting will provide information on the future of technology within the field of clinical anesthesia. The Annual Meeting will address the evolving role of computer technology and infor-matics in anesthesiology and overall health care, the enterprise-level implications of anesthesia technology, innovations in anesthesia safety, present and future respiratory monitoring technology, the surgical perioperative home, clinical decision support and anesthesia information management systems (AIMS).
Target AudienceThis live activity is designed for a national and international audience of physicians, engineers or other practitioners in the field of anesthesia seeking an update on the current and possible future state of anesthesia technology.
Educational ObjectivesAs a result of participation in this CME activity, learners should be able to:
• Explore how anesthesia technology fits into the greater scope of the overall hospital and health care technology infra-structure.
• Identify and examine problems and potential solutions in the anesthesia workspace, with emphasis on pediatric inhala-tional anesthesia, robotic safety and closed-loop systems.
• Explore key advances in respiratory monitoring technology and their potential impact on patient safety.• Examine and identify the barriers and potential solutions to the perioperative surgical home and how technology can
help perioperative clinicians comply with best practices as well as broaden their scope beyond the operating system.• Explore potential problems and solutions regarding real-time clinical decision support as well as team cognitive work
analysis and mobile patient monitoring.• Investigate the techniques and methods by which one can leverage anesthesia information management systems to
improve outcomes and patient safety. Barriers to change:• Understanding the rapidly evolving convergence of the medical and information sciences• Integrating valid scientific evidence and cutting-edge technology into daily clinical practice Accreditation StatementThis activity has been planned and implemented in accordance with the accreditation requirements and policies of the Ac-creditation Council for Continuing Medical Education (ACCME) through the joint providership of the Institute for the Advance-ment of Human Behavior (IAHB) and the Society for Technology in Anesthesia (STA). The IAHB is accredited by the ACCME to provide continuing medical education for physicians.
Credit Designation StatementThe IAHB designates this live activity for a maximum of 16.75 AMA PRA Category 1 Credits™. Physicians should claim only the credit commensurate with the extent of their participation in the activity.
Continuing Medical Education Statement
The online certificate site will be available at the beginning of the day on January 10th until February 10th. After February 10, 2015, the site will be removed and certificates will no longer be available. If you need a CME certificate, you must complete the evaluation and certificate process prior to February 10, 2015; otherwise you will forfeit your credit for the course.
To get your certificate, go to STA.CmeCertificateOnline.com. Note: This link will NOT be live until Saturday, January 10, 2015. Click on the “STA 2015 Annual Meeting” event. On the site, you will be asked to evaluate various aspects of the program. You may then print your certificate.
Please address any questions about the process to: help.cmecertificateonline.com
Meeting Accreditation Information
IMPORTANT!

Faculty (with Disclosures) The following faculty indicated with an asterisk (*) stated they had no such relevant financial relationships to disclose. Their finan-cial relationship is nothing to disclose (NTD) and resolution is not applicable (N/A).
Annual Meeting Faculty
*Luis Ahumada, MSCS Children’s Hospital of Philadelphia
*J. Mark Ansermino, MBBCh University of British Columbia
*Igor Brodkin, MD Vancouver Coastal Health
*Catherine Burns, PhD University of Waterloo
*Maxime Cannesson, MD, PhD University of California-Irvine
*Franklin Dexter, MD, PhD University of Iowa
*Richard Epstein, MD Thomas Jefferson University Hospital
*David Feinstein, MD Beth Israel Deaconess Medical Center (BIDMC)
*Jeffrey Feldman, MD, MSE Children’s Hospital of Philadelphia
*Jorge Galvez, MD Children’s Hospital of Philadelphia
*Julian Goldman, MD Massachusetts General Hospital
*Matthias Gorges, PhD University of British Columbia
*Patrick Guffey, MD Children’s Hospital of Colorado
*Gabriel Gurman, MD Ben Gurion University of the Negev
*Thomas Hemmerling, MD, MSc, DEAA McGill University
*Bassam Kadry, MD Stanford School of Medicine
*Zeev Kain, MD University of California-Irvine
*Christine Lee University of California-Irvine
*Matthew Levin, MD Mount Sinai Health System
*Robert Loeb, MD University of Arizona
*Jeff Mandel, MD, MS University of Pennsylvania
*Patrick McCormick, MD Mount Sinai Health System
*Bala Nair, PhD University of Washington Seattle
*John Pawlowski, MD, PhD Beth Israel Deaconess Medical Center (BIDMC)
*Mohamed Rehman, MD Children’s Hospital of Philadelphia
*David Reich, MD Mount Sinai Health System
Joseph Rinehart, MD University of California-Irvine Sironis - SH, R1
*Brian Rothman, MD Vanderbilt University
*Norma Sandrock, MD Beth Israel Deaconess Medical Center (BIDMC)
*Ted Shortliffe, MD, PhD Arizona State University
*Allan Simpao, MD STA 2015 Annual Meeting Program Chair Children’s Hospital of Philadelphia
*Joan Spiegel, MD STA President Beth Israel Deaconess Medical Center (BIDMC)
*Jonathan Wanderer, MD Vanderbilt University
*Bryan Wolf, MD, PhD Children’s Hospital of Philadelphia
Financial Relationships Key
RGPI – Research Grant Site Principal InvestigatorC – ConsultantB – Board MemberSB – Speaker’s BureauE – EmployeeSH – Stock ShareholderNTD – Nothing to disclose
Resolution Key
R1 – Restricted to Best Available Evidence & ACCME Con-tent Validation StatementsR2 – Removed/Altered Financial RelationshipR3 – Altered ControlR4 – Removed CreditN/A – Not Applicable
Statement of Disclosure: All faculty/speakers, planners, abstract reviewers, moderators, authors, co-authors and administra-tive staff participating in the continuing medical education programs jointly sponsored by IAHB are expected to disclose to the program audience any/all relevant financial relationships related to the content of their presentation(s). All faculty/speak-ers, planners, abstract reviewers, moderators, authors, co-authors and administrative staff indicated with asterisks (*) stated they had no such relevant financial relationships to disclose.

Schedule of Events
Wednesday, January 7, 20150700 – 0800 Challenges and Opportunities Registration & Continental Breakfast Palmera & Palmera Lounge
0800 – 1700 Exhibitor Registration & Set-Up Palmera & Palmera Lounge
0800 – 1200 Challenges and Opportunities in Developing Anesthesia Products (industry) Estrella West David Feinstein, MD, Jeffrey Feldman, MD, MSE, Norma Sandrock, MD
1200 – 1315 Challenges and Opportunities & STA Board of Directors Lunch - Estrella Patio
1800 –1930 Registration & Welcome Reception Palmera & Palmera Lounge
Thursday, January 8, 20150700 – 0800 Registration & Continental Breakfast Palmera & Palmera Lounge
0800 – 0815 Welcome Address - Estrella Joan Spiegel, MD, STA President, Allan Simpao, MD, STA Annual Meeting Program Chair
Session 1: Keynote Address0815 – 0930 Computing the Future: The Evolving Roles of Informatics and Information Technology in Health Care - Estrella Ted Shortliffe, MD, PhD
0930 – 1000 Break with Exhibitors & Posters Palmera & Palmera Lounge
Session 2: Cost of Doing Business Moderator: Mohamed Rehman, MD 1000 –1030 Hospital Capital Budget Process for IT: Hospital President’s Perspective Estrella David Reich, MD
1030 – 1100 Cost of Doing Business and IT Prioritization: CIO’s View - Estrella Bryan Wolf, MD, PhD
1100 – 1130 Health IT: Hype vs. Reality - Estrella Bassam Kadry, MD
1130 – 1215 Panel Discussion - Estrella
1215 – 1330 Luncheon - Vernadero Lawn
Session 3: STA & FAER Joint Session / Safety & Innovation Moderator: John Pawlowski, MD, PhD
1330 – 1400 Innovation in Pediatric Inhalation Estrella Gabriel Gurman, MD
1400 – 1430 Innovation in Robotic Safety - Estrella John Pawlowski, MD, PhD
1430 – 1500 Innovation in Closed-Loop Systems Estrella Joseph Rinehart, MD
1500 – 1530 Innovations in Standards for Interoperability - Estrella Julian Goldman, MD
1530 – 1545 Panel Discussion - Estrella
1545 – 1600 Break with Exhibitors & Posters Palmera & Palmera Lounge
Session 4: Research Awards & Presentations Moderator: Thomas Hemmerling, MD, MSc, DEAA
1600 – 1715 Research Awards & Presentations Estrella
Friday, January 9, 20150715 – 0815 Registration & Continental Breakfast Palmera & Palmera Lounge
Session 5: Respiratory Monitoring to Optimize Mechanical Ventilation Moderator: Jeffrey Feldman, MD, MSE
0815 – 0845 Current State of Bedside Monitors to Optimize Ventilation - Estrella Jeffrey Feldman, MD, MSE
0845 – 0915 Respiratory Monitoring and Integrated Displays - Estrella Robert Loeb, MD
0915 – 0945 Respiratory Monitoring - Looking Over the Horizon - Estrella Igor Brodkin, MD
0945 – 1000 Panel Discussion - Estrella
1000 – 1030 Break with Exhibitors & Posters Palmera & Palmera Lounge
Session 6: Surgical Perioperative Home Moderator: Maxime Cannesson, MD, PhD
1030 – 1100 The Perioperative Surgical Home: What Problems Are We Trying to Solve? Estrella Zeev Kain, MD
1100 – 1130 Using Technologies to Help Clinicians Comply with Best Evidence / Best Practices Estrella Franklin Dexter, MD, PhD
1130 – 1200 How Can Technologies Help Clinicians Get Involved Outside the Operating Rooms and After Hospital Discharge? - Estrella Maxime Cannesson, MD, PhD

Schedule of Events continued
1200 – 1215 Panel Discussion - Estrella
1215 – 1230 STA Awards - Estrella
1230 – 1330 STA Business Luncheon Vernadero Lawn
Session 7: Concurrent Workshops1330 – 1530 1) Young Researchers Workshop Cervantes Thomas Hemmerling, MD, MSc, DEAA, Jorge Galvez, MD, Christine Lee, J. Mark Ansermino, MBBCh, Maxime Cannesson, MD, PhD
The objective of this workshop is to create a community of young scientists. In this community, researchers will share their experiences in the scientific field, individual research, as well as foster potential collaborative relation-ships to further promote the advancement of anesthesia research.
1330 – 1530 2) Visual Analytics Dashboard Design Estrella West Luis Ahumada, MSCS
Attendees at this interactive workshop will review and practice the funda-mental Tufte-Few principles of visualization of clinically relevant data. The ongoing adoption of anesthesia information management systems has created an opportunity for users to represent and analyze anesthesia data in many ways, including tabular reports, charts, graphs, dashboards and scorecards. How this data is displayed can be of similar importance to the validity of the data. In a clinical setting, we encounter unique challenges when transforming anesthesia data into visual analytics dashboards and scorecards. Attendees will review the Tufte-Few principles and then form groups that will create mock visual analytics dashboards which will then be critiqued, compared, and discussed.
Session 8: Concurrent Workshops 1530 – 1730 1) Complex Care and Clinical Decision Support (CDS) - Make My AIMS Smarter! Cervantes Brian Rothman, MD
This interactive workshop will explore common themes in CDS architecture, end-user design and why CDS is becoming ever more vital with increasing care pathway complexity. After establishing core care pathway and CDS tenets, learners will volunteer their wish-lists for AIMS CDS. One (perhaps two if time allows) of these will be selected by the group. Learners will then define the problem to solve, the business logic needed, the architecture and data elements required, what will be required to deliver the CDS to the end-user, the outcome or action expected and finally, if feedback on any actions taken is necessary and how and to whom it should be delivered.
1530 – 1730 2) Performance Metrics and Clinical Outcomes - Automated AIMS Analytics In (Near) Real Time! - Estrella West Jonathan Wanderer, MD
This interactive workshop will explore opportunities, issues and dilemmas encountered when utilizing AIMS and other EMR data sources to develop clinician-level metrics for automated reporting. After reviewing our current required metrics and the rationale for providing clinicians with feedback, learners will develop ideas for performance metrics that would be meaning-ful in their own clinical context. Several ideas will be chosen by the group, and implementation requirements and potential pitfalls explored. In the second half, learners will brainstorm possible clinical outcomes that could be delivered via automated reporting. Data sources for outcomes reporting will be considered, and the potential utility of and methods for connecting clinicians to their patients’ outcomes will be discussed.
1530 – 1730 STA Engineering Challenge Estrella East
1800 – 2130 STA Dinner Event Palmera & Palmera Lounge & Patio
Saturday, January 10, 20150730 – 0830 Registration & Continental Breakfast Estrella Patio
Session 9: Help! My Computer is Telling Me What to Do Moderator: J. Mark Ansermino, MBBCh
0830 – 0900 Team Cognitive Work Analysis: Understanding Different Perspectives on Shared Technologies - Estrella Catherine Burns, PhD
0900 – 0930 Mobile Patient Monitoring: Designing the Transition from Sensors and Displays to Decision Support Tools - Estrella Matthias Gorges, PhD
0930 – 1000 Development and Use of the Smart Anesthesia Manager (SAM) – An AIMS Based Real-Time Decision Support Module - Estrella Bala Nair, PhD
1000 – 1015 Panel Discussion - Estrella
1015 – 1030 Break - Estrella Patio
Session 10: AIMS Panel: Breaking Up is Hard to Do Moderator: Richard Epstein, MD
1030 – 1100 Driving Reporting and Quality Improvement - Estrella Patrick Guffey, MD
1100 – 1130 Building a Perioperative Data Warehouse From Your AIMS Data Estrella Matthew Levin, MD
1130 – 1200 Long Term Planning for Your Anesthesia Software and Data - Estrella Patrick McCormick, MD
1200 – 1230 Panel Discussion - Estrella
1230 Adjourn

Royal Palms Resort & Spa Map
Commercial Supporters & Exhibitors
C
A
H
D
B
F
IG
J
L
K
E
Camelback Mountain
105 -112
123 -124
121
122
119 -120
138 -142143 -148
149 -154
132 -137
201 -219
301 -319220 -236
320 -336
235 233
126 -131125
114 -118
602.840.3610royalpalmsresortandspa.com
N
Montavista
Alvadora Spa
Valencia Casitas
Designer Casitas & Villas
The Mix Up Bar
Event Salons
Reception
VernaderoVernadero LawnEstrella CervantesPalmeraBusiness CenterValencia GardenJardin di’ AmoreAlegria LawnAlegria GardenCabana GrillFitness Center
ABCDEFGHIJKL
Map Legend
T. Cook’s Restaurant
Commercial Supporters Exhibitors• Becton Dickinson• Covidien• Criticare Systems• Dräger• GE Healthcare• Hummingbird Sensing Technology• Masimo• Philips Healthcare• Spacelabs Healthcare
• AlertWatch• Dynasthetics• Graphium Health• Micropore• MIRU Medical Systems• Nihon Kohden• Oricare• Respiratory Motion• Revolutionary Medical Devices• Talis Clinical• Xhale Assurance

AlertWatchAlertWatch develops real-time patient monitoring dashboards to help anesthesia practices im-prove clinical quality, provider workflow, and billing accuracy.
Becton DickinsonBD is a leading medical technology company that partners with customers and stakeholders to address many of the world’s most pressing and evolving health needs. Our innovative solutions are focused on improving drug delivery, enhancing the diagnosis of infectious diseases and cancers, supporting the management of diabetes and advancing cellular research. We are nearly 30,000 associates in 50 countries who strive to fulfill our purpose of “Helping all people live healthy lives” by advancing the quality, accessibility, safety and affordability of healthcare around the world. For more information, please visit www.bd.com.
CovidienCovidien has a long history in respiratory care and decades of experience in such areas as patient monitoring, ventilation and airway management. Covidien Respiratory and Monitoring Solu-tions is committed to taking a comprehensive approach to developing innovative products and improving outcomes by focusing on three key areas: patient safety, medical efficacy and health-care efficien cy. Covidien offers a suite of industry-leading monitoring technologies that provide clinicians with critical patient information enabling them to make patient-care decisions quickly and effectively.
Criticare SystemsCriticare Systems develops, markets and distributes a wide range of patient monitoring devices and anesthetic gas monitoring systems, which incorporate technological innovation with cost-effective features. Criticare products address patient safety concerns and monitoring needs in anesthesia, critical care, respiratory care, transport and outpatient care environments. Criticare Systems is based in Waukesha, Wisconsin.
DrägerDräger is a leading international company in the fields of medical and safety technology. Dräger products protect, support and save lives. Founded in 1889 and located in Lübeck, Germany, the company generated revenues of around EUR 2.18 billion in 2010. Dräger is present in 190 coun-tries with 11,000 employees worldwide.
Sponsorship Levels
Company Descriptions
Platinum PlusBecton Dickinson ................................................www.bd.com/us
Covidien ............................................................ www.covidien.com
Masimo ................................................................www.masimo.com
PlatinumDräger .................................................................. www.draeger.com
SilverCriticare Systems .................................................www.csiusa.com
GE Healthcare ........................................ www.gehealthcare.com
Hummingbird Sensing Technology ........... www.hummingbirdsensing.com
Philips Healthcare .............. www.usa.philips.com/healthcare
Spacelabs Healthcare ............www.spacelabshealthcare.com
Entrepreneur Gold Dynasthetics ............................................ www.dynasthetics.com
Graphium Health ............................www.graphiumhealth.com
Micropore .......................................................... www.spiralith.com
Oricare ..........................................................www.oricaremed.com
Talis Clinical .................................................www.talisclinical.com
Entrepreneur Silver AlertWatch ................................................... www.alertwatch.com
MIRU Medical Systems ............................... www.mirumed.com
Nihon Kohden ......................................................www.nkusa.com
Respiratory Motion .................... www.respiratorymotion.com
Revolutionary Medical Devices .............www.rmdevices.com
Xhale Assurance ...............................www.assurance.xhale.com

Company Descriptions (continued)
DynastheticsDynasthetics, LLC manufactures the Vapor-Clean filters that are used to prevent a patient sus-ceptible to Malignant Hyperthermia from exposure to dangerous trace anesthetic vapors by the anesthesia machine. It eliminates the need for lengthy flushing and provides continuous protec-tion for a case lasting up to 12 hours. The Vapor-Clean may also be used in an actual MH crisis to stop exposure to volatile gas thereby allowing the clinician to focus on administering dantrolene. The Vapor-Clean has been used by hospitals around the world to provide both excellent patient protection and care while saving the time, money and uncertainty that accompanies flushing.
GE HealthcareGE is making a new commitment to health. Healthymagination will change the way we approach healthcare, with more than 100 innovations all focused on addressing three critical needs: lower-ing costs, touching more lives and improving quality.
Graphium HealthThere is a problem in today’s surgical experience. Because of the analog methods by which point-of-care information is recorded, data is disconnected from those who need it: Doctors can’t track their personal performance, administrators are prevented from finding system-wide effi-ciencies, and patients and families are left in the dark. Founded by working physicians, Graphium Health developed a cloud hosted platform leveraging mobile form factors to connect all par-ties to the information they care most about. Our solution enables the collection and sharing of point-of-care information in an actionable manner so as to empower, unite, and enlighten the administration, the individual provider, and the patient unit.
Hummingbird Sensing TechnologyHummingbird Sensing Technology offers medical OEM manufacturers a comprehensive gas sen-sor range (O2, CO and CO2) that meets their precise requirements. Developed in constant con-sultation with the world’s leading medical device manufacturers, Hummingbird sensors meets the requirements for specific applications such as anesthesia, critical care ventilation, patient monitoring and pulmonary function testing.
MasimoMasimo is a global medical technology company that develops and manufactures innovative noninvasive monitoring technologies, including medical devices and a wide array of sensors that may enable earlier detection and treatment of potentially life-threatening conditions. A key medical technology innovator, Masimo is responsible for the invention of award-winning non-invasive technologies that are revolutionizing patient monitoring, including Masimo SET® pulse oximetry, Masimo rainbow® noninvasive and continuous hemoglobin (SpHb®), acoustic respira-tion rate (RRa™), Masimo Patient SafetyNet™, SedLine® (EEG-based) Brain Function Monitors, and Phasein™ respiratory monitors.
MicroporeMicropore manufactures solid, non-dusting CO2 absorbents for life support applications in the medical, submarine, military diving, mine safety and spacecraft markets. The company makes the only Lithium Hydroxide absorbent used in anesthesia workstations. Manufactured in the US, the anesthesia absorbents are fully recycled at the company’s facility in Maryland.
MIRU Medical SystemsMIRU develops medical devices to ensure patient safety, especially to reduce medication errors. MIRU products are focused in the area of anesthesia throughout the peri-operative process, with special emphasis on intra-operative (OR). SW solutions guarantee information flow to ensure the right information is avaialable at the right time, and HW solutions monitor medication admin-istration. These components can be used together but also with other third-party solutions. Appropriately managing drug delivery and automatically recording the results of operations of anesthesia improve not only patient safety, but also increase the efficiency of health personnel and hospital benefits.

Nihon KohdenLeader in patient monitoring, sleep diagnostics, neurology and cardiology instrumentation. The NK cap-ONE is the world’s first mainstream CO2 sensor designed for both intubated and non-intubated patients. Neonatal, pediatric, and adult high oxygen delivery face masks do not distort the ETCO2 waveform.
OricareOricare is a US based medical company with over 100 years of combined experience in Anesthe-sia, Patient Monitoring and ICU ventilators. We offer a variety of medical and point of care devic-es across the full spectrum of acuity levels. Our product portfolio includes: Anesthesia machines, ICU ventilators, OR tables and Lights and Medical air compressors. Cost effective, full featured technology with low life cycle costs. “YOUR HEALTHCARE, WE CARE”… Welcome to the Oricare booth, where representatives will be on hand to demonstrate the A9800 anesthesia system.
Philips HealthcarePhilips Healthcare develops innovative solutions across the continuum of care in partnership with clinicians and our customers to improve patient outcomes, provide better value, and ex-pand access to care. www.healthcare.philips.com.
Respiratory MotionRespiratory Motion, Inc. (RMI) is a new generation medical device company developing and com-mercializing the ExSpironTM. The ExSpironTM is a breakthrough non-invasive, real-time monitor that displays a continuous EKG-like trace of respiratory function. The ExSpironTM can provide an early indication of deteriorating or inadequate respiration in advance of adverse events and in advance of existing technologies. RMI’s goal is to cost-effectively improve the standard of care in respiration monitoring. See the ExSpironTM in action at our table.
Revolutionary Medical DevicesRMD creates products for airway management that are designed to improve patient outcomes, increase hospital reimbursement & revenue, reduce costs per procedure and promote hospital staff safety.
Spacelabs HealthcareWith over 60 years’ experience in providing anesthesia delivery solutions, Spacelabs provides perioperative solutions from low to high acuity. See ARKONTM, our “evolutionary” anesthesia delivery system that pushes the boundaries to provide advanced flexibility, ventilation and er-gonomics for you, the people that use these machines. Our solutions are assembled in the U.S.A. and backed by an award winning service team.
Talis ClinicalTalis Clinical was formed to meet the higher purpose of supporting safe patient care, while positively impacting the clinicians and providers. Our story begins with an initiative started over 10 years ago at the Cleveland Clinic to build a perioperative documentation system to support anesthesia care. This extensive development moved from documenting complex anesthesia workflows to providing guidance that could expose opportunities to improve patient care in real-time at the point of care. Today, Talis Clinical markets a product that supports the entire Perioperative Surgical Home (PSH). Our goal is to “Heighten Awareness of the Entire Anesthesia Management Opportunity.” We are honored to be carrying forward the work started by the anesthesiologists and engineers who initiated this important work.
Xhale AssuranceThe Assurance® Alar / Nasal SpO2 Sensor is the next generation of pulse oximetry. This FDA ap-proved sensor is attached to the nasal ala, the fleshy part of the side of the nose, a unique moni-toring site for pulse oximetry. This site is fed by both the external and internal carotid arteries; the latter also supplies blood to the brain. The rich vascular supply to the ala provides a strong, reliable signal, even when it is difficult to get a signal at the fingertips.
Company Descriptions (continued)
RESPIRATORYMOTION INC.
I N S P I R E D I N N O V A T I O N

Abstract Table of Contents
Abstract # Full Abstract Title First Name Last Name Degree(s) Organization
1 Using Electronic Medical Records Features - Are Hard-Stops the Way to Improve Documentation?
David Rico Mora MD University of Miami
2 The Anesthesia Hub - A Mobile Tool Launched to Improve Access to Critical Information. The Experience of a Large Multicenter Anesthesia Academic Practice
Luis I. Rodriguez MD University of Miami
3 Photoplethysmogram Baseline Modulation as a Measure of Respiratory Effort: A Free Breathing Protocol with Progressive Flow Restrictions at the Mouth
Paul Addison PhD Covidien
4 Running Wavelet Archetyping for Enhanced Detection of Cardiac Pulse Signal Components
Paul Addison PhD Covidien
5 Cost and Efficiency Analysis of Low Flow Sevoflurane Anesthesia Using Dragersorb Free Absorber
Fawn Atchison MD, PhD Cuyuna Regional Medical Center
6 Stable Phase Coupling Associated with Cerebral Autoregulation Identi-fied Using a Synchrosqueezed Cross-Wavelet Transform
Paul Addison PhD Covidien
7 Effect of Pneumoperitoneum During Laparoscopic Surgery on Plethys-mographic and Peripheral Venous Pressure Waveforms
Mueez Qureshi BS Yale University School of Medicine
8 Missing Physical Exam - Automatic Notifications Used to Improve Docu-mentation
David Rico MD University of Miami
9 The Meaning of Central Venous Pressure (CVP) Relative to Fluid Manage-ment and Blood Flow
Charles Davis BSEE NIVasc, Inc
10 Using Automated End-Tidal Control in Routine Clinical Practice Influences Fresh Gas Flow Rates and Demonstrates Inhalational Kinetics
Ross Kennedy MB, ChB, PhD
Christchurch Hospi-tal and University of Otago
11 How Good are Predictions of Awakening from a Drug Interaction Display? Ross Kennedy MB, ChB, PhD
Christchurch Hospi-tal and University of Otago
12 lnHealth – A Rapid Medical Software Development Platform Using “Internet of Things” (IoT) Communication Standards for Medical Device Interoperability
Matthias Görges PhD University of British Columbia
13 Comparing the Operating Range of Low-Cost Pulse Oximeters Christian Petersen MSc, PhD University of British Columbia
14 Feasibility of an Incandescent Pulse Oximeter Christian Petersen MSc, PhD University of British Columbia
15 Towards a Depth of Hypnosis EEG Simulator Christian Petersen MSc, PhD University of British Columbia
16 A Features Trends View of CO2 Breath Signals Michal Ronen PhD Covidien
17 A Representative Waveform of CO2 Breath Signals Michal Ronen PhD Covidien
18 Dashboard Design to Evaluate for Severity of Post-Tonsillectomy Hemor-rhage After Implementation of Ibuprofen
Jorge Galvez MD Children’s Hospital of Philadelphia
19 Capnography Monitoring in Procedural Sedation: A Hospital-Wide Cost-Avoidance Model
Michael Jopling MD Mount Carmel St. Ann’s Hospital
20 Attempts at Breaching a Fingerprint-Secured Automated Medication Dispenser Using Spoofs from Simple Fingerprint Molds
James Lamberg DO Penn State Hershey Medical Center
21 Accuracy of CAPTESIA, an Android Pulse Pressure Variation Application Olivier Desebbe MD University California, Irvine
22 ETCO2 Monitoring of Neonates During Conventional Ventilation Michal Ronen PhD Covidien
23 Pulse Oximetry-Derived Ventricular Function Curves Terence Rafferty MD, MBA Yale Universty School of Medicine
24 Normalizing PPG Signals to the AC Component - Applications for Moni-toring Volume Loss
David Silverman MD Yale Universty School of Medicine
25 Panda: A Smartphone App to Support Management of Postoperative Pain in Children
Nicholas West MSc University of British Columbia

Abstract Table of Contents (continued)
Abstract # Full Abstract Title First Name Last Name Degree(s) Organization
26 Non-Invasive Ventilation Monitoring During Remifentanil Challenge in CyP450-Deficient Patient
James Philip MD Respiratory Motion, Inc
27 How Low Can You Go? Examining Pharmacokinetically Defined Minimum Safety Bounds for Propofol During Closed-Loop Control of Anesthesia
Sonia Brodie MSc University of British Columbia
28 Evaluation of a Tabet-Based, Rapid Documentation System - EVENT-DOC™, During Real In-Hospital Medical Emergencies
Bala Nair PhD University of Wash-ington
29 Data Mining Infrastructure for AIMS Based Registry Hubert Kordylewski PhD Anesthesia Quality Institute
30 Discord in the Definition of Apnea: An Analysis of Apnea Duration in Sedated Volunteers
Sean Ermer BS University of Utah
31 Comparison of the Oxygen Delivery Efficiency of Five Different Nasal Cannula Designs
Kyle Burk BS (Candi-date)
University of Utah
32 Evaluation of the Efficacy of a Computer-Based Reminder System for the Timely Start of Intra-Operative Epidural Infusion for Post-Operative Pain Control
Aalap Shah MD University of Washington Medical Center
33 Non-Invasive Respiratory Volume Monitoring Provides Quantitative Mea-surements that Provide a Better Assessment of Ventilatory Status than Capnography-Generated Respiratory Rates
Christo-pher
Voscopou-los
MD Respiratory Motion, Inc
34 A Handoff Tool to Faciliate Transfer of Care from Anesthesia to Nurs-ing in Intensive Care Units
Aalap Shah MD University of Wash-ington
35 Administering Patient Reported Outcomes Measurement Informa-tion System (PROMIS) Tools via Tablet Computer and E-mail to Assess Health Measures in Pediatric Adenotonsillectomy Patients at Ambula-tory Surgery Centers
Allan Simpao MD Children’s Hospital of Philadelphia and University of Penn-sylvania
36 Analysis of the Predictive Potential of Pulse Oximeter Data for Admis-sion
Dustin Dunsmuir MSc University of British Columbia
37 Use of an Automated Cost Calculator to Quantify Anesthetic Cost Interventions
Jonathan Wanderer MD, MPhil Vanderbilt Univer-sity
38 Automated Decision Support for Anesthesia Provider Relief: An Initial Survey and Implementation Report
Jonathan Wanderer MD, MPhil Vanderbilt Univer-sity
39 Development of an International Standard for Lung Ventilator Vo-cabulary and Semantics
Steven Dain MD, FR-CPC
University of Wa-terloo
40 Development and Implementation of a Process to Notify Surgeons via Text Messaging When Specified Events in the Anesthesia Informa-tion Management System are Documented
Richard Epstein MD Sidney Kimmel Medical College at Thomas Jefferson University
41 Development of a Device for Magnetically Guided Intubation Barrett Larson MD Stanford
42 A Design Analysis of SAMBA’s PONV Guidelines for Perioperative Clinical Decision Support
Brian Rothman MD Vanderbilt Univer-sity Medical Center
43 A Software System to Collect High-Resolution Respiratory Data for Analysis of Transient Airway Events During General Anesthesia
Ian Yuan MD, MEng Thomas Jefferson University
44 Domain Information Model for the Patient Centric Integrated Clinical Environment (ICE DIM)
Steven Dain MD, FR-CPC
University of Wa-terloo/Woodstock Hospital
45 Domain Information Model for Alarm Systems for the Patient Centric Integrated Clinical Environment (ICE DIM)
Steven Dain MD, FR-CPC
University of Wa-terloo/Woodstock Hospital
46 Pilot Study: Feasibility of Predictive Analytics for the Early Detection of Hypotensive Events
Christine Lee BS University California, Irvine

13
Return to Table of Contents
Using Electronic Medical Records Features – Are Hard Stops the Way to Improve Documentation?
Authors: Rico David, M.D., Rodriguez Luis I., M.D., Sinclair David, M.D. M.B.A., Candiotti Keith M.D., Lubarsky David, M.D. M.B.A.
Introduction: The development and meaningful use of Anesthesia Information Systems (AIS) has increased over the past decade, improving timing and accuracy of data recording, compared to handwritten records (1,2,3). It is the anesthesiologists’ ultimate responsibility to confirm the record’s completeness and accuracy. For this reason, some AIMS have developed features to assure completeness through automatic monitoring alerts (4), messaging (4), or use of Hard-Stops (1); which prevents the record from being finalized before all critical information is completed.
Methods: The anesthesiologists of the University provide coverage at multiple centers with different AIMS. We retrospectively analyzed the data for all surgeries and documentation completeness in 3 random months (April-June-September 2014), at 2 different hospitals: Center A uses PICIS and does not allow for hard-stops and Center B, which uses INNOVIAN, and allows for hard-stops.
We measured completeness of documentation at 48 hours, based on 7 variables required by our department for documentation and billing compliance. These variables were: start of anesthesia care, end of anesthesia care, patient re-evaluated immediately prior to induction, attending present for induction, attending present for emergence, attending present for critical events and attending present during positioning.
Because hard-stops utilized in Center B do not allow the record to be printed or closed, we assumed 100% compliance for these 7 events at the end of each case and when reviewed. Further, we found no reports of cases still opened at 24 to 48 hours in Center B.
Results: The number of cases with completed documentation in April 2014 was 1265/1327 (95.3%) in hospital A vs. 992 (100%) patients in hospital B. In June 2014, the number of cases with completed documentation were 1255/1317 (95.3%) in hospital A vs. 938 (100%) patients in hospital B. The number of cases with completed documentation in September 2014 were 1232/1279 (96.3%) in hospital A vs. 976 (100%) patients in hospital B.
Conclusion: As the tendency to implement AIMS increases, we must consider the different reporting capabilities and features such as hard-stops that each vendor offers, as this has implications for departments and billing compliance offices. Driscoll et al. stated, “An ideal AIMS should have the ability to detect the absence of essential information” (1).
We compared the use of hard-stops for billing and documentation completeness between 2 different centers with different AIMS, but used by the same group of providers. Although >95% compliance after 48 hours might be considered adequate, the implications for the billing department are important. Being able to customize an AIMS to a center’s needs is important, and the value of knowing that anesthesia records are 100% compliant before “case

14
Return to Table of Contents
closure” is critical. Ultimately, eliminating errors and missing information, improving billing revenue and enhancing anesthesia performance are all desirable results.
References:
1. Anesth analg 2007;104:1454-61 2. AANA J 2001;69:407-10 3. Can J Anaesth 1999;46:122-8 4. Anesth Analg 2006;103:390-5

15
Return to Table of Contents
The Anesthesia Hub – A Mobile Tool Launched to Improve Access to Critical Information. The Experience of a Large Multicenter Anesthesia Academic Practice
Authors: Luis I Rodriguez, MD, Frank Gencorelli, MD, David Lubarsky, MD, MBA Introduction: During the last couple of decades, the healthcare system has seen a dramatic improvement of information technology (IT), electronic medical records and mobile-based medical applications for patient care. For some providers, this might seem like the perfect world, but for others, it is becoming increasingly difficult to keep up (1). Medical IT can help prevent errors and adverse events by improving communication between providers and allowing knowledge to be readily available (2), especially in crisis situations. Methods: With the use of Hubspring.com, we designed a web platform for mobile devices that contained critical information to the Department of Anesthesia providers -the “Anesthesia Hub”. All information was publicly available in different sites, but not easily accessible during critical events. The information included in the Anesthesia Hub is: contacts, departmental policies and protocols, including ever changing updated Ebola treatment protocols, facility and clinical resources, residency and administrative resources, and all provider schedules. We progressively launched the application after an oral presentation to the residents (CA-1 to CA-3), then proceeded to include all faculty and per diems after 2 weeks. After 1 month of usage, CRNA’s from 3 of our centers were included. We then continued to monitor the daily and weekly individual usage of the application and measured adoption of this new technology. Results: A steady increase of daily and weekly usage of the information tool has been measured. During week 1, with 21 users, the “Hub” was accessed 141 times. During week 4, 90 active users accessed the application 709 times. At week 9, 136 users accessed the application 636 times. At week 13, 167 active users accessed the “Hub” more than 1000 times. Discussion: As the healthcare industry adopts some of these mobile technologies, patient safety and the anesthesiologists vigilance is of concern. Recently, the Patient Safety Foundation published an article on the use of mobile devices and risk for distraction (3). In this article they discuss the different types of technologies and the concerns they pose, and also discuss solutions. We believe mobile technologies and the applications they carry can most effectively meet the need for updated critical information at every point of care during times of crisis, such as surgical emergencies, consults, evaluations, and epidemics. Our experience during the release of this application is very positive and demonstrates the providers’ need of tools that carry all the latest information in an easily accessible manner. References:

16
Return to Table of Contents
(1) NEJM 2007;356:2527-2534 (2) NEJM 2003;348:2526-2534 (3) APSF Newsletter 2014;29:3-5
0 300 600 900
1200 1500
Week 1 Week 2 Week 3 Week 4 Week 5 Week 6 Week 7 Week 8 Week 9 Week 10
Week 11 Week 12
Week 13
Week 14
Week 15
Anesthesia Hub Usage per Week Active Users # of Times Hub used

17
Return to Table of Contents
1
Photoplethysmogram Baseline Modulation as a Measure of Respiratory Effort: A Free
Breathing Protocol with Progressive Flow Restrictions at the Mouth Presenting Author: Paul S. Addison, PhD, Technical Fellow. Covidien Respiratory & Monitoring Solutions, Edinburgh, Scotland, UK. Introduction: The manifestation of respiratory components in the photoplethysmogram (pleth) has been well documented in the literature [1,2] with much of the activity in this area focusing on the derivation of respiratory rate (RR). RR may be determined from an analysis of the periodicity of respiratory modulations present in the signal [3,4]. However, the strength of these modulations may be indicative of thoracic pressure changes associated with the effort to breathe that are transmitted to the peripheries through the vasculature [5,6]. Here we report on a preliminary study to determine the effect of changing airway pressures at the mouth on modulations in the pleth baseline for two finger sensors and an ear sensor. Method: With institutional review board approval and written informed consent, a convenience sample of 4 healthy adult volunteers was studied. These had been pre-screened and completed physical exams. During the trials, the subjects were positioned comfortably in a chair with the pulse oximeter sensors attached. A facemask was attached to each subject consisting of a spirometer containing a number of interchangeable flow resistors (5, 20 and 50 cmH2O/l/s linear resistors (Hans Rudolf Inc., Kansas City, MO)). Airway pressure signals at the mouth and pleth waveforms were synchronized and recorded via a custom data acquisition system. All subjects undertook both a constriction-on-inhalation protocol and a corresponding constriction-on-exhalation protocol. The value of flow constrictor resistance was set in turn to 0, 5, 20, 50 and 0 cmH2O/l/s for five consecutive periods of approximately 480 seconds. The subjects were allowed to breathe freely, i.e. respond freely to the changing airway resistance. Results: We generated time series of the pleth baseline modulations associated with respiratory activity. An example is shown in figure 1(a). The modulations were extracted using a bandpass filter with a range of 0.05 to 0.50Hz. The running median absolute deviations of the modulations were computed and are also shown in the figure as separate signals above the modulations. Note that these are factored by 10 to display them above the modulation signals. In addition, we plotted these baseline modulation strengths against the measured total flow resistance back-calculated from the pressure and flow signals. This is shown in figure 1(b). One signal from one probe experienced a large gain change during the run which rendered the data unusable. This was excluded from the analysis. A total of 23 signals (= 4 patients, inhalation and exhalation, 3 probes each minus the excluded signal) were used in the analysis. We found a generally increasing trend between the pleth-based respiratory effort parameter and increasing flow resistance for all three probes. Considering only the difference between the baseline (no resistor) to the highest value of constriction (50 cmH2O/l/s), it was found that all respiratory efforts increased. It was noted that the respiratory effort behavior was associated with an increase in baseline modulation at the frequency of

18
Return to Table of Contents
2
respiration of the arterial blood pressure trace and, in general, the subje cts also reduced their respiratory rates with increasing resistance.
Conclusions: The results suggest that the pleth may provide a measure of changing upper airway dynamicsindicative of the effort to breathe. In practice this may be useful for identifying upper airway obstructive events and/or lung compliance changes. A larger cohort would be required before more definitive conclusions could be reached. The development of a simple pleth-based non-invasive continuous measurement of the effort to breathe could could enable such a respiratory effort parameter to be available across multiple areas of care. Alone, or in conjunction with other parameters such as SpO2 and Respiration Rate (also available from the pleth), it may provide early warning of impending respiratory compromise including obstructive apneic events.
(a) (b)
Figure 1: (a) Pleth-Based Respiratory Effort over time. (b ) Aggregated Effort v Resistance Plot for Subject RE001 (Free Breathing/Exhalation Protocol) Three probes were used. Left Ear Sensor - Nellcor D-YSE (blue trace). Left Index Finger -Nellcor Max- A (red trace). Left Ring Finger - Nellcor Max- N (black trace). In (a) the running median absolute deviations of the modulations are factored by 10 to aid their visualization above the raw modulation signals. In (b) the colors correspond to groupings from resistance calculated for each resistor used.
References: 1. Shelley KH. ‘Photoplethysmography: beyond the calculation of arterial oxygen saturation
and heart rate’. Anesth Analg. 2007;105(6 Suppl):S31-S36. 2. Allen J, Frame JR, Murray A. ‘Microvascular blood flow and skin temperature changes in
the fingers following a deep inspiratory gasp’. Physiol Meas. 2002;23(2):365-373. 3. Addison PS, Watson JN, Mestek ML, Mecca RS. ‘Developing an algorithm for pulse
oximetry derived respiratory rate (RRoxi): a healthy volunteer study’. J Clin Mon Comp. 2012;26:45-51.

19
Return to Table of Contents
3
4. Addison PS, Watson JN, Mestek ML, Ochs J.P., Uribe A.A., Bergese S.D. ‘Pulse Oximetry-Derived Respiratory Rate in General Care Floor Patients’. J Clin Mon Comp. 2014; May, Published Online.
5. Addison P.S., Watson J.N., Ochs J. P., Neitenbach A-M., Mestek M.L, ‘Flexible Pulse Oximeter Probe Design for Monitoring Respiration Parameters: A Feasibility Demonstration’. IAMPOV Symposium, Yale University, New Haven, CT, 29 June – 1 July 2012, Program Syllabus, 40-41.
6. Addison P.S., Watson J.N. ‘Enhanced Measurement of Respiratory modulations using a Flexible Pulse Oximeter Probe’. Abstracts of Papers Presented at the 2014 Annual Meeting of the Society for Technology in Anesthesia (STA), Anesth Analg Suppl. 2014. In print.

20
Return to Table of Contents
1
Running Wavelet Archetyping for Enhanced Detection of Cardiac Pulse Signal Components
Presenting Author: Paul S. Addison, PhD, Technical Fellow. Covidien Respiratory & Monitoring Solutions Introduction: Pulse oximeters display two important parameters: SpO2 and Pulse Rate (PR). During clinical use, deviations of these parameters outside of threshold settings drive alarms on the device. However, the performance of pulse oximeter-based PR often receives less attention than SpO2. The posting of erroneous PR values could, however, have serious consequences, such as increasing the number of false alarms, providing false reassurance, prompting unnecessary interventions, or generally undermining the credibility of the oximeter altogether [1]. Thus accurate detection of the pulse component in the photoplethysmogram (pleth) is of critical importance in the design of a pulse oximeter. Here, a novel time-frequency archetyping method for detecting the cardiac pulse component within a pleth is described. Method: In order to monitor a repeating pulse feature within a signal we may build up a characteristic, or archetype, signal segment which is representative of the waveform. We may average beats within the vicinity of each other or use an IIR scheme were we build up an archetype by adding a weighted value of the most recent waveform to the current ‘running’ archetype. Such methods require that fiducial points are detected on each waveform (e.g. beginning and end point) in order for it to be extracted, aligned and used to update the running archetype. Errors in fiducial detection due to signal noise may make it very difficult for such schemes to work well and perform consistently in practice. The proposed method is based on the wavelet transform of the signal. This produces an unfolding of the signal information in the time-frequency plane, providing a superior view of the signal compared to the Fourier transform, which comprises a spectral-only interpretation [2]. In the proposed method a running wavelet archetype Trwa(a,b) is generated using a weighted averaging scheme as follows:
Trwa(a,b)=w.T(a,b) + (1-w).Trwa(a,b-P(a)) [1] where w is the weight, T(a,b) is the currently computed wavelet transform at scale a and dilation b, and Trwa(a,b-P(a)) is the previous archetype value separated from the current value by a scale dependent period P(a). Each time a wavelet transform value is computed it is used with the previous archetype transform value to form a new value of the archetype transform. In the method, the delay time P(a) is set to the natural period of the wavelet at each scale considered, thus there is no requirement for the determination of fiducial points as the wavelet information is naturally ‘rolled up’ at each scale using P(a). Results: Figures 1 and 2 illustrate the method. The top plot is a scalogram of a pleth computed using a Morlet wavelet [3]. The signal, acquired as part of an ad hoc bench study on the author, is relatively poor and the pulse band is barely seen across the scalogram. The archetype scalogram is shown in figure 2. The pulse band across the top part of the archetype scalogram

21
Return to Table of Contents
2
is much more distinct than that of the original scalogram and many of the breaks in the pulse band have now merged. This is particularly obvious in the segments outlined by the two boxes in figure 1. It can be observed that the pulse band in the running wavelet archetype of figure 2 is continuous across these periods. This facilitates the extraction of the frequency of the pulse (PR) in the time-frequency domain.
Conclusions: A method has been developed to optimize the detection of the pulse component within a photoplethysmographic signal by employing a novel running wavelet archetyping method. This method will aid in the determination of the pulse rate in difficult monitoring conditions. Additionally, the method is particularly novel in that there is no requirement for the determination of fiducial points as the wavelet information is ‘rolled up’ at the natural period of each scale. This is important as the identification of fiducial points is often the main cause of errors in traditional signal averaging techniques. Note that, as the signal component of interest moves to another scale (for example a pulse band moving due to a change in heart rate), more energy appears in the transform at that scale and thus, through the archetyping process, a new dominant component of the archetype will evolve at the new scale. It is suggested that the method may be used with other transformations which provide realizations of signals at multiple scales where an intrinsic period or periods may be determined.
References [1 ] Addison P.S., Mannheimer P.D., Ochs J., ‘Pulse Rate Performance of Two Pulse Oximeters
during Challenging Monitoring Conditions’. Covidien White Paper, 2014. [2 ] Addison PS. ‘The Illustrated Wavelet Transform Handbook’. New York: Taylor & Francis;
2002. [3 ] Addison P.S., J.N. Watson and T. Feng, ‘Low-Oscillation Complex Wavelets’. Journal of
Sound and Vib ration, 2002, 254(4): 733-762.
Figure 1: Wavelet Transform Scalogram of a Pulse Oximeter Photoplethysmogram

22
Return to Table of Contents
3
Figure 2: Running Wavelet Archetype Corresponding to the Scalogram of Figure 1.

23
Return to Table of Contents
Cost and Efficiency Analysis of Low Flow Sevoflurane Anesthesia Using Dragersorb Free Absorber
Presenting Author: Fawn W. Atchison, MD, PhD, Cuyuna Regional Medical Center, Crosby, MN 56441
Co-Author: Mark W. Gujer, MD, Cuyuna Regional Medical Center, Crosby, MN 56441
Background/Introduction: Low flow anesthesia using Desflurane is known to produce cost savings compared to normal flow, but Desflurane is also more expensive than Sevoflurane. To our knowledge, no study has been done for low flow anesthesia using Sevoflurane. One of the limitations has been the commonly recommended 2 L/min fresh gas flow during Sevoflurane anesthesia to minimize Compound A. Because of the new technology in soda lime production from Drager, its Dragersorb Free absorber does not generate Compound A, in contrast to the traditional absorber Dragersorb 800+. Therefore, it is now feasible to study the cost effectiveness of low flow Sevoflurane anesthesia vs. normal flow conditions. We hypothesize that low flow Sevoflurane anesthesia is more cost effective and efficient, even taking into account of the higher cost of the special Dragersorb Free absorber.
Methods: Consecutive general anesthesia cases utilizing Sevoflurane were included in the study using Drager Apollo machine. Low Flow group (n=28 cases) used Dragersorb Free absorber; Normal Flow group (n=30 cases) used Dragersorb 800+ absorber. After IV induction and intubation, oxygen flow was reduced to 4 L/min until patients achieve 0.5 MAC as calculated by age on the anesthesia machine. Then, the Low Flow group had combined O2 and air flow reduced to 1 L/min, the Normal Flow group had combined O2 and air flow reduced to 2 L/min, until all patients reach 1 MAC volatile anesthesia during prep and prior to incision. The 1 MAC volatile anesthesia was maintained while intraoperative care continued by IV balanced technique until emergence and extubation. Data points were collected from the Drager Apollo DataLog, including duration of general anesthesia, O2 and air consumption, Sevoflurane consumption and uptake. The time from surgery end to extubation was also collected. All cases were conducted by a single anesthesiologist using consistent techniques without variation. Data were entered and analyzed in Excel spreadsheet. Statistical analysis was performed for the two data groups using unpaired Student’s t-Test in Excel; statistical significance is defined as p<0.01.
Results: The average life span of Dragersorb Free absorber was 929 min for Low Flow, compared to 1530 min for Dragersorb 800+ for Normal Flow, resulting in absorber cost of $0.022/min (Low Flow) vs. $0.011/min (Normal Flow). However, the cost of Sevoflurane volatile was $0.08/min for Low Flow, and $0.12/min for Normal Flow. Therefore, for every min of anesthesia, combined absorber and volatile cost was $0.102/min for Low Flow, vs. $0.131/min for Normal Flow, resulting in cost savings of $0.03/min (p<<0.005). The average case length was 133 min for Low Flow, 102 min for Normal Flow (p=0.032), and the average

24
Return to Table of Contents
time to extubation was not significantly different between the two groups (3.7 min for Low Flow vs. 5.5 min for Normal Flow, p=0.095). The efficiency of Low Flow resulted in Sevoflurane waste of 38%, compared to 57% for Normal Flow (p<<0.005).
Conclusion: Low flow anesthesia for Sevoflurane using the Dragersorb Free absorber results in savings of $0.03 per min of anesthesia time and less volatile anesthetic environmental waste compared to normal flow. Even greater cost savings were observed using low flow Sevoflurane compared to low flow Desflurane (unpublished data, Atchison). Assuming an average of 6 hours anesthesia time per day per operating room, utilizing the Low Flow Sevoflurane anesthesia technique will result in at a minimal $2,808 savings per OR per year, simply by taking advantage of the new soda lime absorber technology. This change in practice could produce huge cost savings in terms of medical economics across the country.

25
Return to Table of Contents
1
Stable Phase Coupling Associated with Cerebral Autoregulation Identified Using a Synchrosqueezed Cross-Wavelet Transform
Presenting Author: Paul S. Addison, PhD, Technical Fellow
Introduction: Cerebral autoregulation is the response mechanism which regulates cerebral blood flow (CBF) over a wide range of systemic blood pressures (BP). The level of cerebral tissue oxyhaemoglobin saturation (rSO2) measured by near infrared spectroscopy (NIRS) has been suggested as a suitable surrogate for the measurement of CBF. NIRS is non-invasive, continuous and does not require the caregiver manipulation associated with the measurement of CBF [1]. A novel time-frequency decomposition method is proposed here, based on wavelet transforms [2], for the analysis of the relationship between BP and rSO2. Method: The cross-wavelet transform of two signals, f and g, may be expressed in complex exponential form as
( ) ( ) ( )),(),(, ,,),( babai
gfgffgebaTbaTbaCrWT φφ −= [1]
where it can be seen that its phase angle is simply the phase difference between the transforms of the individual signals. CrWT phase therefore represents a phase difference map over a range of scales (or frequencies) and temporal locations. It is also known that the components in the wavelet transform domain may be reassigned through a process of synchrosqueezing [3] where an instantaneous frequency may be found for each point in the transform domain as follows:
( )bbafi ∂
∂=
,21 φπ
[2]
This derivative of phase with respect to time is the frequency of phase cycling corresponding to the transform component at that point in the transform domain. In the method proposed here, CrWT components are reassigned by moving them up or down the transform plane to a new location corresponding to fi. Note also that a low oscillation Morlet wavelet was used with a central frequency of ω0=3 rad/sec. This differs from the standard Morlet in that it is has higher temporal localization [4]. It is assumed that a constant, near zero phase difference between rSO2 and arterial BP implies positive correlation (c.f. the COx measure [1]) and hence an impaired cerebral autoregulation mechanism. Conversely, a phase difference of +/-π radians, randomly distributed or rapidly varying phase corresponds to intact cerebral autoregulation. In the proposed method, the CrWT is synchrosqueezed (Synchro-CrWT) whereby stable phase differences between the two signals will manifest as significant energy at the zero-frequency level of Synchro-CrWT. Thus regions of stable phase coupling may be discerned. Results: An example of the method is shown in figure 1. Figure 1(a) contains arterial BP and associated rSO2 signals. The corresponding COx measurement is shown in figure 1(b). The phase difference map from CrWT is shown in figure 1(c) in the range 0.0025 to 0.0050Hz. The level corresponding to a cycle length of 300 seconds (0.0033 Hz) – typically used for COx measurements [1] - is indicated by the line drawn across the plot. Figure 1(d)

26
Return to Table of Contents
2
contains the zero frequency component of the Synchro-CrWT. This essentially collects the transform energies at stationary phase values. The plot therefore provides an indication of periods where the phase difference between the two signals is relatively constant. Conclusions: The use of wavelet-based techniques to aid the interpretation of complex time-variant signals by producing qualitative and quantitative evidence of cerebrovascular autoregulation that is “not possible using other methods” has been recognised by Smith [5] in his detailed review of the clinical applications of near infrared spectroscopy. He also suggested that such methods are likely to translate readily into clinical practice. Here, two powerful wavelet-based analysis methods have been combined: the cross-wavelet transform (to provide a phase difference map) and synchrosqueezing (to collect the stable phase terms). It is suggested that this tool may prove useful in the analysis of such complex signal relationships. In particular it may be useful as a quality index in the development of a robust COx algorithm.
1000 2000 3000 4000 5000 6000 7000 8000 9000
6080
100120
ABP (--k) / RSO2L (k)
1000 2000 3000 4000 5000 6000 7000 8000 9000-0.5
0
0.5
COx
1000 2000 3000 4000 5000 6000 7000 8000 9000
10-2.6
10-2.5
10-2.4
Phase Map of CrWT
1000 2000 3000 4000 5000 6000 7000 8000 9000
0
1
2
x 104 Synchrosqueezed Phase Map
time (secs)
rSO2 & BP
COx
Synchro-‐CrWT
CrWTPh
ase
Figure 1: COx and Phase computed from ABP and rSO2 Signals (a) BP (top) and rSO2 Signal (bottom). (b) COx Measure. (c) CrWT Phase Map. (d) Synchro-CrWT at Zero Phase Cycling. References [1] Brady K.,Joshi B.,Zweifel C., Smielewski P., Czosnyka M.,Easley RB.,Hoque CW Jr. Real-
time continuous monitoring of cerebral blood flow autoregulation using near-infrared spectroscopy in patients undergoing cardiopulmonary bypass. Stroke 2010; 41(9):1951-6.
[2] Addison PS. The Illustrated Wavelet Transform Handbook. New York: Taylor & Francis; 2002.
[3] Daubechies, I., Maes, S. A nonlinear squeezing of the continuous wavelet transform based on auditory nerve models. Wavelets in Medicine and Biology, 1996: 527-546.
[4] Addison P.S., J.N. Watson and T. Feng, ‘Low-Oscillation Complex Wavelets’, Journal of Sound and Vibration. 2002; 254(4): 733-762.

27
Return to Table of Contents
3
[5] Smith M. Shedding light on the adult brain: a review of the clinical applications of near-infrared spectroscopy. Philosophical Transactions of the Royal Society Series A, Mathematical, Physical and Engineering Sciences. 2011; 369:4452-69.

28
Return to Table of Contents
Effect of Pneumoperitoneum During Laparoscopic Surgery on Plethysmographic and Peripheral Venous Pressure Waveforms
Presenting Author: Mueez Qureshi, B.S., FAER medical student from Florida State University College of Medicine Co-Authors: Zingg Tobias M.D., Kirk Shelley M.D. Ph.D., and Aymen Alian M.D. Department of Anesthesiology, Yale University School of Medicine, New Haven, CT Introduction: Laparoscopic surgery consists of insufflation of the peritoneal cavity to create a pneumoperitoneum1. This increases intra-abdominal pressure and conduces transmission of abdominal pressure to the thoracic cavity2,3. In turn this leads to increases in cardiac filling and airway pressures4. A recent study has shown that the peripheral venous pressure (PVP) waveform significantly changes during hypovolemic challenge in healthy volunteers5. The PVP waveform may be a minimally invasive and highly sensitive means to detect early blood loss. Methods of extracting arterial and venous volume status from the photoplethysmogram (PPG) waveform have been developed6, however, the application of these methods during pneumoperitoneum have not been studied. The present study explores the analysis of the PPG and PVP waveforms during laparoscopic surgery to investigate changes in venous and arterial blood pools. Methods: With IRB approval, 15 patients undergoing elective laparoscopic procedures were studied. All patients were induced with general anesthesia and mechanically ventilated using controlled volume (~8cc/kg). Finger pulse oximeter (finger PPG Nellcor & Masimo), peripheral venous pressure (PVP) transduced from an intravenous catheter, blood pressure, end tidal carbon dioxide, and airway pressure (AWP) were recorded at 100 Hz with a data acquisition system (Collect 5/S, GE) and analyzed using Spectral Fast Fourier Transform analysis (spectrum, 4K, Hamming, Total power, 94% overlap) with LabChart 8.05 (ADInstruments). Analysis included measuring the total power of the AC (amplitude modulation at the respiratory frequency) and DC modulation (baseline modulation induced by ventilation) of the PPG and PVP waveforms. Time domain analysis consisted of measuring the baseline, area, maximum slope, minimum slope, average slope, and width of the finger PPG, PVP, and AWP. Data are presented as percent changes. Student’s t-test (Excel Microsoft) were used; P<0.05 was statistically significant. Results: There were significant changes in PPG (amplitude, DC, AC, DC%, and AC%), PVP (mean pressure, DC, AC, DC%), and AWP waveforms during insufflation and following desufflation. These results are summarized in Tables 1-4. Average insufflation pressures ranged from 11 to 20 mmHg (mean 15 mmHg). On average, patients received 2308 ml of crystalloid by end of surgery. Conclusion: Laparoscopic surgeries are commonly performed for a variety of conditions due to smaller surgical incisions, reduced pain, and shorter length of
29
Return to Table of Contents
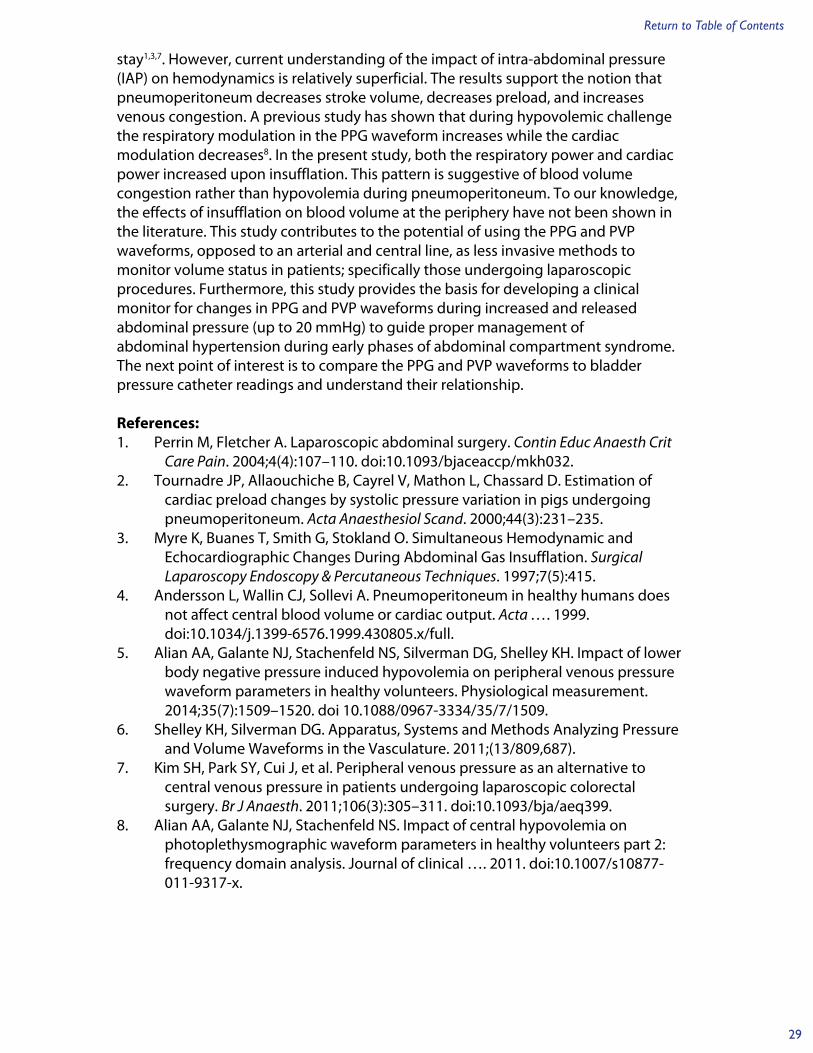
stay1,3,7. However, current understanding of the impact of intra-abdominal pressure (IAP) on hemodynamics is relatively superficial. The results support the notion that pneumoperitoneum decreases stroke volume, decreases preload, and increases venous congestion. A previous study has shown that during hypovolemic challenge the respiratory modulation in the PPG waveform increases while the cardiac modulation decreases8. In the present study, both the respiratory power and cardiac power increased upon insufflation. This pattern is suggestive of blood volume congestion rather than hypovolemia during pneumoperitoneum. To our knowledge, the effects of insufflation on blood volume at the periphery have not been shown in the literature. This study contributes to the potential of using the PPG and PVP waveforms, opposed to an arterial and central line, as less invasive methods to monitor volume status in patients; specifically those undergoing laparoscopic procedures. Furthermore, this study provides the basis for developing a clinical monitor for changes in PPG and PVP waveforms during increased and released abdominal pressure (up to 20 mmHg) to guide proper management of abdominal hypertension during early phases of abdominal compartment syndrome. The next point of interest is to compare the PPG and PVP waveforms to bladder pressure catheter readings and understand their relationship. References: 1. Perrin M, Fletcher A. Laparoscopic abdominal surgery. Contin Educ Anaesth Crit
Care Pain. 2004;4(4):107–110. doi:10.1093/bjaceaccp/mkh032. 2. Tournadre JP, Allaouchiche B, Cayrel V, Mathon L, Chassard D. Estimation of
cardiac preload changes by systolic pressure variation in pigs undergoing pneumoperitoneum. Acta Anaesthesiol Scand. 2000;44(3):231–235.
3. Myre K, Buanes T, Smith G, Stokland O. Simultaneous Hemodynamic and Echocardiographic Changes During Abdominal Gas Insufflation. Surgical Laparoscopy Endoscopy & Percutaneous Techniques. 1997;7(5):415.
4. Andersson L, Wallin CJ, Sollevi A. Pneumoperitoneum in healthy humans does not affect central blood volume or cardiac output. Acta …. 1999. doi:10.1034/j.1399-6576.1999.430805.x/full.
5. Alian AA, Galante NJ, Stachenfeld NS, Silverman DG, Shelley KH. Impact of lower body negative pressure induced hypovolemia on peripheral venous pressure waveform parameters in healthy volunteers. Physiological measurement. 2014;35(7):1509–1520. doi 10.1088/0967-3334/35/7/1509.
6. Shelley KH, Silverman DG. Apparatus, Systems and Methods Analyzing Pressure and Volume Waveforms in the Vasculature. 2011;(13/809,687).
7. Kim SH, Park SY, Cui J, et al. Peripheral venous pressure as an alternative to central venous pressure in patients undergoing laparoscopic colorectal surgery. Br J Anaesth. 2011;106(3):305–311. doi:10.1093/bja/aeq399.
8. Alian AA, Galante NJ, Stachenfeld NS. Impact of central hypovolemia on photoplethysmographic waveform parameters in healthy volunteers part 2: frequency domain analysis. Journal of clinical …. 2011. doi:10.1007/s10877-011-9317-x.

30
Return to Table of Contents
Table 1 PPG, PVP, and AWP before and after insufflation
! Direction Before After Percent change P value
PPG amplitude ! 12.4055 11.0108 -11.24% 0.0009
PPG amplitude variation " 0.1782 0.7673 330.53% 0.0431
PPG cardiac power ! 14.6252 12.2535 -16.22% 0.0072
PPG respiratory power " 0.3146 1.2478 296.64% 0.0079
PPG DC% " 14.3607 34.1191 137.59% 0.0071
PPG AC% " 10.7684 24.8798 131.04% 0.0075
Peripheral venous
pressure (mmHg)
" 15.7205 22.2991 41.85% 0.00001
PVP cardiac power " 0.1668 0.3404 104.12% 0.0072
PVP respiratory power " 0.6054 1.2258 102.47% 0.0468
PVP DC% ! 230.1408 207.0807 -10.02% 0.0468
AWP(cm H2O) " 10.2198 13.3453 30.58% 0.0001
!
Table 2 PPG, PVP, and AWP before and after desufflation
! Direction Before After Percent change P value
PPG amplitude " 11.4255 12.4396 8.88% 0.0016
PPGamplitude variation
! 0.4671 0.1404 -69.94% 0.0075
PPG cardiac power
" 12.1046 14.0520 16.09% 0.0136
PPG respiratory
power ! 0.8565 0.4075 -52.43% 0.0045
PPG DC% ! 28.0649 18.3272 -34.70% 0.0011
PPG AC% ! 19.0642 10.1888 -46.56% 0.0008
Peripheral venous
pressure (mmHg)
! 23.8035 16.6796 -29.93% 0.000005
PVP cardiac power
! 0.8850 0.2731 -69.14% 0.0011
PVP respiratory
power ! 1.8651 0.6322 -66.10% 0.0017
PVP DC% " 179.4940 194.9288 8.60% 0.6557
AWP (cm H2O) ! 15.7578 3.1371 -80.09% 0.000000
! ! ! ! !

31
Return to Table of Contents
Table 3 PPG, PVP, and AWP Peak Analysis before and after insufflation
! Direction Before After Percent change P value
PPG MaxSlope ! 114.9019 102.3744 -10.90% 0.0037
PPG Slope ! 78.8163 66.4800 -15.65% 0.0008
PVP Baseline " 15.1679 21.4654 41.52% 0.0000
PVP MinSlope " -12.7103 -19.3504 52.24% 0.0268
AWP PeakArea " 17.6113 22.0194 25.03% 0.0001
AWP MinSlope " -39.3231 -51.3456 30.57% 0.00015
!
Table 4 PPG, PVP, and AWP Peak Analysis before and after desufflation
! Direction Before After Percent change P value
PPG Baseline " -4.1483 -4.9779 20.00% 0.0019
PPG PeakArea " 3.6214 4.2869 18.38% 0.0043
PPG MaxArea " 111.1243 120.3479 8.30% 0.0061
PPG MinSlope ! -45.4421 -43.0343 -5.30% 0.0090
PPG Width50 " 307.6357 347.2357 12.87% 0.0007
PPG Slope " 74.5971 82.5343 10.64% 0.005247
PVP Baseline ! 21.6687 15.7184 -27.46% 0.0000
PVP MinSlope ! -24.5475 -17.5671 -28.44% 0.0081
AWP PeakArea ! 23.6479 17.8421 -24.55% 0.0001
AWP MaxSlope ! 59.1671 51.7039 -12.61% 0.020455
AWP MinSlope ! -55.7829 -41.0850 -26.35% 0.000352
AWP Slope ! 57.6229 49.4989 -14.10% 0.036320
! ! ! ! ! !

32
Return to Table of Contents
Missing Physical Exam-Automatic Notifications Used to Improve Documentation Authors: David Rico Mora, MD; Luis I. Rodriguez MD; Keith Candiotti, MD
Introduction: Anesthesia Information Systems (AIS) help by automatically documenting certain events while the anesthesiologist focuses on patient care. This continues to evolve and now improve documentation through automatic process monitoring, alerts and reminders. Despite the fact AIS help to decrease incomplete records, delayed reimbursement due to incomplete records continue to be a problem (1, 2). These errors and lack of information can be addressed by timely alerts connected to paging systems (2), but many of them can be ignored by clinicians due to the great amount of irrelevant warnings and saturation. One strategy applied is to modify the design of more serious warnings (3). Methods: We retrospectively analyzed the records completeness in the period of March-December 2013. We measured the # of cases and pre-operative evaluations with and without physical exam. We focused on evaluations done over the phone with the physical exam to be completed the day of surgery. We studied 2 automatic notification systems to address physical exam documentation. The first method employed was massive e-mails to all anesthesia providers, reminding of need to document the physical exam. These notifications were sent by the department chair. This method was used once during the month of July and once in October. The second method was the use of an automatic alphanumeric page to physicians in charge of a case with missing physical exam during the pre-operative evaluation. We compared the differences between the initial values and the changes after the implementation of both systems of notification. Results: During the first 4 months of the study (March- June) the mean of pre-operative evaluations with missing physical exam was 30.3%. After the first e-mail sent, the percentage of missing physical exam dropped from 30.5% in June to 21.8% in July. This pattern was constant during the following months August (23.2%) and September (23%). In October, a second email was sent; the percentage of missing physical exam dropped to 17.3%. We then implemented the automatic notification system, and during the period of November-December the mean of missing physical exam dropped to 10.9%. Conclusions: There are different methods used to improve documentation. Of these, the least effective are formal lectures to providers and the most effective is the use of computer generated reminders, incentive rewarding, and sending e-mail reports. Other options are text pagers or using prompts alerting of missing information. (1, 4, 5) We confirmed that automatic reminders improve documentation of incomplete preoperative evaluations. We were able to significantly reduce the number of incomplete records, but we also recognize that reminder saturation or the overwhelming messaging leads to providers ignoring the message can still account for that 10.9% missing data. We plan to modify the messaging system and test a reminder in real-time.

33
Return to Table of Contents
References: 1. Anesth Analg
2008;106:192-201 2. Anesthesiology
2007;106:157-63 3. NEJM 2003;348:2526-34 4. Anesth Analg
2006;103:131-6 5. Mt Sinai J of med
2012;79:757-757
MONTH Total # Cases
Electronic Preops
Missing PE
March 1364 542 39.7% 166 30.6% April 1466 609 41.5% 182 29.9% May 1404 526 37.5% 158 30.0% June 1428 584 40.9% 178 30.5% July 1482 582 39.3% 127 21.8% August 1522 582 38.2% 135 23.2% September 1320 514 38.9% 118 23.0% October 1561 677 43.4% 117 17.3% Nov-Dec 1318 569 43.2% 62 10.9% TOTAL 12865 5185 40.3% 1243 24.0%

34
Return to Table of Contents
The Meaning of Central Venous Pressure (CVP) relative to Fluid Management and Blood Flow
Author: Charles L. Davis, BSEE, CEO, NIVasc, Inc.
In modern clinical medicine, our understanding of Central Venous Pressure (CVP) has evolved from Guyton, Magder, Rothe, Levy, Jayant, Gelman, Brengelmann, Reddi and Carpenter, and Marik to the effect that many physicians question the clinical utility of CVP in patient care? This confusion and controversy stems from a lack of understanding of the source and regulation of CVP in human physiology. Where it comes from, why it exists, and what it does in the overall control of blood flow? The CVP controversy is related to a similar controversy related to the definition of PreLoad, Norton? Recent advances in noninvasive hemodynamic monitoring (VasoMapTM) by NIVasc, Inc. have brought new insights and answers to these questions about CVP and Preload through the VasoMapTM’s ability to map the residual volume vs pressure structure of the entire Peripheral Vascular Loop(PVL) in a slice of the upper limb. The VasoMapTM and its PVL structure allows us to now examine the relationships between Pressure, Residual Volumes, Resistance, Compliance, and Flow (Figure 1) along the pathway of blood flow.
As seen in Figure 1 the PVL is a closed loop system comprised of serial vessels serving three different purposes and driven by a volume pump. It is important to understand the differences in purpose between the Arteries which “resist flow” and the Veins which “assist flow.” Ohm’s Law applied to the PVL demonstrates that CVP is nothing more than the pressure that remains (not dissipated by vascular resistance in the PVL segments) after the blood has taken its trip around the PVL along the pathway of flow. The Arteries make pressure while the Veins make
flow via venous return. The VasoMapTM measures the Compliance or Elastance of these vessels and therefore can determine the Stressed Volume vs Unstressed
Volume in each segment along the pathway of flow. It is the Stressed Venous Volume that determines Preload onto the Heart and Stressed Volume is a function of Volume and Vessel Elastance. Much confusion arises in fluid management in the absence of this information about the vascular status of the patient. It is clear from this model, that pressure is not the prime driver of the Frank-Starling mechanism but excess venous volume in combination with venous elastance. The
definition of Mean Circulatory Filling Pressure (Pms) proves this since there is no flow with a Pms of 7 mmHg. Preload, in essence, is the ‘Excess Volume’ presented at the Tricuspid
valve of the heart by the Venous Stressed Volume. Preload is not motivated unilaterally by the Blood Volume, but by the combination of Venous Elastance and Venous Blood Volume which is regulating
Figure 2
Figure 1

35
Return to Table of Contents
and optimizing Venous Return and Cardiac Output. Therefore, fluid management without the VasoMapTM and knowledge of the Venous Elastance and Stressed Venous Volume values in the patient’s PVL, limits the clinician to only a fraction of the variables involved in managing blood flow. CVP remains an important clinical parameter as it indicates the overall vascular status of the patient but not necessarily in the way it is interpreted by many clinicians today. The VasoMap PVL model simplifies and clarifies these relationships for the clinician in order to improve the management of circulation in the patient.

36
Return to Table of Contents
Using Automated End-Tidal Control in Routine Clinical Practice Influences Fresh Gas Flow Rates and Demonstrates Inhalational Kinetics
Presenting Author: Ross Kennedy, MB ChB PhD, Dept of Anaesthesia Christchurch Hospital and University of Otago, Christchurch, NEW ZEALAND Co-Author: Richard French MB BS Dept of Anaesthesia Christchurch Hospital, NEW ZEALAND Background: We have a long standing interest in the kinetics of volatile anaesthetics and consequently in encouraging low fresh gas flow rates (1,2). This meant that when replacing our anaesthetic machines, systems with automated control of end-tidal agent concentration were appealing. In 2010-2011 we installed 27 GE-Aisys with end-tidal control (ETc). At that time this was the only machine with automated vapour control available in New Zealand. There is an increasing body of evidence that these devices reduce volatile consumption and workload (3,4). Some anesthesiologists felt trainees would not learn volatile uptake and kinetics from these machines. It is our impression that watching how the automated system performs in various situations actually demonstrates theory well and that the uptake changes seen may provide useful information. The aims of this poster are a) to update our fresh gas flow rate experience and b) provide illustrations of how observing an automated controller demonstrates volatile kinetics. Method: Appropriate Ethics Committee approvals and written consents were obtained. We have described our methodology for collecting fresh gas flows from anaesthetic machines (4). In summary we collect flow rate and vaporizer dial settings from individual machines over several weeks. We then extract the fresh gas flow rate at times when vapor is being delivered and then derive mean FGF and the distribution of times at different flow rates for each sample and the pooled data. Previously collected flow rate data much of which has been published previously was used for comparison. Data was also collected from patients undergoing off-pump cardiac surgery. The end-tidal sevoflurane target was kept constant for up to 90 minutes. The changes in inspired and expired sevoflurane and ETCO2 around the time of cardiac manipulation were extracted. Results: Just prior to introduction of Aisys mean FGF was 1.26 l/min. In our latest sample (Aug 2014) mean FGF is 0.83 l/min. We saw an initial increase in overall FGF followed by a decrease over time as usage of ETc increased from 35% in 2010 to 85% in 2014.

37
Return to Table of Contents
The cardiac surgical cases show Fi-sevo decreasing 3-4%/hr while end-tidal remains constant, illustrating decreasing uptake with time. With cardiac manipulation we observe abrupt changes in Fi-sevo which parallel but are greater than changes in ET-CO2. Discussion: Introduction of machines with automated agent control has reduced our already low mean fresh gas flows by 1/3 representing a saving of $50,000 pa or around $2,000 per location per annum. In addition these machines clearly demonstrate inhalational kinetics and the effects of physiological changes on agent uptake. The changes in Fi-agent produced by the controller in response to changes in patient physiology may provide the basis for additional monitoring tools. References 1. Kennedy RR, French RA. Anesth Analg. 2008; 106:1487–90, 2. Kennedy R, French R. Anaesth Intens Care. 2014; 42:65–72. 3. Lortat-Jacob B, Billard V, et al. Anaesthesia. 2009; 64:1229–35. 4. Lucangelo U, Garufi G, et al. J Clin Monit Comput. 2014; 28:117–21.

38
Return to Table of Contents
How Good are Predictions of Awakening from a Drug Interaction Display? Presenting Author: Ross Kennedy, MB ChB PhD, Dept of Anaesthesia Christchurch Hospital and University of Otago, Christchurch, NEW ZEALAND Co-Authors: Margarita McKellow, Dept of Anaesthesia Christchurch Hospital, Christchurch, NEW ZEALAND; Jonathan Williman, PhD, Dept of Population Health, University of Otago, Christchurch, NEW ZEALAND Background: We have a long interest in guiding anaesthesia delivery based on estimated effect-site concentrations1. As with infusion anaesthesia there may advantages to using effect-site rather than end-tidal volatile concentrations to guide therapy. Commercial drug-interaction displays such as Drager’s Smart PilotView and Navigator from GE use data from models of the interaction between effect-site levels of hypnotics and opioids to display the probability of certain responses. Johnson found subjects woke within +/- 1 min of reaching the 50% probability of awakening2. The primary aim of this ongoing study is to assess the point at which patients undergoing a wide range of procedures and anaesthetic techniques first awaken and to relate this to response probabilities from GE-Navigator and to calculated effect-site sevoflurane concentration (Ce-sevo). We also wish to explore the effect of drugs not included in the modeling and to compare the distribution of Ce-sevo at awakening from our older studies. Method: Ethics committee approval. For the Navigator study we have data from 97 patients with either sevoflurane (85) or desflurane (22) anaesthesia. The data downloaded from Navigator includes drug doses and timings, and the calculated effect site concentrations and response probabilities over time. We recorded the time at which patients first responded to command (OASS=4/5) and extracted the data for that point in time. We also noted the time at which the probability of responding was 0.5. Data from another study was used to compare estimation of Ce-sevo. This study looked at the effect of surgery on Ce-sevo at awakening after anaesthesia for a range of surgical procedures in 60 subjects using locally developed systems3. Results: Navigator study: mean age 53yr (sd 20) range 16-89yr; weight mean 78(17)kg range 43-122kg. Duration of surgery 109(92)min range 27-828 min. 15 patients received clonidine [range 15-150mcg, mean 68(39)mcg] and 12 morphine [1.5-10mg mean 6(2.6)mg]. Subject woke a mean 4.1(5.0) min after the time they reached 0.5 probability of awakening and at a mean age adjusted MAC-fraction of 0.26(0.14) vol%. Use of adjuncts had a small non-significant effect on MAC-fraction (95%CI -0.096 to 0.037, p=0.38). There was no difference in the MAC-fraction at awakening between data generated by Navigator and our own system (95%CI difference -0.057 to 0.134, p=0.43). Comparing sevoflurane and desflurane there was no difference in the mean offset but desflurane had a narrower distribution.

39
Return to Table of Contents
The best-fit Gaussian distributions had mean (SD) of 2.7 (4.2) and 3.0 (2.8)min respectively. Comments: Subjects woke over a wide range of volatile concentrations and hence sedation probabilities. 75% of our subjects woke after the time of the 0.5 probability, in part due to different definitions of response. The use of adjuncts had a demonstrable but not statistically significant effect. Our local system for calculating Ce-sevo gave very similar results to Navigator. References 1. Kennedy RR, Sakowska MM. Anaesth Intens Care. 2006;34:116. 2. Johnson KB, Syroid ND et al. Anesth Analg. 2010;111:387. 3. Kennedy RR, McKellow M, et al. Anesth Analg. 2013;117:786.

40
Return to Table of Contents
Figure 1: lnHealth data flow, example screenshots and broker inspector example.
lnHealth – A Rapid Medical Software Development Platform using “Internet of Things” (IoT) Communication Standards for Medical Device Interoperability
Authors: Matthias Görges, PhD1, Christian L Petersen, PhD2, and J Mark Ansermino, MBBCh, FRCPC2 1) Electrical and Computer Engineering Department, 2) Department of Anesthesiology, Pharmacology & Therapeutics; The University of British Columbia, Vancouver, Canada Background: Clinical environments such as intensive care units, operating rooms, and increasingly general wards, are full of technically advanced monitoring (and therapy) devices. Unfortunately, and to the detriment of patient safety, many of these devices are unable to communicate with one another because of vendor incompatibilities and closed commercial standards. The lack of safety interlocks and limited information exchange between medical devices represent a very real and current safety risk to patients [1].
The Internet of Things (IoT), interconnecting uniquely identifiable (embedded) devices using existing Internet infrastructure, offers an exciting opportunity to connect legacy medical machines and create a safer, fully-interoperable hospital environment for the benefit of patients. Free and open-source IoT protocols such as the MQ Telemetry Transport (MQTT) protocol [2] or the Constrained Application Protocol (CoAP) [3] are rapidly gaining traction in the general IoT space, but have hardly been utilized in medical environments.
We recently described a push-based mechanism of information exchange between medical devices, whereby devices publish their data as topics to an MQTT data broker, from which other devices and applications get their data by subscribing to the same topics [4]. Here we present a rapid development mobile platform that, by using this new framework, can realize medical device interoperability with minimal effort.
Methods: lnHealth, a rapid-development mobile platform prototype, was developed using the LambdaNative cross-platform software development framework [5]. It uses MQTT communication with a data broker to exchange patient data (vital sign trends, waveforms, patient information etc.), and integrates hardware device drivers (like gps, camera, or audio support), a forward-chaining decision support engine, bar code reader, and user-interface widgets into a single native application. Development of user interfaces do not require recompilation, and involve modifying structured Extensible Markup Language forms of S-expressions (SXML), which are packaged with sounds and images files and uploaded to the target device.
Results: The first application we have built using this new tool is a sleep monitoring application for use at home that includes survey-based data collection and overnight recording of pulse oximetry. The built-in MQTT-based IoT connectivity layer allows the device to obtain demographics information during setup and to share/upload summary data after each sleep. This information is then available for use by other applications within the perioperative information exchange.
Figure 1 shows an overview of the system architecture, and example screenshots. A data broker with OR vital signs is available at demo-broker.part-dns.org to allow users to explore MQTT-based medical data exchange.

41
Return to Table of Contents
Conclusion: A simple approach using the MQTT device-to-device communication standard to build safe medical interoperability solutions, which can be broadly disseminated, was extended by adding a rapid-development mobile application framework. Precompiled versions of lnHealth for multiple platforms (Desktop, iOS, Android) will be made available in the near future to facilitate the open, collaborative development of new data collection systems for research, data integration and analysis tools for quality improvement or medical safety systems.
References: [1] D Arney, S Fischmeister, JM Goldman, I Lee, R Trausmuth, Plug-and-play for medical devices: experiences from a case study, Biomed Instrum Technol, 2009;43(4): 313–7. [2] D Locke, MQ Telemetry Transport (MQTT) V3.1 Protocol Specification, Armonk, NY, 2010. [3] Z Shelby, K Hartke, C Bormann, The Constrained Application Protocol (CoAP) , Reston, WA, 2014. [4] M Görges, CL Petersen, GA Dumont, JM Ansermino. Using machine-to-machine / “Internet of Things” communication to simplify medical device information exchange, Proc 4th Int Conf Internet Things. 2014: 1-6. [5] CL Petersen, M Görges, D Dunsmuir, M Ansermino, GA Dumont, Experience report: functional programming of mHealth applications, Proc 18th ACM SIGPLAN Int Conf Funct Program, 2013:357–62.

42
Return to Table of Contents
Comparing the Operating Range of Low-Cost Pulse Oximeters
Authors: Tso P Chen1, Christian L Petersen1, J Mark Ansermino1 and Guy A Dumont2 Departments of Anesthesiology, Pharmacology & Therapeutics1, and Electrical and Computer Engineering2, The University of British Columbia, Vancouver, Canada
Introduction: The consumer market for pulse oximetry is rapidly growing. A number of low-cost products are available, ranging from finger clips with integrated read-out to in-line oximeter modules with separate sensors. The former are currently the least expensive and readily available online from overseas distributors. In this study we compare the operating range of devices in different categories with respect to peripheral perfusion and optical transmittance (influenced by skin pigmentation).
Method: An automated system consisted of a Fluke ProSim 8 simulator, a desktop PC and a camera directed at the oximeter under test. This configuration allows oxygen saturation (SpO2) values to be extracted with Optical Character Recognition (OCR). We examined the maximum of bias and standard deviation in a wide window of 0.06-300ppm transmission and 0.06-20% perfusion at a fixed SpO2 of 80%, visualized as a graded color scale from green (0% deviation) to red (>=4% deviation) [1].
Results: Eight commercially available oximeters were evaluated: Five finger clips with integrated processing and display (C1-5), two inline oximeter modules (M1-2) with separate sensors, and one directly interfaced sensor (D). None of the clip type devices were able to produce readings in the full test range, and showed high variability between models (Fig. 1). Two devices (C4 and C5) produced erroneous readings at their limits, while most simply failed to produce readings outside of their working range. Only the M1, M2 and D devices were able to operate in the full upper window of investigation.
Conclusion: Our findings demonstrate that the range of operation of low-cost pulse oximeters can vary greatly, and that some devices have performance constraints that could potentially impact their use in limiting cases of perfusion and transmission.
Perf
usio
n [%
]
Transmission [ppm]
2.0
4.0
8.0
16.0
20.0
64.0 100.0 150.0 200.0 300.0
Perf
usio
n [%
]
Transmission [ppm]
2.0
4.0
8.0
16.0
20.0
64.0 100.0 150.0 200.0 300.0
Perf
usio
n [%
]
Transmission [ppm]
2.0
4.0
8.0
16.0
20.0
64.0 100.0 150.0 200.0 300.0
Perf
usio
n [%
]
Transmission [ppm]
2.0
4.0
8.0
16.0
20.0
64.0 100.0 150.0 200.0 300.0
Perf
usio
n [%
]
Transmission [ppm]
2.0
4.0
8.0
16.0
20.0
64.0 100.0 150.0 200.0 300.0
Perf
usio
n [%
]
Transmission [ppm]
2.0
4.0
8.0
16.0
20.0
64.0 100.0 150.0 200.0 300.0
Perf
usio
n [%
]
Transmission [ppm]
2.0
4.0
8.0
16.0
20.0
64.0 100.0 150.0 200.0 300.0
Perf
usio
n [%
]
Transmission [ppm]
2.0
4.0
8.0
16.0
20.0
64.0 100.0 150.0 200.0 300.0
C1# C2# C3# C4#
C5#D#M2#M1#
Fig. 1: Performance visualization for eight low cost pulse oximeters, on a non-linear grid of 0.06-300ppm transmission (abscissa) and 0.06-20% perfusion (ordinate). Blank space
indicates no readings.
[1] Petersen CL, Gan H, Gorges M, Dumont GA, Ansermino JM. Systematic Evaluation of Mobile Phone Pulse Oximetry Performance. Anesthesiology 2013, San Francisco, CA

43
Return to Table of Contents
Feasibility of an Incandescent Pulse Oximeter
Authors: Christian L Petersen1, J Mark Ansermino1 and Guy A Dumont2 Departments of Anesthesiology, Pharmacology & Therapeutics1, and Electrical and Computer Engineering2, The University of British Columbia, Vancouver, Canada Introduction: A pulse oximeter works by transmitting light at different wavelengths through blood filled tissue. Conventional oximeter sensors use two light emitting diodes (LEDs) with carefully chosen accurate and narrow spectral bandwidths. The tight component requirements make the LED pair the most expensive part of the entire sensor. We consider the feasibility of replacing the LEDs with a single wide-bandwidth emitter in the form of a low-voltage incandescent micro-bulb, currently in common use as cheap indicators in instruments and toys. Method: The micro-bulb emits a continuous black body spectrum defined by the tungsten filament temperature, which can be 1400K-2300K depending on the driving voltage [1]. We model the sensor signal by integrating the product of signal spectral intensity, photodiode sensitivity, and hemoglobin absorption over the entire spectrum. An oximeter can now be realized by driving the incandescent bulb at two different voltages corresponding to filament temperatures T1 and T2 (Fig. 1 (a)) and forming the conventional oximeter ratio from the two resulting signal intensities. Results: The modeled incandescent oximeter ratio is found to have an approximate linear response to the oxygen saturation for a range of filament temperatures (Fig. 1 (b)). This means that an incandescent sensor can potentially be calibrated to provide direct oxygen saturation readings. The incandescent ratio changes about 5% over the clinical range of oxygen saturation (70-100%). This sensitivity is much lower than in a conventional oximeter where the equivalent change in ratio is approximately 200%. Conclusion: We find that an incandescent pulse oximeter does exhibit a relationship between the raw oximeter ratio and oxygen saturation that is suitable for calibration. The sensitivity is however prohibitively small, due to the signal integration performed over the entire hemoglobin absorption spectrum. Use of a wide-bandwidth emitter will therefore require additional modification of the sensor, for example the introduction of passive filters, to be practical.
a)
Micro Bulb
Photodiode
T1
T2
b) 0.94
0.96
0.98
1
1.02
1.04
1.06
1.08
30 40 50 60 70 80 90 100
Inca
nd
esce
nt
Oxim
ete
r R
atio
Oxygen Saturation (S) [%]
1900K/1600K
1700K/1400K

44
Return to Table of Contents
Figure 1: (a) Incandescent Pulse Oximeter and (b) Oximeter ratio as function of saturation [1] Ahmad I, Khalid S, Khawaja EE, Filament temperature of low power incandescent lamps: Stefan-Boltzmann law Lat. Am. J. Phys. Educ. Vol. 4, 2010
Feasibility of an Incandescent Pulse Oximeter
Authors: Christian L Petersen1, J Mark Ansermino1 and Guy A Dumont2 Departments of Anesthesiology, Pharmacology & Therapeutics1, and Electrical and Computer Engineering2, The University of British Columbia, Vancouver, Canada Introduction: A pulse oximeter works by transmitting light at different wavelengths through blood filled tissue. Conventional oximeter sensors use two light emitting diodes (LEDs) with carefully chosen accurate and narrow spectral bandwidths. The tight component requirements make the LED pair the most expensive part of the entire sensor. We consider the feasibility of replacing the LEDs with a single wide-bandwidth emitter in the form of a low-voltage incandescent micro-bulb, currently in common use as cheap indicators in instruments and toys. Method: The micro-bulb emits a continuous black body spectrum defined by the tungsten filament temperature, which can be 1400K-2300K depending on the driving voltage [1]. We model the sensor signal by integrating the product of signal spectral intensity, photodiode sensitivity, and hemoglobin absorption over the entire spectrum. An oximeter can now be realized by driving the incandescent bulb at two different voltages corresponding to filament temperatures T1 and T2 (Fig. 1 (a)) and forming the conventional oximeter ratio from the two resulting signal intensities. Results: The modeled incandescent oximeter ratio is found to have an approximate linear response to the oxygen saturation for a range of filament temperatures (Fig. 1 (b)). This means that an incandescent sensor can potentially be calibrated to provide direct oxygen saturation readings. The incandescent ratio changes about 5% over the clinical range of oxygen saturation (70-100%). This sensitivity is much lower than in a conventional oximeter where the equivalent change in ratio is approximately 200%. Conclusion: We find that an incandescent pulse oximeter does exhibit a relationship between the raw oximeter ratio and oxygen saturation that is suitable for calibration. The sensitivity is however prohibitively small, due to the signal integration performed over the entire hemoglobin absorption spectrum. Use of a wide-bandwidth emitter will therefore require additional modification of the sensor, for example the introduction of passive filters, to be practical.
a)
Micro Bulb
Photodiode
T1
T2
b) 0.94
0.96
0.98
1
1.02
1.04
1.06
1.08
30 40 50 60 70 80 90 100
Inca
nd
esce
nt
Oxim
ete
r R
atio
Oxygen Saturation (S) [%]
1900K/1600K
1700K/1400K

45
Return to Table of Contents
Towards a Depth of Hypnosis EEG Simulator
Authors: Christian L Petersen1, J Mark Ansermino1 and Guy A Dumont2 Departments of Anesthesiology, Pharmacology & Therapeutics1, and Electrical and Computer Engineering2, The University of British Columbia, Vancouver, Canada Introduction: Current practice in anesthesia relies on population-based estimates of drug dosage. Considerable inter-patient variability, in particular in children, makes drug delivery guided by a measured physiological end point a desirable goal. As anesthesia primarily affects the central nervous system, EEG [1] is favored as a basis for such Depth of Hypnosis (DoH) measurements. The effects of anesthesia on EEG are poorly understood, and commercial DoH EEG monitors use complex, often undisclosed, methods of analysis. Here we report progress towards an EEG simulator that can be used to further the understanding of a measured anesthesia end point. Method: We have developed a simulator that uses the audio output of a mobile phone to mimic EEG during anesthesia. A simple two-parameter model, dependent on the known empirical inverse frequency/amplitude dependence of EEG on anesthesia, and the degree of burst suppression, is used to generate an 8Khz audio signal, which is finally fed to the DoH monitor through a passive network representing the electrical impedance of the scalp. Results: A mobile application for iOS and Android was developed to accept manual entry of a target DoH level, and generate a matching simulated EEG signal on the headphone output, Fig. 1(a). The application has undergone preliminary calibration by manual adjustment and linear interpolation of the model parameters against corresponding readings from a NeuroSENSE (NeuroWave Systems, OH) monitor. An approximate 1:1 relation between the simulator setting and the DoH monitor was obtained, Fig 1(b). Conclusion: We have developed a first prototype of a DoH EEG simulator using a simple two-parameter model, and shown that it is possible to calibrate the output against a commercial DoH Monitor. Further work is ongoing to improve the performance of the simulator, and integrate the ability to replay previously recorded clinical EEG data, with the ultimate goal of accurately assessing the performance of DoH monitors, and providing a flexible tool for such use. Acknowledgement: This ongoing work is supported in part by a grant from the Society for Technology in Anesthesia.

46
Return to Table of Contents
a) b)
Performance
0
20
40
60
80
100
0 20 40 60 80 100
WAV
Simulator Setting
Mon
itor R
eadi
ng
Figure 1: (a) EEG smartphone simulator w. DoH monitor, (b) Preliminary calibration. [1] Freeman WJ. Origin, structure, and role of background EEG activity. Clinical Neurophysiol. 116 1118 (2005).

47
Return to Table of Contents
A Features Trends View of CO2 Breaths Signals
Authors: Joshua L. Colman BSc, Keren Davidpur BSc, Yossef Cohen BSc, Eylon Katz BSc and Michal Ronen PhD, Covidien - Respiratory and Monitoring Solutions, Jerusalem
Background: One of the main drawbacks of current monitors’ displays is the limited options of reviewing parameters trends. The trend is typically a single line presenting a specific parameter’s values over time. Here we propose two distinct display options that are composed of complex not-easily discerned information from CO2 waveforms. These trend views promote a comprehensible and simpler means of recognizing patterns and trends that are indicative of patient physiology and condition.
Methods: First the CO2 signal was segmented into separate breaths, artifacts were filtered out, and then different features were calculated per breath. The features Include (but not limited to): maximal CO2, breath width, area under the curve (AUC) and inhalation exhalation ratio (i2e ratio). The display options were developed for those features, were the AUC display reflects the AUC, max CO2, and breath’s width using color coding (Fig. 1L). The i2e ratio display presents for each time point the average and variability of the parameter over a specified time period (Fig 1R).
Results: A working algorithm and software package for display on PC, Tablet or a CO2 monitor with input coming from a Covidien Capnograph has been completed. The software algorithm tool is used to evaluate patient condition by providing an overview of the parameters over a large time period. The display tool enables scrolling, browsing, zooming in/out and event marking is provided for retrospective evaluations.
Data from patients under procedural sedation and ICU patients during weaning was reviewed retrospectively using the displays, demonstrating easy detection of inefficient breathing periods that either was not revealed by respiration rate or EtCO2 values, or was otherwise unnoticed due to view over large time periods.
Conclusion: Features Trends Display has been developed as a software tool. It provides innovative visualization tools to simplify assessment of patient condition from Capnography waves’ features. The methodology could be applied on other periodic signals.
Fig. 1: (Left) Example of AUC display over 20 min (Red-inefficient breaths, Green-Normal healthy breaths, Blue- Large breaths); (Right) example of i2e ratio display (yellow line: average over 5 min, Purpul area ±STD).

48
Return to Table of Contents
A Representative Waveform of CO2 Breath Signals
Authors: Michal Ronen PhD, Keren Davidpur BSc, Yossef Cohen BSc, Eylon Katz BSc and Joshua L. Colman BSc, Covidien - Respiratory and Monitoring Solutions, Jerusalem
Background: Several measured physiological parameters provide recurring signals and waveforms, e.g., CO2 in the breath. These waveform shapes, dimensions and recurring patterns may provide clinicians valuable information regarding the patient physiology. Typically, the relevant waveforms are presented in monitoring displays as a moving wave in real time. This type of presentation does not lend itself to evaluation of either their characteristic and dominant waveform shapes or the patterns they create. A tool has been developed help provide bedside clinicians an enhanced ability to easily to recognize, analyze, compare and evaluate the information that may be hidden within waveforms.
Methods: The method used for producing the representative waveform (RW) is based on splitting each waveform into both its scalar (dimensional) values and shape characteristics, filtering out artifacts and then applying mathematical operators on each of them separately for a chosen group of waveforms, this in order to calculate for the group their dominant and representative shape characteristic and averaged scalar values.
Results: A working algorithm and software package for display on PC, Tablet or a CO2 monitor with input coming from a Covidien Capnograph has been completed. The software algorithm tool is used to anchor a visual representation of the patient’s dominant breath shape and dimensions. Further capabilities include: - Displaying previous RW’s, to enable comparison with baseline or reference points as defined by the user - Displaying predefined CO2 waveform patterns for comparison that are indicative of a healthy breathing pattern or of a disease state. - A feature permitting scrolling, browsing and event marking is provided for retrospective evaluations. - A waveform confidence index is also provided.
Conclusions: Representative Waveform has been developed as a software tool. It provides innovative visualization tools to simplify assessment of patient condition from Capnography waves’ morphology and patterns. The methodology could be applied on other periodic signals.

49
Return to Table of Contents
Figure 1: A) A representative waveform (red) of a group of CO2 waves. B) A display of the RW tool, with the representative waveform on the lower pan (green) and the ‘text-book’ waves range (gray).

50
Return to Table of Contents
Dashboard Design to Evaluate for Severity of Post-Tonsillectomy Hemorrhage after Implementation of Ibuprofen
Authors: Jorge A. Gálvez, MD; Pamela Mudd, MD; Teresa Giordano, DNP, CRNP, CORLN; Ralph Wetmore, MD; Lisa Elden MD, MSc, FRCS(C), FAAP; Allan F. Simpao, MD; Arul Lingappan, MD; Mohamed Rehman, MD; David Friedman, MD; Abbas Jawad, PhD; Luis Ahumada, MSCS Introduction: Many studies have sought to determine the relationship between ibuprofen or NSAID use and post-tonsillectomy hemorrhage rates. Few studies have evaluated the relationship to increased severity of bleeding associated with ibuprofen use. Methods: Retrospective case-control study to analyze outcome data through database query and data acquisition. Inclusion criteria: all patients undergoing either tonsillectomy or tonsillectomy and adenoidectomy at a single tertiary pediatric hospital. Exclusion criteria include patients who underwent the primary procedure at an outside hospital. Results: Database acquisition was used to identify frequency of patients undergoing tonsillectomy-requiring re-exploration for control of post-operative hemorrhage and it’s association with ibuprofen. 8,901 patients were identified as having undergone tonsillectomy (or adenotonsillectomy) between January 20, 2011 and June 30, 2014. Overall, 257 (2.8%) patients presented with postoperative hemorrhage and required control of hemorrhage in the operating room. There does not appear to be an increased risk of hemorrhage requiring re-exploration associated with use of ibuprofen; 2.81% vs 2.87%; (OR= 1.063 (0.818-1.376), p=0.3403); however, there was a trend for increased severity of hemorrhage using transfusion rates as a surrogate (OR 3.35 (0.935-14.9), p=0.0331). Conclusion: The risk of hemorrhage is not increased with use of post-operative ibuprofen. However, there was a trend toward increased prevalence of patients requiring blood transfusion after a tonsillectomy. The number of patients requiring blood transfusion was so small (13 out of 257 re-explorations) that this association is not very specific and difficult to interpret.

51
Return to Table of Contents
Figure 1: Post-tonsillectomy hemorrhage dashboard. Each graphical panel displays a single variable on the x-axis and a patient count on the y-axis. The T&A vs. Hemorrhage rate panels represents the percentage of patients requiring surgical re-exploration following adenotonsillectomy per month. The green line represents the trend during the calendar year, while the orange line represents the trend over all four calendar years. While the rate appears to increase during certain months, such as September-December 2011 and august to December 2013, the overall trend is decreasing. The blood transfusions represents all patients who received blood transfusions during the 30 days following the original tonsillectomy. The procedure time is determined by the time difference between in-room and out-of-room time stamps.

52
Return to Table of Contents
Capnography Monitoring in Procedural Sedation: A Hospital-Wide Cost-Avoidance Model
Presenting Author: Michael Jopling MD, Mount Carmel St. Ann’s Hospital Co-Authors: David Trost MD, Weill Cornell Medical Center; Timothy Kofol, MBA, S2N Health; Erin Warner, S2N Health Introduction: The American Society of Anesthesiology (ASA) developed guidelines supporting the routine use of capnography to assess ventilatory status during all moderate or deep sedation procedures attended by an anesthesiologist. Other professional societies and many hospitals have yet to develop or implement similar guidelines citing cost concerns. Capnography has been shown to increase the detection of respiratory depression by a factor of 17.6 times, giving providers an early indication of potential problems with respiration or airway obstruction enabling an immediate intervention [Waugh, et al, 2011]. We developed a hospital cost-avoidance model to assess the net economic impact of capnography monitoring during sedation procedures for a typical hospital. Methods: The model used data from a 500-bed example hospital to estimate the annual number of sedation procedures which is then used to calculate the capnography monitoring equipment and disposables required for each sedation area of care. Rates of adverse respiratory events and the cost associated with these events, shown in Figure 1, were derived from 11 investigations that had enrolled more than 1.1M procedural cases across a wide variety of sedation settings. The model utilized a Monte Carlo analysis to estimate potential hospital savings with routine capnography monitoring assuming that capnography could prevent 50% of adverse respiratory events because of early detection and intervention enabled by capnography monitoring. The cost of routine capnography monitoring assumed an average hospital cost of $3,000 for the monitoring device and $12 for per-procedure disposables. The Monte Carlo analysis used 10,000 simulations varying the number of events, cost of events and the capnography success rate using a triangle distribution (min = 30%, most likely = 50%, max = 60%). Results: For the example hospital, the total median predicted annual cost of adverse respiratory events related to procedural sedation in the Interventional Radiology, Gastroenterology, Interventional Cardiology and the Emergency Department was estimated to be $1,920,000. The same adverse event rate was assumed across departments. The annual cost of routine capnography monitoring of all sedation procedures across departments was modeled to be $208,000. Based upon this estimate, capnography monitoring yielded a median annual cost-avoidance of $785,000 per year for a calculated median annual hospital savings of $883,000 (Figure 2). The model estimated that the majority of savings would be from the Gastroenterology (49%) and Interventional Radiology departments (39%). Discussion: While the clinical basis for routine capnography monitoring in sedation procedures is well reflected in the ASA guidelines and others, the cost of deploying and utilizing capnography consistently throughout a hospital may be a barrier to adoption of this safety technology. The hospital-cost avoidance model presented here shows that capnography monitoring in procedural sedation may both improve patient care and simultaneously decrease overall hospital costs.

53
Return to Table of Contents
Figure 1: R ate of Events & Associated Costs
!"#!!!!
!"$%%&%%%!!
!"'%%&%%%!!
!"(%%&%%%!!
!")%%&%%%!!
!"*&%%%&%%%!!
+,-./
-012!
3-45
.6,-0
6!!7+3
8!
95:6.
;-06-
.;<;/
2!79=8
!
=06-.>
-0?;
05<!@
5.AB;<
;/2!7
=@8!
=06-.>
-0?;
05<!C
5AB;<
;/2!7
=C8!
+<-16.
;4D2
:B;<;/
2!7+E
8!F;
65<!
!"#$%&'()*(+,-"./0,%/(Published Rate per 10,000
Est. Cost Per
Occurrence
Est. Standard Deviation
of Cost Major adverse event (death, cardiac arrest & aspiration)
3.4 $278,327 $500,000
Unplanned admission to the hospital or ICU because of sedation related complications
5.6 $21,183 $27,500
Unplanned treatments (Incremental care including intubation, fluids, bag mask ventilation, oxygen supplementation)
275.4 $50.44 $5
!"#$%&'()'*+,"-#.'/%&+0123-'45'6&7+%89&-8'

54
Return to Table of Contents
Attempts at Breaching a Fingerprint-Secured Automated Medication Dispenser Using Spoofs from Simple Fingerprint Molds
Presenting Author: James Lamberg, DO; Penn State Hershey Medical Center Co‐Authors: James Mooney, MD; Penn State Hershey Medical Center Background/Introduction: Fingerprint entry systems are marketed as providing improvements over passcodes and proximity cards as they theoretically prove each user’s identity. These security systems are not perfect and have been breached with simple techniques, such as fingerprint molds. Biometrics in healthcare represents a challenge due to hand washing protocols, environmental conditions, and the consequences of a high false accept rate when securing controlled substances. We report our initial attempts at breaching a fingerprint‐secured automated medication dispenser that utilizes multispectral imaging with “liveness detection” technology. Methods: Two approaches to spoofing the system were attempted, targeting the biometrics of one of the authors (JL). The target was currently enrolled as a provider who could obtain controlled substances for clinical use. An image based approach was attempted first. These attempt utilized images of the natural finger as well as images displayed by the medication system, which printed using a personal inkjet printer. The second approach attempted to recreate the three-dimensional structure of the finger. Two molds of the finger utilized for the biometric identification system were created from platinum cure silicone. From these molds, four silicone spoof models were created; two solid fingers and two hollow fingers. One of each model type was left uncolored, while the other was tinted to emulate natural skin tone of the target. These finger models were tested on a Lumidigm® multispectral fingerprint scanner as part of a Pyxis MedStation™ 4000 system. Results: Image‐based attempts universally failed to register, leading the system to time-°©‐out. Two‐ dimensional images of the models, displayed by the system, showed a close match to the image of the live finger. Several attempts were made at accessing the system using the solid model without success. The hollow models were placed over the finger of the other author (JM) in an attempt to overcome the “internal fingerprint” and “liveness detection” technology. This also was unsuccessful. Using the solid model without tinting, the system displayed positioning hints before registering, then rejecting the attempt. The tinted solid model and the models over the finger were processed, but led to an error regarding the accuracy of the biometric data. Conclusion: Fingerprint molding can create spoofs that have similar surface structures to real fingers. However, the multispectral imaging scanner was effective at rejecting our spoof fingers. This is evidently due to the deeper structures of the finger being identified. Until a model is developed that produces the surface features as well as unidentified deeper features, the Pyxis MedStation™ 4000 system utilizing the

55
Return to Table of Contents
Lumidigm® multispectral fingerprint scanner seems to be a secure system. Other systems, however, may be vulnerable to these or similar spoof attacks. References (Optional): 1) T. Matsumoto, H. Matsumoto, K. Yamada, S. Hoshino, "Impact of Artificial Gummy Fingers on Fingerprint Systems," Proceedings of SPIE Vol. #4677, Optical Security and Counterfeit Deterrence Techniques IV, 2002. 2) Willis D, Lee M. Six biometric devices point the finger at security. 1998. Network Computing; 9(10):84‐96. 3) Hoshino S, et al. Mapping a Fingerprint linage to an Artificial Finger. 2001. ISEC (60):53‐59.

56
Return to Table of Contents
Accuracy of CAPTESIA, an Android Pulse Pressure Variation Application Presenting Author: Olivier Desebbe, MD, Department of Anesthesiology & Perioperative Care, University of California Irvine Co-authors: Mfonobong Essiet; Alexandre Joosten; Koichi Suheiro; Joseph Rinehart; Maxime Cannesson Introduction: Pulse pressure variation (PPV) remains a good predictor of fluid responsiveness in the OR. However, PPV can be time-consuming to calculate (manual determination), is not always displayed on monitoring screens nor reliable through visual assessment and needs additional devices to be displayed. A new Android application (Captesia) automatically calculates the PPV utilizing a digital photograph of the arterial waveform from the monitor. The application determines the PPVapp by selecting peaks and troughs of the arterial curve. The aim of this pilot study was to test its accuracy against a hemodynamic simulator. Methods: Capstesia was loaded on a Samsung Galaxy S4 phone. The first phase was designed to evaluate the precision error of the PPVapp using the same screen to capture four sets of 50 photos by four observers. Secondly, PPVapp was compared to PPVsim by altering PPVsim (4-24%), pulse pressure (30-45-60 mmHg), heart rate (60-80/min) and respiratory rate (10-15-20/min). The second phase was repeated after optimizing the scale of the arterial waveform. We evaluated the reproducibility of PPV by calculating the precision error and the variability between observers by comparing the median values with a Kruskal Wallis test. Agreement between PPVsim and PPVapp was tested by a Bland-Altman analysis. A ROC curve analysis determined the ability of PPVapp to discriminate a PPVsim > 13%. Results: The mean precision error of the PPV app was 8%, with significant inter-observers variability (p=0.003). 216 pairs of data were next obtained. Results are presented in figure 1 and 2. A PPVapp >15% could predict a PPVsim >13% with a sensitivity of 93% and a specificity of 94%. The amplitude of the pulse pressure and the heart/respiratory rate ratio had no impact on the accuracy of the PPVapp. Optimizing the arterial scale improved the agreement between PPVapp and PPVsim. Conclusion: With a low Precision error and acceptable limits of agreement compared to a simulator, PPVapp could predict fluid responsiveness. Real conditions are warranted to test this application.

57
Return to Table of Contents
Accuracy of CAPTESIA, an Android Pulse Pressure Variation Application Presenting Author: Olivier Desebbe, MD, Department of Anesthesiology & Perioperative Care, University of California Irvine Co-authors: Mfonobong Essiet; Alexandre Joosten; Koichi Suheiro; Joseph Rinehart; Maxime Cannesson Introduction: Pulse pressure variation (PPV) remains a good predictor of fluid responsiveness in the OR. However, PPV can be time-consuming to calculate (manual determination), is not always displayed on monitoring screens nor reliable through visual assessment and needs additional devices to be displayed. A new Android application (Captesia) automatically calculates the PPV utilizing a digital photograph of the arterial waveform from the monitor. The application determines the PPVapp by selecting peaks and troughs of the arterial curve. The aim of this pilot study was to test its accuracy against a hemodynamic simulator. Methods: Capstesia was loaded on a Samsung Galaxy S4 phone. The first phase was designed to evaluate the precision error of the PPVapp using the same screen to capture four sets of 50 photos by four observers. Secondly, PPVapp was compared to PPVsim by altering PPVsim (4-24%), pulse pressure (30-45-60 mmHg), heart rate (60-80/min) and respiratory rate (10-15-20/min). The second phase was repeated after optimizing the scale of the arterial waveform. We evaluated the reproducibility of PPV by calculating the precision error and the variability between observers by comparing the median values with a Kruskal Wallis test. Agreement between PPVsim and PPVapp was tested by a Bland-Altman analysis. A ROC curve analysis determined the ability of PPVapp to discriminate a PPVsim > 13%. Results: The mean precision error of the PPV app was 8%, with significant inter-observers variability (p=0.003). 216 pairs of data were next obtained. Results are presented in figure 1 and 2. A PPVapp >15% could predict a PPVsim >13% with a sensitivity of 93% and a specificity of 94%. The amplitude of the pulse pressure and the heart/respiratory rate ratio had no impact on the accuracy of the PPVapp. Optimizing the arterial scale improved the agreement between PPVapp and PPVsim. Conclusion: With a low Precision error and acceptable limits of agreement compared to a simulator, PPVapp could predict fluid responsiveness. Real conditions are warranted to test this application.

58
Return to Table of Contents
ETCO2 Monitoring of Neonates During Conventional Ventilation
Authors: Amir Kugelman,1,2 MD, Ruben Bromiker,3 M.D, Shoris Irit,1 RN, Qumqam N, 3 RN, Arieh Riskin,1 MD, Ronen M, PhD,4 David Bader,1 MD, Agenta Golan,5 MD 1Department of Neonatology and 2Pediatric Pulmonary Unit, Bnai Zion Medical Center, The B&R Rappaport Faculty of Medicine, Technion, Haifa, Israel; 3Department of Neonatology, Shaare Zedek Medical Center, Faculty of Medicine of the Hebrew University, Jerusalem, Israel; 4Covidien Respiratory and Monitoring Solutions, Jerusalem, Israel; 5Department of Neonatology, Soroka Medical Center, Faculty of Health Sciences, Ben-Gurion University of the Negev, Beer Sheva, Israel. Background: Monitoring of EtCO2 sampled from the carina (using double lumen ETT and Carinal VitaLine) may allow continuous, non invasive real-time assessment of CO2 as opposed to arterial PaCO2 which is sampled intermittently per the decision of the treating physician. Thus, carinal EtCO2 may improve the control of ventilation over time, and thus may protect infants from the complications of hypocarbia and hypercarbia throughout the period of mechanical intubation. Previous study1 demonstrated the correlation and agreement between carinal EtCO2 and PaCO2 and showed that it was more accurate than the standard mainstream EtCO2
. Following this we would like to demonstrate that it could have clinical benefits in the care of ventilated infants. Aim: The aim of this study was to compare the time spent within a defined safe range of carbon-dioxide (30 mmHg<PaCO2<60 mmHg), during conventional ventilation between infants monitored with carinal ETCO2 and those who are not. Methods: A randomized, controlled multicenter study was conducted at 3 tertiary care university- affiliated NICUs. Sidestream ETCO2 was measured and recorded by a Microstream capnograph (Covidien) via the sampling port of a specialized endotracheal tube and Carinal Vitaline set. Enrolled infants were randomized to: 1. Open group: Data derived from the capnograph was displayed to the medical team and allowed to be used for patient care, 2. Masked group: The measurements were masked to the medical staff and hence were not available for patient care. ETCO2 was compared with PaCO2 drawn for patient care. Results: Fifty-five infants (24 open, 31 blinded) participated in the study; groups were comparable. Analysis included 768 simultaneous measurements of ETCO2 and PaCO2, 13 [3-35] measurements per/patient, during 37.1 [5.3-132.0] hours per/patient. ETCO2 was in good correlation (r=0.73, p<0.001) and agreement (Bland Altman plot: mean difference± SD of the differences: 3.1±8.5 mmHg) with PaCO2. Infants in the masked compared to the open group spent significantly (p<0.01) more time at unsafe range of high (>60 mmHg: 8.8 vs. 3.7%, respectively) or low (<30 mmHg: 8.7 vs. 3.9%, respectively) levels of ETCO2. Arterial blood gas analysis results also show that the

59
Return to Table of Contents
monitored group had significantly larger rate of arterial blood gas sampling within the safe PaCO2 range (p<0.05) and the safe pH range (7.25<pH<7.45, p<0.05). No adverse events occurred in the enrolled infants. Conclusions: ETCO2 monitoring was found to improve the control of CO2 levels within a safe range during conventional ventilation. We speculate that this could decrease the sequel of hyperventilation and hypoventilation in these infants. References: Kugelman A, Zyger-Aginski D, Bader D, Shoris I, and Riskin A. A novel method of Distal end-tidal CO2 capnography in intubated infants: Comparison to arterial CO2 and to proximal mainstream end-tidal CO2. Pediatrics 2008; 122: e1219-e1224.

60
Return to Table of Contents
Pulse Oximetry-Derived Left Ventricular Function Data Sets
Authors: Terence Rafferty, MD, MBA, Kirk Shelley, MD, PhD, Aymen Alian, MD Department of Anesthesiology, Yale University School of Medicine, New Haven, CT Introduction It is currently felt that PPG AC and PPG DC modulation (mod) reflect stroke volume and preload, respectively. Ventricular function sets express cardiac work as a function of pre-load. The classic left ventricular stroke work (LVSW) per beat formula consists of mean systemic arterial blood pressure minus mean left atrial pressure*body surface area indexed stroke volume*K. This work measurement (pressure gradient*volume*K) can be abbreviated to mean systemic blood pressure*stroke volume. Accordingly, mean systemic arterial blood pressure*PPG AC mod as a function of PPG DC mod should provide the data required to evaluate left ventricular function. This premise was tested by evaluating the impact of phenylephrine on mean systemic arterial blood pressure*PPG AC mod as a function of PPG DC mod. Methods Eight adult patients (average age 47, range 15 to 64 years) undergoing shoulder surgery were studied. Phenylephrine was administered to support blood pressure during assumption of beach-chair position. Systemic arterial blood pressure and pulse oximetry data were measured pre-phenylephrine and post-phenylephrine (doses 100-200 mcg, 13 data points). The study fulfilled Institutional Review Board criteria. Results Increases in AC mod represent decreases in stroke volume. To normalize this reciprocal relationship absolute values for AC mod were expressed as 1 minus AC mod (Y axis values). Increases in DC mod represent decreases in preload. DC mod values were normalized by inverting the numeric scale (X axis values). Phenylephrine administration was associated with increased or maintained ventricular function in seven patients. The remaining patient (aged 62 years) manifested decreased function. Relationships are presented in Figure 1 and table 1. Conclusion A series of left ventricular function data sets were constructed from systemic arterial blood pressure and PPG AC mod and PPG DC mod measurements. The directional changes in the data with phenylephrine administration were consistent with established cardiac physiology principles. Findings infers that the combination of PPG AC, PPG DC modulation and systemic arterial blood pressure measurements may provide the raw data required to construct valid non-invasive ventricular function curves. The precise numeric impact of changed PPG modulation as a result of changes in the caliber of the microvasculature requires further study. References: Circulation 1964; 29: 739-749

61
Return to Table of Contents

62
Return to Table of Contents1 0805
Normalizing PPG Signals to the AC Component – Applications for Monitoring Volume Loss Authors: 1David G. Silverman, M.D., 1,2I-Hsun Liang, M.D., 1Aymen Alian, M.D., 1Kirk Shelley, M.D., Ph.D., 3Nina Stachenfeld, Ph.D. 1Department of Anesthesiology, Yale University School of Medicine; 2Department of Anesthesiology, St. Barnabas Medical Center, Livingston, NJ; and 3The John B. Pierce Laboratory – Physiology, Yale University School of Medicine Background/Introduction: We previously have shown that photoplethysmographic (PPG) monitoring at a site relatively devoid of vasoconstrictive activity (e.g., forehead and ear) reveals relative degrees of pulsatile and nonpulsatile blood volume similar to the relationship between stroke volume (SV) and venous volume systemically; and that, since it is not influenced by background, AC height can be related to SV. The AC@rest voltage corresponds to the portion of SV delivered to the given site under resting conditions. We herein determine whether consistency of AC measurements under baseline conditions is comparable to the consistency of echocardiographically measured SV under resting conditions and then express changes in DC in AC@restMults to determine if the PPG can delineate changes in venous volume. Methods: All assessments were performed with IRB approval, utilizing infrared reflectance PPG sensors interfaced via bridge amplifier to Power Lab data acquisition system (ADInstruments) applied to the forehead and ear (because they are relatively immune to vasoconstrictive stimuli). In part 1, AC height was determined during a total 48 sessions performed 3 to 72 hours apart in three volunteers. Intersession variability was compared to that reported in the literature for SV variability obtained echocardiographically.1.2 In 12 healthy volunteers, we then sought to determine if declines in AC and DC in response to 75mmHg lower body negative pressure (LBNP) corresponded, respectively, to declines in SV and overall volume reported for comparable degrees of LBNP in the literature with invasive monitoring.3 Results: For repeated measures of AC height, coefficient of variation (CofV) for intersession variability in our subjects was 17.3%; this was greater than the 9.2% CofV for echocardiographic SV assessments on successive days.1 Alternatively, 2x standard error (2xSE) in our subjects averaged 8% of mean vs. 11% in the literature.2 Moreover, our intra-session 2xSE/Mean averaged only 3%. During LBNP, the 73.3 ± 12% ↓in AC was similar to the reported 65% ↓in SV. The decline in DC was 5.4 ± 2.4 ACrestMults, corresponding to 675ml (5.4 x baseline SV of 125ml measured echocardiographically in our subjects): This was within the 500 to 1000ml range of simulated loss reported in the literature for comparable degrees of LBNP. Conclusion: The findings suggest that, by normalizing to AC@rest, AC and DC measurements can be monitored and compared during myriad clinical and investigative settings. The relative individual changes and their relationships were consistent with changes in systemic arterial and venous volume reported in the literature. References: 1. Principles of Echocardiography and Intracardiac Echocardiography. Saunders 2012 2. Am J Cardiol 1987 15;59(9):975-8 2 0805 3. Autonomic Neuroscience: Basic and Clinical 2004; 111:127-13

63
Return to Table of Contents
Figure 1 Procedure-‐specific pain scores collected during the 50 min after emerging from anesthesia, for procedures with ≥10 cases. Pain scores collected with the Panda or original FPS-‐R/ CAS tools are plotted against time from first pain score (on waking). Upper quartiles (red), medians (orange) and lower quartiles (green) are plotted for pain scores up to 0, 15, 30 and 45 min.
Panda: A Smartphone App to Support Management of Postoperative Pain in Children
Presenting author: Nicholas West1 MSc
Co-Authors: Matthias Görges2 PhD, Dustin Dunsmuir1 MSc, Anthony Emmott, Terri Sun1 MD, J Mark Ansermino1 FRCPC, Gillian Lauder1 FRCA
Departments of 1Anesthesiology, Pharmacology & Therapeutics and 2Electrical & Computer Engineering, University of British Columbia, Vancouver
Introduction: Effective postoperative pain management reduces deleterious physiological and psychological disturbances in children and therefore promotes optimal recovery. Pain management requires appropriate assessment and it is widely, though not universally, accepted that the best method is based on self-report, using tools such as the Faces Pain Scale–Revised (FPS-R) and Colour Analogue Scale (CAS), for which extensive validation data have been published [1].
A 2010 audit of pain management following discharge from day surgery at a tertiary pediatric centre showed that, despite the predictability of post-discharge pain and comprehensive discharge instructions, carers at home often lack the resources to effectively assess pain and adhere to appropriate analgesic guidelines [2]. Preliminary data from a follow-up audit, currently ongoing, suggests that the majority of children recovering from adenoidectomy/tonsillectomy experience moderate or severe pain in the 48 hours following surgery, but that many do not receive regular acetaminophen/ibuprofen as instructed at discharge.
Panda is a smartphone app designed to support decision-making about postoperative pain management in children. It is being built using a robust, modular framework specifically designed for medical applications [3]. A series of studies is guiding this development. The Phase 1 study demonstrated agreement between Panda’s electronic versions of the FPS-R and CAS and the original paper- and plastic-based versions [4].
Methods: The aim of this study was to evaluate how data may be collected to build models of anticipated pain. Data from the Phase 1 study has been re-analysed. This dataset contains pain scores, obtained from children aged 4-18 years recovering from a variety of surgical procedures. Pain was assessed on waking and again approximately 30 minutes later and was collected with both the Panda and the original FPS-R/CAS tools, with 3-5 minutes between each pair of assessments. Hence, we have self-report pain scores from 4 different time-points over 30-50 minutes following emergence from anesthesia.
Results: The analysis of changes in these pain scores over time revealed procedure-specific characteristics (Figure 1). Pain after tonsillectomy showed wide inter-patient variability, with 5/15 (33%) patients still scoring their pain ≥8 between 15 and 45 mins after waking. Other procedures demonstrated better postoperative pain management.
Conclusion: Collecting regular pain scores using a device such as Panda, ideally over a longer time-frame, may provide a mechanism for generating procedure-specific pain models.

64
Return to Table of Contents
In Phase 2, we will incorporate these anticipated pain models along with pain assessment scores and medication tracking into decision rules, which will be clinically evaluated for support of decision-making about postoperative pain management. In Phase 3, we will evaluate usability, compliance and satisfaction characteristics with clinicians, parents and children during in-hospital and at-home use.
Panda has the potential to improve reliability of pain monitoring, to provide intelligent pain management guidance during in-hospital and at-home care, and to streamline communication with clinicians.
References: [1] Pediatrics. 2013;132(4):e971-9. [2] Pain Res Manag. 2012;17(5):328–334. [3] Proc ICFP. 2013; New York:ACM Press, pp.357-62. [4] Proc Am Soc Anesth Ann Mtg. 2013; San Francisco:LBC02

65
Return to Table of Contents
Non-invasive Ventilation Monitoring During Remifentanil Challenge in CyP450-Deficient Patient Authors: James H. Philip, M.D.*, Jordan Brayanov Ph.D.** * Brigham and Women’s Hospital, Harvard Medical School **Respiratory Motion, Inc, Introduction: When managing complicated patients, clinicians often need to push boundaries and experiment with intended use and/or dosing of medications. In order to minimize risk and improve patient outcome, unconventional therapies often rely on cutting edge monitoring technology. In this particular case we wanted to assess a patient’s tolerance for remifentanil, specifically, monitoring her respiratory status without intubation or other airway manipulation. To accomplish this, along with conventional anesthesia equipment, we used a non-invasive impedance-based respiratory volume monitor (RVM) that provides real-time minute volume (MV) tidal volume (TV) and respiratory rate (RR) measurements. Methods: A 50 y/o, 50 kg female patient with known CyP450 deficiency was enrolled in a remifentanil challenge trial to determine her tolerance for potential use of the drug during and after surgical procedures. Remifentanil’s metabolic pathway suggested this would be successful. The trial was approved by the Brigham and Women’s Hospital Desensitization Committee. The patient had successfully undergone seven (7) surgical procedures with Sevoflurane VIMA (Volatile Induction and Maintenance Anesthesia). Patient’s CyP450 deficiency had disturbed her metabolism of conventional analgesics, and had led to complications and extended ICU hospitalization following conventional receipt of multi-drug anesthesia and postop care. For this trial, the patient was monitored in the ICU with a RVM (ExSpiron, Respiratory Motion, Waltham, MA), anesthesia machine (GE Aisys, GE Healthcare, Madison, WI) and multi-parameter physiological monitor (GE B850 multi-parameter monitor with integrated bispectral index (BIS), GE Healthcare, Madison, WI). Non-invasive MV, TV, RR were collected from the RVM. HR, BP, SpO2, FiO2, EtCO2, and ETCO2-based RR from the anesthesia machine via Salter nasal prongs (Salter Labs, Arvin, CA) with zero flow of supplemental oxygen throughout the trial, and BIS from the BIS monitor. For the challenge, 4 remifentanil bolus doses (1 mcg/ml concentration) were administered in ascending order (2 mcg, 5 mcg, 10 mcg, and 15 mcg) followed by a continuous infusion (0.05 mcg/kg/min x 30 min). Each subsequent dose was administered when the patient returned to baseline mentation, assessed by interactive conversation and BIS > 98. A first-order difference equation simulation was used to estimate the total remifentanil dose in the bloodstream, based on a remifentanil half-life of 4 min. Predicted MV (MVPRED) was calculated based on patient’s ideal body weight. Data and simulation were time-synched post-hoc and plotted on a time axis, zeroed at the time of the first bolus dose. All analyses were done in MATLAB 2014b (MathWorks, Framingham, MA). Results: For the purposes of this case report we focus on the available respiratory variables (MV, TV, RR from RVM, EtCO2 and RR from anesthesia machine) and mental status (from BIS monitor). The patient’s baseline MV was 5.4 ±1.0 L/min and MVPRED was 5.2 L/min. RVM readings were continuously available throughout the study. The first administered bolus (2 mcg) resulted in no noticeable change in any of these variables (Fig 1A), except that EtCO2 readings were found to be missing more than 60% of the time. The second bolus (5 mcg) triggered mild respiratory depression with a decrease in MV to ~80% MVpred, coinciding with a transient dip in BIS down in the 91-92 range for approximately 3 minutes (Fig 1B). The respiratory depression was mostly due to a decrease in TV. Just as with the first dose, EtCO2 failed to yield measurements over 40% of the time. With the 3rd & 4th boluses (10 & 15 mcg, respectively) we managed to sustain sedation (Fig 1C&D) for up-to 10-15 minutes with BIS measurements consistently in the 80-85 range. The RVM showed sustained respiratory depression at ~80% MVpred during the same period, once again driven by a sustained decrease in TV and effectively no change in RR. With the patient sedated

66
Return to Table of Contents
and immobile, EtCO2 readings were available more often, but showed no change from baseline until around minute 70, when the EtCO2 abruptly decreased, despite patient’s diminished ventilation. After a prolonged break to ensure all residual remifentanil was cleared, an infusion was initiated at 2.5 mcg/min, with a target steady-state dose of 15 mcg in the bloodstream. Sedation began within 11 minutes (BIS was below 80), as the amount of remifentanil in the bloodstream plateaued at approximately 13 mcg and MV once again settled at approximately 80% MVPRED. A transient episode of partial wakefulness was noted around minute 124 (18 minutes after the start of the infusion), which resulted in a rapid increase of BIS and RMV measurements, and fall in EtCO2. Continuing the infusion restored the sedative state. The patient recovered back to baseline wakefulness approximately 25 minutes after the infusion was discontinued. The patient was assessed as able to respond normally to remifentanil. Conclusions: A continuous respiratory volume monitor can be used to measure minute volume, tidal volume and respiratory rate during drug trials without the need for patient intubation or other airway manipulation. Respiratory volume and rate parameters can be monitored successfully in the absence of supplemental oxygen delivery and gas monitoring. Tolerance to potentially respiratory depressive doses of remifentanil can be defined and monitored effectively.

67
Return to Table of Contents
Figure 1: Time course of patient’s vital signs during a remifentanil challenge. Panels (A-D) depict the changes in monitored variables following individual bolus doses (2, 5, 10 and 15 mcg, respectively) and panel E depicts the effects of a 30-min infusion (0.05 mcg/kg/min or 2.5mcg/min). In each panel, the 4 sub-panels display the following monitored variables (from top-left in clockwise direction): (1) Minute Volume from RVM in black (left y-axis) and total remifentanil in the bloodstream (green, right y-axis); (2) EtCO2 (from nasal prongs measured by anesthesia machine) in black (left y-axis) and BIS index (from BIS monitor) in blue (right y-axis); (3) Respiratory Rate (from RVM) in blue with 2-minute average RR in black and RR from the anesthesia machine (from EtCO2) in red; (4) Tidal Volume (from RVM) in blue and 2-minute average TV (black). In all EtCO2 plots a gray X symbol at 35 mmHg indicates a missing EtCO2 reading from the anesthesia machine. In the MV plots the horizontal black dashed lines represent 100%, 80% and 40% of the patient’s MVPRED. The patient’s baseline MV during the 20 minutes before the trial was 5.4 ±1.0 L/min, corresponding to 103 ±19% predicted. All times are given as time since the first dose was administered.

68
Return to Table of Contents
How low can you go? Examining Pharmacokinetically Defined Minimum Safety Bounds for Propofol During Closed-Loop Control of Anesthesia
Presenting Author: Sonia M. Brodie, MSc* Co-Authors: Klaske van Heusden, PhD**; Nicholas West, MSc*; Matthias Görges, PhD**, Richard Merchant, FRCPC*; Guy A. Dumont, PhD**; J. Mark Ansermino, FRCPC*. *Department of Anesthesiology, Pharmacology & Therapeutics, University of British Columbia, Vancouver, BC, Canada**Department of Electrical and Computer Engineering, University of British Columbia, Vancouver, BC, Canada
Background: In closed-loop control of anesthesia, drug infusion rates are automatically adjusted using continuous feedback from a measure of clinical effect1. This personalized approach allows appropriate drug delivery for each individual based on the level of stimulation during the procedure. The design of a closed-loop system needs to include a safety system to ensure the safety of the patient 2. Our current system includes safety constraints based on propofol’s known therapeutic window3. By default the propofol predicted effect site concentration (Ce) is limited to a of range of 1.5 mcg/mL to 8 mcg/mL, based on the Schnider pharmacokinetic (PK) model4. While these constraints reduce the risk of under- or overdosing for most patients, the bounds are expected to be reached for outliers, indicating that such a patient may not be well represented by the PK model. All population-based PK models have their shortcomings; and a recently published general purpose PK model for propofol5 suggests that the Schnider model underestimates drug concentrations. Thus, we examine the incidence of reaching the lower safety bound for propofol with our current system, and compare the predicted plasma concentrations (Cp) of the Schnider model to the general purpose PK model.
Methods: Following Health Canada and local Research Ethics Board approval, and written informed consent, subjects were recruited from a population of ASA I-III adults undergoing routine, elective surgery. Our closed-loop control system, iControl-RP, receives processed electroencephalography (pEEG) feedback from the NeuroSENSE DOH measure (WAVCNS) [NeuroWave, Cleveland, USA6], and controls two infusion pumps for propofol and remifentanil administrated during both induction and maintenance of anesthesia.
Results: Data from 82 cases (all with propofol in closed-loop; 51 with remifentanil by target controlled infusion, 31 with remifentanil in closed-loop) were collected. The minimum safety lower bound for propofol was reached in 62 % cases. (Table 1). Compared to the Schnider model used in our system, the general purpose PK model for propofol5 estimates the median [range] Cp during maintenance 0.84 [0.26-2.3].mcg/mL higher (Figure 1). Thus, the minimum safety bound may not have been reached as frequently, and as a result propofol infusion may have gone lower in some cases, had we defined our safety bounds with this general purpose model5.
Table 1. Summary of data when the WAVCNS set point was ≤55:
Minimum safety bound for propofol reached at least once
51 cases (62%)
Median propofol dose (mcg/kg/min)
65 [56-85]
% of case at min bound 17 [5.8-33]
WAVCNS 45 [43-48]
MAP (mmHg) 87 [74-94]
HR (bpm) 67 [55-73]
*minimum safety bound for propofol reached when predicted Ce<1.51mcg/mL; data are median [IQR].

69
Return to Table of Contents
Conclusion: The considerable interpatient variability in propofol requirements emphasize s the utility of a closed-loop system which can administer low doses of propofol when needed. However, the minimum safety bound for propofol was reached in the majority of our cases. The median propofol predicted effect site concentration was relatively low in these cases, however the WAV index was also consistently low, and the vital signs were within normal clinical range. The original safety bounds we defined were conservative based previously published data. The high degree of variability between and within patients highlights the challenges of using a population based prediction model for safety bounds. This brings to question which PK model should be used to define the safety bounds for propofol delivered in closed loop. To reduce the number of threshold violations we propose to make it easy for the user to manually adjust the safety threshold to reflect the accuracy of the model, and to consider using the stability in the WAV index to permit automated adjustme nts to the threshold.
References: [1 ] J Clin Monit Comput. 2014;28(1):5-11; [2 ] Anesth Analg 2013;117:1130–8 [3] Anesthesiology. 1997;87(6):1549–62; [4] Anesthesiology, 88(5):1170 – 1182, 1998; [5] Anesth Analg 2014;118:1221–37; [6] J Clin Monit Comput. 2011;25(1):81-7.
!"#$%&'()!"#$%&'($%!)*+,-+!'./'$/(#+(&./,!.0!)#.).0.*!0.#!$+'1!.0!(1$!23!'+,$,!,1.4/!&/!5#$67!'+*'8*+($%!8,&/5!$&(1$#!(1$!9'1/&%$#!-.%$*:!;*$0(<!.#!(1$!=$/$#+*!)8#).,$!-.%$*>!;#&51(<?!@/!A.(1!)*.(,!-$%&+/!B)!C+*8$!0#.-!9'1/&%$#!-.%$*!&/!,.*&%!A*+'D7!=$/$#+*!)8#).,$!&/!%+,1$%!A*+'D?!EF+-)*$!'+,$!0#.-!)1+,$!G!;)#.).0.*!&/!'*.,$%!*..)<!&/!#$%H!)1+,$!3!;)#.).0.*!+/%!#$-&0$/(+/&*!&/!'*.,$%!*..)<!&/!A*8$?!

70
Return to Table of Contents
Evaluation of a Tablet-Based, Rapid Documentation System - EVENTDOC™, During Real In-Hospital Medical Emergencies
Presenting author: Bala G Nair, PhD1 Co-Authors: Kevin Ma BS2, Peter Oppenheimer MS2, Tim Wu MS (PhD candidate)3, Sheryl A Greco RN, MN4, Ross H. Ehrmantraut RN1, Brian J. Ross MD, PhD1,4
1Department of Anesthesiology and Pain Medicine
2Institute for Simulation and Interprofessional Studies 3Biomedical Informatics and Medical Education 4Critical Care and Cardiology & University of Washington, Seattle, WA. Background: Ability of an electronic information management system to perform rapid, accurate and efficient documentation is critical for real-time capture of data during high acuity medical care scenarios such as medical emergencies and emergency room procedures. In such events, when a team of care providers is busy multi-tasking various treatment steps, ability to accurately document patient status and treatment steps becomes difficult. We developed a novel tablet based electronic tool, EventDoc™, to document and manage in-hospital medical emergencies (Figure 1). In a previous study, EventDoc™ was successfully evaluated by a team of volunteer anesthesia residents using scripted mock code simulation videos1. In this study, we describe the evaluation of EventDoc™ during real in-hospital medical emergencies (code blue). Methods: After IRB approval 6 volunteer hospitalists and nocturnists were recruited for the study. The study volunteers were provided with a tablet on which EventDoc™ was installed. Additionally, they were also provided code-blue pagers which were activated in the event of a medical emergency. The volunteers were given a short training on using EventDoc™. As part of the study, the volunteers carried the EventDoc™ tablets and the code-blue pagers during their time at our medical center. When a medical emergency occurred, the volunteers were notified via the code-blue pager at the same time as the actual code-blue team. An available volunteer would reach the location of the event as quickly as possible and document the medical emergency using EventDoc™. The existing paper form was used as the primary mode of documentation and the official medical record while EventDoc™ was used as a secondary, yet concurrent, mode of documentation. The paper and the corresponding electronic records were retrospectively compared to assess the effectiveness of EventDoc™ in documenting medical emergencies. Specifically, data elements in both records were compared to compute data omission (partial and complete) and data timing errors. Results: The volunteers responded to 22 code blue pages. Of these, 11 were not real emergency events. Another 2 cases involved outpatients whose paper records could not be found for comparison. Among the remaining, 9 actual medical emergency events, EventDoc™ records were compared against the paper records. Overall, EventDoc™ records contained 260 more data elements which were not documented on paper, while the paper records contained 16 more data elements undocumented in EventDoc™ (p<0.001). Of the additional

71
Return to Table of Contents
data elements documented in EventDoc™, 76 were orders (medications, labs and airway), 53 were personnel arrivals and 41 were compression stop events that the paper record was not designed to capture. Even after excluding these elements, EventDoc captured 82 additional elements completely missed by paper and 8 additional elements partially missed by paper (e.g. medications without dosage). A detailed breakdown of data elements captured by both EventDoc™ and paper are shown in Figure 2. Timing errors were also less when using the EventDoc™ system with data elements recorded before paper in 26 instances. Paper records recorded data earlier than EventDoc only in 6 instances.
Conclusion: Evaluation of EventDoc™ in real medical emergencies showed that the electronic system is able to capture more data elements with better timing accuracy when compared with existing paper records. Also, features in EventDoc™ allowed capture of information (medication orders, lab orders and compression) that otherwise could not be recorded using paper records. Principles used in the design of EventDoc™ to facilitate rapid and efficient data capture can be translated to other high acuity patient care areas such as emergency rooms, operating rooms and intensive care units.
References: 1 Grigg E, Palmer A, Grigg J, Oppenheimer P, Wu T, Roesler A, Nair B, Ross B. Randomised trial comparing the recording ability of a novel, electronic emergency documentation system with the AHA paper cardiac arrest record. Emerg Med J. 2014;31(10):833-9
Figure 1: Main screen of EventDoc™ documenting a medical emergency

72
Return to Table of Contents
Figure 2: Categorized data elements captured by EventDoc™ and paper records

73
Return to Table of Contents
Data Mining Infrastructure for AIMS Based Registry
Presenting Author: Hubert Kordylewski, PhD, Anesthesia Quality Institute (AQI), IL
Co-Authors: Benjamin Westlake, Anesthesia Quality Institute, IL, Richard Dutton, MD, MBA, Anesthesia Quality Institute, IL, Lance Mueller, MS, Anesthesia Quality Institute, IL
Introduction: AQI’S National Anesthesia Clinical Outcomes Registry includes more than 22 million anesthesia cases. AQI collects clinical, quality, and administrative with detailed ‘sensory’ perioperative data, medications administration, and unique events recorded in real time in electronic record systems. Thus, one case may consist of thousands of time dependent measurements. With the above constraints, the computational time required to develop and test data mining algorithms becomes a major issue. The abstract outlines AQI’s data mining infrastructure (Figure 1).
Methods: Currently, when a problem arises, we re-use common functionality, which involves: (1) an extract of the data and (2) data analysis and data mining formulas (Figure 2). The formulas repository module in Figure 2 serves as a repository of implementations of two types of data mining formulas: (1) custom made algorithms designed and developed for specific problems and (2) batch procedures with substantial utilization of modules in commonly used data analysis packages (SQL modules and R packages). To solve requirements of performing data analysis at a reasonable time computational time, AQI’s solution is a home grown implementation of the ‘map-reduce inspired’ approach in dividing computations among several linked SQL servers (Figure 2).
Results: Typical data mining task involves examination (and their correlations involve) of thousands of observations across fifty or more variables for each anesthesia case) on a large subset of NACOR’s AIMS data (500,000 to 1,000,000 cases with vital signs, medication events). Within single server setup (16 cores at 3.8 Ghz, and 16GB EEC memory) we were able to analyze the subset of NACOR data (500,000 cases) in about thirty minutes in one pass (300 cases/second). Exporting the subset of NACOR data to a distributed computing environment on 6 SQL nodes (4 to 8 cores, 8GB memory) reduced the wait time between passes by a factor of four.
Conclusion: The majority of clinical registries or local hospital data centers do not have the need for a full blown ‘Big Data’ implementation. From the response we have received from sharing AQI’s XML schema, and AQI’s effort to standardize definitions for clinical outcomes, we see increasing demand for guidance and leadership in providing data related infrastructure. There are several areas in which we are planning to share the experience we acquired in our design and implementation of AQI’s systems, including: (1)publishing our knowledge library for common categorization and filtering of cases (The library can also be

74
Return to Table of Contents
used by other clinical registries or data analysis teams), (2) Publishing implementation and of our data analysis infrastructure.
Figure1 Organization of data subsystems. Figure2. Data Mining Infrastructure

75
Return to Table of Contents
Discord in the Definition of Apnea: An Analysis of Apnea Duration in Sedated Volunteers Authors: Sean Ermer, B.S. 1 Joseph Orr, Ph.D1, Kai Kuck, Ph.D1, Lara Brewer, Ph.D1 1 University of Utah Introduction: Studies from John Hopkins and the University of Utah have shown apnea alarms are either ignored or incorrect as much as 90% of the time in the clinical setting. Looking at apnea-related studies, there appears to be a lack of consensus about the definition of ‘apnea’. The literature cites acceptable apnea definitions between ten and twenty seconds since the last breath. The FDA acknowledges ‘type 1’ apnea as lasting ten to twenty seconds while ‘type 2’ apnea lasts more than twenty seconds. Among commercial clinical monitors, most alarms allow the physician to set the alarm within the ten to sixty second range. Given the statistics on reported false-positives and ignored alarms, one must wonder which of these definitions, if any, is ‘correct’ or at least clinically significant. We studied the length of time between breaths in healthy volunteers receiving target controlled infusions of sedatives and hypnotics to learn whether a clear cutoff is evident between hypoventilation and apnea. Methods: With IRB approval, fifteen healthy volunteers (Ages 19-41, BMI 20.9-28.4) were administered target-controlled infusions of Remifentanil (0.75-5 ng/mL) and Propofol (1 ng/mL) to achieve increasing levels of sedation and induce apnea, hypopnea, and airway obstruction—both individually and in combination. At each level of sedation, the modified observer’s assessment of alertness and sedation (OAA/S) and the respiratory rate were recorded. The OAA/S scores the level of sedation on a scale of 5 (awake) to 0 (unresponsive). In order to evaluate specific ‘time since last breath’ apnea definitions, each interbreath interval was placed in a histogram using a bin width of one second (figure 1). Results: Twenty-five hours of data were obtained (9403 breaths). Sedated subjects reached every OAA/S score from zero to five. The histogram produced from these data approximates most closely to an inverse Gaussian distribution with mu=9.58 and lambda=14.10. 66% of interbreath intervals were ten seconds or less and 90 and 95% of intervals were 20 and 25 seconds or less, respectively. Conclusion: Most post-operative patients receive opioids for pain relief, so this data set should correlate especially well with what we would expect to see in the postoperative period. As an indicator of respiratory distress (i.e. apnea), a ten second interbreath interval appears too short. In fact, there does not appear to be any clearly identifiable cutoff that defines apnea. Based on a percentile approach, an interbreath interval of at least a twenty seconds would seem most fitting for an apnea alarm. However, merely looking at time since the last breath and ignoring tidal volume or the number of breaths observed in the last minute will likely lead to a large number of false positive alarms and alarm fatigue. A comparison with other variables, such as etC02, may be required in order to define clinically significant alarms.
Figure 1: Interbreath Interval Histogram

76
Return to Table of Contents
Comparison of the Oxygen Delivery Efficiency of Five Different Nasal Cannula Designs Presenting Author: Kyle Burk, University of Utah, Salt Lake City, UT Co-Author: Joseph Orr, PhD, University of Utah, Salt Lake City, UT Background/Introduction: Ideally, 100% of the oxygen delivered by a nasal cannula reaches the lungs when the patient inhales completely or partially through the nostrils. 100% efficient cannulas are ideal because they deliver all of the oxygen to the lungs and none to the surrounding air, minimizing operating room fire hazard and oxygen desaturation events. Several different nasal cannulas are available for delivering supplemental oxygen. We evaluated the oxygen delivery efficiency of these cannulas for various combinations of inhalation flow rate, oxygen flow rate and mouth opening. To do this, we designed a bench test to evaluate the fraction of oxygen that is inhaled and to compare the oxygen delivery efficiency of five different cannulas. We then compared the theoretical (ideal) oxygen delivery against the actual volume inhaled by simulating supplemental oxygen delivery and measuring resultant FiO2. Methods: We placed each cannula onto a 3D printed model of the nares, oral and nasal passages and upper airway. Mouth open and closed inhalation were simulated by drawing air through the model airway using a vacuum gas flow controller. The vacuum flow controller drew constant flow rates of 5, 10, 20, and 30 LPM through the mouth and nostrils for mouth open inhalation and through only the nostrils for mouth closed inhalation. The controller flow rate was verified using a gas flow analyzer (VT Plus, Fluke Biomedical, Everett, WA). A mass flow controller (Alicat Scientific, Tucson, AZ) delivered oxygen flow rates of 1, 2, and 4 LPM through the test cannulas. Intra-nasal pressure was measured at every setting. We assumed that a negative pressure in the nares was indicative of inhalation through the nostrils. We evaluated the oxygen delivery efficiency of five different models of adult nasal cannulas (Salter Labs four prong #4002, and split lumen #4707, Westmed dual lumen #0503, Ventlab bottom port #4107, and Teleflex Medical Softech® Bi-Flo #1844). All of these cannulas have CO2 monitoring capability. FiO2 was measured in the simulated trachea using an anesthesia gas analyzer (Datex, Helsinki, Finland). Ideal FiO2 were obtained for each combination of settings by measuring O2 in a closed system where air and supplemental O2 were mixed in a hose and 100% of the oxygen delivered was inhaled. The difference between the oxygen fraction observed using a nasal cannula and the ideal oxygen fraction observed using a closed system were recorded. Results: Negative intra-nasal pressure was observed for each setting. The graph below shows the oxygen delivery efficiency of all cannulas when the mouth was open. For both mouth open and mouth closed inhalation, the lowest efficiency was observed at an oxygen flow of 4 LPM and an inhalation flow of 5 LPM, using cannulas designed to deliver oxygen outside of the nares. The efficiency profiles for mouth open and mouth closed inhalation were similar. For settings resulting in efficiency less than 100%, mouth open inhalation resulted in slightly lower efficiency compared to mouth closed inhalation.

77
Return to Table of Contents
Conclusion: Supplemental oxygen delivery is very near ideal as long as intra-nasal pressure is negative, oxygen flow is less than airflow through the nostrils and O2 is delivered inside of and not outside of the nostrils. Compared to cannulas delivering O2 outside the nostrils, cannulas delivering O2 inside the nostrils are more efficient. Cannulas that deliver O2 outside of the nostrils may be less prone to oxygen induced distortion of capnography but efficiency of oxygen delivery is compromised.

78
Return to Table of Contents
Evaluation of the Efficacy of a Computer-Based Reminder System for the Timely Start of Intra-Operative Epidural Infusion for Post-Operative Pain Control
Presenting Author: Aalap Shah, MD1
Co-Authors: Michelle McGauvran, MD1; Bala Nair, PhD1; Laurent Bollag MD1
1 University of Washington Medical Center Background/Introduction: Preoperative epidural catheters placed for post-operative pain management are often only started after conclusion of the surgery. Consequences of delayed epidural initiation include increased post surgical pain and prolonged recovery room stay time by delaying patient discharge, and it is thus recommended that these infusions be started early on during surgery.1-3 In our institution, a large academic medical center, a baseline audit of patients receiving pre-operative epidurals revealed that infusions were started pre or intra-operatively only 57% of the time despite them being placed pre-operatively. We describe the use of a near real-time decision support system to improve compliance to starting epidural infusion. Methods: We used an Anesthesia Information Management System (AIMS) based decision support system called Smart Anesthesia Manager (SAM), to institute a computer reminder system to encourage the timely initiation of post-operative pain control epidurals. Through SAM, selected issues related to quality of care and documentation are brought to the attention of the anesthesia provider via “pop-up” message screens. As part of the patient time-out feature, we instituted an optional check box to note whether an epidural is placed for post-operative pain control. If the provider checked “Yes”, SAM system generated reminders every 24 minutes via “pop-up” screens to encourage providers to start and document the epidural. (Figure 1) The messages are stopped when either an epidural infusion has been started or if the provider documents an epidural contraindication. We reviewed the compliance for cases for 1 month before (Baseline: September 2014) and 1 month after the SAM intervention was instituted (Intervention: November 2014). Results: Compliance to starting epidural infusion increased from 57% (49 out of 86 epidurals) during the baseline period to 74 % (68 out of 92 epidurals) during the intervention period (p=0.02). However, during the intervention period, providers used the checkbox for post-operative pain control epidural only 25% of the time (334 out of 1322 cases). Also, among the 92 pre-operative epidurals placed during the intervention period in only 32 instances was there a confirmatory answer in the AIMS epidural checkbox (34.8% compliance). Compliance to starting epidural in cases when providers documented a confirmatory answer in the AIMS epidural checkbox, thus triggering a SAM reminder, was 90.6%. This was higher than the 65% compliance for cases that did not use the AIMS checkbox and SAM reminders (p=0.01). The time elapsed until epidural intiation was shorter in patients for whom an answer was provided to the SAM prompt, compared to those in whom the prompt was ignored (35.4 vs 58.5 min), a statistically insignificant trend (p=0.10). Conclusion: Near real-time notifications to initiate epidural infusions were modestly effective. An optional documentation feature in AIMS to note whether a patient has an epidural for postoperative pain management had poor compliance, which in turn meant SAM reminders were not triggered for a significant number of epidural patients. Triggering SAM reminders based on epidural orders in the hospital EMRs, rather than on voluntary documentation may be a more effective way to improve compliance to epidural initiation.

79
Return to Table of Contents
References: 1. Andreae MH, Andreae DA. Local anaesthetics and regional anaesthesia for preventing chronic pain after surgery. The Cochrane database of systematic reviews 2012;10:CD007105. 2. Kehlet H, Jensen TS, Woolf CJ. Persistent postsurgical pain: risk factors and prevention. Lancet 2006;367:1618-25. 3. Rivat C, Bollag L, Richebe P. Mechanisms of regional anaesthesia protection against hyperalgesia and pain chronicization. Current opinion in anaesthesiology 2013. Figure 1 : SAM notification for initiating epidural infusion

80
Return to Table of Contents
Non-Invasive Respiratory Volume Monitoring Provides Quantitative Measurements that Provide a Better Assessment of Ventilatory Status than Capnography-Generated Respiratory
Rates Author: Voscopoulos C, MacNabb CM. Introduction: Clinicians often face a dilemma, when identifying appropriate patient monitoring: more accurate and more reliable measurements can be associated with a higher cost. Sometimes the cost is material such as CT versus x-ray and at other times it results in increased patient discomfort or risk of infection (invasive BP vs NIBP). Respiratory monitoring of non-intubated patients is particularly challenging, because until recently, any direct measurements of true respiratory effort involved the use of a tight-fitting mask attached to either a spirometer or pneumotachometer, making this method clinically impractical. Instead, clinicians often rely on secondary indicators of respiratory sufficiency, such as pulse oximetry (SpO2) and capnography (EtCO2). Unfortunately, relevant changes in SpO2 are easily masked by the use of supplemental oxygen and EtCO2 measurements in non-intubated patients are frequently unreliable to the point where clinicians resort to using only the respiratory rate (RR) measurements from the capnograph. A recently developed non-invasive respiratory volume monitor (RVM), which continuously measures minute ventilation (MV), tidal volume (TV) and respiratory rate (RR), addresses majority of these concerns. RVM also provides a new way to accurately assess the ability of EtCO2-generated RR to adequately quantify respiratory status in non-intubated patients. Methods: Continuous RVM and capnography data were collected from 50 subjects (age:46 ±14 yrs; BMI:27.6 ±6.1 kg/m2) using an impedance based RVM (ExSpiron, Respiratory Motion, Inc., Waltham, MA), and a capnograph (Capnostream 20, Covidien, Mansfield, MA) using a sampling oral/nasal cannula (Smart Capnoline Plus). Each subject performed six 2.5-min breathing trials at various RRs. The correlations between EtCO2 measurements (low: <35 mmHg, normal: 35-45 mmHg, high: >35 mmHg), capnography-based RR (low: <6 b/min, adequate: >=6 b/min), and RVM-based MV (low: <2L/min, adequate: >=2 L/min) were evaluated. Results: A direct comparison of MV and EtCO2 measurements revealed that in only 24.6% of the 9324 analyzed epochs adequate MV coincided with normal EtCO2. 68.7% of the time adequate MV coincided with a low EtCO2 and, 100% of low MV measurements corresponded to either normal or low EtCO2 (Fig 1A). Similarly poor correlation was present between the capnorgaph’s RR and EtCO2 measurements: normal EtCO2 coincided with adequate RR just 24.9% of the time and none of the low RR measurements were indicative of a high EtCO2 (Fig 1B). When using RR as a proxy for MV it was also noted that low MV is observed at a wide range of RRs, with only 15.5% of all low MV events captured by a low EtCO2-based RR (Fig 1C).

81
Return to Table of Contents
Conclusions: This study confirmed that (a) EtCO2 is an inadequate proxy for MV in non-intubated patients, (b) EtCO2-based RR is a poor proxy for EtCO2, and even more concerning, (c) EtCO2-based RR is an even worse proxy for MV. Ultimately, the data demonstrated that relying on capnography to capture the volatile nature of respiratory status in non-intubated patient’s is highly inadequate and one must carefully weigh the cost-savings against the increase in patient risk and the likelihood of incurring extra cost due to preventable respiratory complications.
Figure 1: Analysis of the collected measurements (9324) reveals poor correlations between (A) EtCO2 and MV (B) RR and EtCO2 and (C) RR and MV, despite RR being derived from EtCO2 and MV being a function of RR (MV=TVxRR).

82
Return to Table of Contents
A Handoff Tool to Facilitate Transfer of Care from Anesthesia to Nursing in Intensive Care Units
Presenting Author: Aalap Shah MD1,
Co-Authors: Anna Xue BS2, Daniel Oh BA, MS2, John D Lang MD1, Bala G Nair PhD1 1Department of Anesthesiology 2School of Medicine, University of Washington, Seattle, WA Background/Introduction: Patient care handoff from one team of providers to another is a critical moment highly prone to medical errors1,2. Transfer of care at the end of surgery between anesthesia and nursing teams is a typical example when inaccurate and incomplete transfer of relevant clinical information could increase the risk of inadvertent medical mistakes. We describe the development of a tool that provides a customized report of intraoperative data to facilitate safe handoff. Additionally, the tool also notifies the recovery team of patient transport, with the handoff summary report produced prior to the patient actually arriving at the recovery bed. Advance notice and upfront availability of handoff information could better prepare the recovery team for a smoother transfer of care. Methods: We developed an AIMS-based handoff tool that can be evoked at the touch of a key on the AIMS computer. The tool presents the most current AIMS data summarized into the following main categories (Figure 1)– medications, anesthetic techniques and line placements, fluid input/output and labs. At the end of surgery, prior to leaving the operating room, the anesthesia provider selects the disposition location and initiates a “print summary and page recovery” action. This automatically prints the transfer summary report in designated recovery room printers and sends a text page to recovery staff notifying that a patient is leaving the operating room. The recovery room staff collects and reviews the summary report in preparation for handoff. During handoff, the anesthesia and recovery teams use the transfer summary report as a reference document.
We piloted the handoff tool to facilitate transfer of care in the intensive care units (ICU). The Cardiac, Surgical and Medical ICU staff members were presented with the transfer tool and the associated workflow of receiving the patient transport notification page, collecting the handoff summary report and utilizing it to facilitate transfer of care. Similarly, the anesthesia team was also trained in the use of the handoff tool. Volunteer medical students were recruited and trained to observe the transfer of care and collect data pertinent to the handoff process.
Results: Handoff process was observed in 7 instances when the transfer summary sheet was not used (controls) and in 14 instances when the transfer summary sheet was used (intervention). In general, omission of critical data elements was less when using the transfer summary - Urine output: 3/14 (intervention) Vs. 3/7 (controls), Blood loss: 5/14 (intervention) Vs. 4/7 (controls) and Fluids & infusions: 2/14 (intervention) Vs. 3/7 (control). Duration of the handoff process was similar for control and intervention cases though the intervention group had primarily cardiac ICU cases while the control group comprised of mainly surgical ICU

83
Return to Table of Contents
cases. The use of the handoff tool to facilitate patient transfer could be easily integrated into the clinical workflow without disruptions.
Conclusion: Pilot observation and data indicate that an AIMS-based handoff tool could be easily integrated into the clinical workflow and could potentially facilitate safer patient transfer. Further studies are required to prove the effectiveness of such a tool.
References: 1. Chen JG, Wright MC, Smith PB, Jaggers J, Mistry KP. Adaptation of a postoperative handoff communication process for children with heart disease: a quantitative study. Am J Med Qual 2011; 26(5):380-6. 2. Flanagan ME, Patterson ES, Frankel RM, Doebbeling BN. Evaluation of a physician informatics tool to improve patient handoffs. J Am Med Inform Assoc 2009; 16(4):509-15.
Figure 1: Handoff tool used to facilitate transfer of care in the ICU
!"#"$%&'()*+)(%(+,-&./(,%&)0112/3450%+&*26"&)",%

84
Return to Table of Contents
Administering Patient Reported Outcomes Measurement Information System (PROMIS) Tools via Tablet Computer and E-mail to Assess Health Measures in
Pediatric Adenotonsillectomy Patients at Ambulatory Surgery Centers
Presenting Author: Allan F. Simpao, MD Co-Authors: Elicia C. Wartman; Jorge A. Galvez, MD; Arul Lingappan, MD; Luis M. Ahumada, MSCS; Abbas F. Jawad, PhD; Mohamed A. Rehman, MD
Background: The Patient Reported Outcomes Measurement Information System (PROMIS) is an NIH- funded system of highly reliable, precise question-and-answer measures of patient-reported physical, social, and mental well being that can be administered via paper-based or electronic means. Adenotonsillectomy (T&A) procedures are one of the most common procedures performed at our institution, yet systematic measurement of patient-reported health status was not routinely performed. We initiated the pre- and post-surgery administration of PROMIS tools using tablet computers and e-mail to T&A patients at our ambulatory surgery centers.
Methods: A research assistant enrolled patients of ages 5-17 years old on the day of surgery who were scheduled for an T&A or adenoidectomy at an ambulatory surgery center. The PROMIS tools (measuring anxiety, depression, fatigue, physical function and peer relations) were administered to the patients in the preoperative waiting area prior to the procedure using a PROMIS-enabled tablet computer. Patients of ages 5-8 years were encouraged to complete the electronic questionnaires with a parent or guardian proxy. At one week post-procedure, a link to the PROMIS tools was sent via e-mail to the patient’s caregiver; if necessary, a research assistant reminded the caregiver to complete the PROMIS assessment via a telephone call.
The PROMIS tools results generated both raw and scaled PROMIS scores. The raw PROMIS scores (z- scores) were converted to the scaled PROMIS scores. The scaled scores are based on standard curves in healthy patients, with each curve having a mean of 50 (no units) and standard deviation of 10. We analyzed the PROMIS results were analyzed and generated descriptive statistics following ten months of data collection.
Results: Fifty-six patients completed the pre-procedure and one-week follow-up PROMIS assessments during February 1, 2014 to November 7, 2014. Eighteen patients were in the 9-17 years old age group and completed the PROMIS tools themselves; 38 patients were in the 5-8 year old age group that consisted of caregiver proxy scores. Table 1 summarizes our scaled PROMIS score results.
Conclusions: The PROMIS tools allowed for convenient measurement of patient-reported outcomes in pediatric T&A patients. Upon initial review, no dramatic changes in the six measured outcomes were noted in the 9-17 years age group. There was a 10-point (1 SD) increase in fatigue scores (and a similar decrease in mobility scores) at the

85
Return to Table of Contents
1 week follow up point in patients of ages 5-8 years, and an increase in pain interference scores, suggesting that children in this age group continue to be affected by pain and fatigue one week after surgery. Future plans include continued patient recruitment and administration of the PROMIS tools, more rigorous statistical analysis, and investigation of the causes of the score changes to determine possible options for amelioration of pain and fatigue symptoms post-procedure.

86
Return to Table of Contents
Analysis of the Predictive Potential of Pulse Oximeter Data for Admission
Presenting Author: Dustin Dunsmuir*
Co-Authors: Ainara Garde†, Guohai Zhou#, Shahreen Raihana^, Tanvir Huda^, Walter Karlen~, Parastoo Dehkordi†, Shams El Arifeen^, J Mark Ansermino* Departments of *Anesthesiology, Pharmacology & Therapeutics, †Electrical & Computer Engineering, and #Statistics, The University of British Columbia, Vancouver, Canada
^International Centre for Diarrhoeal Disease Research, Bangladesh ~Department of Health Sciences and Technology, ETH Zurich, Switzerland
Introduction: Annually, more than 13 million children die from sepsis caused by conditions such as pneumonia and diarrhea due to a lack of resources and clinical expertise [1]. An objective test for which children should be referred to a facility would help community healthcare workers to best utilize resources. Mobile phones are now widely used even in low resource settings and provide an ideal platform for both vital signs assessment and automatic diagnosis. The first step is to identify differences in objective measures between children who need to be admitted and those who can return home.
Methods: Using the Phone Oximeter, a mobile device integrating a pulse oximeter with a phone, we have designed a mobile data collection application, called PhoneOxR2, that includes measurement of oxygen saturation (SpO2), heart rate (HR) [2] and a respiratory rate (RR) count by tapping the screen [3]. PhoneOxR2 also provides a waveform that reflects blood volume changes, the photoplethysmogram (PPG), which permits the estimation of HR variability (HRV) [4]. Using PhoneOxR2 on iPod touch devices (Apple Inc, Cuppertino, USA), 1-min PPG, SpO2 and HR were collected along with RR from a total of 3374 children presenting at a not for profit private tertiary level hospital in Bangladesh from October 2012 to April 2013. Children were excluded if they had a known chronic disease, previously documented low SpO2, or other conditions such as cardiac disease. Additionally, the analysis was limited to children who presented at least 30 seconds of good quality pulse oximetry, which excluded 1323 children from the analysis. Therefore, the SpO2, HRV, RR and HR were studied for 2051 children. The SpO2 was characterized through its median, cumulative time spent below 94% (t94%) and variability measure computed in 12-s intervals (Δ index). HRV was estimated through the standard deviation of pulse peak (PP) intervals of the PPG (SDNN) and the root mean square of the successive differences between adjacent PP intervals (RMSSD). Median and interquartile ranges were used (median [IQR]) to summarize data and the Mann–Whitney U test was used to derive confidence intervals for median differences (CI) and associated p-values. Bonferroni correction was used to adjust for multiple (n=7) comparisons.
Results: Children admitted to the facility had significantly (p-value < 0.05/n) higher RR (40.0 [20.4] versus 32.8 [10.4], CI 5.9 to 9.1 breaths/min), higher HR (140.0 [28.1] versus 125.2 [25.5], CI 11.4 to 17.6 beats/min) and lower SDNN (0.016 [0.014] versus 0.022 [0.023], CI -0.006 to -0.003 s) and RMSSD (0.016 [0.012] versus 0.021 [0.024], CI -0.004 to -0.002 s), compared to children not admitted to the facility. Admitted children also showed lower SpO2 (95.3 [6.6] versus 98.0 [2.0], CI -2.8 to -1.7 %), and higher SpO2 variability t94% (2.0
2040
6080
RR (breaths/min)
Admitted No Admitted Yes
6080
100
120
140
160
180
200
HR (beats/min)
Admitted No Admitted Yes
0.05
0.10
0.15
RMSSD (s)
Admitted No Admitted Yes
5060
7080
90100
Median SpO2 (%)
Admitted No Admitted Yes
010
2030
4050
60
t94% (s)
Admitted No Admitted Yes
01
23
45
Δ (%)
Admitted No Admitted Yes

87
Return to Table of Contents
[Type text] [Type text] [Type text]
[41.3] versus 0.0 [0.3], CI 0.33 to 2.33 s) and Δ (0.308 [0.291] versus 0.220 [0.210], CI 0.061 to 0.115 %).
Conclusion: The difference in these objective measures between children admitted and those not admitted indicates that an objective, automated stay-or-go test is feasible. Further analysis is being done to create a predictive model combining these objective measures. This predictive model will generate a risk score for the probability of the need for the child to be admitted to a facility. If this score is above a specific threshold, it will be recommended that the child be referred for admission. We will provide community healthcare workers with real-time tools for making objective measurements to provide a rapid prediction that a child would require admission to a facility. These tools will provide the smart application greatly needed in low resource settings where expertise is lacking to manage life-threatening infections.
1Mangia, C.M.F., et al., “Sepsis and Septic Shock: A Global Overview”. Journal of Pediatric Infectious Diseases, 2009. 4(2): p. 71-76. 2 Dunsmuir, D., et al., “The Phone Oximeter for Mobile Spot-Check”. The 2012 Annual Meeting of the Society for Technology in Anesthesia (STA), Jan 18-21, 2012. 3 Karlen, W., Gan, H., et al., “Improving the Accuracy and Efficiency of Respiratory Rate Measurements in Children using Mobile Devices”, PLOS ONE, 9(6): e99266. 4Dehkordi, P., et al., “Pulse Rate Variability Compared with Heart Rate Variability in Children with and without Sleep Disordered Breathing”, 35th Annual International
Conference of the IEEE Engineering in Medicine & Biology Society (EMBS), Jul 3-7, 2013, p. 6563-6566.

88
Return to Table of Contents
Use of an Automated Cost Calculator to Quantify Anesthetic Cost Interventions Presenting Author: Jonathan Wanderer, MD, MPhil, Departments of Anesthesiology and Biomedical Informatics Co-Authors: Ariana Tabing, BS, Vanderbilt University School of Medicine, Jesse Ehrenfeld, MD, MPH, Departments of Anesthesiology, Biomedical Informatics, Health Policy and Surgery Introduction: Controlling healthcare expenditures has become increasingly important in today’s healthcare environment, and anesthetic-related drug costs are now precisely measurable using data collected by anesthesia information management systems (AIMS). AIMS have led to case-specific and provider-specific cost feedback and allowed the implementation and evaluation of various cost containment strategies. Remifentanil, dexmedetomidine, and desflurane, are costly agents that often have suitable alternatives to their use. We implemented interventions that limited desflurane, remifentanil, and dexmedetomidine availability. We sought to identify changes in cost and process outcomes following these interventions. Methods: We calculated volatile and intravenous drug costs for all operating room procedures performed five months before and after the accessibility interventions through AIMS. We analyzed age, gender, American Society of Anesthesiologists (ASA) classification, body mass index, procedure type, anesthesia technique, attending anesthesia provider, case duration, and out of room times. We retrospectively compared drug costs per case and frequency of agent use before and after the interventions. Wilcoxon-Mann-Whitney and Chi Square analysis were used to quantify the cost and use differences between time periods. Results: 27,233 surgical cases were identified, and 26,953 were analyzed. Mean anesthetic drug costs were significantly lower (p<0.0001) after the interventions at $21.44 compared to $32.39 before, a cost savings of $10.95 (95% CI $9.86 to $12.04). The percentage of cases using remifentanil was significantly lower (3.5% vs 9.2%, p<0.0001). Use of dexmedetomidine did not significantly differ (0.4% vs 0.5%, p=0.07). The percentage of cases using desflurane was significantly lower (0.6% vs 20.2%, p<0.0001). There was no significant relationship between the interventions and the frequency of cases with delayed out of room times (greater than 15 minutes after end of case). Conclusions: An automated cost calculator permitted quantification of these cost interventions and allowed analysis and feedback of these data. Reducing the accessibility of cost-prohibitive agents resulted in significant cost savings and decreased usage without delaying transfer to the recovery room.

89
Return to Table of Contents
Automated Decision Support for Anesthesia Provider Relief: An Initial Survey and Implementation Report
Presenting Author: Jonathan P. Wanderer, MD, MPhil, Vanderbilt University, Departments of Anesthesiology and Biomedical Informatics
Co-Authors: Leslie C. Fowler, M.Ed; Stephanie Reed, MD; Jesse M. Ehrenfeld, MD, MPH; Matthew D. McEvoy, MD. Vanderbilt University, Department of Anesthesiology
Introduction: Consistently providing equitable relief from clinical duties may be an important element in fostering and maintaining team morale. Achieving this in complex work environments such as academic medical centers can be challenging. Relief decisions could potentially be facilitated by the use of automated tools integrated with anesthesia information management systems (AIMS). We conducted a survey of trainee opinions on such a tool and describe its implementation.
Methods: We surveyed our PGY3-4 anesthesia residents to determine if they currently had adequate information when making relief decisions and understand their preferences in receiving automated decision support to assist with making assignments. In parallel, a system was created to generate daily emails with ranked relief prioritization utilizing information from our AIMS and our staff scheduling system. A multidisciplinary group created a set of guidelines for making relief decisions, which was incorporated into the email.
Results: Thirty-four of the 36 residents contacted completed the survey (94.4% response rate). Of residents providing relief, 60% of residents agreed or strongly agreed that they had adequate information to make equitable relief assignments; however, of residents receiving relief, only 36% agreed or strongly agreed that adequate information was available. Eighty-two percent agreed or strongly agreed that they would like to receive a prioritized relief list, and 85% preferred an automated email over a dashboard or smartphone app. As such, an automated decision support system for anesthesia provider relief was created and deployed (Figure 1).
Conclusions: There is an imbalance between the perceptions of information availability for equitable relief between those making relief decisions and those on the receiving end of those decisions. Residents were in agreement that an automated, prioritized relief list would be useful and preferably delivered by email. Preliminary results suggest that the automated decision support system has been useful, but this requires confirmation with a follow-up survey and analysis of relief data.

90
Return to Table of Contents
Figure 1: Example email from the automated decision support system for anesthesia provider relief.

91
Return to Table of Contents
Development of an International Standard for Lung Ventilator Vocabulary and Semantics
Presenting Author: Steven Dain MD, FRCPC, Department of Anesthesia, Woodstock Hospital, Adjunct Associate Professor, Electrical and Computer Engineering, University of Waterloo Introduction: Numerous case reports, articles, standards committees (ISO TC 121), regulatory bodies and the recent AAMI Ventilator Summit have identified a need for a standardized vocabulary for patient ventilators to decrease use error. Methods: Over the past 6 years, ISO Technical Committee 121 Subcommittee 4 have reviewed the medical literature, instructions for use of many current and historical ventilators and their sales material and critical incident reports. Interviews have been held with stakeholders in the field including manufacturers, respiratory therapists, anesthesiologists and critical care physicians. We worked with Medical Informatics specialists, from several other standards development organizations to comprehend their problems to ensure that the terminology addressed their requirements and those of ventilator users and operators. Results: A new conceptual framework was developed based on how the patient interacts with the ventilator. The standard will define about 200 terms, with notes and illustrations providing guidance as to their usage and application. Care was taken to clearly differentiate terms describing settings from those describing observations. The framework defines the 3 basic ventilation patterns (specified temporal pattern of sequenced interactions between the ventilator and the patient, including the means of initiation of the selected inflation-types(s)) and inflation-types (specific inflation characterised by its control of flow or pressure over time). Inflation types include pressure control, volume control, pressure support, volume targeted pressure control, and proportional pressure support. “Spontaneous breath” has been defined as a breath initiated by the patient. A new concept, baseline airway pressure (BAP), is the reference airway pressure upon which inflations are superimposed and unassisted breaths may occur. Observed breath types include controlled, assisted, supported, or natural. Conclusion: We intend to publish ISO 19223 Lung Ventilators and related equipment-- Vocabulary and Semantics in late 2015 or early 2016.
Airway pressure, pAW
EEP
Inflation time, tI
Flow-regulated Inflations
0
Airway flow
BAP
Inflation pressure, pI
Set (inflation) flow
Peak expiratory
flow
Expiratory Flow time
Ambient pressure
expiratory flow

92
Return to Table of Contents
Development and Implementation of a Process to Notify Surgeons via Text Messaging when Specified Events in the Anesthesia Information Management System are Documented
Presenting Author: Richard H. Epstein, MD, Sidney Kimmel Medical College at Thomas Jefferson University, Philadelphia, PA Co-Author: Ian Yuan, MD, ME, Sidney Kimmel Medical College at Thomas Jefferson University, Philadelphia, PA Introduction: At many hospitals, the primary surgeon delegates incision closure to an assistant (e.g., resident, fellow, surgical first assistant). After scrubbing out of the case, the surgeon often engages in clinical activities such as working in another operating room (OR), examining and the marking the surgical site of the next patient, contacting the current patient’s family, dictating the operative report, etc. However, when the surgeon leaves the OR suite, this may lead to delays in starting the next case due to lack of situational awareness that the next patient has entered the OR. At some institutions, the room status is displayed on large video terminals in multiple perioperative locations. However, these displays may be out of view and the surgeon must continually scan the screens to determine when his or her next patient arrives in the OR. We desired a system that would automatically page the surgeon when his or her next patient entered the OR. We also wanted automated notification during pediatric intra-arterial chemotherapy (IAC) cases (for retinoblastoma) where the surgeon wanted to be present following transfer of the patient from the fluoroscopy table to the stretcher to remove the arterial catheter and hold pressure on the femoral artery.
Methods: We already had in place a decision support system that scans our anesthesia information management system (AIMS) database every 1 min for milestone events (e.g., next patient arrives in holding area, surgery has ended) and notifies the supervising anesthesiologist via alphanumeric text pager.1 This system uses an in-house radiofrequency transmitter that has coverage throughout the entire hospital. Our surgeons do not carry alphanumeric pagers compatible with our system, but they all have smart phones. Furthermore, the hospital has local cellular networks for our two most commonly subscribed carriers (Verizon and AT&A) installed throughout the facility. We added a communication pathway to our decision support system that sends a text message to the cell phone of surgeons desiring such notices. When the “Patient has entered the OR” or “Patient transferred to stretcher” event (for IAC cases only) is detected, a message is transmitted from our SQL Server 2008 R2 (Microsoft, Redmond, WA) using the built in stored procedure msdb.dbo.sp_send_dbmail. To use this process, the database mail process was enabled2 and a profile account established from which the messages originate. Surgeons desiring messages provide their cell phone number and carrier, and this is added to their profile in the AIMS staff table. Phone numbers are coded as nnn-nnn-nnnn-X, where X is a single digit code identifying the carrier (e.g., V=Verizon, A= AT&T). At transmission, this code is translated to the carrier’s text message format (e.g., 555-123-4567-V => [email protected]. A single notification was sent for each event. Messages do not contain any protected health information (Figure).
Results: The system was successfully implemented as a pilot for 3 surgeons who had requested this service. Adding a surgeon’s contact number results in immediate implementation of messaging. Each surgeon indicated that he or she found the system helpful and requested to continue receiving messages. Because the anesthesia AIMS workflow starts the trending of vital signs when the patient
1 Epstein RH et al. Anesthesia and Analgesia 116:911-918, 2013 2 Hunter J. http://www.idevelopment.info/data/SQLServer/DBA_tips/Database_Administration/DBA_20.shtml

93
Return to Table of Contents
enters the OR and this event is tied via a macro to the “Patient enters the OR” event, the system has been highly reliable. Situations where messages are not transmitted include when the patient’s care is transferred to another surgeon, but this is not updated in the scheduling system, and if the case is manually entered by an anesthesia provider and the primary surgeon is not entered or is incorrectly specified.
Discussion: The notification system was simple to implement and has been well received by the surgeons. The impression of the anesthesiologists supervising the chemotherapy cases is that it has resulted in fewer delays from trying to locate the surgeon at the end of cases. We use a polling strategy, but messaging could also be implemented by creating a trigger on the event table for the targeted events. We plan to expand the pilot by a general announcement to all surgeons advising them of the availability of the system.

94
Return to Table of Contents
Development of a Device for Magnetically Guided Intubation
Presenting Author: Barrett Larson, MD, Stanford University
Introduction: Although direct laryngoscopy is a reliable method for endotracheal intubation, there are situations when direct visualization of the vocal cords may be difficult or impossible. For example, if blood or gastric secretions have compromised the airway, it may be impossible to visualize the vocal cords using any optical means. Another method of endotracheal intubation involves using a lighted stylet. The light transilluminates through the tissues of the anterior neck to help guide the endotracheal tube into the trachea. This technique can also be useful in the setting of suspected or known neck injury, where neck manipulation should be avoided. Despite its benefits, the transillumination technique does have some limitations, which include 1) need for a dark or dimly lit environment, 2) impaired transillumination in obese patients with significant redundant neck tissue, and 3) impaired transillumation in patients with darkly pigmented skin. To overcome these limitations, a device was developed that detects and visually represents the location of a magnetic intubation sylet and helps guide the stylet into the trachea via magnetic field sensing.
Methods: A prototype device was designed, built, and tested. The device was developed on a flexible PCB, such that the apparatus could easily conform around the anterior neck. The device has an array of Hall sensors capable of detecting the magnetic field produced by an external magnet that is incorporated into the tip of the intubation stylet. An array of accelerometers is also incorporated into the device, such that the neck circumference (and thus expected tracheal depth) could be determined and the device could auto-calibrate in real-time. A microcontroller aggregated sensor data and controlled a series of LEDs that visually represented the location and depth of the magnetic intubation stylet. The device was tested on an intubation mannequin.
Results: A prototype device was successfully developed and tested in a simulation environment. The visual LED-targeting array accurately represented the 3- dimensional location of the intubation stylet. The intubation stylet could be guided into the trachea using the magnetic guidance system. Ambient room lighting, skin tone, or neck size did not affect guidance.
Conclusion: A novel method for endotracheal intubation using magnetic guidance was developed. This technique potentially offers several advantages over conventional intubation techniques, which include: 1) insensitive to blood or other fluids in the airway, 2) neck manipulation is not required, 3) not affected by ambient room lighting, 4) not affected by skin tone, and 5) not affected by neck size. Future studies will aim to optimize the firmware and incorporate additional sensing modalities to further increase the reliability of the guidance system.

95
Return to Table of Contents

96
Return to Table of Contents
A Design Analysis of SAMBA’s PONV Guidelines for Perioperative Clinical Decision Support
Presenting Author: Dr. Brian Rothman, MD, Vanderbilt University, Department of Anesthesiology
Co-Author: Dr. Michael Bernell, MD, Vanderbilt University, Department of Anesthesiology.
Introduction: Postoperative nausea and vomiting (PONV) is a significant perioperative issue facing patients and healthcare systems in ambulatory and inpatient settings. Risk factors may place surgical patients at a 20-80% likelihood of PONV. While the Society for Ambulatory Anesthesia (SAMBA) recently established a new set of expert guidelines, little literature exists that addresses practical implementation aspects of information availability within the context of perioperative medical decision-making in a modern perioperative information management system.
Methods: The SAMBA guidelines incorporate Apfel’s simplified risk score to estimate risk for PONV, which include female gender, history of PONV or motion sickness, nonsmoker status, and postoperative opioids as risk factors. We reviewed Vanderbilt’s Perioperative Information Management System (VPIMS) to identify all locations where data related to each risk factor were collected. Then, we considered provider workflow and the timing of data entry to identify when each risk factor would be known, and when it would available within VPIMS. Next, we evaluated interventions and anesthetic techniques that may decrease risk, such as adequate hydration and avoidance of nitrous oxide, volatile anesthetics, and opioids. Finally, we identified opportunities and potential gaps for delivering clinical decision support within VPIMS.
Results: Each risk factor was identified within VPIMS. Gender is known before admission and is available from our ADT feed. We identified a gap for transgender patients, as our ADT does not currently address differences between patients’ genetic makeup, gender identify and anatomy. A history of PONV could be identified from the patient’s preoperative assessment or from documented nausea during a previous PACU visit. Motion sickness could only be found in the preoperative assessment. Tobacco use is documented both in the preoperative assessment and in the preoperative nursing documentation. Finally, postoperative opioid use in the PACU is found in the postoperative nursing documentation, and the surgical postoperative orders could identify potential post-PACU opioid use. While all these data are ultimately available, they may not be available contemporaneously. We expect that VPIMS will have the most complete data available for medical decision-making during the intraoperative period which enables decision support to suggest avoiding nitrous oxide and ensuring adequate hydration. Documentation latency would be an obstacle in providing decision support relevant to pre-operating room decisions, such as avoiding volatile anesthetic and employing regional anesthesia. Most significantly, risk

97
Return to Table of Contents
factor underestimation from latency could result in missed opportunities to initiate a preoperative multimodal pain regimen, potentially impacting outcomes.
Conclusion: Reducing PONV through clinical decision support in accordance to the SAMBA guidelines is possible. However, perioperative information management systems must support and encourage the collection of these data in a discrete and contemporaneous fashion. Documentation latency leads to underestimation of risk factors, which may create missed opportunities to employ risk reduction techniques. Ultimately, delivering clinical decision support with the right information to the right person, at the right place, at the right time may decrease the incidence of PONV and improve outcomes.

98
Return to Table of Contents
A Software System to Collect High-Resolution Respiratory Data for Analysis of Transient Airway Events During General Anesthesia
Authors: Ian Yuan, MD, MEng*; Robert Machnicki Jr., MD; Matthew Hirschfeld, MD; Anna Rabinowitz, MD; Michael J Williams, MD; Richard H Epstein, MD. Department of Anesthesiology, Sidney Kimmel Medical College at Thomas Jefferson University, Philadelphia, PA. *Presenting author. Introduction: Anesthesia information management systems (AIMS) typically record intraoperative data q 1 minute, with some allowing up to q 15 sec resolution. These intervals are inadequate for capturing transient changes in airway parameters, necessary in our ongoing study of bronchospasm in pediatric retinoblastoma patients undergoing ophthalmic artery intra-arterial chemotherapy (IAC). We describe the technical details of configuring such a system to capture airway parameters at much higher resolutions. Methods: With IRB approval and written parental consent, intraoperative data of patients undergoing IAC were collected on a laptop PC. We used the Dräger Medibus® Data Acquisition Program (version 1.4.0.0, Dräger®, Telford, PA), available to their customers at no charge from Dräger® requiring Microsoft Windows XP®. A standard USB to DB-9 cable was used to connect to the COM 1 port on the Dräger Apollo® anesthesia machine.). The number assigned to the USB port used must match the port number in the collection software (1-4). Baud Rate = 9600, Parity = Even, Stop Bits = 1. The anesthesia machine COM port was similarly configured, as specified in the technical manual for the device. When settings are correct, the program header displays “Connected to: Apollo” and waveform data are displayed. The following data can be plotted q 16 msecs: peak pressure (mbar), flow (l/min), and etCO2 (mmHg) and can be saved to disk (“Curve Recording” mode) as a text file. Alternatively, the following data can be saved q 5 seconds (“Data Recording” mode): compliance [ml/mbar], peak breathing pressure [mbar], PEEP [mbar], plateau pressure [mbar], tidal volume [ml], and etCO2 [mmHg]. Files from Curve Recording and Data Recording were imported into Microsoft Excel® for signal processing and analysis. Results: In a retinoblastoma patient who developed bronchospasm, figure 2 shows peak pressure and figure 3 shows etCO2 recorded with different resolutions over a two-minute window. The top graphs shows Dräger Innovian® AIMS recordings of every minute, middle graphs shows recordings of every 5 seconds, and the bottom graphs shows high-resolution recordings of every 16 msecs. The red dotted line indicates the time (08:32:10) when the catheter entered the ophthalmic artery. Compared to our AIMS data, where changes in peak pressure are noted 1 minute after the catheter entered the ophthalmic artery, the high-resolution data is marked by increases in peak pressure occurring within 5 seconds (middle graph) and 0.2 seconds (bottom graph) of the triggering event. Conclusion: Although commercially available AIMS, with its longer recording intervals may be sufficient for clinical practice, this is inadequate for research purposes, especially where transient phenomenons need to be analyzed. For researchers using Dräger anesthesia machines, the data acquisition software describes provides a convenient method to collect high-resolution data sufficient for signal processing.
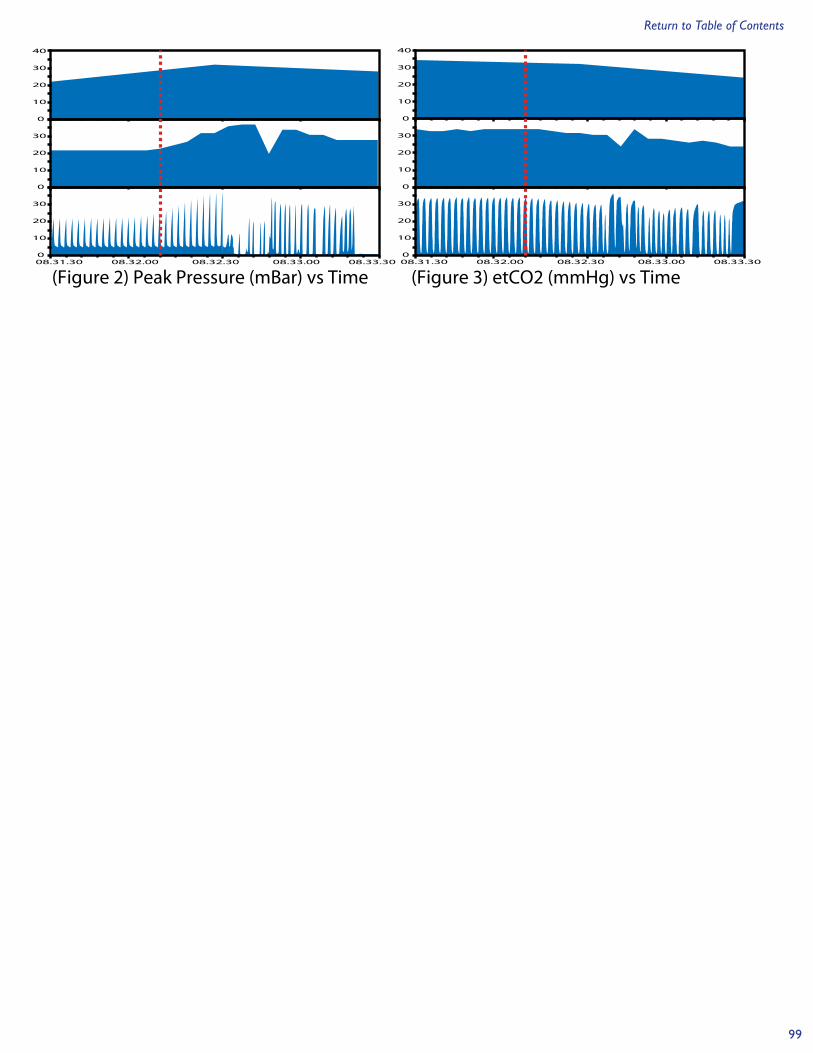
99
Return to Table of Contents
(Figure 2) Peak Pressure (mBar) vs Time (Figure 3) etCO2 (mmHg) vs Time
40
30
20
10
0
30
20
10
0
30
20
10
008.31.30 08.32.30 08.33.3008.32.00 08.33.00
40
30
20
10
0
30
20
10
0
30
20
10
008.31.30 08.32.30 08.33.3008.32.00 08.33.00

100
Return to Table of Contents
Domain Information Model for the Patient Centric Integrated Clinical Environment (ICE DIM)
Presenting Author: Steven Dain MD, FRCPC University of Waterloo Co-Authors: Tracy Rausch, DocBox Inc, Julian M. Goldman MD, Mass. General Hospital/HMS Introduction: Part 1 of ASTM F2761-09 laid out the general requirements for the patient-centric integrated clinical environment (ICE) and ISO/IEEE 11073-10201 described an abstract object-oriented domain information model (11073 DIM) that specifies the structure of exchanged information, as well as the events and services that are supported by each object. However we feel that the 11073 DIM provides a device-centric paradigm, whereas modern highly networked data-rich environments, such as ICE, require standards and technology that can support a device-centric paradigm. Methods: The data interactions of patients and medical devices were analyzed from first principles and a new DIM was created based on the concepts of sensor and actuator “components” interacting with the patient rather than complete (multi-component) devices. The DIM then created additional categories to describe clinical context such as physician actions and observations. This approach facilitates post-coordination of data elements thereby reducing the number of defined data required in a data dictionary. We have developed Medical Device Interface Data Sheets (MDIDS) for most sensors and actuators currently in use which will be published on an open website that manufacturers will be able to easily access. Each term is being rigorously defined, which adds important information to the often limited information that is included in standards, such as ISO 11073 Part 10101. Data centric communications is enabled by the OMG DDS standard in a publish/subscribe environment. (http://portals.omg.org/dds/) Results: We chose the Data-Distribution Service for Real-Time Systems (OMG DDS), an open international middleware standard that implements publish-subscribe communications for real-time and embedded systems. It has the advantages of being a readily available, secured, fault-tolerant protocol. Several companies support the open standard to aid in its deployment. Several new data objects have been added to the DIM in order to support applications (Apps) These applications can be, for example, decision support systems, closed loop controllers, displays that integrate information and provide new information from other sensors, Virtual Medical Devices and Virtual Medical Systems on the communications bus. The complete DIM will be presented at the meeting and will be available at www.openice.info. Conclusion: We feel that this model is easily applied to current and future devices. Communication topology methods considered included wired, wireless, patient centric integrated clinical environments, body area networks, sensor networks, virtual medical device networks, medical device systems and medical device systems of systems interacting with non-medical device networks.

101
Return to Table of Contents
References: ASTM F2761-09 Medical Devices and Medical Systems — Essential safety requirements for equipment comprising the patient-centric integrated clinical environment (ICE) — Part 1: General requirements and conceptual model ISO/IEEE 11073-10201 Health informatics — Point-of-care medical device communication —Part 10201: Domain information model ISO/IEEE 11073 Health informatics — Point-of-care medical device communication — Parts 10101 (Nomenclature) and 10201 (Domain information model)

102
Return to Table of Contents
Domain Information Model for Alarm Systems for the Patient Centric Integrated Clinical Environment (ICE DIM)
Presenting Author: Steven Dain MD, FRCPC University of Waterloo Co-Authors:Tracy Rausch, DocBox Inc, Julian M. Goldman MD, Mass. General Hospital/HMS Introduction: Part 1 of the ASTM standard “Medical Devices and Medical Systems — Essential safety requirements for equipment comprising the patient-centric integrated clinical environment (ICE) (F2761-09) described the general requirements and conceptual model for the patient-centric integrated clinical environment (ICE). We present here a domain information model (DIM) for medical device alarm system nomenclature for reporting and logging that is compliant with IEC 60601-2-8 Medical electrical equipment – Part 1-8: General requirements for basic safety and essential performance – Collateral standard: General requirements, tests and guidance for alarm systems in medical electrical equipment and medical electrical systems, edition 2.1. Methods: IEC 80601-1-8 was reviewed from a clinical and forensic, and patient and device centric perspectives. Through an iterative process, a domain information model was developed that would satisfy the needs of the functions of an ICE. We used terminology and data messages from ISO/IEEE 11073 Health informatics — Point-of-care medical device communication — Part 10101 wherever possible. Results: Several classes were defined to contain the necessary information that needed to be communicated. These include alarm system settings class; alarm system state class; Alarm condition Class; alarm signal class; Alarm Preset Class; auditory alarm signal sound set class. A complete DIM will be available on the poster and at www.openince.info. Conclusion: We feel that this model is easily adapted to all current and future devices. Communication topology methods considered included wired, wireless, patient centric integrated clinical environments, body area networks, sensor networks, virtual medical device networks, medical device systems and medical device systems of systems interacting with non-medical device networks. References: ASTM F2761-09 Medical Devices and Medical Systems — Essential safety requirements for equipment comprising the patient-centric integrated clinical environment (ICE) — Part 1: General requirements and conceptual model ISO/IEEE 11073 Health informatics — Point-of-care medical device communication — Part 10101

103
Return to Table of Contents
Pilot Study: Feasibility of Predictive Analytics for the Early Detection of Hypotensive Events
Presenting Author: Christine Lee, B.S.1
Co-Authors: Maxime Cannesson, MD, PhD1, Feras Hatib, PhD2 1Department of Anesthesiology and Perioperative Care, UC Irvine; 2Edwards Lifesciences, Irvine, CA Background: Patients in high risk settings are often at risk of developing hemodynamic instability. Current methods of identifying such instability rely on the monitoring of invasive and noninvasive hemodynamic parameters that exhibit pronounced changes only when a critical event is already occurring. However, a number of published studies have recently demonstrated that hemodynamic instability can be detected earlier by analyzing the subtle complex changes in multiple hemodynamic variables and their relationships. Methods: The main objective of this preliminary study was to evaluate the feasibility of the early detection of hypotensive events in patients admitted to the ICU. Data used in this study came from the MIMIC II Research Database. From this database, we looked at the arterial pressure waveforms of 14 patients with hypotensive events, and extracted 161 waveform features (Edwards). Hypotensive events were defined as any time periods where 1) SBP < 50 mmHg, and/or 2) MAP drop by 40% from median MAP for at least 10 minutes. This extreme definition was used for training the models with the expectation that all other less extreme hypotensive events would also be detected. After identifying these hypotensive events, each patient’s data was then categorized as hypotensive and nonhypotensive. Hypotensive data was defined as 30 minutes before/after and including a defined hypotensive event. Nonhypotensive data was defined as all remaining data, but resampled to equal the length of hypotensive data. Presented in this abstract are two model building methods: 1) Sequential feature selection and model building using k-nearest neighbors (k=10), and 2) lasso regularization for a generalized linear model using binomial distribution to select significant (p < 0.05) features and model building using logistic regression. Leave-one-out cross validation was performed on all the data of each patient to validate the model. Misclassification rates were defined as the misclassification of defined hypotensive and nonhypotensive data per patient as described above. Results and Conclusion: The overall misclassification rate was 0.38 for the k-nearest neighbors model (38 features) and 0.37 for the logistic regression model (76 features). In Figure 1, we can see that the two models are very sensitive to all drops in blood pressure. Further analysis will need to be performed using other statistical methods, and the definition

104
Return to Table of Contents
of hypotensive events for validation may need to be re-evaluated. In conclusion, these preliminary pilot results show that prediction and detection of hypotensive events is feasible.
Figure 1. Examples of model results. A) k-nearest neighbor B) Logistic regression model. Thick Red/Black lines = start/end event, Red/Blue/Green lines = SBP/MAP/DBP, Thin Black line = posterior probability of hypotensive event (Fig1A) and predicted response (Fig1B). Pink line = True category (0 = nonhypotensive, 1 = hypotensive).
A) B)