st towards consistency in child labour measurement … · towards consistency in child labour ......
TRANSCRIPT

Towards consistency in child labour measurement:
Assessing the comparability of estimates generated by different survey
instruments
L. Guarcello
I. Kovrova
S. Lyon
M. Manacorda
F. C. Rosati
June 2010
Und
erst
andi
ng C
hild
ren’
s W
ork
Pro
gram
me
Wor
king
Pap
er S
erie
s, J
une
2010

Towards consistency in child labour measurement:
Assessing the comparability of estimates generated by different survey instruments
Lorenzo Guarcello*
Irina Kovrova *
Scott Lyon*
Marco Manacorda**
Furio C. Rosati*
Working Paper
June 2010
Understanding Children’s Work (UCW) Programme
Villa Aldobrandini
V. Panisperna 28
00184 Rome
Tel: +39 06.4341.2008
Fax: +39 06.2020.687
Email: [email protected]
As part of broader efforts towards durable solutions to child labor, the International Labour Organization (ILO), the United Nations Children’s Fund (UNICEF), and the World Bank initiated the interagency Understanding Children’s Work (UCW) programme in December 2000. The programme is guided by the Oslo Agenda for Action, which laid out the priorities for the international community in the fight against child labor. Through a variety of data collection, research, and assessment activities, the UCW programme is broadly directed toward improving understanding of child labor, its causes and effects, how it can be measured, and effective policies for addressing it. For further information, see the programme website at www.ucw-project.org.
This paper is part of the research carried out within UCW (Understanding Children's Work), a joint ILO, World Bank and UNICEF programme. The views expressed here are those of the authors' and should not be attributed to the ILO, the World Bank, UNICEF or any of these agencies’ member countries.
Funding for this Country Report was partially provided by the United States Department of Labor under Cooperative Agreement number E-9-K-6-0085.
This Report does not necessarily reflect the views or policies of the United States Department of Labor, nor does the mention of trade names, commercial products, or organizations imply endorsement by the United States Government.
* UCW Programme and University of Rome “Tor Vergata”
** Department of Economics, QMUL Centre for Economic Performance, LSE and CEPR”

Towards consistency in child labour measurement:
Assessing the comparability of estimates generated by different survey instruments
Working Paper
June 2010
ABSTRACT
The study addresses the comparability of child labour estimates produced by different common household survey instruments. This question has important implications for credibility of published estimates of child labour, and for the reliability of current survey instruments as tools for monitoring and guiding efforts towards the progressive elimination of child labour. The study, covering some 87 datasets for 35 countries, first confirms that estimates of child labour vary significantly across different kinds of surveys. The variation, moreover, appears to be substantially larger than that relative to other children’s activities like schooling. The study then addresses whether the observed significant differences in estimates are due to difference in population characteristics or to other features of the surveys. In other words, whether different populations are targeted by the various surveys, or whether they address the same (or very similar) population with different instruments. The empirical results indicate that it is the latter explanation, i.e., differences in survey features are most relevant. Differences in observable survey characteristics such as questionnaire type and fieldwork season explain some of the variation in child labour estimates across survey instruments, but a larger part of the variation stems from unobservable survey characteristics. Elements of the survey process not spelled out in the survey documentation, such as interview methods, the familiarity of interviewers with child labour concepts, the accuracy of data coding and processing, are all likely to be important in this context.

Towards consistency in child labour measurement:
Assessing the comparability of estimates generated by different survey instruments
Working Paper
June 2010
CONTENTS
1. Introduction............................................................................................................................................. 1
2. Data sources and methods .................................................................................................................... 3
3. Survey comparability: an overview ...................................................................................................... 4
4. Sources of differences in child labour estimates................................................................................ 7
5. Comparability of child labour estimates: a more in-depth look ...................................................... 9
5.1 Overall differences in child labour estimates ................................................................... 9
5.2 Differences in child labour estimates across different sub-categories of
children ................................................................................................................................ 11
Student status ............................................................................................................................... 11
Work sector and modality .......................................................................................................... 13
Demographic characteristics ...................................................................................................... 14
5.3 Working hours and child labour estimates ..................................................................... 16
6. Population characteristics and child labour estimates .................................................................... 19
6.1 Propensity scores ................................................................................................................ 19
6.2 Matching estimator ............................................................................................................ 21
7. Survey characteristics and child labour estimates ............................................................................ 24
7.1 Survey questionnaire .......................................................................................................... 24
7.2 Survey questions on child economic activity and the SNA framework .................... 27
7.3 Survey respondent .............................................................................................................. 28
7.4 Seasonality ........................................................................................................................... 30
8. Survey characteristics and child labour estimates: econometric evidence ................................... 33
9. Conclusion ............................................................................................................................................ 44

References ............................................................................................................................................ 46
ANNEX 1. Survey characteristics (Nine sample countries)............................................................... 48
ANNEX 2. Questions relating to children’s work and schooling from common survey instruments........................................................................................................................ 50
ANNEX 3. Detailed comparative tables ............................................................................................... 57
ANNEX 4. Detailed comparative tables for expanded sample of countries .................................. 69


1 UCW WORKING PAPER SERIES, JUNE 2010
1. INTRODUCTION
1. ILO SIMPOC surveys,2 World Bank multi-purpose household surveys,3 CWIQ surveys,4 UNICEF MICS surveys5 are among the most important instruments for generating information on child labour in developing countries. Estimates of child labour incidence generated by these survey instruments are increasingly relied on by countries to monitor progress towards national and global child labour elimination targets.6 Data generated by these surveys also play a key role in guiding policy in the area of child labour. Based on comprehensive interviews with a representative sample of households, they provide information on the nature and some of key characteristics of children’s work, as well as on links between children’s work and a range of household and community variables.
2. The current study looks at the comparability of the child labour estimates derived from these survey instruments, and, more specifically, at the extent to which such estimates differ because of the survey instrument used. These questions have important implications for the credibility of published estimates of child labour, and for the reliability of current survey instruments as tools for monitoring and guiding efforts towards child labour elimination. The study includes a sample of 35 countries (nine of which were selected for an in-depth analysis) where different survey instruments have been implemented during similar reference periods, and builds on previous country-specific survey comparisons conducted in Zambia7 and Bolivia.8 It constitutes part of a broader effort to improve the quality and consistency of child labour data collected by different survey instruments, and to ensure that the scarce research resources for child labour are allocated efficiently.
3. The study responds to concerns about comparability arising from recent child labour survey results in a number of countries. A cursory look at the data available for the same country in the same or nearly the same reference year shows that estimates of children’s work vary considerably across survey. The variation, moreover, appears to be substantially larger than that relating to other children’s activities like schooling.
2 Statistical Information and Monitoring Programme on Child Labour. Since its inception in 1998, more than 250 child labour surveys have been supported, 56 of which were national in scope. An additional 80 baseline surveys and 100 rapid assessments were supported targeting specific groups of child labourers in particular geographical locations. 3 Principally, the Living Standards Measurement Study/Integrated Survey series and the Priority Survey series. 4 Core Welfare Indicator Questionnaire surveys. 5 Multiple Indicator Cluster Surveys. 6 SIMPOC data enabled ILO to publish global and regional child labour estimates for the 2000 and 2004 reference years, and a first-ever analysis of child labour trends for the 2000-2004 period. (The End of Child Labour: Within Reach; Global Report under the follow-up to the ILO Declaration on Fundamental Principles and Rights at Work, International Labour Conference, 95th Session 2006, Report I (B), International Labour Office, Geneva, 2006.) 7 Blunch N.H., Dar A., Guarcello L., Lyon S., Ritualo A.R. and Rosati F.C., Children's Work in Zambia: A Comparative Study of Survey Instruments, UCW Project working paper, September 2002. 8 Guarcello L. and Lyon S., “Child labour in Bolivia: A comparison of estimates from MECOVI and MICS survey instruments”, in Minujin A., Delamonica E., and Komarecki M., Eds., Human Rights and Social Policies for Children and Women: The Multiple Indicator Cluster Survey (MICS) in Practice, New School University and UNICEF, 2005.

2
TOWARDS CONSISTENCY IN CHILD LABOUR MEASUREMENT: ASSESSING THE
COMPARABILITY OF ESTIMATES GENERATED BY DIFFERENT SURVEY INSTRUMENTS
4. In order to begin to understand the reasons for such differences and to assess the comparability of the different surveys instruments we proceed in the following way. Section 2 is devoted to a brief presentation of the datasets and the methodology used. Section 3 provides an overview of survey comparability, and Section 4 an overview of factors affecting comparability: sampling errors, non-sampling errors, and survey and questionnaire design. The discussion of the first factor, sampling errors, is however limited by the lack of necessary information for many of the surveys.
5. Section 5 looks more in depth at the observed differences in estimates of child labour across countries. It tests first whether the observed differences in child labour estimates are in fact statistically significant. It then compares differences in child labour estimates to differences in estimates of involvement in other activities (like schooling), and looks at the main characteristics of such differences. The analysis confirms that estimates of children’s involvement in child labour vary significantly across different types of surveys.
6. The following part of the study is devoted to the analysis of the sources of differences in estimates outlined in section 4. Sections 6 and 7 analyse whether the observed difference in the estimates of child labour for the same country can be due to the difference in the populations represented by samples or to other characteristics of the surveys. In other words, whether different populations are targeted by the various surveys, or whether they address the same (or very similar) population with different instruments. As shown in Section 6, differences in characteristics of populations do not appear to be the origin of difference in child labor estimates. Moreover, the difference do not disappear even when the comparison is done for “similar” children across two surveys.
7. We then turn to look at the role of other survey characteristics, with a special focus on observable sources of errors, such as questionnaire design and the period (season) of survey implementation. Section 7 shows that a set of such elements are likely to influence child labour estimates and discusses their potential role.
8. Finally, we develop an econometric analysis aimed at identifying the impact of the various observable characteristics on the estimates of child labour stemming from the different surveys. This exercise also helps to assess how much of the variation across surveys can be explained by (easily) observable survey differences and how much remains unexplained. The cross-country estimates are also used to generate sets of country level estimates consistent (on the basis of observable characteristics) across countries, thereby offering insight into what can be achieved in terms of consistency across surveys on an ex-post basis.

3 UCW WORKING PAPER SERIES, JUNE 2010
2. DATA SOURCES AND METHODS
9. This study is based on the analysis of data (the list of surveys utilised in the study is provided in Annex 3 and 4) for a number of countries in which several surveys covering child labour have been conducted. The selection of the countries (and data) included in the study was guided by two criteria: first, that the data refer to similar reference years, and second, that the data were generated by survey instruments belonging to one of the main survey programmes described above.
10. We have included most of the countries for which data meeting such criteria were available on the basis of our information. However, new surveys are carried out and new datasets become availably regularly, so we do not claim to have been exhaustive in terms of the surveys included. As a consequence, even if we have attempted to consider a wide geographic representation, the study does not claim to be representative of survey differences at regional or sub-regional level.
11. In order to keep the presentation manageable, part of the more in-depth analysis has been limited to a subset of countries. These countries were selected on the basis of data quality considerations and, especially, on the basis of overlap in the survey reference periods. While extending the analysis to larger subset of countries would be a straightforward exercise, it becomes apparent from our analysis that no substantive changes to our conclusions would be likely by adding a few additional countries.
12. We have focused our analysis on small subset of indicators, again to keep the presentation manageable. For each of the surveys included, we have computed estimates of children’s involvement in economic activity as a proxy for child labour. This offers a homogeneous benchmark, as child labour definitions varies from country to country according to national legislation.
13. Children’s involvement in economic activity is a broad concept covering all market production and certain types of non-market production (principally the production of goods for own use). It includes forms of work in both the formal and informal sectors, as well as forms of work both inside and outside family settings. It is worth noting that children’s involvement in economic activity as defined here does not include children looking for work, nor does it include children performing household chores in their own homes.
14. We have also computed children’s school attendance, where attendance is defined as children currently attending school. For both involvement in economic activity and school attendance, the 10-14 years age group is used because this is the age range for which most observations are available across the various surveys. The main conclusions, however, do not change when broader (5-14 or 7-14 years) age ranges are utilised.

4
TOWARDS CONSISTENCY IN CHILD LABOUR MEASUREMENT: ASSESSING THE
COMPARABILITY OF ESTIMATES GENERATED BY DIFFERENT SURVEY INSTRUMENTS
3. SURVEY COMPARABILITY: AN OVERVIEW
15. A quick overview of survey results in a variety of national contexts reveals frequent variations in child labour estimates derived from different survey instruments, even when these survey instruments are implemented in similar periods (Figure 1). Indeed, differences across surveys in estimates of children’s involvement in economic activity are statistically significant in all nine of the countries considered where two separate surveys were conducted within one year of each other.
Figure 1. Survey comparison: child involvement in economic activity, 10-14 years age group, by survey type, country and year
Notes: (a) MICS2: Multiple Indicator Cluster Survey, second wave; (b) SIMPOC: IPE Statistical Information and Monitoring Programme on Child Labour ; (c): Demographic and Health Survey; (d)
Living Standards Measurement Study Survey; (e): Labor Force Survey ; (f): Core Welfare Indicators Questionnaire Survey; (g): Priority Survey ; (h): Integrated Survey; (i): National Household
Survey ; (j): Household Income and Expenditure Survey; (k) National Household Sample Survey (PNAD).
Source: UCW calculations based on above survey datasets
16. The differences in estimates are often substantial: in Cameroon, for instance, the Multiple Indicator Cluster Survey for the year 2000 yielded a child economic activity estimate of 64 percent while only one year later Priority Survey put child involvement in economic activity at just 16 percent, an implausibly large drop of three quarters. In Senegal, the Demographic and Health Survey for the year 2005 yielded an estimate of child economic activity one third higher than that obtained from the SIMPOC survey despite the fact that the surveys were conducted in the same year. In Sao Tome e Principe, one estimate of child economic activity derived from MICS-2 survey was six times higher than that obtained by a Living Standards Measurement Study Survey, although both again were carried out in the same year.
17. The variations in child labour estimates cast considerable doubt on their reliability as guides for policy and decisions concerning resource allocations. To take another example, child labour in Mali has putatively risen three-fold
2000
2000
2000
2000
2000
2000
2000
2000
2000
20002000
2000
2001 2002
2002
2002/032000 2001
2000
1998/99
2005
1999
2000
2005
2001
2000
20002004
2001
2005
2000/01
1999
2004
2001
2004
20032000
20012005
2000
2000
2001
1998
2004
1999 2003
2005
2005
2002
2003
2003
2006
2001
1998
2004
2003 2002
2003/04
2001
2001
2005
2005
2000
2006
2005/06
2002/032004
2002
200020042003
0
10
20
30
40
50
60
70
80
.
Pan
ama
Egy
pt
Bra
zil
Col
ombi
a
Sao
Tom
e e
…
Hon
dura
s
Mon
golia
Ban
glad
esh
EI S
alva
dor
Nia
cara
gua
Par
agua
y
Dom
enic
an R
ep.
Leso
tho
Ecu
ador
Gha
na
Ken
ya
Bol
ivia
Gua
tem
ala
Sen
egal
Cot
e d'
Ivor
e
Zam
bia
Uga
nda
Cam
eroo
n
Tan
zani
a
Mal
awi
Mal
i
Cam
bodi
a
Bur
kina
Fas
o
Eth
iopi
a
Tog
o
Cha
d
% chidlren in volved in economic activity
MICS2(a)
SIMPOC(b)
DHS(c)
LSMS(d)
LFS(e)
CWIQ(f)
PS(g)
IS1(h)
IS2(h)
LFS2(e)
DHS2( c)
NHS(i)
NHS2(i)
LSMS2(d)
HIES(j)
PNAD1(k)
PNAD2(k)

5 UCW WORKING PAPER SERIES, JUNE 2010
over a four-year period, from 28 percent (DHS) to over 75 percent (SIMPOC survey), suggesting an urgent policy response is needed. But if this rise were in fact only a reflection of measurement error, such a response would risk a misallocation of resources and a distorting of development priorities.
18. In countries like Lesotho, the risk lies in the opposite direction. If survey results are taken at face value there, child labour has fallen from 34 percent to under four percent, and the country is therefore firmly on track for child labour elimination. But, again, if these results are largely a reflection of measurement error, they may lead to an under-investment in child labour elimination efforts. In sum, differences in survey estimates of child labour are not merely of academic interest, but rather can be an important constraint to efforts towards child labour elimination.
Figure 2. Survey comparison: school attendance rates, 10-14 years age group, by survey type, country and year
0
10
20
30
40
50
60
70
80
90
100
.
Bra
zil
Do
men
ican
Re
pub
lic
Pa
nam
a
Ug
and
a
Par
agu
ay
Bo
livia
Co
lom
bia
Ecu
ador
Mo
ngol
ia
Ca
mbo
dia
Eg
ypt
EI S
alva
dor
Les
oth
o
Ma
law
i
Gh
ana
Cam
eroo
n
Hon
dura
s
Nia
cara
gu
a
Ke
nya
Sao
Tom
e e
Pri
ncip
e
Zam
bia
Tog
o
Ban
glad
esh
Tan
zan
ia
Gu
atem
ala
Co
te d
'Ivor
e
Sen
ega
l
Ch
ad
Eth
iop
ia
Mal
i
Bur
kin
a F
aso
% chidlren attending school
MICS2(a)
SIMPOC(b)
DHS(c)
LSMS(d)
LFS(e)
CWIQ(f)
PS(g)
IS1 (h)
IS2(h)
LFS2(e)
DHS2(c)
NHS(i)
NHS2(i)
LSMS2(d)
HIES(j)
PNAD1(k)
PNAD2(k)
Notes: See Figure 1.
Source: UCW calculations based on above survey datasets
19. Differences in survey-generated estimates of school attendance, by contrast, are much smaller, and where differences occur across reference periods, they typically show a rise in attendance, consistent with global trends (Figure 2).9 With few exceptions, these findings are in general consistent with trends shown by other data from national education information systems.
20. The consistency of school attendance estimates suggests that the survey instruments for measuring children’s time use are not generally flawed, but rather that there are specific problems in the way that different surveys measure children’s involvement in economic activity. There appear to be important underlying methodological inconsistencies in the survey 9 The rise in school attendance in Cameroon is implausibly large, hinting at problems in the measurement of both economic activity and school attendance in this country.

6
TOWARDS CONSISTENCY IN CHILD LABOUR MEASUREMENT: ASSESSING THE
COMPARABILITY OF ESTIMATES GENERATED BY DIFFERENT SURVEY INSTRUMENTS
instruments around the measurement of children’s economic activities that need to be understood and accounted for in the design of future surveys and in assessing current estimates. The following sections assess in a more formally the significance and the characteristics of the differences in the estimates of children’s economic activity and school.

7 UCW WORKING PAPER SERIES, JUNE 2010
4. SOURCES OF DIFFERENCES IN CHILD LABOUR ESTIMATES
21. What could potentially explain the large differences across estimates of children’s involvement in economic activity that we have just outlined? The present study looks at the following factors as a framework for analysing possible sources of difference in estimates across country: (1) sampling error; (2) non-sampling error; and (3) survey and questionnaire design.
22. Sampling errors and design effects. Sampling errors can be measured statistically, for instance, in terms of the standard errors of statistics. In the case of a simple random sample, the evaluation of sampling errors is hence straightforward. However, most surveys have a more complex sample structure as a result of a multi-stage sample design in which sample units are not randomly distributed over space, but rather geographically grouped. The effect of sampling on the variance of an estimate can be then measured by the so-called “design effect.”10
23. The design effect is defined as the ratio of the variance of an estimate to the variance that it would have under simple random sampling. Design effects should be assessed for every survey and used in order to adjust inferences to the complex sample structure. Design effects may substantially vary among types of variables and subgroups within each survey, and of course among surveys. 24. Some standard surveys such as DHS and MICS provide design effects, however there is no common tradition to compute it as an output for surveys in developing countries. Indeed, information about sample design characteristics (stratification, clustering) required to compute design effects are not available for many of the surveys included in this study. The study, therefore, does not apply any correction for the multistage sample design, meaning that obtained inferences should be interpreted with caution. We argue however that the differences among estimates of children’s economic activity remain significant even considering the sample design effects.
25. Non-sampling errors. Non-sampling errors can arise from diverse causes such as mistakes made during data collection and data processing, misunderstanding of the question by respondent and/or interviewer, quality of interviewer training and data entry errors Usually, non-sampling errors are divided into two main categories – non-observation and measurement errors. Non-observation errors arise from failing to interview the correct household or individual, for example, in the case of non-response or non-coverage. Measurement errors arise from failure to survey what the survey intended to measure, for example, because of questionnaire wording, question order, question response, interviewer, timing, etc. Non-sampling errors are very difficult to avoid as well as to evaluate statistically.
26. The current study analyses if different surveys for each country represent two different populations, for example due to the unequal proportion of households with given socio-demographic characteristic or even due to non-coverage of some specific region by one of the surveys.
10 As suggested by L. Kish in 1965.

8
TOWARDS CONSISTENCY IN CHILD LABOUR MEASUREMENT: ASSESSING THE
COMPARABILITY OF ESTIMATES GENERATED BY DIFFERENT SURVEY INSTRUMENTS
27. Survey and questionnaire design. Although some differences in survey characteristics (e.g., questionnaire structure, period of field work, survey respondent, etc.) might technically be considered as sources of non-sampling errors, we discuss them separately in this report. These differences in survey characteristics are not strictly speaking errors in and of themselves and are relatively easier to identify than other sources of non-sampling errors.
28. The issue of seasonality is potentially particularly important in influencing child labour estimates. Child labour (differently from school attendance or enrolment) is intrinsically a volatile phenomenon that can vary considerably by season (for example, depending on whether the schools are open, the harvest season, etc.). We will try to see if seasonality as well as other observable survey characteristics play a role in explaining differences across surveys. The harmonization of these survey characteristics and/or due consideration to their differences can in principle lead to improve comparability of estimates of children’s involvement in economic activities.

9
5. COMPARABILITY OF CHIDEPTH LOOK
29. This section looks in more depth at the comparability of child labour and schooling estimates in nine of the countries where surveys were conducted during the same or similar reference years (i.e. Cameroon, Senegal, Bolivia, Sao Tome e Principe, Ghana, Lesotho, where longitudinal changes can therefore be largely excluded as an explanation for the differing estimates. Results from the other surveys analysed in this study (see annex 4 for details) are similar, but may be biased by the length of the time span between the comparator surveys.
5.1 Overall differences in child labour estimates
30. In all nine countries, differences in estimates of children’s involvement in economic activity are statistically significant. As reported in the previsection, the present study does not apply any correction for the design effect. Pettersson et al. (2005) computed the design effect for 11 household surveys from seven developing countries. They showed that the values of the design effect calculated foto six.11 In the present study, the level of significance of the differences in the estimates of children’s involvement in economic activity is too high to be eliminated even adjusting for the highesPettersson et al.
31. In order to test the equality of the means of the child labour indicators and school attendance rates obtained from two different surveys for each country, we use the following OLS regression with a variable:
where y is an indicator of children’s activity i (i = participation in economic activity and school attendance, in our case),
is an estimate of the difference between the mean of the given indicator in the two surveys.12
32. For children’s economic activity, the magnitude of the differences in estimates is generally very large (see Table 1): in all but one of the nine countries (the exception is Brazil, where the data come from different waves of the same survey, PNAD), one survey yielded at least a oneestimate of children’s economic activity than the other; in four of the nine surveys, one survey estimate was more than
11 For example, a design effect of 6 if the survey were based on a simple random sampling procedure.12 We do not use the t-test (that is the equivalent way to test the equality of mean) because of the Stata routine which does not allow weights for the t
UCW WORKING PAPER SERIES
COMPARABILITY OF CHILD LABOUR ESTIMATES: A MORE INDEPTH LOOK
ection looks in more depth at the comparability of child labour and schooling estimates in nine of the countries where surveys were conducted during the same or similar reference years (i.e. Cameroon, Senegal, Bolivia, Sao Tome e Principe, Ghana, Lesotho, Brazil, Kenya, Bangladesh), and where longitudinal changes can therefore be largely excluded as an explanation for the differing estimates. Results from the other surveys analysed in this study (see annex 4 for details) are similar, but may be biased
e length of the time span between the comparator surveys.
Overall differences in child labour estimates
In all nine countries, differences in estimates of children’s involvement in economic activity are statistically significant. As reported in the previsection, the present study does not apply any correction for the design effect. Pettersson et al. (2005) computed the design effect for 11 household surveys from seven developing countries. They showed that the values of the design effect calculated for the 11 selected household surveys were in the range two
In the present study, the level of significance of the differences in the estimates of children’s involvement in economic activity is too high to be eliminated even adjusting for the highest value of design effect calculated by
In order to test the equality of the means of the child labour indicators and school attendance rates obtained from two different surveys for each country, we use the following OLS regression with a binary dummy
where y is an indicator of children’s activity i (i = participation in economic activity and school attendance, in our case), is survey dummy variable. The estimate of
is an estimate of the difference between the mean of the given indicator in the
For children’s economic activity, the magnitude of the differences in estimates is generally very large (see Table 1): in all but one of the nine
exception is Brazil, where the data come from different waves of the same survey, PNAD), one survey yielded at least a oneestimate of children’s economic activity than the other; in four of the nine surveys, one survey estimate was more than three times higher than the
For example, a design effect of 6 indicates that the sample variance is six times bigger than it would be if the survey were based on a simple random sampling procedure.
test (that is the equivalent way to test the equality of mean) because of the Stata routine which does not allow weights for the t-test
WORKING PAPER SERIES, JUNE 2010
A MORE IN-
ection looks in more depth at the comparability of child labour and schooling estimates in nine of the countries where surveys were conducted during the same or similar reference years (i.e. Cameroon, Senegal, Bolivia,
Brazil, Kenya, Bangladesh), and where longitudinal changes can therefore be largely excluded as an explanation for the differing estimates. Results from the other surveys analysed in this study (see annex 4 for details) are similar, but may be biased
e length of the time span between the comparator surveys.
In all nine countries, differences in estimates of children’s involvement in economic activity are statistically significant. As reported in the previous section, the present study does not apply any correction for the design effect. Pettersson et al. (2005) computed the design effect for 11 household surveys from seven developing countries. They showed that the values of the design
r the 11 selected household surveys were in the range two In the present study, the level of significance of the differences in
the estimates of children’s involvement in economic activity is too high to be t value of design effect calculated by
In order to test the equality of the means of the child labour indicators and school attendance rates obtained from two different surveys for each
binary dummy
where y is an indicator of children’s activity i (i = participation in economic activity is survey dummy variable. The estimate of
is an estimate of the difference between the mean of the given indicator in the
For children’s economic activity, the magnitude of the differences in estimates is generally very large (see Table 1): in all but one of the nine
exception is Brazil, where the data come from different waves of the same survey, PNAD), one survey yielded at least a one-third higher estimate of children’s economic activity than the other; in four of the nine
three times higher than the
s six times bigger than it would be
test (that is the equivalent way to test the equality of mean) because of the Stata

10
TOWARDS CONSISTENCY IN CHILD LABOUR MEASUREMENT: ASSESSING THE
COMPARABILITY OF ESTIMATES GENERATED BY DIFFERENT SURVEY INSTRUMENTS
other, again despite similar reference periods. All these differences are not only large, but also statistically significant.
33. Table 1 also shows the results of the same analysis for school attendance. As mentioned, the differences in the estimates across surveys are much smaller in size than those observed for children’s economic, although most of them are also statistically significant.
Table 1. Children’s involvement in economic activity and schooling, 10-14 years age range, by survey type, selected countries
Country Survey Children in economic activity Children attending school
Bangladesh
DHS, 2004 11.2 75.8
SIMPOC, 2002/03 26.1 82.7
absolute difference 14.9***
[0.43]
6.9***
[0.46]
Bolivia
MICS2, 2000 32.0 93.3
LSMS, 2000 22.9 90.7
absolute difference 9.1***
[1.2]
2.6***
[0.76]
Brazil
PNAD, 2003 10.4 97.1
PNAD, 2004 10.1 96.8
Difference 0.3
[0.22]
0.3***
[0.13]
Cameroon
MICS2, 2000 64.3 82.7
PS, 2001 16.0 84.7
absolute difference 48.3***
[0.81]
2.0***
[0.70]
Ghana
SIMPOC, 2000 34.2 82.3
CWIQ, 2003 7.7 85.5
absolute difference 26.5***
[0.42]
3.2***
[0.39]
Kenya
MICS2, 2000 44.0 87.6
SIMPOC, 1998/99 8.0 74.3
Difference 36.0***
[0.65]
13.3***
[0.63]
Lesotho
MICS2, 2000 34.4 86.0
CWIQ, 2002 3.5 88.1
absolute difference 30.9***
[0.79]
2.1***
[0.76]
Sao Tome e Principe
MICS2, 2000 19.7 80.1
LSMS, 2000 3.0 81.4
Difference 16.7***
[1.05]
1.3
[1.33]
Senegal
DHS, 2005 35.2 58.0
SIMPOC, 2005 22.3 61.8
Difference 12.9***
[0.77]
3.8***
[0.83]
Notes: ***statistically significant at 1% level, **statistically significant at 5% level, *statistically significant at 10% level. Standard errors are in parentheses.

11 UCW WORKING PAPER SERIES, JUNE 2010
5.2 Differences in child labour estimates across different sub-categories of children
34. One initial question arising when attempting to understand these differences is whether they are consistent across all sub-categories of child workers, or are concentrated in certain groups of working children. It may be that some surveys are more effective in capturing the child labour population in all its various dimensions while others systematically exclude certain sub-groups of working children. Certain categories of children’s work might be more difficult to capture and, hence, the estimates of their size more likely to be influenced by the way the surveys are designed or implemented.
35. Student and non-student working children are two especially important sub-categories of the child labour population. Some children combine their work responsibilities with schooling while others only work, and it is the latter group that is frequently most disadvantaged, denied the possibility of acquiring the human capital necessary for more gainful employment in the future. Work type (i.e., different economic sectors and work modalities) and demographic profile (i.e., sex, age and place of residence) are other important categorizations of the working children population. Differences in estimates for each of these sub-categories are looked at briefly below.
Student status
36. Disaggregating the estimates of children in economic activity into students and non-students shows that it is the first group, i.e., working students, that accounts for most of the overall differences in child labour estimates both in absolute and relative terms (See Table 2). In Bolivia, the higher overall estimate of child economic activity yielded by the MICS2 instrument is accounted for entirely by this group; indeed, MISC2 yielded a lower estimate of the percentage of children working only. In Cameroon, the large difference in estimates of child labour generated by the MICS2 and PS surveys is largely due to the fact that the latter survey failed to capture children working and attending school. Similarly, in Ghana, Lesotho and Sao Tome e Principe, one of two comparator surveys largely excludes the category of working children also attending school. In all nine countries, differences in estimates working students are much larger than differences in estimates of non-working students, in both absolute and proportionate terms.

12
TOWARDS CONSISTENCY IN CHILD LABOUR MEASUREMENT: ASSESSING THE
COMPARABILITY OF ESTIMATES GENERATED BY DIFFERENT SURVEY INSTRUMENTS
Table 2. Children’s involvement in economic activity and schooling, 10-14 years age range, by survey type, selected countries
Country Survey In economic activity, not
attending school
In economic activity and
attending school
In school, not in
economic activity
Not in economic activity, not
attending school
Bangladesh
DHS, 2004 9.6 1.7 74.2 14.6
SIMPOC, 2002/03 14.1 12.0 70.7 3.2
Difference 4.5***
[0.37]
10.3***
[0.28]
3.4***
[0.51]
11.4***
[0.32]
Bolivia
MICS2, 2000 3.9 28.1 65.2 2.8
LSMS, 2000 5.4 17.5 73.2 3.9
Difference 1.5**
[0.59]
10.6***
[1.16]
8.0***
[1.29]
1.1**
[0.50]
Brazil
PNAD, 2003 0.6 9.7 87.4 2.2
PNAD, 2004 0.8 9.3 87.5 2.4
Difference 0.2**
[0.61]
0.4**
[0.22]
0.1
[0.24]
0.2*
[0.11]
Cameroon
MICS2, 2000 11.4 52.9 29.8 5.9
PS, 2001 8.4 7.6 77.1 7.0
Difference 3.0***
[0.56]
45.3***
[0.76]
47.3***
[0.83]
1.1**
[0.46]
Ghana
SIMPOC, 2000 11.7 22.5 59.7 6.0
CWIQ, 2003 5.5 2.2 83.3 9.0
Difference 6.2***
[0.30]
20.3***
[0.34]
23.6***
[0.47] 3.0***
[0.28]
Kenya
MICS2, 2000 5.7 38.3 49.3 6.8
SIMPOC, 1998/99 3.7 4.3 70.0 22.0
Difference 2.0***
[0.34]
34.0***
[0.61]
20.7***
[0.78]
15.2***
[0.56]
Lesotho
MICS2, 2000 7.0 27.3 58.7 7.0
CWIQ, 2002 2.6 0.9 87.2 9.3
Difference 4.4***
[0.48]
26.4***
[0.71]
28.5***
[0.94]
2.3***
[0.62]
Sao Tome e Principe
MICS2, 2000 4.4 15.3 64.8 15.5
LSMS, 2000 2.7 0.3 81.1 15.9
Difference 1.7***
[0.63]
15.0***
[0.89]
16.3***
[1.48]
0.4
[1.23]
Senegal
DHS, 2005 17.6 17.6 40.6 24.2
SIMPOC, 2005 13.7 8.6 53.2 24.6
Difference 3.9***
[0.63]
9.0***
[0.58]
12.6***
[0.85]
0.4
[0.74]
Notes: ***statistically significant at 1% level, **statistically significant at 5% level, *statistically significant at 10% level. Standard errors are in parentheses.
37. What does this mean from a survey design perspective? It suggests that some survey instruments are more effective in capturing the interaction between work and school, while others treat work and schooling more as mutually exclusive activity categories, not recording (or under-reporting) the fact that many students are working too. In general, it appears that the MICS2 instrument is rather effective in capturing this interaction between work and school and that the CWIQ instrument is least effective in this regard, while the degree to which SIMPOC and LSMS instruments pick up this group of working students varies from survey to survey. But such

13 UCW WORKING PAPER SERIES, JUNE 2010
generalised conclusions should obviously be interpreted with caution, owing to the limited number of surveys included in this analysis.
Work sector and modality
38. Overall differences in estimates in child labour estimates might reflect the fact that some survey instruments are less effective in capturing participation to some sectors of activity or certain work modalities. Comparing estimates of children working in different economic sectors and work modalities is complicated by the fact that the collection of this information differs across survey instruments. The MICS2 surveys, for example, do not contain information on modalities of employment, self-employment or sector of employment, and, unlike the other instruments, collect information on unpaid work within the family.
39. The results presented in Table 3 indicate that estimates are consistent across surveys only for one specific type of economic activity – wage employment. The differences across surveys for the estimates of children working for a wage are small and often also not statistically significant (Table 4). For employment in other modalities the differences in estimates are large. As it will become apparent following the more detailed discussion in the next sections, this is not surprising, as wage employment is a modality of work that is clearly defined and easy to capture.
Table 3. Children’s involvement in different modalities of economic activity, 10-14 years age group
Country Surveys
As % of all
10-14 year-olds
As % of 10-14 year-olds
in economic activity
Self-employed
Unpaid family workers(a)
Employee/wage/
paid
Other Self-employed
Unpaid family workers(a)
Employee/wage/
paid
Other
Bolivia LSMS,2000 0.9 19.9 2.1 - 3.8 87.0 9.2 -
MICS2, 2000 - 27.2 3.5 1.3 - 85.1 10.9 4.0
Brazil PNAD, 2003 0.8 0.6 1.6 7.3 8.2 6.5 16.7 68.6
PNAD, 2004 0.7 5.7 2.4 1.3 7.3 61.3 25.5 5.9
Cameroon PS, 2001 1.1 0.2 0.1 14.5 6.6 1.4 0.6 91.4
MICS2, 2000 - 41.0 3.0 0.0 - 61.4 4.6 34.0
Ghana SIMPOC, 2000 2.7 30.1 0.9 0.5 8.0 87.8 2.8 1.4
CWIQ, 2003 0.9 5.8 0.5 0.4 11.9 76.4 6.0 5.7
Kenya
SIMPOC, 1998/99
0.0 6.5 1.3 0.0 0.5 81.3 16.7 1.5
MICS2, 2000 - 42.0 - - 95.5 -
Lesotho CWIQ, 2002 0.1 2.1 1.3 - 3.0 58.8 38.1 -
MICS2,2000 - 21.8 1.1 3.4 - 83.0 4.2 12.8
Sao Tome e Principe
LSMS, 2000 0.1 1.1 1.3 0.5 2.1 37.0 43.0 17.9
MICS2, 2000 - 15.6 1.4 2.6 - 79.3 7.3 13.4
Senegal DHS, 2000 - 26.3 2.1 5.1 - 78.6 6.3 15.1
SIMPOC, 2001 1.5 18.0 1.2 1.5 6.6 81.0 5.5 6.9
(a) MICS includes family workers and unpaid (family and non-family) workers

14
TOWARDS CONSISTENCY IN CHILD LABOUR MEASUREMENT: ASSESSING THE
COMPARABILITY OF ESTIMATES GENERATED BY DIFFERENT SURVEY INSTRUMENTS
Table 4. Children’s involvement in different modalities of economic activity, as percentage of all children in 10-14 years age group
Country Surveys As % of all 10-14 year-olds
Employee/wage/paid
Bolivia
LSMS,2000 2.1
MICS2, 2000 3.5
Difference 1.4***
[0.46]
Brazil
PNAD, 2003 1.6
PNAD, 2004 2.4
Difference 0.8***
[0.10]
Cameroon
PS, 2001 0.1
MICS2, 2000 3.0
Difference 2.9***
[0.23]
Ghana
SIMPOC, 2000 0.9
CWIQ, 2003 0.4
Difference 0.5***
[0.90]
Lesotho
CWIQ, 2002 1.3
MICS2,2000 1.1
Difference 0.2
[0.25]
Sao Tome e Principe
LSMS, 2000 1.3
MICS2, 2000 1.4
Difference 0.1
[0.39]
Senegal
DHS, 2000 2.1
SIMPOC, 2001 1.2
Difference 0.9***
[0.22]
Notes: ***statistically significant at 1% level, **statistically significant at 5% level, *statistically significant at 10% level. Standard errors are in parentheses.
Demographic characteristics
40. A third possibility is that surveys differ in terms of their ability to capture working children falling into certain specific demographic categories (i.e., age, sex and place of residence). While Table 5 indicates that differences in estimates of children’s economic activity by demographic category exist in many of the countries, the table shows no clear overall patterns in this regard.
41. Differences in the estimates of children in economic activity extend across all age groups, although in some countries (e.g., Ghana, Kenya and Lesotho) the magnitude of the difference rises with age.
42. Differences in estimates of children in economic activity by sex appear especially important in Bangladesh, Lesotho, Cameroon and Senegal. In the first three countries the comparator survey instruments differ more in their reporting of boys in economic activity, while in the fourth country

15 UCW WORKING PAPER SERIES, JUNE 2010
differences are larger in estimates of girls in economic activity. This might be a reflection of differences in the effectiveness of survey instruments in capturing the types of work commonly performed by girls and boys, rather than in their ability to measure boys’ and girls’ involvement in work per se.
43. Place of residence appears to be an important factor in explaining differences in estimates in a number of the countries. Estimates of rural working children vary more than estimates of urban working children in all countries except Senegal. But again, this might mask differences in the types of work performed in the areas of residence, rather than the different ability of the survey instruments to capture involvement of children in work by area of residence.
Table 5. Children’s involvement in economic activity, by survey instrument, age, sex and residence, selected countries
Country Surveys
Percentage difference in estimates
Age in years Sex(a) Residence(a)
5 6 7 8 9 10 11 12 13 14 Male Female Urban Rural
Bangladesh
DHS, 2004 - - - 1.2 1.9 4.9 6.9 11.8 13.4 20.0 13.3 3.6 11.4 7.7
SIMPOC, 2002/03
0.8 0.8 1.0 2.2 3.6 7.7 9.6 34.3 37.9 42.2 26.9 11.3 15.9 20.4
Difference 1.0***
[0.32]
1.7***
[0.44]
2.8***
[0.56]
2.7***
[0.81]
22.5***
[0.93]
24.5***
[1.16]
22.2***
[1.16]
13.6***
[0.53]
7.7***
[0.36]
4.5***
[0.57]
12.7***
[0.40]
Bolivia
LSMS,2000 - - 10.9 12.1 15.5 15.7 18.1 24.4 26.2 31.8 20.4 18.0 7.0 37.8
MICS2, 2000 10.1 10.4 19.1 20.3 23.9 27.2 26.9 34.1 34.0 38.8 30.2 25.1 11.4 51.1
Difference
8.2***
[2.18]
8.2***
[2.24]
8.4***
[2.50]
11.5***
[2.37]
8.8***
[2.65]
9.7***
[2.84]
7.8***
[2.92]
7.0**
[3.10]
9.8***
[1.34]
7.1***
[1.28]
4.4***
[0.87]
13.4***
[1.59]
Brazil
PNAD, 2003 0.3 0.8 1.0 1.8 2.4 5.6 7.5 9.4 12.9 16.2 7.8 3.8 3.3 16.8
PNAD, 2004 0.4 0.8 1.1 2.1 2.8 5.0 7.2 9.1 12.5 16.7 7.7 3.7 3.0 16.4
Difference 0.2*
[0.10]
0.0
[0.14]
0.1
[0.17]
0.3
[0.22]
0.4
[0.26]
0.5
[0.36]
0.3
[0.43]
0.3
[0.48]
0.4
[0.55]
0.4
[0.61]
0.1
[0.19]
0.1
[0.14]
0.3***
[0.10]
0.4
[0.46]
Cameroon
PS, 2001 - - - - - 15.6 12.5 18.4 14.9 17.6 14.4 17.4 22.2 3.5
MICS2, 2000 22.6 32.1 43.5 52.2 58.2 59.9 66.7 64.0 66.8 65.3 66.8 61.6 49.1 72.3
Difference
44.3***
[1.79]
54.2***
[1.78]
45.6***
[1.78]
51.9***
[1.80]
47.7***
[1.90]
52.4***
[1.11]
44.2***
[1.17]
26.9***
[1.19]
68.8***
[1.14]
Ghana
SIMPOC, 2000 4.2 10.2 15.7 19.5 23.8 30.4 32.4 35.6 35.9 37.7 24.5 24.0 10.6 32.1
CWIQ, 2003 0.9 1.8 2.3 3.5 4.1 6.3 5.5 7.5 8.9 10.1 5.0 4.9 1.9 6.8
Difference 3.3***
[0.34]
8.4***
[0.53]
13.4***
[0.65]
16.0***
[0.72]
19.7***
[0.81]
24.1***
[0.83]
26.9***
[1.02]
28.1***
[0.84]
27.0***
[1.00]
27.6***
[1.04]
19.5***
[0.35]
19.1***
[0.36]
8.7***
[0.32]
25.3***
[0.34]
Kenya
SIMPOC, 1998/99 3.4 3.9 3.7 5.2 4.8 6.6 5.9 7.4 8.0 11.9 6.4 5.9 - -
MICS2, 2000 10.1 14.7 20.9 28.8 32.8 38.0 38.2 43.8 49.2 50.6 34.7 30.4 5.3 38.1
Difference 6.7***
[1.00]
10.8***
[1.03]
17.2***
[1.17]
23.6***
[1.24]
28.0***
[1.37]
31.4***
[1.30]
32.3***
[1.61]
36.4***
[1.35]
41.2***
[1.55]
38.7***
[1.52]
28.3***
[0.61]
24.5***
[0.61] - -
Lesotho
CWIQ, 2002 0.3 0.6 0.9 0.7 1.4 2.5 1.8 1.8 6.0 4.9 3.4 1.1 0.8 2.6
MICS2,2000 14.2 16.7 22.0 22.1 27.0 30.5 32.0 35.3 35.8 38.2 31.3 25.0 23.2 29.3
Difference 13.9***
[1.40]
16.1***
[1.34]
21.1***
[1.58]
21.4***
[1.60]
25.6***
[1.73]
28.0***
[1.74]
30.2***
[1.82]
33.5***
[1.68]
29.8***
[1.89]
33.3***
[1.76]
27.9***
[0.81]
23.9***
[0.71]
22.4***
[1.05]
26.7***
[0.62]
Sao Tome e Principe
LSMS, 2000 - - - - - 0.3 1.1 2.0 4.7 7.2 4.6 1.2 2.6 3.5
MICS2, 2000 8.1 7.8 9.7 13.9 15.5 14.1 19.7 20.9 21.7 23.5 22.5 16.7 16.5 22.5
Difference 13.8*** 18.6*** 18.9*** 17.0*** 16.3*** 17.9*** 15.5*** 13.9*** 19.0***

16
TOWARDS CONSISTENCY IN CHILD LABOUR MEASUREMENT: ASSESSING THE
COMPARABILITY OF ESTIMATES GENERATED BY DIFFERENT SURVEY INSTRUMENTS
Table 5. Children’s involvement in economic activity, by survey instrument, age, sex and residence, selected countries
Country Surveys
Percentage difference in estimates
Age in years Sex(a) Residence(a)
5 6 7 8 9 10 11 12 13 14 Male Female Urban Rural
[1.8] [2.36] [2.28] [2.61] [2.71] [1.57] [1.36] [1.31] [1.67]
Senegal
DHS, 2000 17.4 23.1 25.8 28.8 32.8 32.0 34.4 36.6 35.6 38.1 33.4 26.7 24.7 33.3
SIMPOC, 2001 3.2 6.6 9.9 13.9 16.2 19.7 19.6 23.3 24.6 24.1 20.4 10.6 5.1 21.0
Difference 14.2***
[1.06]
16.5***
[1.27]
15.9***
[1.29]
14.9***
[1.41]
16.6***
[1.71]
12.3***
[1.54]
14.8***
[1.91]
13.3***
[1.64]
11.0***
[1.73]
14.0***
[1.90]
13.0***
[0.73]
16.1***
[0.64]
19.6***
[0.71]
12.3***
[0.64]
Notes: ***statistically significant at 1% level, **statistically significant at 5% level, *statistically significant at 10% level. Standard errors are in parentheses.
(a) Average estimations refer to the 5-14 year-olds group, with the exceptions of Bangladesh (8-14 year-olds), Bolivia (7-14 year-olds), Cameroon and Sao Tome e Principe (10-14
year-olds).
5.3 Working hours and child labour estimates
44. Estimates of the average time children actually spend performing economic activity also differ across surveys (for details refer to the table in the Appendix). These differences are likely a product of many of the same factors discussed previously, and therefore are not analysed in further detail here.
45. It is, however, worth investigating the possibility of a systematic relationship between estimates of average working hours, on one hand, and estimates of the rate of participation in economic activity, on the other. If a survey, for whatever reason, is more able to capture a relatively rare phenomenon like children’s economic activity, it might be capturing marginal workers (i.e. children working few hours). In other words, due to the questionnaire or other elements, some surveys might capture children working even for few hours per week, while other surveys capture only those employed for more hours. If this is true, than we should observe a negative relationship between participation rates and average working hours across different surveys.
46. Table 6 presents estimates of the participation rate for different thresholds of working hours. The sample of surveys considered in the table is too small to draw any clear conclusion, but the table indicates that differences in participation rates do vary substantially with the hour threshold considered, and that differences tend to get smaller as the threshold increases.

17 UCW WORKING PAPER SERIES, JUNE 2010
Table 6. Economic activity rate, 10-14 years age range, by work intensity, by survey type, selected countries(1)
Country Survey Children in economic
activity
Percentage of children in
economic activity working at
least 7 hours per week
Percentage of children in
economic activity working at
least 14 hours per week
Percentage of children in
economic activity working at
least 21 hours per week
Bolivia
MICS2, 2000 32.0 25.0 17.6 7.8
LSMS, 2000 22.9 21.2 15.7 12.6
Difference 9.1 3.8 1.9 4.8
Brazil
PNAD, 2003 10.4 9.3 7.1 3.5
PNAD, 2004 10.1 9.0 7.5 3.4
Difference 0.3 0.3 0.4 0.1
Cameroon
MICS2, 2000 64.3 52.0 41.3 30.9
PS, 2001 16.0 14.1 11.2 9.0
Difference 48.3 37.9 30.1 21.9
Kenya
MICS2, 2000 44.0 23.6 12.0 5.9
SIMPOC, 1998/99 8.0 7.7 7.0 5.9
Difference 36.0 15.9 5.0 0.0
Senegal
DHS, 2005 35.2 4.8 1.9 1.3
SIMPOC, 2005 22.3 17.8 14.4 12.1
Difference 12.9 13.0 12.5 10.8
Notes: (1) Only countries for which both surveys have information about working hours have been included; Source: UCW calculations based on above survey datasets
47. Extending the analysis to whole sample of 35 countries that we consider in this study, we observe (Figure 3) a weak negative relationship between children’s economic activity rate and weekly working hours. The correlation coefficient is negative (-0.15) but is not statistically significant.
Figure 3. Average rate of involvement in economic activity and average weekly working hours, 10- 14 years age group
Source: UCW calculations based on various surveys (for details see Annex.4)
48. However, utilising surveys from different countries might make it difficult to identify any relationship due to the differences in hours worked across countries. We have hence run a simple regression of average children’s participation rate on average working hours controlling for country differences. As Table 7 indicates, once we control for country
y = -0.34x + 34.45
0
10
20
30
40
50
60
70
80
90
0 10 20 30 40 50 60
average employment rate
average weekly working hours

18
TOWARDS CONSISTENCY IN CHILD LABOUR MEASUREMENT: ASSESSING THE
COMPARABILITY OF ESTIMATES GENERATED BY DIFFERENT SURVEY INSTRUMENTS
differences, a clear negative relationship between children’s working hours and children’s level of involvement in work emerges. This negative relationship is of non-negligible size: an increase in average working hours by one hour a day is associated with a reduction of four percentage points in the estimated participation rate.
Table 7. Participation rate and working hours (dependent variable: average participation rate)
Variable Coeff. Z
average weekly working hours -0.55 -2.54**
const 35.71 2.84***
Notes: (a) Country dummies: Yes; (b) Number of observations: 72
Source: UCW calculations based on various surveys (for details see Annex 4)
49. The results illustrated in this section are consistent with the hypothesis that some surveys are indeed capable of capturing “marginal” workers better than others. We now turn to discuss which of the differences in observable characteristics of the surveys can help us to explain the observed differences in children’s work estimates.

19 UCW WORKING PAPER SERIES, JUNE 2010
6. POPULATION CHARACTERISTICS AND CHILD LABOUR ESTIMATES
50. In this section we discuss whether, and to what extent, differences in the population characteristics represented by two different survey samples can be the origin of differences in child labour estimates. In most developing countries, for example, child labour estimates vary considerably by sex and by place of residence, and unequal proportions of the households with different socio-demographic characteristics in two survey samples can therefore lead to the different child labour estimates.
51. As we have discussed in section 4, sampling and non-sampling errors might lead two surveys, both nominally nationally representative, to actually be representative of different populations. In Annex 4 we present main characteristics of about 90 surveys for 35 countries. A first rough comparison of the expanded sample size, the “urban-rural” ratio and the share of 10-14 year-olds to the total estimated population for surveys within each country does not indicate evident differences.
52. Since for many countries surveys were collected in different years, sometimes with substantial time gaps, we provide, as discussed, more detailed analysis for nine countries with the same or similar reference period (see Annex 3 for details).
53. The results for the subset of nine countries do not point to large differences in the demographic characteristics of the child population (i.e., age, sex and residence) across surveys. The share of 10-14 year-olds in the total population is consistent across surveys in each of the nine countries.13 Distributions of the child population by place of residence are also consistent with the exceptions of surveys in Sao Tome e Principe and Bolivia.14 Finally, we disaggregated the sample by regions, but again there does not appear to be any substantial difference across the surveys that refer to the same country. All this leads us to think that differences in the population characteristics sampled are not responsible in a substantive way for the differences in estimates of children’s economic activity.
6.1 Propensity scores
54. We try now to address this issue in a more formal way, making use of propensity scores and of propensity scores matching. The results just described do not, however, change.
55. Since both school attendance and economic activity rate depend on several household characteristics, it is difficult to use cross tabulations to look at possible differences across a large number of such characteristics. We therefore build an index of the household characteristics, the so-called
13 Note, that in the Kenya SIMPOC survey, we observe only children aged 5-17 and cannot compute total population number. 14 In Sao Tome e Principe there is an eight percentage point difference in the share of the urban child population between the two comparator surveys and in Bolivia there is a 29 percentage point difference in the share of the urban child population. In the case Bolivia, however, this difference is likely a product of coding rather than of the represented populations.

20
TOWARDS CONSISTENCY IN CHILD LABOUR MEASUREMENT: ASSESSING THE
COMPARABILITY OF ESTIMATES GENERATED BY DIFFERENT SURVEY INSTRUMENTS
propensity score, calculated for each dataset in each country. The propensity score is a summary indicator of the characteristics of the household in the sample, so a similar distribution will indicate that population characteristics of the two surveys are alike.
56. Of course, in this particular study, only characteristics that are important for the child labour analysis and available for both surveys in each country are included. Therefore, in order to compute propensity scores for every survey pair, the “best” set of the common covariates is identified. Most of the surveys allow use of the following common covariates: age, education level and sex of the household head, household size, number of adults aged 25-55, number of children aged 0-4, number of children aged 5-14, urban/rural residence and region. Needless to say, this method is limited, but nonetheless provides a starting point for identifying differences in populations represented by the surveys.
Figure 4. Distribution of propensity scores, selected countries
01
23
45
kdensity P_LSMS kdensity P_MICS
Bolivia
05
1015
kdensity P_2003 kdensity P_2004
Brazil
01
23
4
kdensity P_MISC kdensity P_PS
Cameroon
05
1015
kdensity P_SIMPOC kdensity P_CWIQ
Ghana
01
23
4
kdensity P_MICS kdensity P_CWIQ
Lesotho
02
46
810
kdensity P_LSMS kdensity P_MICS
Sao Tome and Principe

21 UCW WORKING PAPER SERIES, JUNE 2010
Figure 4. Distribution of propensity scores, selected countries
Source: UCW calculations (for details about the surveys see Annex 3)
57. Figure 4 presents the distribution of the propensity scores computed from two different surveys for a subset of countries. As we can note, the distributions are very similar and overlap to a very large extent in the countries considered.15 While the the comparison of propensity scores should be interpreted with care, they nonetheless offer further support for the conclusion that the differences in child labour estimates cannot be attributed to substantial differences in the populations represented by surveys.
6.2 Matching estimator
58. Another way to determine whether survey characteristics are important to explaining the differences in estimates across surveys is to assess whether such differences persist even considering identical individuals across the two surveys. If this is the case, then one can claim that some survey characteristics at the origin of the differences. In other words, when we compare identical individuals across surveys, we eliminate any possible influence of other factors and any observed difference should depend on features of the surveys.
59. It is not possible to observe the same individuals across different surveys, and it is therefore also not possible to directly compare the reported status in term of economic activities for the same child across two surveys. Such pairwise comparisons can be approximated, however, through a matching estimator, which in our case is defined below.
60. Let the child economic activity status EMP equal to 1 if he/she works and 0 otherwise. For individual i, (i=1,…,N ), let )}(),({ BEMPAEMP ii denote
the two potential outcomes of the economic activity status, in survey A and B respectively. As mentioned above, each individual and his/her
15 Note that the Kolmogorov-Smirnov equality-of-distributions test indicates that the distributions are statistically different. This is most likely explained by the large number of observations and somehow confirmed by the fact that such difference is significant also in Brazil where the sample frame does not vary over the years considered.
02
46
kdensity P_DHS kdensity P_CLS
Senegal
02
46
810
kdensity P_SIMPOC kdensity P_DHS
Bangladesh

22
TOWARDS CONSISTENCY IN CHILD LABOUR MEASUREMENT: ASSESSING THE
COMPARABILITY OF ESTIMATES GENERATED BY DIFFERENT SURVEY INSTRUMENTS
employment status is observed only in one of two surveys. Let the observed outcome be denotes by iEMP, i.e.:
BsifBEMP
AsifAEMPsEMPEMP
ii
iiiii =
===
)(
)({)(
61. For each individual i from the survey A, a matching estimator imputes individuals from the survey B, whose covariates X are similar. The matching estimator requires the two following assumptions:
1) Unconfoundedness (selection on observables) XsBEMPAEMP ii |))(),(( ⊥
2) Identification assumption 1)|(Pr0 <=< XAsob .
62. In the vector of covariates X we include child age and sex; age, sex and education level of the household head; household size, number of children aged 0-4 years in the household, number of children aged 5-14 years in the household and number adults aged 25-55 in the household, and area (urban or rural) of residence. In instances in which the surveys considered allow identification of provinces or regions, we also include them.
63. We use the Stata subroutine nnmatch16 to implement these estimators and obtain the sample average treatment effect (SATE), that in our case is equal to
])(ˆ)(ˆ[1
ˆ1∑
=−=
N
iii xBPEMxAPEM
Nτ
64. The estimate of τ̂ , the average difference in child economic activity rate for identical, is reported in Table 8.
65. As shown, τ̂ is significant for all countries, indicating the children with identical characteristics show different rates of participation to economic activity depending on the survey instruments that is applied. These results support the hypothesis that difference of the child labour estimates can be mainly attributed at differences in survey features and not to the characteristics of the population targeted by the various surveys.
16 Implementing Matching Estimators for Average Treatment Effects in Stata, A. Abadie, D. Drukker, J.L. Herr, and G.W. Imbens, The Stata Journal 2001, 1, pp. 1-18

23 UCW WORKING PAPER SERIES, JUNE 2010
Table 8. Matched households differences in child economic activity rates across surveys
Country Surveys
SATE
Coef. Τ Std. Err z Number of
observations
Bangladesh (8-17 y.o.) A: DHS, 2004
B: SIMPOC, 2002-2003 -0.0752412 0.0042744 -17.60 58108
Bolivia (10-14 y.o.) A: MICS-2, 2000
B: LSMS, 2000 0.076713 0.0152712 5.02 4393
Brazil (5-17 y.o) A: PNAD, 2003
B: PNAD, 2004 Not computed because of excessive sample size
Cameroon (10-14 y.o.) A: MICS-2, 2000
B: PS, 2001 0.4818382 0.0119111 40.45 11214
Ghana (5-17 y.o) A: CWIQ, 2003
B: SIMPOC, 2000 -0.2083825 0.0039764 -52.40 91262
Lesotho (5-17 y.o) A: CWIQ, 2002
B: MICS-2, 2000 -0.2779821 0.0068225 -40.74 17946
Sao Tome e Principe (10-14 y.o.) A: MICS-2, 2000
B: LSMS, 2000 0.1747232 0.01258 13.89 3372
Senegal (5-17 y.o) A: SIMPOC, 2001
B: DHS, 2000 -0.1524999 0.0063602 -23.98 28201

24
TOWARDS CONSISTENCY IN CHILD LABOUR MEASUREMENT: ASSESSING THE
COMPARABILITY OF ESTIMATES GENERATED BY DIFFERENT SURVEY INSTRUMENTS
7. SURVEY CHARACTERISTICS AND CHILD LABOUR ESTIMATES
66. The previous section indicated that it is unlikely that the differences in child labour estimates are the result of differences in the populations represented by (two) different surveys for each country. The current section tries to identify which survey characteristics underlie the large differences in estimates discussed in section 5.
67. As shown in Table 9 and in more detail in Annex 1, the two comparator survey instruments in each of the nine countries differ in a number of important ways, each of which could play a role in influencing estimates. Most of the comparator surveys have different general objectives, and pose different questions to identify children’s activity to different household members at different times of the year. In what follows, we discuss the possible roles of differences in questionnaires, survey respondent and season of field work in explaining the difference in child labour estimates.
Table 9. Survey comparability: summary of differences in survey instruments
Country
Difference in primary objective
or target of survey?
Survey characteristics
Differences in question phrasing
and detail?
Differences in length of reference period?
Differences in timing (season) of field
work?
Differences in population(1)?
Bangladesh yes yes yes yes No
Bolivia yes yes no yes No
Brazil no no no no No
Cameroon yes yes yes yes No
Ghana yes yes no yes No
Kenya yes yes no yes No
Lesotho yes yes no yes No
Sao Tome e Principe yes yes yes yes No
Senegal yes yes no - No
Notes: (1) See Section 6 for details
7.1 Survey questionnaire
68. The level of detail and phrasing of survey questions on children’s activity are likely to play a particularly important role in influencing estimates. The survey questionnaires utilised in the various surveys vary considerably in terms of both the phrasing and detail contained in the questions relating to children’s economic activity, a reflection of the different underlying objectives of these instruments.
69. While some of the instruments are designed with an explicit focus on child labour (e.g., SIMPOC) or on children’s conditions generally (e.g., MICS2), others are aimed at measuring broader living standards or welfare levels, and only look at children’s activity in the context of survey modules on the overall labour force (e.g., LSMS and CWIQ). Not surprisingly, it is the first of these instruments, SIMPOC, that contains the most detailed set of questions on the extent and nature of children’s involvement in economic activity, but there is substantial variation even among surveys conducted as part of the SIMPOC programme in terms of the exact phrasing and detail of questions on children’s work.

25 UCW WORKING PAPER SERIES, JUNE 2010
70. Questions used for measuring children’s involvement in economic activity fall primarily within three broad categories, as illustrated in Table 10. The first category consists of one or more simple, direct questions concerning whether or not a child works, and, in some cases, whether or not this work takes place for family or non-family members. The MICS2 survey instrument is the most common example of this category of questions on children’s work. The second category consists of a sequential chain of questions aimed at recording all possible forms of work in which a child can be involved. This category of questions is commonly found in SIMPOC and in some labour force survey instruments. The third general category of questions involves collecting information on main occupation, from which work (or specific work type) can be selected from a list of several alternative options (e.g., student, domestic duties, dependent, etc.).
71. For all three categories, seven days is the most common reference period, though some questions may also refer to current day, the past month or the past year. Other surveys may consider multiple reference periods, or may not define the reference period at all. Further specific examples of questions on children’s economic activity from different survey instruments are provided in Annex 2 of this report.
Table 10. Comparison of the main questions related to child involvement in economic activity
Question type Questions Examples
1. Simple (short) form of questions Simple questions about last week or current economic activity, for example:
• Did he/she do any type of work in the last 7 days?
• Did he/she hold a job or work for pay, profit or family gain last week?
• Did he/she do any kind of work for someone who is not a member of the household in the last week?
• Did he/she do any other family work (in the farm or in business) in the last week?
• Is he/she currently working?
MICS2; CWIQ; DHS; some SIMPOC surveys
(ex. Ghana/2000, Kenya/1998/99)
2. Complex (long) form of questions Complex questions about last week or current economic activity: economic
activity is defined through the chain of questions which include lists of the
possible activities. Sometimes, the next question is asked only in the case of
the negative answer on the previous one.
(ex. Ethiopia/2001, Egypt/1998); LSMS(ex.
Bolivia/2000, Nicaragua/2001; SIMPOC
surveys (ex. Mali/2005, Argentina/2004,
Panama/2000)
3. Main occupation status Economic activity can be only determined by the choice of the main occupation
status presented by the list of several options Survey examples:
PS (alternative options for the main occupation: employed, unemployed,
homemaker, retired, student, dependent, other);
NHS/Uganda/1999 (alternative options for the
main occupation: too young or old, disabled,
student, employer, own account worker,
unpaid family worker, gov’t employee, private
employee, unemployed,
political/social/religious worker, att. domestic
duties, other)
4. Other cases Economic activity can be only determined through working hours per week
*Note: many surveys ask questions concerning both economic activity during
last 7 days and last year
(ex. LFS/Ethiopia/2005)
(ex. MICS; some DHS (ex. Chad/2004,
Mali/2001); some LFS (ex. Ethiopia/2001,
Zambia/2005); some SIMPOC surveys (ex.
Ghana/2000, Argentina/2004); some LSMS
(ex. Vietnam/1997/98)
72. The possible impact of question type on child labour estimates, however, is not easy to predict. On the one hand, simple intuition might suggest that

26
TOWARDS CONSISTENCY IN CHILD LABOUR MEASUREMENT: ASSESSING THE
COMPARABILITY OF ESTIMATES GENERATED BY DIFFERENT SURVEY INSTRUMENTS
the complex form of questions about child economic activity might yield a higher estimate of child economic activity, since they are more likely to capture the full range of economic activities that children are engaged in. On the other hand, the very general wording of the simple form of questions could lead some respondents to report productive activities that are not technically economic in nature (see discussion below) thereby inflating estimates of involvement in economic activity.
73. Figure 5, which presents children’s work estimates for a sub-sample17 of countries by type of questions used, indicates that the complex question type usually (but not always) yields higher estimates; this result could indicate that the first effect outweighs the second, but could also of course be due to the confounding effects of other aspects of survey features. The econometric analysis presented in the next section yields more robust evidence in this context: it shows that complex questions generally yield higher estimates than simple questions, which in turn yield higher estimates than questions on main occupation, even when controlling for key demographic factors and other observable characteristics of the surveys.
74. The Indonesian Family Life Survey (IFLS 2000) provides an opportunity to explore the influence of question type on estimates of children’s work within the context of a single survey. IFLS 2000 contains three separate questions on child economic activity. First, in the child module, there is a question on whether a child worked for wage or family business in the last month. Second, there is an additional common “control” module containing a question on involvement in work in the last 12 months. Third, there is another common module with a question on primary activity in the previous week, for which “work/helping to earn an income” is one response option. The survey therefore provides three different questions for constructing an indicator of economic activity for the same sample and year. 17 We have considered in this example countries for which surveys with different questionnaire are available for the same or very close year.
Figure 5. Children’s involvement in economic activity, by question type and country
Notes: (a) Only for these countries we have both surveys, with short and complex form of the questions defining eco. activity.
Source: UCW calculations based on various surveys
LFS/1998
SIMPOC/2005 LSMS/2000
SIMPOC/2001SIMPOC/2000
SIMPOC/2005
NHS2005/06
IS/2004
DHS/2000
DHS/2005MICS/2000
DHS/2000
MICS/2000
DHS/2006
NHS/2002/03
SIMPOC/2002
0
10
20
30
40
50
60
70
80
percen
t
Complex question form Short question form
Egypt Senegal Bolivia Colombia Dominican Republic Mali Uganda Honduras

27 UCW WORKING PAPER SERIES, JUNE 2010
75. Estimates based on these three separate questions are presented in Table 11. As shown, estimates of involvement in economic activity differ substantially depending on question used, especially for 10-14 year-olds. The estimate based on the question from the child module yielded a much higher estimate of economic activity (14.5 percent) than those based on the questions from the common modules (1.3 percent and 0.5 percent, respectively). The child module question appears the most narrowly framed (i.e., referring only to wage work and work in family business), but on the other hand relates to a longer reference period (one-month rather than one-week). If children’s economic activity is intermittent, the longer reference period could explain the higher estimates.
Table 11. Comparison of the economic activity rates resulted from different questions by the example of the Indonesian Family Life Survey 2000
Definition of economic activity
and school attendance
Age range
Total eco.
active
Total attending
school
Activity status
Involved in
economic activity,
not attending
school
Attending school,
not involved
in economic
activity
Involved in
economic activity
and attending
school
Not in economic
activity and not
attending school
Total in eco. activity
CHILD MODULE
*School attendance: Is child now in school?
*Economic activity: Did child work for wage in the last month?
+ Did child work on family business in the last month?
5-9 1.7 84.8 0.1 83.2 1.6 15.1 1.7
10-14 14.5 90.1 3.9 79.5 10.6 5.9 14.5
ADDITIONAL COMMON MODULE 1
*School attendance: Is X in school this year?
*Economic activity: Did X work in the last 12 months?
5-9 0.4 85.2 0.0 84.8 0.4 14.8 0.4
10-14 1.3 99.1 0.2 98.0 1.1 0.8 3.9
3.ADDITIONAL COMMON MODULE 2
*School attendance: Is X in school this year?
*Economic activity: Primary last week activity = working/helping to earn income
5-9 0.1 85.2 0.0 85.1 0.1 14.8 0.2
10-14 0.5 99.1 0.2 98.8 0.3 0.8 3.0
Source: UCW calculations based on Indonesian Family Life Survey (IFLS 2000)
7.2 Survey questions on child economic activity and the SNA framework
76. The term “economic activity” has a very specific definition within the international System of National Accounts (SNA) framework,18 and
18 The System of National Accounts (SNA, Rev. 1993) provides a common frame of reference and conceptual basis for classifying children’s time use in general and their involvement in production in particular. Production, or work, is defined as all activities falling within the general production boundary, i.e., all activities whose performance can be delegated to another person with the same desired results. Non-production activities are those for which this condition does not hold, and include items such as education, leisure and rest. The System of National Accounts is more restricted than the general production boundary, in that it excludes activities performed by household members in service to the household and its members. These production activities outside the SNA production boundary are defined as non-economic production, and comprise items such as cleaning, preparing meals and care of other household members. Production falling within the SNA production boundary is defined as economic production. Economic production is a broad concept covering all market production and certain types of non-market production (principally the production of goods for own use). It includes forms of work in both the formal and informal sectors, as well as forms of work both inside and outside family settings. Market production involves activities leading to the production of goods and services which are intended for sale or are sold on the market. Some of the outputs from market production may be

28
TOWARDS CONSISTENCY IN CHILD LABOUR MEASUREMENT: ASSESSING THE
COMPARABILITY OF ESTIMATES GENERATED BY DIFFERENT SURVEY INSTRUMENTS
questions on children’s work in survey instruments also differ in terms of their adherence to this definition.
77. Some focus primarily on market economic activity and do not capture, or only partially capture, children’s economic activity performed outside the market (e.g., own-account firewood collection, food preservation, water supply, tailoring, etc.). Questions in some survey instruments draw an inaccurate distinction between productive activities falling within and outside the SNA production boundary, or blur the distinction between productive activities that are economic and non-economic in nature. In the MICS2 instrument, for example, water collection is categorised as a non-economic activity whereas this activity technically falls within the SNA production boundary (i.e., is economic in nature).
78. As a consequence, estimates of children’s involvement in economic activity from different survey instruments can actually refer to different underlying sets of productive activities; it is not surprising, therefore, that these estimates differ even for similar reference periods.
7.3 Survey respondent
79. Difference in the person actually answering the questions relating to children’s activities might be another source of difference in child labour estimates across different surveys. In many surveys, questions about children’s economic activity are answered by the household head, who may not be well informed about children’s activities, or may be less inclined to report children’s work for social or cultural reasons. In other surveys, questions on children’s work activities are directly addressed to a child’s primary caretaker, who is likely to have better direct knowledge of a child’s activities, or to children themselves.
80. The issue of survey respondent is particularly important to keep in mind when comparing the results of MICS (and SIMPOC in some cases) surveys with those of more general living conditions or labour market surveys (e.g., LSMS and CWIQ). The former ask questions on children’s economic activity to the mother or to the primary caretaker, while questions on children’s economic activity in the latter are typically directed to the household head.
retained for own consumption or capital formation. Non-market production involves activities leading to the production of goods or services primarily for own use, and can be economic or non-economic in nature. Non-market economic production refers primarily to the production of goods for own use, and include common children’s activities such as water and fuelwood collection.

29 UCW WORKING PAPER SERIES, JUNE 2010
Figure 6. Involvement in economic activity during last month, 5-9 and 10-14 years age groups, by survey respondent (child module)
Source: UCW calculations based on Indonesian Family Life Survey (IFLS 2000)
Figure 7. Current school attendance rate, 5-9 and 10-14 years age groups, by survey respondent (child module)
Source: UCW calculations based on Indonesian Family Life Survey (IFLS 2000)
81. Questions contained in the Indonesian Family Life Survey (IFLS 2000)19 were answered by a number of difference household members (i.e., mother, father, sibling, aunt/uncle, grandparent, child), depending on who was available, and therefore this survey offers an opportunity to assess the influence of survey respondent in the context of a single survey. Most other survey datasets do not permit the identification of the specific survey respondent in a household.
82. A disaggregation of estimates from IFLS 2000 for school attendance and economic activity by respondent indicates that children themselves generally paint a much less positive picture of their time use than others responding for them (Figures 6 and 7). This is particularly the case for 10-14 years age group, who were most likely to respond to the questions in the child module
19 Specifically, the child module of the Indonesian Family Life Survey (IFLS 2000).
1.6 1.61.0
4.6
1.8
3.2
9.810.5 10.1
4.3
5.6
17.9
0
5
10
15
20
mother father sibling aunt/uncle grandparent child him/herself
percent
SURVEY RESPONDENT
5-9 year-olds
10-14 year-olds
83.8
86.087.9
84.6
82.1
97.1
92.193.3
88
96.5
89.5 88.8
70
75
80
85
90
95
100
mother father sibling aunt/uncle grandparent child him/herself
percent
SURVEY RESPONDENT
5-9 year-olds
10-14 year-olds

30
TOWARDS CONSISTENCY IN CHILD LABOUR MEASUREMENT: ASSESSING THE
COMPARABILITY OF ESTIMATES GENERATED BY DIFFERENT SURVEY INSTRUMENTS
directly.20 Children from this age group reported much higher levels of involvement in economic activity, and lower levels of school attendance, than the other family members responding on their behalf. Caution must be exercised in generalising this result, as the specific person in the household available to answer survey questions could be influenced by factors such as household income. But the result does at least point to an important potential role of survey respondent in influencing child labour estimates.
7.4 Seasonality
83. Estimates of children’s involvement in work and schooling can also be influenced by the season in which the information on work and schooling is collected. Estimates can be distorted, for example, if data collection takes place during periods such us school holidays or harvest season when children’s activity patterns differ from other times of the year.
84. Some but not all questionnaires allow for correction of this issue by collecting information on school attendance during “current” school year, on school holidays, on work involvement with reference periods of different durations, on the agricultural calendar and on other issues relating to seasonality. When this is not the case, however, the season of data collection can have a strong effect on the profile of children’s activities emerging from the survey data.
Table 12. Survey field work period
Country Beginning of the academic year
End of the academic
year Survey Year
Beginning of the field work period
End of the field work period
Survey coincides with main school holidays
Bangladesh January December DHS 2004 January May No
SIMPOC 2002 October November No
Bolivia February November
MICS 2000 September November No
LSMS 2000 November December Partially
LSMS 2002 November December Partially
Cameroon September June PS 2001 October December No
MICS 2000 July August Yes
Chad October June DHS 2004 July December Partially
MICS 2000 May October Partially
Burkina Faso October June CWIQ 2003 April July Partially
PS 1998 May August Partially
Egypt September June DHS 2000 March May No
DHS 2005 April July Partially
Ghana September July CWIQ 2003 January May No
SIMPOC 2000 December December No
Colombia February November DHS 2000 March July No
DHS 2004-05 October, 2004 June, 2005 Partially
Dominican Republic
August June MICS 2000 September December No
SIMPOC 2000 November December No
Lesotho March December CWIQ 2002 April June No
MICS 2000 February October Partially
Malawi January November DHS 2000 July November No
DHS 2004-05 January, 2004 January,2005 Partially
20 Children aged 5-9 years replied to questions themselves in only three percent of cases. Children aged 10-14 years responded directly to questions in 59 percent of cases.

31 UCW WORKING PAPER SERIES, JUNE 2010
Table 12. Survey field work period
Country Beginning of the academic year
End of the academic
year Survey Year
Beginning of the field work period
End of the field work period
Survey coincides with main school holidays
Kenya January December MICS 2000 September October No
SIMPOC 1998-99 December,1998 January, 1999 No
Mali October June DHS 2001 January May No
DHS 2006 February December Partially
Panama March December SIMPOC 2000 October October No
LSMS 2003 August November No
Paraguay February November
LSMS 1999 August December Partially
LSMS 2004 August January Partially
LSMS 2005-06 October, 2005 February, 2006 Partially
Sao Tome e Principe
October July MICS 2000 February September Partially
LSMS 2000-01 November, 2000 February,2001 No
Senegal October July DHS 2005 February May No
MICS 2000 May July No
Togo September June CWIQ 2006 July August Yes
MICS 2000 August 4,September Yes
Uganda February December DHS 2000-01 January, 2000 March, 2001 Partially
Tanzania January December DHS 1999 September November No
Zambia January December LFS 2005 September October No
Cote d'Ivoire October June MICS 2000 January December Partially
IE Salvador January November IS 2001 July December Partially
IS 2003 October December Partially
Guatemala March October LSMS 2000 July December Partially
Honduras February December SIMPOC 2002 May July No
Nicaragua February December LSMS 2001 May June No
DHS 2001 September December No
Peru April December LSMS 2000 May June No
LSMS 1994 June August No
Cambodia October July SIMPOC 2001 April April No
IS 2003-2004 November,2003 January,2004 No
Mongolia September June MICS 2000 June September Partially
85. Table 12 presents information about the coincidence of the main school holidays with the period in which a survey has been carried out. As can be seen, very few surveys are carried out during the school holidays only, but several are partially conducted during this period. This might have an influence on the estimate of participation rates and, especially, on their comparability with survey carried out fully during the school term.
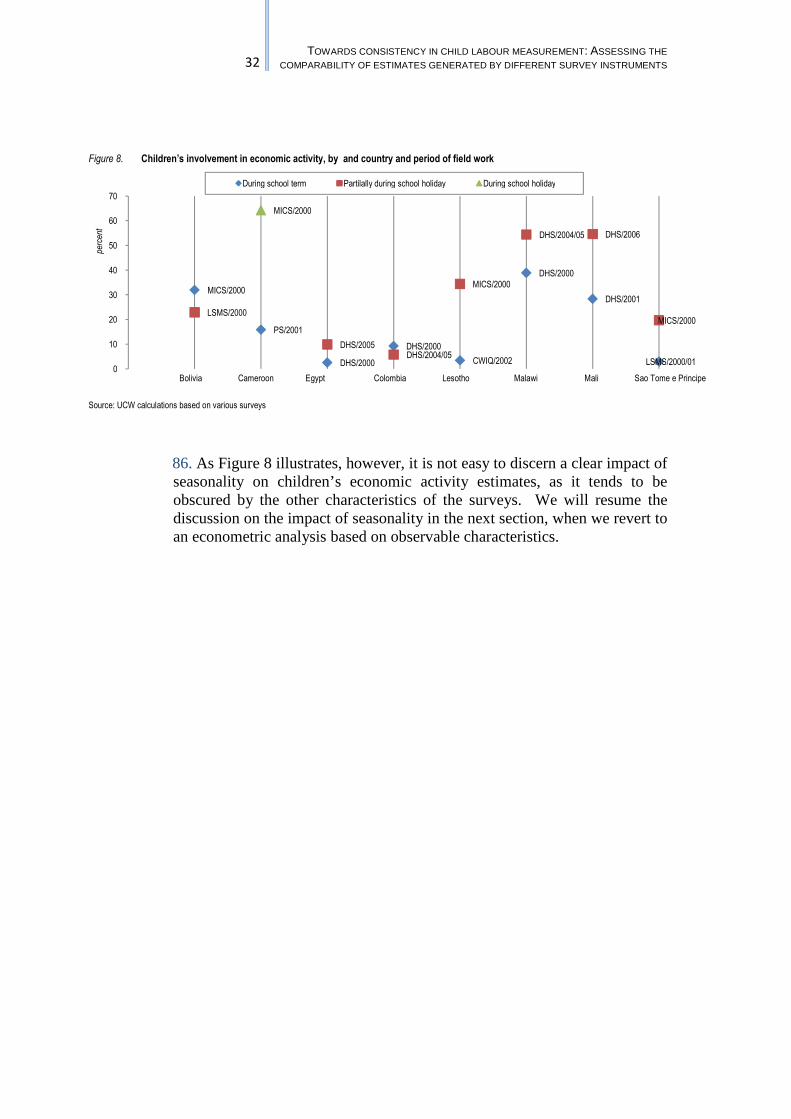
32
TOWARDS CONSISTENCY IN CHILD LABOUR MEASUREMENT: ASSESSING THE
COMPARABILITY OF ESTIMATES GENERATED BY DIFFERENT SURVEY INSTRUMENTS
Figure 8. Children’s involvement in economic activity, by and country and period of field work
Source: UCW calculations based on various surveys
86. As Figure 8 illustrates, however, it is not easy to discern a clear impact of seasonality on children’s economic activity estimates, as it tends to be obscured by the other characteristics of the surveys. We will resume the discussion on the impact of seasonality in the next section, when we revert to an econometric analysis based on observable characteristics.
MICS/2000
PS/2001
DHS/2000
DHS/2000
CWIQ/2002
DHS/2000
DHS/2001
LSMS/2000/01
LSMS/2000
DHS/2005DHS/2004/05
MICS/2000
DHS/2004/05 DHS/2006
MICS/2000
MICS/2000
0
10
20
30
40
50
60
70
percent
During school term Partilally during school holiday During school holiday
Bolivia Cameroon Egypt Colombia Lesotho Malawi Mali Sao Tome e Principe

33 UCW WORKING PAPER SERIES, JUNE 2010
8. SURVEY CHARACTERISTICS AND CHILD LABOUR ESTIMATES: ECONOMETRIC EVIDENCE
87. In this section we estimate an econometric model to assess the specific influence on child labour estimates of the specific survey instrument, the survey questionnaire, and the field work period, controlling for key demographic factors. The advantage of a multivariate regression is that it allows examining simultaneously the impact of the different elements of the survey, both observable and unobservable.
88. Our estimation strategies consist of regressing estimates of children’s participation in economic activity obtained by different surveys, in various years and countries, on a set of indicators of observable characteristics, leaving the survey dummies to identify the variation in estimates explained by unobserved survey characteristics.
89. The basis for our estimates, i.e., our dependent variable, is the estimates of weighted21 average economic activity rates of children aged 10-14 years disaggregated by survey, country, survey year, sex and area of residence. We create a pooled dataset across 54 surveys covering 24 countries for different years (for details see Annex 4). In addition to the cell average of participation in economic activity, we include the following variables: sex, place of residence, type of question about economic activity (e.g., simple, long, occupation list), period of field work, survey type (e.g., SIMPOC, MICS-2), country and year of reference.
90. Finally, we regress average economic activity rates and schooling attendance rates on the explanatory variables. Because the dependent variable (employment rate or school attendance) is a ratio taking values between 0 and 1, we use a grouped probit model. The advantage of using a grouped probit is that it produces predictions that are within the 0-1 range.
91. The results are reported in the Table 13, where each column corresponds to a different specification. Marginal effects are reported alongside t-statistics. All specifications include a gender dummy (male), residence type dummy (urban); and interaction of the two (male and urban), survey type dummies (SIMPOC being is the reference type), period of field work (during the school term being the reference period), country dummies (Bangladesh being the reference country) and year dummies.
92. The coefficients on the survey dummies provide average differences in the incidence of child labour resulting from each of the surveys relative to SIMPOC. Those relative to country dummies provide the average differential intensity of child labour in each country relative to Bangladesh. By including year dummies we also control for the circumstance that different data refer to different years.
93. Table 13 clearly shows that there are significant differences in estimates of the level of children’s economic activity work across survey instruments. With the exception of MICS and national labour force surveys, all the coefficients on the survey dummies are negative (albeit not all statistically
21 By sample weights

34
TOWARDS CONSISTENCY IN CHILD LABOUR MEASUREMENT: ASSESSING THE
COMPARABILITY OF ESTIMATES GENERATED BY DIFFERENT SURVEY INSTRUMENTS
significant), implying that SIMPOC and MICS survey instruments yield systematically higher estimates of child labour relative to the other surveys.
94. On average, the CWIQ surveys provide the lowest estimates of child labour: around 24 percentage points lower than those yielded by SIMPOC. It is interesting to observe that the two surveys (MICS and LSMS) most commonly used for child labour measurement appear to provide estimates that are not statistically different from each other. It should be noted, however, that while the difference might not be statistically significant, the point estimates might differ quite substantially.
Table 13. Estimates of average employment rate for children 10-14 years old: MARGINAL EFFECT after grouped probit
Variable Model 1 Model 2 Model 3 Model 4 Model 5 Model 6
Coef. z Coef. z Coef. z Coef. z Coef. z Coef. z
Male 0.0895 4.65 0.0957 4.25 0.0866 3.99 0.0899 4.79 0.0881 4.57 0.0886 4.67
Urban -0.2042 -10.02 -0.2071 -8.80 -0.2083 -9.17 -0.2054 -10.32 -0.2028 -9.95 -0.2043 -10.18
Male*Urban -0.0275 -1.00 -0.0400 -1.27 -0.0287 -0.93 -0.0281 -1.05 -0.0268 -0.98 -0.0270 -1.00
Survey dummy (SIMPOC is reference)
CWIQ -0.2444 -10.38 -- -- -- -0.2431 -10.08 -0.2427 -7.63 -0.2394 -7.58
PS -0.2121 -6.01 -- -- -0.1912 -4.64 -0.1660 -1.91 -0.1291 -1.21
DHS -0.1086 -3.28 -- -- -0.0847 -1.80 -0.1525 -2.69 -0.1164 -1.70
MICS 0.0630 1.39 -- -- 0.0875 1.53 0.0050 0.10 0.0384 0.54
LFS 0.0178 0.23 -- -- -0.0368 -0.51 0.0356 0.39 -0.0100 -0.12
LSMS -0.0407 -0.93 -- -- -0.0581 -1.40 -0.0824 -1.76 -0.0735 -1.58
IS -0.1768 -5.70 -- -- -0.1806 -6.13 -0.1607 -4.54 -0.1737 -5.26
Type of question dummy (main occupation list is reference)
Simple -- -- 0.0983 2.42 -- -- 0.0369 0.70 -- -- 0.0542 0.98
Long -- -- 0.1331 2.97 -- -- 0.1196 2.83 -- -- 0.1119 2.54
Field work period (in school term is reference)
Partially outside school term
-- -- -- -- 0.1391 4.01 -- -- 0.0418 0.96 0.0290 0.64
Outside school term
-- -- -- -- 0.3486 3.30 -- -- 0.2238 1.18 0.1852 0.96
Missing -- -- -- -- 0.0539 1.36 -- -- -0.0452 -0.72 -0.0112 -0.17
Country dummy (Bangladesh is reference)
Variable Model 1 Model 2 Model 3 Model 4 Model 5 Model 6
Coef. z Coef. z Coef. z Coef. z Coef. z Coef. z
Bolivia 0.0911 1.34 0.0137 0.21 -0.0612 -1.10 0.0513 0.76 0.0835 1.10 0.0532 0.73
Cameroon 0.2924 3.68 0.2012 2.41 -0.0888 -1.16 0.2886 3.67 0.0911 0.51 0.1159 0.63
Chad 0.4218 7.30 0.3794 5.67 0.2201 2.79 0.4189 7.29 0.3960 5.07 0.3995 5.15
Burkina Faso 0.6129 10.51 0.3408 3.62 0.0503 0.53 0.6260 11.34 0.5166 4.72 0.5566 5.32
Egypt -0.1790 -4.70 -0.2407 -8.27 -0.2709 -13.62 -0.1785 -4.81 -0.1732 -3.44 -0.1777 -3.72
Ethiopia 0.2691 2.60 0.2925 3.31 0.2175 2.26 0.2992 2.95 0.2508 1.95 0.2583 2.00
Ghana 0.0981 1.23 -0.0666 -1.04 -0.0935 -1.66 0.1208 1.47 0.0422 0.52 0.0724 0.81
Colombia -0.1018 -1.90 -0.1806 -3.98 -0.2371 -9.36 -0.1005 -1.73 -0.0902 -1.30 -0.0963 -1.40
Dominican Rep. -0.0353 -0.62 -0.1256 -2.27 -0.1304 -2.66 -0.0759 -1.43 -0.0604 -1.10 -0.0802 -1.53
Lesotho -0.0024 -0.04 -0.0497 -0.82 -0.1763 -4.26 -0.0042 -0.07 -0.0235 -0.30 -0.0211 -0.28
Malawi 0.2204 3.08 0.0924 1.27 0.0065 0.10 0.2155 3.04 0.2165 2.37 0.2060 2.30
Mali 0.3606 5.01 0.3764 4.74 0.3130 3.74 0.3120 4.19 0.3839 5.05 0.3301 4.09
Panama -0.1992 -6.03 -0.2046 -4.98 -0.2304 -8.09 -0.1943 -5.87 -0.2071 -6.37 -0.1990 -5.94
Paraguay -0.0819 -1.28 -0.1149 -1.97 -0.1581 -3.46 -0.1166 -2.07 -0.1119 -1.88 -0.1284 -2.34
Sao Tome e Pr -0.1163 -2.48 -0.1471 -3.02 -0.2269 -7.78 -0.1093 -2.22 -0.1340 -2.68 -0.1203 -2.33
Senegal 0.0839 1.30 0.0650 0.90 -0.0074 -0.12 0.0966 1.50 0.1155 1.62 0.1107 1.57
Togo 0.4847 7.87 0.4047 5.51 0.0502 0.41 0.4788 7.80 0.2800 1.36 0.3035 1.47
Zambia 0.1491 1.58 0.2241 2.35 0.1866 2.15 0.1755 1.82 0.1221 1.28 0.1589 1.62
Cote d'Ivoire 0.1618 2.18 0.0545 0.78 -0.0702 -1.13 0.1623 2.24 0.1524 1.67 0.1491 1.66

35 UCW WORKING PAPER SERIES, JUNE 2010
Table 13. Estimates of average employment rate for children 10-14 years old: MARGINAL EFFECT after grouped probit
Variable Model 1 Model 2 Model 3 Model 4 Model 5 Model 6
Coef. z Coef. z Coef. z Coef. z Coef. z Coef. z
IE Salvador 0.1929 1.81 -0.0213 -0.27 -0.1611 -3.00 0.1260 1.23 0.0487 0.40 0.0625 0.51
Guatemala 0.0473 0.61 0.0248 0.30 -0.0784 -1.17 0.0217 0.29 0.0136 0.15 -0.0052 -0.06
Honduras -0.0745 -1.44 -0.1233 -2.64 -0.1264 -2.81 -0.0941 -2.00 -0.0861 -1.71 -0.0971 -2.05
Cambodia 0.4412 5.42 0.3901 4.76 0.3326 3.90 0.4562 5.27 0.3647 3.27 0.4075 3.47
Year dummy(year 2002 is reference)
Variable Model 1 Model 2 Model 3 Model 4 Model 5 Model 6
Coef. z Coef. z Coef. z Coef. z Coef. z Coef. z
1998 0.0030 0.03 0.1214 1.27 0.1715 1.94 -0.0214 -0.21 -0.0085 -0.07 -0.0358 -0.31
1999 -0.0469 -0.74 -0.0264 -0.36 -0.1026 -1.76 -0.0477 -0.72 -0.0072 -0.08 -0.0189 -0.22
2000 -0.0070 -0.16 0.1104 2.42 0.1309 3.02 -0.0272 -0.59 0.0175 0.38 0.0003 0.01
2001 -0.0821 -1.66 -0.0736 -1.35 -0.0444 -0.79 -0.0873 -1.57 -0.0400 -0.59 -0.0564 -0.78
2003 -0.0188 -0.30 -0.0808 -1.52 -0.0052 -0.09 -0.0384 -0.59 0.0274 0.35 -0.0047 -0.06
2004 0.0811 1.68 0.0251 0.51 -0.0094 -0.20 0.0502 0.91 0.1070 1.54 0.0730 1.01
2005 0.0653 1.26 0.0515 0.87 0.0597 1.04 0.0343 0.61 0.0753 1.20 0.0483 0.74
2006 0.0456 0.64 -0.1227 -2.35 -0.1571 -3.56 0.0553 0.76 0.0178 0.20 0.0352 0.40
Number of observations: 216
95. We now turn to explore the effects of the various observable differences in the surveys discussed in the previous sections. Given the relatively small size of our sample, and correlation between survey type and the other characteristics, it might be difficult to precisely identify the effects of the specific survey characteristics. We begin our analysis by introducing the survey characteristics separately and excluding the survey dummies.
96. In model 2 in Table 13, we show the results for the effects of the kind of questionnaire used in the surveys. The questionnaire appears to have a significant effect on the estimates and its impact is quantitatively relevant. Relative to the surveys that record economic activity based on main occupation, those that use either the simple or the long questions provide substantially higher estimates of child economic activity (10 and 13 percentage points respectively).
97. Model 3 includes dummies to control for the period, relative to the school term, in which the surveys are carried out. If the survey takes place outside the school term, the estimated level of child economic activity is on average 35 percentage points higher than in cases when the survey is run during the school term. When the survey reference period partly partially coincides with the term time, this difference is reduced to 14 percentage points. The estimates confirm the potentially important role of seasonal effects; one must be careful about the size of the estimates, however, as the dummies might also capture survey effects.
98. In model 4, we show the results obtained reintroducing in the estimates the survey dummies. Our aim is to check whether and to what extent differences in the incidence of child labour as estimated in different surveys can be fully explained by different observable characteristics of the survey instruments discussed above. If the observable characteristics are primarily responsible, one would expect the coefficient of the survey dummies to become closer to zero, i.e., the estimated differences between surveys to partially disappear. Identification of this model is warranted by the fact that

36
TOWARDS CONSISTENCY IN CHILD LABOUR MEASUREMENT: ASSESSING THE
COMPARABILITY OF ESTIMATES GENERATED BY DIFFERENT SURVEY INSTRUMENTS
the same survey instruments sometimes use different types of questions in different time periods and/or in different countries.
99. When dummies for type of question are introduced alongside survey dummies in model 4, the latter become slightly smaller (in absolute value). For example, while the average difference between the DHS and SIMPOC is estimated in the order of 11 percentage points in model 1, this difference is in the order of eight percentage points in model 4. If we take these estimates at face value, they imply that around 25 percent ((11-8)/11) of the differential estimates of child labour between SIMPOC and DHS are explained by their use of different types of questions.
100. Dummies for the overlapping between term time and interview time are introduced in model 5. Although none of these variables is individually significant, an F-test for the joint significant of these three variables has a p-value of 0.09, i.e. they are marginally significant.
101. Finally, in model 6, we include both the dummies for type of question and for the overlapping between school term time and interview time. Survey dummies are in the same range as the ones in column 4. It is hard to detect any clear change when all the controls are included: some survey dummies increase in absolute value while others fall. Although most of the coefficients on the additional controls are not individually significant, again a test of joint significance of the controls leads to reject the hypothesis that they are jointly not significant (p-value=0.08).
102. Table 14 presents, for comparison purposes, the same estimates described above referred to the school attendance rate. As can be easily seen, none of the survey dummies is significant. This confirms that, as argued in the previous sections, the currently available survey instruments do offer substantially consistent estimates of school attendance.

37 UCW WORKING PAPER SERIES, JUNE 2010
Table 14. Estimates of average school attendance for children 10-14 years old: MARGINAL EFFECT after group probit
Variable Coef. z
Male 0.0305 2.06
Urban 0.1319 9.46
Male*Urban -0.0234 -1.25
Survey dummy (SIMPOC is reference)
CWIQ 0.0103 0.29
PS -0.0264 -0.44
DHS -0.0567 -1.60
MICS -0.0136 -0.63
LFS -0.0279 -0.55
LSMS -0.0427 -1.49
IS 0.0528 1.82
Country dummy(Bangladesh a is reference)
Bolivia 0.1297 6.89
Cameroon 0.0391 0.91
Chad -0.1188 -1.98
Burkina Faso -0.2509 -2.66
Egypt 0.0908 3.21
Ethiopia -0.0675 -0.89
Ghana 0.0506 1.39
Colombia 0.1022 4.04
Dominican Republic 0.1348 8.55
Lesotho 0.0792 2.62
Malawi 0.1009 4.21
Mali -0.3022 -4.14
Panama 0.1340 8.09
Paraguay 0.1265 5.48
Sao Tome e Pr 0.0073 0.16
Senegal -0.2401 -3.81
Togo -0.0140 -0.26
Zambia -0.0085 -0.15
Cote d'Ivoire -0.1946 -2.72
IE Salvador -0.0807 -0.89
Guatemala -0.0365 -0.64
Honduras 0.0117 0.28
Cambodia 0.0171 0.37
Year dummy(year 2002 is reference)
1998 0.0025 0.04
1999 0.0077 0.21
2000 -0.0021 -0.09
2001 0.0442 1.35
2003 0.0104 0.30
2004 -0.0055 -0.19
2005 0.0540 2.18
2006 0.0568 1.51
Number of observations: 216
103. Because the results in the previous tables are not immediately obvious to interpret, in Table15 and Figure 9 we report the predicted levels of children’s economic activity across countries and surveys when different controls are sequentially accounted for. This allows us to compute counterfactual distributions of children’s economic activity, and to assess the

38
TOWARDS CONSISTENCY IN CHILD LABOUR MEASUREMENT: ASSESSING THE
COMPARABILITY OF ESTIMATES GENERATED BY DIFFERENT SURVEY INSTRUMENTS
individual role played by different observable survey and compositional characteristics in explaining differences in the estimates of children’s economic activity within countries.
Table 15. Actual and counterfactual employment rate by country, children 10-14 years old
Country
(1)
Actual
(2)
Predicted
(3)
Predicted
Fixed gender and
urban/rural distribution
(4)
Predicted
Fixed gender and urban/rural
distribution, year 2002
(5)
Predicted
Fixed gender
and urban/rural distribution,
year 2002,
main occup.,
in school term
(6)
Predicted
Fixed gender and urban/rural
distribution, year 2002,
long question, outside school term
mean variance mean variance mean variance mean variance mean variance mean variance
1.Bangladesh 18.7 110.6 22.5 40.8 19.4 32.1 18.1 56.4 11.9 31.9 40.2 124.2
2.Bolivia 27.6 20.9 27.3 2.0 31.7 2.0 32.2 2.6 18.6 29.4 51.7 59.2
3.Cameroon 40.1 1167.0 38.8 1293.9 37.7 1271.6 39.8 1151.9 22.4 86.6 56.6 152.1
4.Chad 73.0 27.2 70.7 86.2 66.8 114.1 64.9 209.0 46.5 241.6 79.6 119.2
5.Burkina Faso 62.1 71.5 49.8 45.6 43.7 40.8 50.4 128.1 37.3 311.8 71.7 245.0
6.Egypt 7.1 15.1 6.5 6.2 6.4 6.0 7.8 23.9 4.2 13.5 20.5 128.2
7.Ethiopia 62.7 0.8 53.5 23.5 46.9 22.3 48.6 1.4 39.3 0.0 75.1 0.0
8.Ghana 21.0 353.4 20.8 361.6 20.4 347.3 21.5 337.9 15.1 202.8 42.7 669.0
9.Colombia 7.5 5.9 6.8 0.1 9.8 0.2 9.5 0.4 5.9 0.0 27.2 0.0
10.Dominican Republic
18.1 10.3 17.1 6.7 20.1 4.6 20.8 4.8 13.5 5.3 43.8 17.4
11.Lesotho 18.9 475.9 20.0 493.8 17.3 381.9 17.7 405.7 9.4 113.6 31.3 677.1
12.Malawi 46.7 120.2 44.7 97.2 38.9 93.1 37.0 33.6 23.8 0.0 59.4 0.0
13.Mali 52.9 558.2 53.8 133.6 51.2 145.1 52.4 62.6 39.2 84.4 74.5 51.5
14.Panama 5.4 0.2 5.0 0.3 5.9 0.3 6.6 1.3 4.9 1.8 24.0 16.9
15.Paraguay 15.9 11.1 15.5 7.6 17.1 10.5 16.6 0.0 6.6 0.0 29.1 0.0
16.Sao Tome e Principe
11.3 138.3 11.4 95.7 12.0 111.3 12.5 117.8 7.0 9.9 29.6 67.1
17.Senegal 30.2 59.5 29.9 149.2 29.7 143.5 29.8 116.5 23.6 52.4 58.3 88.0
18.Togo 62.1 589.8 60.4 777.9 58.3 828.7 58.7 851.9 28.9 619.2 60.1 834.2
19.Zambia 34.7 629.0 27.6 491.0 28.7 346.0 29.2 209.8 24.2 29.2 59.7 44.9
20.Cote d'Ivoire
31.0 315.8 30.9 352.8 32.5 434.5 33.0 462.8 21.2 144.8 54.3 281.4
21.IE Salvador 15.9 16.0 15.7 1.2 17.3 1.4 20.5 0.0 8.7 0.0 34.3 0.0
22.Guatemala 29.4 2.3 30.2 6.4 28.9 6.1 30.8 16.3 19.0 66.8 52.1 146.5
23.Honduras 13.6 21.8 13.8 28.7 13.9 29.7 13.0 46.3 8.3 22.5 32.3 131.6
24.Cambodia 56.9 128.5 57.7 104.9 51.8 120.9 56.3 159.6 45.8 161.9 79.4 81.9
Average 31.3 105.1 30.1 95.4 29.2 93.3 30.1 89.1 20.1 46.4 49.4 82.1
104. Column 1 of Table 15 presents the average incidence of children’s work together with its variance across surveys for each country. A higher variance implies higher dispersion in the estimates of children’s economic activity in each country, resulting from the use of different survey instruments, different reference years and potentially to different sample characteristics (urban/rural males/females). As a summary measure of dispersion, the last row of the table reports the within variance in children’s economic activity computed using data for all countries in the sample. This gives a summary measure of the dispersion in children’s economic activity within all countries in the sample.

39 UCW WORKING PAPER SERIES, JUNE 2010
105. Column 2 of Table 15 reports the estimated levels of children’s economic activity as derived from model 6 in Table 13. Interestingly, both the estimated levels of children’s economic activity and the within variance are very close to the actual one, presented in column 1. For example, the average level of children’s economic activity across all observations is 31.3 with a within variance of 105.1. When predictions are used, these numbers are 30.1 and 95.4 respectively: this implies that the model is able to capture around 90 percent of the variation in the data. The parsimonious grouped probit model fits the data remarkably well. These data are also reported in the panel 2 of Figure 9. One can clearly see the large dispersion in children’s economic activity within (and between) countries.
106. As an additional check, column 3 of Table 15 controls for the different proportion of boys and girls and children in rural and urban areas across surveys. In order to compute a counterfactual distribution of children’s economic activity that abstracts from differences in the sample composition along these dimensions or not, we assume an equal proportion of boys and girls (50 percent) and that for each of these groups, 70 percent live in rural areas and 30 percent in urban areas. These are averages across all countries in the sample. Again, estimates of mean children’s economic activity change only very slightly (from 30.1 to 29.2). This can also be seen in panel 3 of Figure 9. The overall within variance falls by around two percent (from 95.4 to 93.3) implying that compositional differences play a very modest role in explaining differences within countries.
107. In column 4, we control additionally for differences in children’s economic activity across years. Because different surveys refer to different years, the differences in the estimates across years might in part be ascribed to this channel. We report predictions that refer to the mid-year (2002), although estimates that refer to other years (not reported) are very similar. The contribution of the year effects to explain differences in the estimates is small. This is confirmed visually in panel 4 of Figure 9: differences between Panel 4 and Panel 3 appear negligible.
108. We finally control for type of question, and overlapping between interview time and school term time. We present two sets of estimates: one where we assume that all surveys record children’s economic activity using the main occupation question and are run when children are in school (column 5) and one where we assume that all surveys use the long question and record children’s economic activity at a time when children are out of school (column 6). These can be thought of as extreme case scenarios for estimating the incidence of children’s economic activity across surveys. Notice that because the grouped probit model is not a linear model, these counterfactual distributions will potentially give rise to different estimates not only in the levels but also in the variance of children’s economic activity.
109. When we consider the estimates obtained assuming that surveys use the main activity question and are carried out during school term (column 5), the estimated level of children’s economic activity across all countries in the sample falls from 30.1 to 20.1. The within variance falls from 89.1 to 46.4. Taken at face value, these estimates imply that around 50 percent of the

40
TOWARDS CONSISTENCY IN CHILD LABOUR MEASUREMENT: ASSESSING THE
COMPARABILITY OF ESTIMATES GENERATED BY DIFFERENT SURVEY INSTRUMENTS
estimated differences in children’s economic activity within countries can be ascribed to differences in the type of questions used in different surveys or to the reference period. Still, we are unable to account for 50 percent of the observed differences, implying that unobservable characteristics associated to different survey instruments (e.g. interviewer's training, order of question, identity of the respondent and etc.) still play a significant role in explaining the estimated differences.
110. Panel 5 of Figure 9 reports these estimated differences. One can see a clear fall in the dispersion both between and within countries and an overall fall in the estimated incidence of children’s economic activity. In column 6 we report the results for the scenario that assumes that all surveys are carried out during the school holiday period and that they utilise the long version of the questionnaire. Both of these latter elements tend to generate higher estimates of children’s economic activity. Indeed, the average estimated level of children’s economic activity in this scenario rises to 49.4 (from 30.1). Still, compared to column 4, the variance falls by around seven percent (from 89.1 to 82.1). That both the levels and the variance of children’s economic activity do not fall considerably (and actually the former rises) under worst case scenario estimates, is confirmed in Panel 6 of Figure 9.
111. In sum, we estimate that the contribution of observable survey characteristics in explaining the variation in the estimated levels of children’s economic activity across surveys varies between eight percent and 48 percent. Unobservable differences therefore account for more than half the observed variation (between 52 percent and 92 percent).
Figure 9. Actual and counterfactual employment rate by country, children 10-14.
Panel 1: Actual Panel 2: Predicted
020
4060
80
0 20 40 60 80average
average CWIQPS DHSMICS LFSSIMPOC LSMSIS
020
4060
80
0 20 40 60 80average
average CWIQPS DHSMICS LFSSIMPOC LSMSIS

41 UCW WORKING PAPER SERIES, JUNE 2010
Panel 3: Predicted- Fixed gender and urban/rural distribution Panel 4. Predicted - Fixed gender and urban/rural distribution, year 2002
Panel 5.:Predicted - Fixed gender and urban/rural distribution, year 2002, main
occup., in school term
Panel 6 Predicted Fixed gender and urban/rural distribution, year 2002, long
question, outside school term
020
4060
80
0 20 40 60 80average
average CWIQPS DHSMICS LFSSIMPOC LSMSIS
020
4060
80
0 20 40 60 80average
average CWIQPS DHSMICS LFSSIMPOC LSMSIS
020
4060
80
0 20 40 60 80average
average CWIQPS DHSMICS LFSSIMPOC LSMSIS
020
40
608
0
0 20 40 60 80average
average CWIQPS DHSMICS LFSSIMPOC LSMSIS

42
TOWARDS CONSISTENCY IN CHILD LABOUR MEASUREMENT: ASSESSING THE
COMPARABILITY OF ESTIMATES GENERATED BY DIFFERENT SURVEY INSTRUMENTS
Figure 10. Counterfactual rate of involvement in economic activity, children 10-14 years
112. Figure 10 illustrates how differences across surveys in terms of observables influence not only the estimated level of children’s economic activity, but also the relative position of different countries. We plot the predicted values from model 6 together with the predicted values obtained assuming that all surveys are SIMPOC and that they are carried out during the school term with the simplest questionnaire. In other words, we compare average observed estimates with those that can be obtained by “standardising” the estimates on the basis of observables. The graph clearly demonstrates how the relative position of countries changes once differences in observables are considered. See, for example, the inversion in the ranking between Ghana and Bolivia, or between Senegal and Côte d’Ivoire.
113. It is possible to use the information gathered through our econometric analysis to produce “harmonised” children’s economic activity estimates on the basis of observable survey characteristics. It has to be made clear that such a harmonisation can only be relative, i.e., obtained conditioning of certain values of the observables and of the unobservables as captured by the survey dummies. This will generate a set of estimates for each set of assumptions relative to the observables and unobservables, but will not offer no guidance as to which is the “best” basis for harmonisation.
114. Table 16 and Figure 11 clearly illustrate this point. Both columns present estimates “harmonised” obtained by generating expecting values from Model 6. Scenario I assumes that all surveys share the same unobserved characteristic as SIMPOC, that they are carried out during the school term and with the simplest questionnaire. The second scenario, continues to assume that the reference surveys is SIMPOC, but consider the surveys as carried out with a long questionnaire and outside the school term.
115. As it is easy to see, “harmonisation” can lead to quite different sets of results and this leave of course open the question of where the “preferred” estimates should lie. Finally, given the still relatively limited number of observations and the difficulty of clearly define even the observable characteristics of a survey, we should stress that the exercise just described is
0
10
20
30
40
50
60
70
80
Pan
ama
Egy
pt
Col
ombi
a
Sao
Tom
e
Hon
dura
s
Par
agua
y
IE S
alva
d
Dom
inic
an
Ban
glad
es
Leso
tho
Gha
na
Bol
ivia
Gua
tem
…
Sen
egal
Cot
e d'
Iv
Zam
bia
Cam
erun
Mal
awi
Mal
i
Cam
bodi
a
Bur
kina
F
Tog
o
Eth
iopi
a
Cha
d
percent
Predicted, base SIMPOC, scenario I
Predicted

43 UCW WORKING PAPER SERIES, JUNE 2010
aimed more at illustrate the challenges of “harmonisation” than at generating actual “harmonised” estimates.
Table 16. Counterfactual employment rate by country, children 10-14 years old
Country “Harmonised” estimates
Scenario I:
SIMPOC survey; Fixed gender and urban/rural distribution, year 2002, main occup., in school term
“Harmonised” estimates
Scenario II:
SIMPOC survey; Fixed gender and urban/rural distribution, year 2002; long question, outside school
term
1.Bangladesh 15.9 48.1
2.Bolivia 20.3 54.8
3.Cameroon 24.1 59.7
4.Chad 51.6 83.9
5.Burkina Faso 61.5 89.3
6.Egypt 5.2 25.2
7.Ethiopia 30.2 66.7
8.Ghana 25.1 61.0
9.Colombia 12.6 42.2
10.Dominican Republic 11.9 40.9
11.Lesotho 13.4 43.8
12.Malawi 38.1 74.1
13.Mali 49.8 82.8
14.Panama 5.8 26.9
15.Paraguay 9.4 35.8
16.Sao Tome e Pr 7.0 30.0
17.Senegal 26.6 62.8
18.Togo 40.6 76.1
19.Zambia 20.4 54.9
20.Cote d'Ivoire 24.7 60.5
21.IE Salvador 18.5 52.1
22.Guatemala 17.7 50.9
23.Honduras 11.6 40.4
24.Cambodia 54.8 85.8
Figure 11. Counterfactual employment rate by country, children 10-14
0
10
20
30
40
50
60
70
80
90
100
Pan
ama
Egy
pt
Col
ombi
a
Sao
Tom
e
Hon
dura
s
Par
agua
y
IE S
alva
d
Dom
inic
an
Ban
glad
es
Leso
tho
Gha
na
Bol
ivia
Gua
tem
ala
Sen
egal
Cot
e d'
Iv
Zam
bia
Cam
erun
Mal
awi
Mal
i
Cam
bodi
a
Bur
kina
F
Tog
o
Eth
iopi
a
Cha
d
percent
Predicted, base SIMPOC, scenario I
Predicted, base SIMPOC, scenario II

44
TOWARDS CONSISTENCY IN CHILD LABOUR MEASUREMENT: ASSESSING THE
COMPARABILITY OF ESTIMATES GENERATED BY DIFFERENT SURVEY INSTRUMENTS
9. CONCLUSION
116. The preceding discussion underscores that there is no single answer regarding why children’s economic activity estimates often differ depending on the survey instrument on which they are based. These differences are significant and often relatively large. The variance around the point estimates obtained by the various surveys in the same countries is such that it is difficult to reconcile then in any easy way. Moreover, this “noise” in the children’s economic activity estimates is such that it might complication the identification of any trend component when comparing different surveys for different years. The paper has described and tested such differences in detail.
117. It should be stressed that such problems are not present, or better are much less relevant, when estimating the other prevalent child activity: school attendance.
118. If we look at the spectrum of children activities, we see that school attendance is identified quite consistently across surveys. At the other end of the spectrum, surveys are relatively more consistent in estimating the number of children working for a wage (in money or in kind). The main area of ambiguity concerns the group of children that do not work for pay, for their parents and that combine school and work. This is not surprising, as these are areas where the differences in surveys structure are likely to be more relevant as they are trying to capture a not well defined phenomenon.
119. The effectiveness of survey instruments in capturing the interaction between children’s work and schooling is hence an important factor in explaining differences in child labour estimates in many instances. Some general purpose survey instruments appear to treat children’s work and schooling largely as mutually exclusive categories, with working students consequently classified as non-working students leading to lower overall estimates of children’s work.
120. We have tried to asses which observable characteristics of the various surveys play a role in generating the differences in estimates. Evidence presented in this study does point to the importance of many survey characteristics. The specific elements of survey features that are important, however, vary on a case by case basis. We have identified two elements that appear to be relevant: questionnaire and season of field work.
121. Our estimates indicate that these elements do in fact play a significant role and are able to explain between one-tenth and one-half of the variance of the children’s economic activity estimates across different surveys. The fact that observables play an important role points to a need to deepen the research by experimental studies and by identifying other relevant survey characteristics.
122. We have used the estimates based on observables to produce example of harmonised estimates: the results are twofold. First, they show that it is indeed possible to use available information to “correct” for different survey characteristics and therefore obtain more comparable estimates. But second, the large variance unexplained by observable characteristics, lends significant weight in the “harmonisation” process to the survey dummies

45 UCW WORKING PAPER SERIES, JUNE 2010
capturing all of the unobserved characteristics. The resulting harmonised estimates are therefore dependent to a relatively large extent by information contained in a “black box”.
123. In order to open the box, less visible and/or less tangible elements of the survey process (including interview methods, the familiarity of interviewers with child labour concepts, the accuracy of data coding and processing, etc.) must be analysed, but this is currently difficult in most cases on the basis of the survey documentation available to external researchers or data users. These elements should be explored in more detail through direct discussions with counterparts from national statistical offices charged with the actual implementation of child labour surveys.
124. Also, as already mentioned, is likely that part of the answer we are looking for can only be obtained by a set of controlled experiments. Given the amount of resources allocated to the policy actions that focus directly or indirectly on children’s economic activity, an investment in controlled experiments is likely to have a large pay off.
125. One implication of the preceding discussion for the construction of future surveys on child labour is, however, clear: there needs to be a much greater degree of standardisation in the questions on children’s economic activity used in various surveys instruments to collect information on the child labour phenomenon. Currently, child labour questions differ across survey instruments not only in terms of their level of detail and specific phrasing, but also in terms of the actual productive activities that they capture. The System of National Accounts constitutes the only common frame of reference and conceptual basis for classifying children’s time use and should therefore be a central reference in the design of questions on children’s economic and non-economic production. Standardised questions need not of course be at the expense of other questions tailored to the specific realities of the country in question, but rather can be an additional survey element aimed at generating data suitable for international comparison.
126. Greater consistency is also needed in terms of what time of the year data are collected and in terms of to whom questions relating to child labour are asked. Children’s economic activity can vary considerably in the different seasons of the year and it therefore makes little sense to draw comparisons between estimates referring to different seasons. Responses regarding children’s involvement in economic activity can also vary considerably depending on who in the household is asked, and again this limits the ability to draw comparisons between estimates based on responses from different household members.

46
TOWARDS CONSISTENCY IN CHILD LABOUR MEASUREMENT: ASSESSING THE
COMPARABILITY OF ESTIMATES GENERATED BY DIFFERENT SURVEY INSTRUMENTS
REFERENCES
Abadie A., Drukker, D., Herr, J.L. and Imbens, G.W. (2001). Implementing Matching
Estimators for Average Treatment Effects in Stata. The Stata Journal 2001, 1, pp. 1-
18
Bardasi, E., Beegle, K., Dillon, A., Sernels, P. (2009). What Explains Variation in
Child Labor Statistics? Evidence from a Survey Experiment in Tanzania. Presented at
the 2nd IZA Workshop: Child Labor in Developing Countries, Bonn.
Blunch N.H., Dar A., Guarcello L., Lyon S., Ritualo A.R. and Rosati F.C., Children's
Work in Zambia: A Comparative Study of Survey Instruments, UCW Project working
paper, September 2002.
Dillon, A. (2009). Measuring child labor : Comparisons between hours data and
subjective measures. International Food Policy Research Institute (IFPRI).
Discussion Paper 879. Washington, D.C.
Grosh, M., Muñoz, J. ( 1996). A Manual for Planning and Implementing the Living
Standards Measurement Study Surveys. LSMS Working Paper n.126, The World
Bank
Guarcello L. and Lyon S. (2005). “Child labour in Bolivia: A comparison of estimates
from MECOVI and MICS survey instruments”, in Minujin A., Delamonica E., and
Komarecki M., Eds., Human Rights and Social Policies for Children and Women:
The Multiple Indicator Cluster Survey (MICS) in Practice, New School University
and UNICEF, 2005.
ILO, 2006. The End of Child Labour: Within Reach. International Labour Office,
Geneva, 2006.
SIMPOC, 2004. Child Labour Statistics. Manual on methodologies for data collection
through surveys. International Labour Office, Geneva, 2004.
Kish, L. (1965). Survey Sampling. Wiley, New York
Pettersson, H., Silva P., (2005). Analysis of design effects for surveys in developing
countries. In Household Sample Surveys in Developing and Transition Coutries,
UNSTATS, Department of Economic and Social Affairs, Statistics Division. Series F
No 96, New York 2005.
Sheskin, D. J. (2004). Handbook of Parametric and Nonparametric Statistical
Procedures. Boca Raton, FL: Chapman & Hall/CRC, 2004
Verma, V. 2008. Sampling for Household-Based Surveys of Child Labour.
International Labour Office, Geneva, 2008

47 UCW WORKING PAPER SERIES, JUNE 2010
UNICEF (2005). Multiple Indicator Cluster Survey Manual (MICS-3). Monitoring the
Situation of Children and Women. Division of policy and Planning. Unicef. New
York.
UNICEF (2000). Monitoring Progress Toward the Goals of the World Summit for
Children. End Decade Multiple Indicator Survey Manual (MICS 2). Division of
Evaluation Policy and Planning. Unicef. New York

48
TOWARDS CONSISTENCY IN CHILD LABOUR MEASUREMENT: ASSESSING THE
COMPARABILITY OF ESTIMATES GENERATED BY DIFFERENT SURVEY INSTRUMENTS
ANNEX 1. SURVEY CHARACTERISTICS (NINE SAMPLE COUNTRIES)
Country Survey type
and name
Survey characteristics
Total sample size Field work
period
Reference
period
Question
Type
Bangladesh
DHS - Demographic and Health Survey
55,883 Jan.-May 2004 Economic activity: current
School attendance: current
Simple form
SIMPOC- Child Labor Survey
192,874 Oct.-Nov. 2002 Economic activity: 7 days
School attendance: 7 days
Simple form
Senegal
DHS - Demographic and Health Survey
69,054 Feb.-June 2005 Economic activity: 7 days
School attendance: current
Simple form
SIMPOC- Child Labor Survey
35,024 2005
Economic activity: 7 days
School attendance: current
Long form
Bolivia
LSMS- Encuesta Continua de Hogares
20,815 Nov.-Dec. 2000
Economic activity: 7 days
School attendance: current
Long form
MICS2-Multiple Indicator Cluster Survey 2
19,530 Sept.- Nov. 2000
Economic activity: 7 days
School attendance: current
Simple form
Sao Tome e Principe
LSMS-l’ Enquete nationale sur les conditions de vie des menages
11,005 Nov. 2000 – Feb. 2001
Economic activity: List of the main occupations
School attendance: Is a child at school?
Multiple Indicator Cluster Survey 2-
14,251 Feb.-Sept. 2000
Economic activity: 7 days
School attendance: current
Simple form
Kenya
SIMPOC-Child Labour Module of Integrated Labour Force Survey
Dec. 1998 – Feb. 1999
Economic activity: 7 days
School attendance: Is a child at school full time?
Simple form
MICS2-Multiple Indicator Cluster Survey 2
45,501 Sept.- Oct. 000
Economic activity: 7 days
School attendance: current
Simple form
Lesotho
CWIQ-Lesotho Core Welfare Indicators Questionnaire Survey
22,031 April-June 2002
Economic activity: 7 days
School attendance: current
Simple form
MICS2-Multiple Indicator Cluster Survey 2
32,710 Feb.-Oct. 2000 Economic activity: 7 days
School attendance:
Simple form

49 UCW WORKING PAPER SERIES, JUNE 2010
Country Survey type
and name
Survey characteristics
Total sample size Field work
period
Reference
period
Question
Type
current
Brazil
PNAD-Pesquisa Nacional por Amostra de Domicilios
384,834 2003
Economic activity: 7 days
School attendance: Does child attend school or kindergarten?
Long form
PNAD Pesquisa Nacional por Amostra de Domicilios
399,354 2004
Economic activity: 7 days
School attendance: Does child attend school or kindergarten?
Long form
Ghana
SIMPOC-Child Labour Survey
47,956 Dec. 2000
Economic activity: 7 days
School attendance: current
Simple form
CWIQ-Core Welfare Indicators Questionnaire
210,153 Jan.-May
2003
Economic activity: 7 days
School attendance: current
Simple form
Cameroon
MICS2-Multiple Indicator Cluster Survey
24,525 July-August,
2000(a)
Economic activity: 7 days
School attendance: current
Priority Survey 56,443 Oct. – Dec. 2001
Economic activity:
School attendance: current
List of main occupations
Notes: (a) Summer holidays and rainy season

50
TOWARDS CONSISTENCY IN CHILD LABOUR MEASUREMENT: ASSESSING THE
COMPARABILITY OF ESTIMATES GENERATED BY DIFFERENT SURVEY INSTRUMENTS
ANNEX 2. QUESTIONS RELATING TO CHILDREN’S WORK AND SCHOOLING FROM COMMON SURVEY INSTRUMENTS
Survey School attendance def. Economic activity def. Working hours def.
MICS-2
+
DHS
Standard ex.
MICS: Chad/2000, Cameroon/2000, Bolivia/2000, Kenya/2000, Lesotho/2000-particular,
DHS: , Mali/2001, Malawi/2004
1.Is he/she currently attending school?
2.During the current school year, did he/she attend school at any time?
3.Did he/she attended school last year?
*MICS: the reference age is 5-17
*DHS: the reference age varies by survey (6+, 5+,5-24, 3-24)
(1+2):
1.During the past week ,did he/she do any kind of work for someone who
is not a member of this household?
2.During the past week, did he/she do any other family work (on the farm
or in a business?)
*MICS: the reference age is 5-14, for some countries 5-17
*DHS: the reference age varies by survey (5-14, 5-17,6+, 8+)
Total weekly working hours =1+2
1.About how many hours (per week) did he/she do this work for someone
who is not a member of this household?
2. About how many hours (per week) did he/she do this work for family?
Particular DHS surveys
Note: in the Egyptian DHS/2005, there are only questions 2-3.
Chad/2004, Bangladesh/2004:
Is he/she currently attending school?
Note, there is an additional question for the MICS and some DHS
(Egypt/2005, Mali/2001, Chad/2004):
At any time during the past year, did he/she do any kind of work for
someone who is not a member of this household?
Note: in the Egyptian DHS/2005 the “standard” questions were asked, but
with adding at the end of each above question “even if it was for a short
period of time?”.
Bangladesh/2004:
Is he/she currently working?
Egypt/2000:
Did he/she work during the last month?
Note: the Senegal DHS/2005 asks only about working hours outside of the
household.
Bangladesh/2004, Egypt/2000:
Working hours are not available

51 UCW WORKING PAPER SERIES, JUNE 2010
Survey School attendance def. Economic activity def. Working hours def.
CWIQ
Ex.: Ghana/2002, Lesotho/2002
1.Is he/she currently in school/
2. Did he/she attend school last year?
1.Did he/she do any type of work in the last 7 days.
*The reference age is 5+
Working hours are not available
National
LFS
There is no common pattern, each case is very particular, in what follows we present some examples
Ethiopia/2001:
1.In the current academic year , does he/she attend school or training
institution? What type?
2.During last week was he/she attending school or training institution?
Ethiopia/2005 (literacy=attendance):
Can you read and write?
Ethiopia/2001:
1.During last 7 days have you worked in:
i) agriculture; ii) as an employee for Government/Private enterprise; iii) as
merchant; iv) as service giving agent be it private or salaried? v) Have you
produced goods for sale? vi) Have you produced permanent goods for
your family? vii) Have you engaged in productive activity for your family
without payment? viii) Other productive activity?
If 1 is no for i-viii:
2.Did you any unpaid work to help for family gain in family business or
family farm during last 7 days?
3. Question1 has been also repeated regarding to the economic activity
during the last 12 months.
Ethiopia/2005:
There is no direct question about economic activity status. Economic
activity can be determined trough working hours per week.
Ethiopia/2001 and Ethiopia/2005:
Excluding lunch and journey time in total for how many hours did you work
on each day at all jobs in the last 7 days? (translated to the working hours
per week)

52
TOWARDS CONSISTENCY IN CHILD LABOUR MEASUREMENT: ASSESSING THE
COMPARABILITY OF ESTIMATES GENERATED BY DIFFERENT SURVEY INSTRUMENTS
Survey School attendance def. Economic activity def. Working hours def.
National
LFS
Egypt/1998:
Did you go to school? (choice among the following options: never been,
have been to school in the past, studying in present)
*The reference age by survey (5+, 6+, 5-17)
Egypt/1998:
There are two blocks: employment position was asked during the
reference week ending 31 October 1998 and during the last 3 months.
1.Did you participate in any employment during the week (last three
months) ending 31 October 1998?
If 1 no:
2. Did you participate during the week (last three months) ending 31
October 1998 for a short period or irregular periods in any of the following
activities? (i) produce goods sold at shops or project; ii) offer paid services
to other; iii) produce goods and selling it yourself; iv) buying goods and re-
selling it yourself; v) independent paid work; vi) helping in family’s
business; vii) participate in project-agricultural or keep poultry and
livestock; viii) learn a skill in a factory or garage.
If 2 is no for i-viii:
3*. Did you participate in any agricultural production, or keeping of poultry
and livestock for family consumption?
*The reference age varies by survey (5+,6+, 10+)
Egypt/1998:
I. Referring the last week:
1. What is the number of hours of work on average (per day and per
week)
If 3* is yes:
a) How many days do you weekly spend in this activity?
b) How many hours per day and week (in average) do you spend in this
activity?
PS
Variables are described in the “Reference Manual: Standardized file” by wb102942
(ex. Cameroon/2001)
School attendance at time of survey.
*The reference age is 5+
Main occupation (choice among the following options: employed,
unemployed, homemaker, retired, student, dependent, other)
*The reference age is 5+
The total time worked in the main occupation and all secondary
occupations in a week.

53 UCW WORKING PAPER SERIES, JUNE 2010
Survey School attendance def. Economic activity def. Working hours def.
SIMPOC
There is no common pattern, each case is very particular, in what follows we present some examples
Ghana/2000:
Has he/she ever attended or is attending school/training now? (choice among the following options: never attended, still attending, past (left school))
Kenya/1998/99:
At school full time?
Ghana/2000:
1. Did he/she work for pay or profit or family gain? (reply adults , refer to last 7 days)
2.Did YOU engage in any economic activity at any time during the last 12 months? (reply children aged 5-17)
Kenya/1998/99:
1.Did member hold a job or work for pay, profit or family gain last week?
If 1 no
2.Did member work during last 12 months?
Mali/2005, Senegal/2005:
1.Did he/she worked during last week?
If 1 is no
2.Did he/she worked during the last week for: i) payment; ii) payment in kind; iii) self-employment iv) own enterprise. v) Did he/she do unpaid work for family.
If 2 i)-v) are no
3) .Did he/she worked during the last week for payment or own consumption or other person from the following list:
1. Cultiver ou récolter les produits agricoles ou attraper ou ramasser les poisons ou fruits de mer ou des activités connexes? ; 2. Préparer la nourriture, vêtements ou travaux d’artisanat pour vendre? 3. Vente d’ articles, journaux, boisson, nourriture ou produits agricoles?; 4. Laver, repasser, nettoyer, réparer des outils ou équipement pour quelqu’un d’autre contre paiement en espèce ou en nature?, 5. Transport de marchandises au marché ou pour stocker ou autres activités relatives au transport des marchandises pour vente?; 6. Construction, maintenance des bâtiments, maisons ou voiture pour quelqu’un d’autre? (for Senegal also there are : 7. Laver les voitures et cirer les chaussures ?;8. S’occuper des animaux domestiques ? )
Ghana/2000:
Working hours are not available
Kenya/1998/99:
Hours worked last week
Mali/2005, Senegal/2005:
1.How many hours a day do you usually work?
2.How many days did you work during last week?
3.How many hours did you work during last week?
Mali/2005, Senegal/2005:
Is he/she currently attending school? (for Senegal choice among the following options: yes/formal; yes/ informal, no)
2. During the current school year, did he/she attend school at any time?
3.During the previous school year did he/she attended school ?

54
TOWARDS CONSISTENCY IN CHILD LABOUR MEASUREMENT: ASSESSING THE
COMPARABILITY OF ESTIMATES GENERATED BY DIFFERENT SURVEY INSTRUMENTS
SIMPOC
(cont’d)
Argentina/2004:
Are you currently attending school?
Argentina/2004 (1+2+3+4):
1.Did you do any of the following activities (building/house repair,
cultivation for the household consumption, animal raising for household
consumption) in your house during the last week, for how many hours ?
2.Did you do any of the following activities (help in the business, farm and
etc., care of children/sick/elder outside the household, work in a shop, cut
trees for money, selling in the street or other places, cleaners of cars in
the street, service provision for pay outside of the household) during the
last week (and year)?
3. Were you engaged in some of the following activities (food distribution,
transportation of products, cleaning of houses or shops, washing/ironing
clothes outside of the household, collecting papers/bottles/plastic to sell,
preparing food to sell, making the handmade products to sell, helping to
build or repair other’s houses, professional sport, involved in the
model/television/ advertising business) during the last week (and year)?
4. Were you engaged in some of the following activities (cultivating to sell,
animal raising for selling, packing fruits/vegetables to sell, working in brick
oven, cut tobacco, field irrigation)
during the last week (and year)?
5. Did you do any other activity for payment in cash or in kind during the
last week (and year)?
6.Did you help to someone to gain money during the last week (and
year)?
Argentina/2004 :
How many hours did you dedicate to the main activity during each day in
the last week? Compute the total working hours in the main activity during
the last week.
Honduras/2002:
Do you currently attend an educational establishment?
Honduras/2002:
1.During the last week, did you dedicate an hour or more to some job or
activity with pay in cash or in another from or did you have any earnings?
(except household chores)
2.During last week, did you carry out or help carry out any job without
pay? (except household chores)
Honduras/2002:
1.How many hours did you work last week?
2.How many total hours do you normally work per week?

55 UCW WORKING PAPER SERIES, JUNE 2010
SIMPOC
(cont’d)
Panama/2000:
Are you currently attending school?
Panama/2000:
I. There is a chain of the following 4 questions, the next is asked only if the answer on the previous one was “no”:
I.1.Did you work last week?
I.2.Do you have a job and were you absent from it last week for sickness, vacation, leave, or other motive
I.3.Did you do some work last week for which you received money, such as selling lottery, newspapers, cooking, ironing, etc.
I.4.Last week, did you work with a family members in their business, firm, or farm for 15 or more hours?
II. Did you work at any time during the last year?
Panama/2000:
How many hours did you work last week on your job?
Bangladesh/2002/03:
During last week, were you attending school or training institution? (choice
among the following options: yes/full time, yes/part time, no)
*The reference age varies by (4+,5+,5-17)
Bangladesh/2002/03:
I.1Is he/she engaged in any work last week (economic and/or non-
economic) either before or after school or training institutions?
Only if yes in I.1 and he/she is engaged in the economic activity during
last week):
I.2. In which of the following work is he /she engaged during last week:
work for wages, salary, engaged in household enterprise, self-
employed/own account work.
II. Does he/she work other than households for wages/salaries/profits?
III. Did he/she work for at least one hour on any day during last week for
pay or profit, family gain or for own final use or consumption?
III. Did he/she do any economic activity at any time during last year as
paid or unpaid worker or for profit or family gain or for own final or
consumption(excluding housekeeping and household chores)?
*The reference age varies by survey (5+,5-17)
Bangladesh/2002/03:
I. How many hours did he/she actually work last week: a) for economic
activity, b) non-eco. activity?
II. How many hours did he/she actually work during last week?
Note: in the data, weekly working hours reported in section I do not
correspond to those reported in section II for many individuals.

56
TOWARDS CONSISTENCY IN CHILD LABOUR MEASUREMENT: ASSESSING THE
COMPARABILITY OF ESTIMATES GENERATED BY DIFFERENT SURVEY INSTRUMENTS
Survey School attendance def. Economic activity def. Working hours def.
LSMS
There is no common pattern, each case is very particular, in what follows we present some examples
Bolivia 1999/2000:
1.This year did you enroll in school (to any course or school grade, basic,
secondary or higher) ?
2. Are you currently attending such course or grade ?
3. For which reasons you didn’t enroll or you are not currently attending
(holidays, strike) ?
Nicaragua 2001:
1. This year did you attend or are you attending:
1.a.Children's Dining Room/CICO; 1.b.CDI/nursery school; 1.c.Pre-school;
1.d.School;
2. This year did you enroll in the formal school system ?
*The reference age varies by survey (5+,7+)
Bolivia 1999/2000:
1.During last week did you work for at least an hour ?
2. During last week did you spend at least an hour for the following
activities:
working in agriculture or animal raising;
working or helping in the family business; selling on the streets; preparing
food, spinning, weaving, sewing or engaging in other activities for sale;
providing services for payment; other activity for payment ?
Nicaragua 2001:
I.1.Did you work during the past week, even though not paid?
I.2. If 1 no, reply to a-f:
a. Neither for an hour?
I.2.b. Neither helping in the family business?
I.2.c. Neither as unpaid apprentice?
I.2.d. Neither selling some product on the street or in another place?
I.2.e. Neither helping on a family farm?
I.2.f. Neither washing cars, shoes, throwing garbage or other bearings?
II. During the last 12 months did you engage in other jobs other than the
one carried out during the last week?
*The reference age varies by survey (6+,7+)
Bolivia 1999/2000:
1.How many days did you work during the past week?
2.How many hours a day did you work on average during the past week?
Nicaragua 2001:
During the past week how many total hours did you work in all the
activities you engaged in?

57 UCW WORKING PAPER SERIES, JUNE 2010
ANNEX 3. DETAILED COMPARATIVE TABLES
Table A1. Bangladesh
Cou
ntry
Sur
vey
type
Survey Name and
total sample size
Total expanded
sample size/
expanded 10-14
sample size (M/F)
Expanded
numbers of
urban/rural
Distribution by
regions
School Attendance
[attend only]
Economic activity
[work only]
Average working hour
per week or
per day*
Field work
period
region % age M F T age M F T age M F T
BA
NG
LAD
ES
H
DH
S
Demography and
Health Survey,
2004
[55,883]
136,822,774/
16,782,807
(8,364,283/
8,418,524)
29,760,498/
107,062,276
barisal 6.5
5-9 74.9 77.4 76.1 5-9 - - - 5-9 - - -
January - May
2004
chittagong 19.7
dhaka 31.0
10-1
4 72.9
[70.3]
78.8
[78.0]
75.8
[74.2] 10-1
4 17.8
[15.2]
4.7
[4.0]
11.2
[9.6] 10-1
4
- - - khulna 11.6
rajshahi 23.9
15-1
7 40.0
[35.6]
37.4
[36.5]
38.6
[36.1] 15-1
7 53.0
[48.6]
9.7
[8.7]
28.2
[25.8] 15-1
7
- - - sylhet 7.4
Current economic activity , simple form of question
Current school attendance
SIM
PO
C
Child Labour
Survey
2002-2003
[192,874]
129,603,512/
16,425,389
(8,671,026/
7,754,362)
29448,017/
100,155,495
-
5-9 81.2
[80.5]
84.0
[83.4]
82.5
[81.9] 5-9 1.9
[1.2]
1.2
[0.6]
1.6
[0.9] 5-9 23.7 22.4 22.9
October-
November
2002
10-1
4 78.6
[61.5]
87.3
[81.0]
82.7
[70.7] 10-1
4 35.8
[18.7]
15.3
[9.0]
26.1
[14.1] 10-1
4
26.1 19.7 24.3
15-1
7 53.6
[48.0]
68.4
[66.8]
59.5
[55.4] 15-1
7 47.5
[41.8]
21.8
[20.2]
37.3
[33.3] 15-1
7
38.2 27.4 35.7
Reference period of the economic activity - 7 days, simple form of questionnaires
Last week school attendance

58
TOWARDS CONSISTENCY IN CHILD LABOUR MEASUREMENT: ASSESSING THE
COMPARABILITY OF ESTIMATES GENERATED BY DIFFERENT SURVEY INSTRUMENTS
Table A2. Bolivia
Cou
ntry
Sur
vey
type
Survey Name and total
sample size
Total expanded sample size/ expanded 10-14
sample size (M/F)
Expanded numbers
of urban/rural Distribution by regions
School Attendance
[attend only]
Economic activity
[work only]
Average working
hour
per week or
per day*
Field work period
region % age M F T age M F T age M F T
BO
LIV
IA
LSM
S
Encuesta Continua de
Hogares
2000
[20,815]
8,274,803/ 1,043,877
(537,132/ 506,745)
3,006,277/
5,268,526
chuquisaca 8.2
5-9 81.4 84.0 82.7 5-9 - - - 5-9 - - -
November-December,
2000
la paz 23.1
cochabamba 21.3
oruro -
10-1
4 93.4
[73.9]
87.8
[72.5]
90.6
[73.2] 10-1
4 23.6
[4.1]
22.1
[6.8]
22.9
[5.4] 10-1
4
28.9 29.6 29.2 potosí 10.8
tarija 5.6
santa cruz 25.2
15-1
7 71.8
[54.8]
71.3
[58.6]
71.5
[56.8] 15-1
7 38.7
[21.7]
30.4
[17.8]
34.5
[19.7] 15-1
7
40.6 39.8 40.2 beni 5.1
pando 0.8
Reference period of the economic activity - 7 days, simple form of question
Current school attendance
MIC
S-2
Multiple Indicator Cluster
Survey 2
2000
[19,530]
8,428,190/ 1,013,351
(506,339/ 507,012) 5,459,049/ 2,969,141
chuquisaca 7.2
5-9 84.9
[69.8]
87.2
[73.6]
86.1
[71.7] 5-9 25.5
[2.7]
21.8
[3.0]
23.7
[2.9] 5-9 13.7 13.7 13.7
September- November,
2000
la paz 29.4
cochabamba 18.6
oruro 4.8
10-1
4 94.5
[63.1]
92.1
[67.3]
93.3
[65.2] 10-1
4 35.1
[3.6]
29.0
[4.2]
32.0
[3.9] 10-1
4
14.9 16.1 15.4 potosí 9.5
tarija 4.9
santa cruz 22.1
15-1
7
81.7 75.1 78.2
15-1
7
- - -
15-1
7
- - - beni 3.2
pando 0.3
Reference period of the economic activity - 7 days, simple form of questionnaires
Current school attendance

59 UCW WORKING PAPER SERIES, JUNE 2010
Table A3. Brazil
Cou
ntry
Sur
vey
type
Survey Name and total sample size Total expanded sample size/ expanded 10-
14 sample size (M/F)
Expanded numbers of
urban/rural Distribution by regions
School Attendance
[attend only]
Economic activity
[work only]
Average working
hour
per week or
per day*
Field
work
period
region % age M F T age M F T age M F T
BR
AZ
IL
PN
AD
Pesquisa Nacional por Amostra de
Domicilios
2003
[384,834]
173,966,052/ 16,286,941
(8,306,349/ 7,980,592)
146,679,752/
27,286,300
-
5-9 89.4
[87.9]
90.6
[89.9]
90.0
[88.8] 5-9 1.7
[0.1]
0.9
[0.1]
1.3
[0.1] 5-9 12.4 11.3 12.0
2003
10-1
4 97.0
[84.0]
97.3
[90.9]
97.1
[87.4] 10-1
4 13.8
[0.9]
6.8
[0.4]
10.4
[0.6] 10-1
4
20.6 19.2 20.1
15-1
7 82.0
[54.5]
82.7
[66.0]
82.4
[60.1] 15-1
7 38.4
[10.8]
22.0
[5.2]
30.3
[8.1] 15-1
7
33.4 30.5 32.3
One week reference period (21-27 September 2003), long form of question about economic activity
School attendance: Does child attend school or kindergarten?
PN
AD
Pesquisa Nacional por Amostra de
Domicilios
2004
[399,354]
182,060,108/
17,043,986
(8,669,498/
8,374,488)
151,124,470/
30,935,638
-
5-9 90.4
[88.5]
91.9
[91.1]
91.1
[89.8] 5-9 2.0
[0.1]
0.9
[0.1]
1.5
[0.1] 5-9 12.2 11.2 11.9
2004
10-1
4 96.5
[85.1]
97.1
[91.4]
96.8
[88.2] 10-1
4 13.5
[1.1]
6.5
[0.4]
10.1
[0.8] 10-1
4 20.3 19.0 19.9
15-1
7 81.3
[53.5]
82.5
[65.4]
81.9
[59.4] 15-1
7 39.5
[11.7]
22.4
[5.3]
31.1
[8.5] 15-1
7
33.2 30.6 32.3
One week reference period (19-25 September 2004), long form of questionnaires about economic activity
School attendance: Does child attend school or kindergarten?

60
TOWARDS CONSISTENCY IN CHILD LABOUR MEASUREMENT: ASSESSING THE
COMPARABILITY OF ESTIMATES GENERATED BY DIFFERENT SURVEY INSTRUMENTS
Table A4. Cameroon
Cou
ntry
Sur
vey
type
Survey Name and total sample size
Total expanded sample size/
expanded 10-14 sample size (M/F)
Expanded numbers of urban/rural
Distribution by regions School Attendance
[attend only]
Economic activity [work only]
Average working hour per week or
per day*
Field work period
region % age M F T age M F T age M F T
CA
ME
OO
N
MIC
S-2
Multiple Indicator
Cluster Survey
2000
[24,525]
15,928,737/ 2,287,931
(1,148,181/
1,139,745)
5,474,730 /
10,454,006
douala 6.7
5-9 67.9
[35.5] 64.9
[34.4] 66.4 [35.0] 5-
9 42.6 [10.5]
40.3 [9.8]
41.5 [10.2] 5-
9
17.6 15.5 16.6
July-August,
2000
Summer holidays +
rainy season
yaounde 5.2
adamaoua 2.2
centre sans yde
12.2
est 8.8
10-1
4
87.0 [29.6]
78.3 [30.0]
82.7 [29.8] 10
-14 66.8
[9.5] 61.6
[13.4] 64.2
[11.4] 10-1
4
23.5 22.2 22.9
extreme nord 17.4
littoral sans dla
3.5
nord 9.3
nord ouest 8.9
15-1
7
68.1 56.4 62.5
15-1
7
- - -
15-1
7
- - - ouest 11.7
sud 2.8
sud ouest 11.3
Reference period of the economic activity - 7 days, simple form of question Current school attendance

61 UCW WORKING PAPER SERIES, JUNE 2010
Table A4. Cameroon. Cont’d
Cou
ntry
Sur
vey
type
Survey Name and total sample size
Total expanded sample size/
expanded 10-14 sample size (M/F)
Expanded numbers of urban/rural
Distribution by regions School Attendance
[attend only]
Economic activity [work only]
Average working hour per week or
per day*
Field work period
CA
ME
RO
ON
PS
Priority Survey
2001
[56,443]
15,472,557/ 2,056,541
(1,045,563/
1,010,978)
5,383,103 /
10,089,454
douala 9.7
5-9
68.0 63.7 65.9 5-9
- - - 5-9
- - -
October –December
2001
yaounde 8.7
adamaoua 4.5
centre sans yde 7.9
est 4.8
10-1
4 87.8 [79.9]
81.3 [74.1]
84.6 [77.1] 10
-14 14.5
[6.5] 17.4 [10.2]
15.9 [8.4] 10
-14
26.8 26.8 26.8 extreme nord 17.7
littoral sans dla 4.9
nord 7.3
nord ouest 11.5
15-1
7
70.8 [62.4]
54.6 [49.8]
62.9 [56.2] 15
-17 27.8
[19.5] 29.8 [24.9]
28.8 [22.2] 15
-17
37.0 31.8 34.3 ouest 12.1
sud 3.5
sud ouest 7.5
List of the main occupations Current school attendance

62
TOWARDS CONSISTENCY IN CHILD LABOUR MEASUREMENT: ASSESSING THE
COMPARABILITY OF ESTIMATES GENERATED BY DIFFERENT SURVEY INSTRUMENTS
Table A5. Ghana
Cou
ntry
Sur
vey
type
Survey Name and total sample size Total expanded sample size/ expanded 10-14 sample size (M/F) Expanded numbers of urban/rural Distribution by regions
School Attendance
[attend only]
Economic activity
[work only]
Average working hour per week or
per day*
Field work
period
region % age M F T age M F T age M F T
GH
AN
A
SIM
PO
C
Child Labour Survey
2000
[47,956]
17,918,314/ 2,516,860
(1,318,948/ 1,197,912) 7,103,418/ 10,814,896
western 9.8
5-9 77.9
[69.2]
77.7
[69.8]
77.8
[69.5] 5-9 15.5
[6.8]
14.0
[6.1]
14.8
[6.5] 5-9 - -
December 2000
central 7.6
gt. accra 13.3
volta 8.6
10-1
4 83.0
[60.7]
81.5
[58.6]
82.3
[59.7] 10-1
4 33.8
[11.5]
34.7
[11.9]
34.2
[11.7] 10-1
4
- - eastern 11.0
ashanti 15.8
brong ahafo 9.8
15-1
7 64.5
[42.4]
59.2
[41.4]
62.0
[41.9] 15-1
7 46.7
[24.6]
45.0
[27.2]
45.9
[25.8] 15-1
7
- - northern 14.3
upper east 5.5
upper west 4.2
Reference period of the economic activity - 7 days, simple form of question
Current school attendance
CW
IQ
Core Welfare Indicators
Questionnaire
2003
[210,153]
16,740,152/ 2,234,673
(1,147,920/ 1,086,753) 7,054,619/ 9,685,533
western 10.1
5-9 77.9
[77.3]
78.1
[77.4]
78.0
[77.4] 5-9 2.5
[1.8]
2.4
[1.7]
2.5
[1.7] 5-9 - - -
2003
(January-May)
central 9.0
gt. accra 14.1
volta 9.6
10-1
4 86.6
[84.5]
84.3
[82.1]
85.5
[83.3] 10-1
4 7.8
[5.6]
7.6
[5.4]
7.7
[5.5] 10-1
4 - - - eastern 11.6
ashanti 19.1
brong ahafo 9.2
northern 10.2
15-1
7 71.9
[69.3]
65.6
[63.9]
68.9
[66.7] 15-1
7 18.3
[15.7]
18.2
[16.5]
18.3
[16.1] 15-1
7
- - -
upper
east
upper
west
Reference period of the economic activity - 7 days, simple form of questionnaires
Current school attendance

63 UCW WORKING PAPER SERIES, JUNE 2010
Table A6. Kenya
Cou
ntry
Sur
vey
type
Survey Name and total sample size
5-17 y. o.
Expanded size (M/F)
5-17 y. o.
Distribution by regions
School Attendance
[attend only]
Economic activity
[work only]
Average working hour
per week or
per day*
Field work period
region % age M F T age M F T age M F T
KE
NY
A
SIM
PO
C
Child Labour Module of Integrated Labour Force Survey
(children 5-17
years old)
10886153
(5,605,441/ 5,280,711)
nairobi 5.0
5-9 65.6
[63.3]
67.3
[65.3]
66.4
[64.2] 5-9 4.4
[2.2]
4.0
[1.9*]
4.2
[2.0] 5-9 27.4 30.0 28.5
December 1998 – January 1999
central 13.1
coast 7.4
eastern 16.7
10-1
4 75.1
[70.4]
73.5
[69.6]
74.3
[70.0] 10-1
4 8.5
[3.8]
7.6
[3.7]
8.0
[3.7] 10-1
4
34.4 38.0 36.1 north eastern 2.4
nyanza 18.7
rift valley 23.7
15-1
7 60.8
[56.4]
55.2
[51.1]
58.1
[53.8] 15-1
7 17.1
[12.7]
19.0
[14.8]
18.0
[13.7] 15-1
7
37.4 41.1 39.3 western 13.0
Reference period of the economic activity - 7 days, simple form of questionnaires
School attendance: Is a child at school full time?

64
TOWARDS CONSISTENCY IN CHILD LABOUR MEASUREMENT: ASSESSING THE
COMPARABILITY OF ESTIMATES GENERATED BY DIFFERENT SURVEY INSTRUMENTS
Table A6. Kenya. Cont’d
Country S
urve
y ty
pe
Survey Name and total sample size
5-17 y. o.
Expanded size (M/F
5-17 y. o.
Distribution by regions
School Attendance
[attend only]
Economic activity
[work only]
Average working hour
per week or
per day*
Field work period
region % age M F T age M F T age M F T
KE
NY
A
MIC
S-2
Multiple Indicator Cluster Survey 2
[45,501]
11060683
(5,494,593/ 5,566,090)
nairobi 9.0
5-9 62.0
[45.6]
63.2
[49.0]
62.6
[47.3] 5-9 23.4
[7.0]
19.5
[5.3]
21.5
[6.2] 5-9 11.9 10.2 11.1
September – October
2000
central 11.8
coast 8.6
eastern 17.2
10-1
4 87.4
[46.4]
87.7
[52.1]
87.6
[49.3] 10-1
4 46.4
[5.4]
41.6
[5.9]
44.0
[5.7] 10-1
4 11.5 11.8 11.6 north eastern 0.8
nyanza 16.9
rift valley 22.9
15-1
7 70.7
[32.0]
62.6
[34.6]
66.5
[33.3] 15-1
7 56.6
[17.9]
48.3
[20.3]
52.3
[19.1] 15-1
7
17.3 19.5 18.3 western 12.9
Reference period of the economic activity - 7 days, simple form of questionnaires
Current school attendance

65 UCW WORKING PAPER SERIES, JUNE 2010
Table A7. Lesotho
Cou
ntry
Sur
vey
type
Survey Name and total sample size Total expanded sample size/
expanded 10-14 sample size (M/F) Expanded numbers of
urban/rural Distribution by
regions
School Attendance [attend only]
Economic activity [work only]
Average working hour
per week or per day*
Field work period
region % age M F T age M F T age M F T
LES
OT
HO
CW
IQ 2
002
Lesotho Core Welfare Indicators
Questionnaire Survey 2002
[22,031]
1,930,478/ 282,078
(137,191/ 144,888)
454,119/
1,476,359
Butha Buthe 7.8
5-9 71.4
[71.3]
77.9
[77.6]
74.7
[74.5] 5-9 1.2
[1.1]
0.4
[0.1] 0.8
[0.6] 5-9 - - -
April – June 2002
Leribe 14.6
Berea 10.5
Maseru 22.9
10-1
4 83.4
[82.5]
92.6
[91.7]
88.1
[87.2] 10-1
4 5.4
[4.4]
1.7
[0.9]
3.5
[2.6] 10-1
4
- - - Mafeteng 9.9
Mohale Hoek 8.3
Quthing 5.3
15-1
7 58.1
[57.7]
61.1
[60.9]
59.6
[59.3] 15-1
7 13.9
[13.5]
9.8
[9.5]
11.9
[11.5] 15-1
7
- - - Qacha’s Nek 6.6
Mokhotlong 5.5
Thaba-Tseka 8.7
Reference period of the economic activity - 7 days, simple form of questionnaires Current school attendance
MIC
S-2
Multiple Indicator Cluster Survey 2-
2000
[32,710]
1,742,189 / 244,151
(121,650/ 122,502) 378,051/ 1,365,949
Butha Buthe 6.2
5-9 71.7
[54.3]
76.6
[60.8]
74.2
[57.6] 5-9
22.3
[4.8]
18.7
[2.9]
20.5
[3.8] 5-9 7.1 6.8 7.0
February-October 2000-
mainly March, April, May)
Leribe 14.1
Berea 12.2
Maseru 22.9
10-1
4 82.6
[54.4]
89.4
[62.9]
86.0
[58.7] 10-1
4
38.7
[10.5]
30.1
[3.6]
34.4
[7.0]
10-1
4
13.8 8.9 11.7 Mafeteng 12.2
Mohale Hoek 9.8
Quthing 6.4 15
-17 61.9
[35.6]
62.0
[40.3]
62.0
[37.7] 15-1
7 51.1
[24.7]
39.0
[17.3]
45.7
[21.4] 15-1
7
18.8 13.5 16.9 Qacha’s Nek 3.5
Mokhotlong 5.1
Thaba-Tseka 7.7
Reference period of the economic activity - 7 days, simple form of questionnaires Current school attendance

66
TOWARDS CONSISTENCY IN CHILD LABOUR MEASUREMENT: ASSESSING THE
COMPARABILITY OF ESTIMATES GENERATED BY DIFFERENT SURVEY INSTRUMENTS
Table A8. Sao Tome e Principe C
ount
ry
Sur
vey
type
Survey Name and
total sample size
Total expanded
sample size/
expanded 10-14
sample size (M/F)
Expanded
numbers of
urban/rural
Distribution by
regions
School Attendance
[attend only]
Economic activity
[work only]
Average working hour
per week or
per day*
Field work
period
region % age M F T age M F T age M F T
SA
O T
OM
E E
PR
INC
IPE
LSM
S
L’ ENQUETE
NATIONALE SUR
LES
CONDITIONS DE
VIE DES
MENAGES 2000
[11,005 ]
127,482/
18,486
(9,575/ 8,911)
70,939/
56,590
-
6-9 85.6 84.1 84.9 5-9 - - - 5-9 - - -
November 200
– February
2001
10-1
4 81.7
[81.1]
81.1
[81.1]
81.4
[81.1] 10-1
4 4.6
[4.0]
1.2
[1.2]
3.0
[2.7] 10-1
4
- - -
15-1
7 49.3
[47.9]
45.6
[45.2]
47.4
[46.6] 15-1
7 20.3
[19.0]
6.7
[6.3]
13.6
[12.8] 15-1
7
- - -
List of the main occupations
School attendance: Is a child at school?
MIC
S-2
Multiple Indicator
Cluster Survey 2-
2000
[14,251]
148,000/ 20,133
(10,352/ 9,781)
70,976 /
77,024
-
5-9 56.6
[48.9]
58.4
[51.1]
57.5
[50.0] 5-9 11.8
[4.1]
10.4
[3.0]
11.1
[3.6] 5-9 7.5 7.7 7.6 February-
September
2000-almost
exclusively from
August 23 to
the end of
September
10-1
4 80.1
[62.9]
80.2
[66.9]
80.1
[64.8] 10-1
4 22.5
[5.3]
16.7
[3.4]
19.7
[4.4] 10-1
4 11.7 10.2 11.1
15-1
7
44.3 44.2 44.3
15-1
7
- - -
15-1
7
- - -
Reference period of the economic activity - 7 days, simple form of questionnaires
Current school attendance

67 UCW WORKING PAPER SERIES, JUNE 2010
Table A9. Senegal
Cou
ntry
Sur
vey
type
Survey Name and total sample size
Total expanded sample size/
expanded 10-14 sample size (M/F)
Expanded numbers of urban/rural
Distribution by regions School Attendance
[attend only]
Economic activity [work only]
Average working hour per week or
per day*
Field work period
region % age M F T age M F T age M F T
SE
NE
GA
L
DH
S
Demographic and
Health Survey
2005
[69,054]
10,866,263/
1,415,629
(698,282 /
717,348)
4,753,186 /
6,113,077
dakar 23.0
5-9 37.9
[26.6]
39.8
[30.0]
38.9
[28.3] 5-9 28.1
[16.4]
22.7
[13.0]
25.4
[14.7] 5-9 1.7* 1.6* 1.7*
Feb.- May,
2005
diourbel 10.4
fatick 5.7
kaolack 11.7
kolda 8.2
10-1
4 59.6
[40.5]
56.4
[40.8]
58.0
[40.6] 10-1
4 39.5
[19.8]
31.2
[15.4]
35.2
[17.6] 10-1
4
2.9* 2.9* 2.9* louga 6.3
matam 3.7
saint-louis 6.5
tambacounda 6.5
15-1
7
42.0
31.0
36.2
15-1
7
- - -
15-1
7
- - - thiès 13.7
zuguinchor 4.2
Reference period of the economic activity - 7 days, simple form of question Current school attendance

68
TOWARDS CONSISTENCY IN CHILD LABOUR MEASUREMENT: ASSESSING THE
COMPARABILITY OF ESTIMATES GENERATED BY DIFFERENT SURVEY INSTRUMENTS
Table A9. Senegal. Cont’d
Cou
ntry
Sur
vey
type
Survey Name and total sample size
Total expanded sample size/
expanded 10-14 sample size (M/F)
Expanded numbers of urban/rural
Distribution by regions School Attendance
[attend only]
Economic activity [work only]
Average working hour per week or
per day*
Field work period
SE
NE
GA
L
SIM
PO
C
Child Labor
Survey
2005
[35,024]
10,864,504/
1,382,039
(691,250/
690,789)
4,314,568 /
6,549,936
dakar 21.8
5-9 39.0
[34.9]
41.2
[39.4]
40.1
[37.0] 5-9 13.1
[8.9]
5.9
[4.1]
9.7
[6.6] 5-9 27.9 20.1 25.7
2005 (months
are not
available)
diourbel 9.8
fatick 6.6
kaolack 10.5
kolda 8.2
10-1
4 63.2
[51.6]
60.3
[54.7]
61.8
[53.2] 10-1
4 28.9
[17.3]
15.6
[10.0]
22.3
[13.7] 10-1
4
29.7 24.1 27.7 louga 6.9
matam 4.7
saint-louis 7.4
tambacounda 6.8
15-1
7 50.7
[37.4]
41.0
[36.4]
45.5
[36.8] 15-1
7 45.9
[32.6]
24.1
[19.6]
34.4
[25.7] 15-1
7
37.1 30.7 34.7 thiès 12.6
zuguinchor 4.8
Reference period of the economic activity - 7 days, long form of questionnaires Current school attendance

69 UCW WORKING PAPER SERIES, JUNE 2010
ANNEX 4. DETAILED COMPARATIVE TABLES FOR EXPANDED SAMPLE OF COUNTRIES
AFRICA
Country Burkina Faso Chad Cameroon Côte d'Ivoire
Year 2003 1998 2004 2000 2001 2000 2002 2000
Survey Name
Etu
de s
ur le
s
Con
ditio
ns d
e V
ie
des
Men
ages
Etu
de s
ur le
s
Con
ditio
ns d
e V
ie
des
Men
ages
Dem
ogra
phic
and
Hea
lth S
urve
y
Mul
tiple
Indi
cato
r
Clu
ster
Sur
vey
2
Enq
uête
Cam
erou
nais
e
Aup
rès
des
Mén
ages
II
Mul
tiple
Indi
cato
r
Clu
ster
Sur
vey
2
Enq
uete
Niv
eau
de
Vie
des
Men
ages
Mul
tiple
Indi
cato
r
Clu
ster
Sur
vey
2
Survey type CWIQ ENQUETE PRIORIT. II DHS MICS-2 PRIORITY SURVEY MICS-2 IS MICS-2
Recall period of eco.
activity/ form of the
question
7 days/
short main occup. list 7 days/ short
7 days/
short main occup. list
7 days/
short
7 days/
short
7 days/
short
Total Sample size/ 10-14
sample size
54,034/
7,103
63,509/
8,350
29,608/
4,062
28,750/
3,970
56,443/
7,849
24,525/
3,485
57,908/
7,571
53,364/
7,912
Expanded numbers of
URBAN/RURAL
2,068,445/
9,315,360
1,767,396/
8,829,981
1915248/
7,339,943
1,889,014/
5,971,913
5,383,103/
10089454
5,474,730/
10454006
7,459,874/
9,673,698
8,420,764/
8,111,362
Adult empl. rate
(25-55 yearolds) M/F/T 95.5/84.5/89.5 96.7/86.9/91.2 - -
School
Attendance
(10-14
yearolds)
Male 37.6 34.5 55.9 72.8 87.8 87.0 72.9 68.6
Female 29.7 25.2 39.9 48.8 81.3 78.3 56.5 53.5
Total 33.9 30.1 48.1 60.6 84.6 82.7 65.0 61.0
Employ
(10-14
yearolds)
Male 54.9 65.3 73.8 78.6 14.5 66.8 16.6 43.9
Female 57.5 67.5 64.6 74.7 17.4 61.6 20.6 43.3
Total 56.1 66.3 69.3 76.7 15.9 64.2 18.6 43.6
Average working hour per
week (10-14 yearolds) - - 22.3 21.8 26.8 22.9 45.2 23.5
Work only M/F/T (10-14
yearolds) 53.4/56.8/55.0 61.8/65.7/63.6 35.4/41.4/38.3 22.9/40.0/31.6
6.5/10.2/
8.4
9.5/13.4/
11.4 15.1/19.8/17.4 17.0/23.8/20.4
Field work period April 1, 2003-
July 16, 2003
05/1998-
08/1998 07/2004-12/2004 05/2000-10/2000
10/2001-
12/2001
07/2000-
08/2000 01/2000-12/2000
Academic year October-June October-June September-June October-June

70
TOWARDS CONSISTENCY IN CHILD LABOUR MEASUREMENT: ASSESSING THE
COMPARABILITY OF ESTIMATES GENERATED BY DIFFERENT SURVEY INSTRUMENTS
AFRICA cont’d
Country Egypt Ethiopia Ghana Kenya
Year 2005 2000 1998 2005 2001 2003 2000
Survey Name D
emog
raph
ic a
nd H
ealth
Sur
vey
Dem
ogra
phic
and
Hea
lth S
urve
y
Egy
pt L
abou
r M
arke
t Sur
vey
Nat
iona
l Lab
our
For
ce S
urve
y
Nat
iona
l Lab
our
For
ce S
urve
y
CO
RE
WE
LFA
RE
IND
ICA
TO
RS
QU
ES
TIO
NN
AIR
E
Chi
ld L
abou
r S
urve
y
Mul
tiple
Indi
cato
r C
lust
er S
urve
y
2
Chi
ld L
abou
r M
odul
e of
Inte
grat
ed L
abou
r F
orce
Sur
vey
Survey type DHS DHS LFS LFS LFS CWIQ SIMPOC MICS-2 SIMPOC
Recall period of eco. activity/ form of the
question 7 days/ short
last month/
short
7 days/
long
last month/
short
7 days/
long
7 days/
short
7 days/
short
7 days/
short
7 days/
short
Total Sample size/ 10-14 sample size 112,710/
11,907
91,173/
11,875
23,997/
3,134
230,680/
27,707
189,936/
22,380
210,153/
28,477
47,956/
6,737
45,501/
6,882
20,034/
8,205
Expanded numbers of URBAN/RURAL 29547523/
41260289
28788022/
37931179
25589784/
34903389
8,974,598/
54254001
7,552,898/
48323658
7,054,619/
9,685,533
7,103,418/
10,814,896
6,668,748/
23423384.6 -
Adult empl. rate
(25-55 yearolds) M/F/T 91.4/19.0/55.1 90.8/49.6/69.4 95.8/79.4/87.2 94.8/68.8/81.1 84.2 84.2 86.2 -
School Attendance
(10-14 yearolds)
Male 93.2 88.3 90.3 53.2 58.2 86.6 83.0 87.4 75.1
Female 89.3 81.8 83.4 48 46.6 84.3 81.5 87.7 73.5
Total 91.3 85.1 86.8 50.7 52.6 85.5 82.3 87.6 74.3
Employ
(10-14 yearolds)
Male 14.3 4.1 5.8 70.1 73.8 7.8 33.8 46.4 8.5
Female 5.3 1.1 11.6 53.4 52.3 7.6 34.7 41.6 7.6
Total 9.9 2.6 8.7 62.1 63.3 7.7 34.2 44.0 8.0
Average working hour per week (10-14
yearolds) 24.4 - 49.3 29.6 31.4 - - 11.7 35.9
Work only M/F/T (10-14 yearolds) 2.8/2.0/
2.4
3.7/1.0/
2.4
4.6/6.0/
5.3
38.7/33.5/
36.2 37.6/34.8/36.2
5.6/5.4/
5.5
11.5/11.9/
11.7
5.4/5.9/
5.7
3.8/3.7/
3.7
Field work period 04/2005 -
07/2005
03/2000 -
05/2000
January-
May 2003
12/2000
5.4/5.9/
5.7
3.8/3.7/
3.7
Academic year September-June September-July September-July January-December

71 UCW WORKING PAPER SERIES, JUNE 2010
AFRICA cont’d
Country Lesotho Malawi Mali Sao Tome e Principe Senegal
Year 2002 2000 2004 2000 2006 2005 2001 2000 2000 2005 2005 2001 2000
Survey Name
CO
RE
WE
LFA
RE
IN
DIC
AT
OR
S
QU
ES
TIO
NN
AIR
E
Mul
tiple
Indi
cato
r
Clu
ster
Sur
vey
2
Dem
ogra
phic
and
Hea
lth S
urve
y
Dem
ogra
phic
and
Hea
lth S
urve
y
Enq
uête
Dém
ogra
phiq
ue
et d
e S
anté
du
Enq
uete
Nat
iona
l su
r le
Tra
vail
des
Enf
ants
Dem
ogra
phic
and
Hea
lth S
urve
y
Mul
tiple
Indi
cato
r
Clu
ster
Sur
vey
2
Enq
uête
Nat
iona
le
sur
les
Con
ditio
ns
de V
ie d
es M
enag
es
Dem
ogra
phic
and
Hea
lth S
urve
y
Enq
uête
S
énég
alai
se A
uprè
s
des
Mén
ages
(ES
AM
II)
Mul
tiple
Indi
cato
r
Clu
ster
Sur
vey
2
Survey type CWIQ MICS-2 DHS DHS DHS SIMPOC DHS MICS-2 LSMS DHS SIMPOC LSMS MICS-2
Recall period of eco.
activity/ form of the
question
7 days/
short
7 days/
short
7 days/
short
7 days/
short
7 days/
short
7 days/
long
7 days/
short
7 days/
short
main
occup. list
7 days/
short 7 days/ long
7 days/
short
7 days/
short
Total Sample size/ 10-14
sample size 22,031/ 3,233 32,744/ 4,584
60,747/
8,738
63,823/
8,615
73,685/
10,039
28,742/
3,915
66,505/
9,422
14,251/
1,940
11,009/
1,581 69,054/ 9,215 35,024/ 4,585
64,679/
8,747
60,169/
8,544
Expanded numbers of
URBAN/RURAL
454,119/
1,476,359
378,051/
1,365,949
1915248/
7,339,943
1,889,014/
5,971,913
3,646,713/
8,321,662
3,945,347/
7,942,315
2,948,079/
8,168,758
70,976/
77,024
70,939/
56,590
4,753,186/
6,113,077
4,314,568/
6,549,936
4,325,790/
6,099,418
3566983/
5311397
Adult empl. rate
(25-55 years old) M/F/T
65/45/
55 - - - - 80.9/49.3/62.8
76.2/46.4/
59.8 -
School
Attendance
(10-14
yearolds)
Male 83.4 82.6 87.3 83.6 50.2 59.3 46.2 80.1 81.7 59.6 63.2 54.9 53
Female 92.6 89.4 87.0 84.5 41.6 50 32 80.2 81.1 56.4 60.3 47 41.3
Total 88.1 86 87.1 81.4 45.8 54.6 38.9 80.1 81.4 58.0 61.8 51.0 47.1
Employ
(10-14 years
old)
Male 5.4 38.7 57.4 42.1 59.8 76.5 36.0 22.5 4.6 39.5 28.9 31.3 47.4
Female 1.7 30.1 51.5 35.9 49.5 74.7 21.3 16.7 1.2 31.2 15.6 18.7 29.4
Total 3.5 34.4 54.4 38.9 54.6 75.6 28.4 19.7 3.0 35.2 22.3 25.0 38.3
Average working hour per
week (10-14 years old) - 11.7 9.6 10.9 - 22.9 11.1 - 5.5 27.7 - 17.5
Work only M/F/T (10-14 yearolds)
4.4/0.9/ 2.6
27.1/12/ 20.4
7.6/7.2/ 7.4 7.2/6.4/
6.8 32.3/31.4/31.8
36.8/41.1/ 38.9
24.1/16.0/ 20.0
5.3/3.4/ 4.4
4.0/1.2/ 2.7
19.8/15.4/17.6 17.3/10.0/13.7 20.7/14.9/
17.8 25.7/17.8/
21.7
Field work period 04/2002-
06/2002
02/2000-10/2000 (mainly
03/2000-06/2000,
09/2000)
01/2004-
02/2005 (mainly
10/2004-
01/2005)
7/2000-
11/2000
02/2006-
12/2006
(mainly
06/2006-
10/2006)
01/2001 -
05/2001
02/2000-
09/2000
11/2000-
02/2001
02/2005 -
05/2005
05/2000-
07/2000
Academic year March-December January-November October-June October-July October-July

72
TOWARDS CONSISTENCY IN CHILD LABOUR MEASUREMENT: ASSESSING THE
COMPARABILITY OF ESTIMATES GENERATED BY DIFFERENT SURVEY INSTRUMENTS
AFRICA cont’d
Country Togo Uganda United Republic of
Tanzania Zambia
Year 2006 2000 2005/2006 2002/2003 2000/2001 2000 1999 2005 1999
Survey Name
QU
IBB
Mul
tiple
Indi
cato
r
Clu
ster
Sur
vey
2
Nat
iona
l Hou
seho
ld
Sur
vey
Nat
iona
l Hou
seho
ld
Sur
vey
Dem
ogra
phic
and
Hea
lth S
urve
y
Dem
ogra
phic
and
Hea
lth S
urve
y
Labo
ur F
orce
Sur
vey
Chi
ld L
abou
r S
urve
y
Survey type CWIQ MICS-2 DHS SIMPOC DHS LFS SIMPOC
Recall period of eco. activity/ form of the question 7 days/
short
7 days/
short
7 days/
long
7 days/
short
7 days/
short
list of curr.
occup.
currently/
short
7 days/ l
ong
7 days/ l
ist of occup.
Total Sample size/ 10-14 sample size 36,430/
4,605
24,485/
3,678
38,559/
5,895
50,508/
7,827
37,951/
5,589 -/9,024
19,255/
2,572
39797/
5,579
44,367/
6,050
Expanded numbers of URBAN/RURAL 994,857/ 2,132,240 1,581,161/
2,980,708
4171287/
22993343
3,848,935/
23055009/
3,277,655/
21755781 -
7,058,716/
24323859
3993329/
7,445,351
3,974,598/
6,812,389
Adult empl. rate
(25-55 yearolds) M/F/T 91.1/ 89.2/ 90.1 -
95.2/90.7/
92.9
91.5/85.6/
88.4 - - -
92.6/81.1/
86.8
82.4/62.1/
72.0
School Attendance Male 84.9 82.3 94.1 93.6 91.5 78.2 69.3 84.3 76.5
(10-14 yearolds) Female 77 67.8 93.4 93.4 90.3 79.5 68.7 84.4 75.6
Total 81.3 75.1 93.8 93.5 90.9 78.8 69.0 84.3 76.0
Employ Male 46.6 79.7 48.5 20.7 53.2 46.7 41.2 53.8 15.6
(10-14 yearolds) Female 46.0 78.8 45.6 16.4 50.5 44.3 39.1 51.5 14.1
Total 46.3 79.3 47.0 18.5 51.8 45.5 40.2 52.7 14.8
Average working hour per week (10-14 yearolds) - 26.2 11.6 45.5 10.5 - 16.2 25.6 -
Work only M/F/T (10-14 yearolds) 11.6/16.4/ 13.8 15.4/26.0/ 20.7 3.7/3.6/
3.6
3.6/2.0/
3.4
4.2/4.2/
4.2
15.0/12.6/
13.8
13.7/13.4/
13.5
10.6/9.5/
10.1
8.3/7.5/
7.9
Field work period 07/2006-08/2006
August 1 2000
September 4 2000
Mainly
November
2005-April
2006
01/2002-04/2003 (mainly
05/2002-04/2003)
01/2000-03/2001 (mainly
09/2000-03/2001)
09/1999-
11/1999
09/2005-
10/2005
Academic year September-June February-December January-December January-December

73 UCW WORKING PAPER SERIES, JUNE 2010
LATIN AMERICA AND CARIBBEAN
Country Argentina Bolivia Brazil Colombia
Year 2004 1997 2002 2000 2000 1999 2004 2003 2001 2005 2001 2000
Survey Name
Enc
uest
a so
bre
Act
ivid
ades
de
Nin
os,
Nin
as y
Ado
lesc
ente
s
Enc
uest
a de
Des
arro
llo S
ocia
l
(ED
S)
Enc
uest
a C
ontin
ua
de H
ogar
es
Enc
uest
a C
ontin
ua
de H
ogar
es
Mul
tiple
Indi
cato
r
Clu
ster
Sur
vey
2
Enc
uest
a C
ontin
ua
de H
ogar
es
Pes
quis
a N
acio
nal
por
Am
ostr
a de
Dom
icili
os
Pes
quis
a N
acio
nal
por
Am
ostr
a de
Dom
icili
os
Pes
quis
a N
acio
nal
por
Am
ostr
a de
Dom
icili
os
Dem
ogra
phic
and
Hea
lth S
urve
y
Enc
uest
a N
acio
nal
de T
raba
jo In
fant
il
Dem
ogra
phic
and
Hea
lth S
urve
y
Survey type SIMPOC IS LSMS LSMS MICS-2 LFS PNAD PNAD PNAD DHS SIMPOC DHS
Recall period of eco. activity/ form of the
question
7 days/
long
7 days/
long
7 days/
long
7 days/
short
7 days/
long ?/long ?/long ?/long
last week
occup list
7 days/
long
7 days/
short
Total Sample size/ 10-14 sample size 44,246 / 4,774 75,361/
7,622
24,933/
3,313
20,815/
2,675 19,530/ 2,426
13,023/
1,694
399,354/
37,971
384,834/
36,446
378,837/
37,403
157,840/
16,923
26,859/
10,738
47,520/
4,906
Expanded numbers of URBAN/RURAL 18,044,161/
943,348 -
5,330,045/
3,217,046
5,268,526/
3,006,277
5,459,049/
2,969,141
5,023,166/
2,965,263
151,124,470/
30,935,638
146,679,752/
27,286,300
142,099,791/
27,270,024
35348955/
8,299,724 -
29602524/
11952018
Adult empl. rate
(25-55 yearolds) M/F/T - 94.0/56.4/74.2 93.6/69.3/81.0 93.8/67.9/80.3 - 93.7/68.1/80.3 88.8/62.7/75.2 87.0/58.8/72.3 87.4/56.6/71.4 - - -
School Attendance
(10-14 yearolds)
Male 97 95.8 93.9 93.4 94.5 94.7 96.5 97.0 96.0 91.8 90.0 87.5
Femalee 98.1 96.9 90.4 87.8 92.1 91 97.1 97.3 96.4 94.9 92.8 90.0
Total 97.5 96.4 92.3 90.6 93.3 92.9 96.8 97.1 96.2 93.4 91.4 88.7
Employ
(10-14 yearolds)
Male 23.0 25.4 28.8 23.6 35.1 29.2 13.5 13.8 14.2 9.4 22.0 13.8
Female 13.6 16.0 26.7 22.1 29.0 30.5 6.5 6.8 7.2 2.6 10.2 4.5
Total 18.5 20.7 27.8 22.9 32.0 29.8 10.1 10.4 10.8 5.8 16.2 9.3
Average working hour per week (10-14
yearolds) 8.0 - 24.9 29.2 15.4 25.5 19.9 20.1 23 22.1 21.3 21.5
Work only M/F/T (10-14 yearolds) 1.5/0.4/
1.0
2.5/1.0/
1.8
3.8/5.7/
4.6
4.1/6.8/
5.4
3.6/4.2/
3.9
4.2/7.5/
5.8
1.1/0.4/
0.8
0.9/0.3/
0.6
1.3/0.7/
1.0
3.6/0.7/
2.1
5.8/2.2/
4.0
5.9/1.3/
3.7
Field work period 08/1997 11/2002 -
12/2002
11/2000 -
12/2000
09/2000-
11/2000
presumably
11/1999-12/1999
(mainly 11/1999)
10/2004 -
06/2005
03/2000 -
07/2000
Academic year February-December February-November March-December February-November

74
TOWARDS CONSISTENCY IN CHILD LABOUR MEASUREMENT: ASSESSING THE
COMPARABILITY OF ESTIMATES GENERATED BY DIFFERENT SURVEY INSTRUMENTS
LATIN AMERICA AND CARIBBEAN cont’d
Country Dominican Republic Ecuador EI Salvador Guatemala
Year 2005-Abril 2003- Abril 2003-
October 2000 2000 2004 2001 2003 2001 2003 2000
Survey Name
Enc
uest
a de
Fue
rza
de
Tra
bajo
Enc
uest
a
Nac
iona
l de
Fue
rza
de
Tra
bajo
Enc
uest
a
Nac
iona
l de
Fue
rza
de
Tra
bajo
Mul
tiple
Indi
cato
r C
lust
er
Sur
vey
2
Enc
uest
a
Nac
iona
l de
Tra
bajo
Enc
uest
a de
Em
pleo
,
Des
empl
eo,
Sub
empl
eo y
Em
pleo
Infa
ntil
Enc
uest
a de
Em
pleo
,
Des
empl
eo,
Sub
empl
eo y
Em
pleo
Infa
ntil
Enc
uest
a de
Hod
ares
de
Pro
posi
tos
Mul
tiple
s
Enc
uest
a de
Hog
ares
de
Pro
posi
tos
Mul
tiple
s
Enc
uest
a
Nac
iona
l Sob
re
Em
pleo
e
Ingr
esos
Enc
uest
a de
Con
dici
ones
de
Vid
a
Survey type LFS LFS LFS MICS-2 SIMPOC LFS SIMPOC IS IS LFS LSMS
Recall period of eco.
activity/form of the question
7 days/
short
7 days/
long ?/long ?/long
7 days/
long
7 days/
long
7 days/
long
7 days/
long
Total Sample size/ 10-14
sample size
30038/
3,496
22,050/
2,561
29,771/
3,471
17,759/
2,051
32,855/
3,780
81,930/
10,004
60,749/
6,940
16,037/
1,904
53,002 /
6,314
10,607
(7+yearolds)/
1,593
37,771(7+=29,414)/
4,936
Expanded numbers of
URBAN/RURAL
5786158/
3,168,310
6,028,731/
3,235,287 -
5,068,610/
3,550,060
5,285,809/
3,111,388
8,600,184/
4,358,115 -
3,943,112/
2,706,667
1,021,075/
915,912
(5-17 year
olds)
3,601,181/
5,664,623
(7+ year olds)
4,397,854/
6,987,587
3,587,863/5,285,862 (age
7+)
Adult empl. rate
(25-55 years old) M/F/T 87.6/47.2/67.1 88.5/48.6/67.8 88.2/46.1/66.7 - - 92.7/58.1/74.6
93.6/60.7/
76.7
89.1/59.6/
72.5 -
95.2/52.9/
73.2 95.4/48.5/70.3
School
Attendance
(10-14 years
old)
Male 97.2 97.1 97 95.4 96.3 89.4 87.8 87.8 87.7 76.2 76.1
Female 98.1 98.2 98.3 96.1 96.8 89.3 87.3 88.6 86.7 67.1 71.5
Total 97.6 97.6 97.6 95.8 96.5 89.4 87.6 88.2 87.2 71.6 73.9
Employ
(10-14 yearolds)
Male 9.0 5.9 5.6 21.6 31.1 20.0 28.9 25.2 17.9 37.6 36.5
Female 2.7 0.9 0.7 9.9 9.7 12.0 17.8 12.1 8.0 23.7 19.7
Total 5.8 3.5 3.2 15.8 20.3 16.1 23.5 18.7 13.0 30.5 28.4
Average working hour per
week (10-14 years old) 18.4 25.7 22.6 15.4 20.3 23.4 27.8 30.8 - 33.3 34.9
Work only M/F/T (10-14 years
old) 0.7/0.0/0.4
0.8/0.0/
0.4
0.8/0.0/
0.4
1.9/0.4/
1.2
1.8/0.5/
1.2
6.5/3.6/
5.1
8.4/5.7/
7.1
6.1/1.2/
3.7
5.9/2.6/
4.3
11.6/10.5/
11.1
14.2/9.1/
11.7
Field work period 04/2005 04/2003 10/2003 09/2000-
12/2000
21/11/2000-
22/12/2000 (date of
final visit)
presumably
10/2003-12/2003
07/2001-
12/2001 07/2000-12/2000
Academic year August/September-June October-June January-November March-October

75 UCW WORKING PAPER SERIES, JUNE 2010
LATIN AMERICA AND CARIBBEAN cont’d
Country Honduras Mexico Nicaragua Panama
Year 2004 2002 2004 (12-14 year
olds)
2003 (12-14 year
olds) 1996 2001 2001 2001 2003 2000
Survey Name
Enc
uest
a
Per
man
ente
de
Hog
ares
de
Pro
posi
tos
Mul
tiple
s
Nat
iona
l Chi
ld
Labo
ur S
urve
y
Enc
uest
a N
acio
nal
de In
gres
os y
Gas
tos
de lo
s
Hog
ares
Enc
uest
a N
acio
nal
de E
mpl
eo
Trim
estr
al (
EN
ET
)
Enc
uest
a N
acio
nal
de In
gres
os y
Gas
tos
de lo
s
Hog
ares
Enc
uest
a N
acio
nal
de H
ogar
es S
obre
Med
ició
n de
Niv
el d
e
Vid
a
Enc
uest
a
Nic
arag
uens
e de
Dem
ogra
fia y
Sal
ud
Dem
ogra
phic
and
Hea
lth S
urve
y
Enc
uest
a de
Niv
eles
de V
ida
Enc
uest
a de
l
Tra
bajo
Infa
ntil
Survey type IS SIMPOC IES LFS IES LSMS DHS LSMS SIMPOC
Recall period of eco. activity/ form of the
question
7 days/
long
7 days/
short
last month
/long
7 days/
long
7 days/
long
7 days/
long
7 days/
long
7 days/
long
7 days/
long
Total Sample size/ 10-14 sample size 36,265/
4,814
41,777/
5,650
91,738/
6,154
440,519/
38,122 64,916/ 4,817
44,675/
5,771
22,695/
3,117
61,351/
8521
26,435/
2,921 49,474/ 8,158
Expanded numbers of URBAN/RURAL 3,183,187/
3,816,823
3,030,366/
3,569,853 - - -
2,936,147/
2,172,213
2,171,663/
2,331,908
3,424,910/
2,609,706
1,854,808/
1,208,716
1,175,617/
820,536
Adult empl. rate (25-55 year-olds) M/F/T 91.1/44.5/
66.1
93.1/45.3/
67.5
93.3/51.8/
71.1
94.3/45.0/
67.9
91.1/45.8/
67.3
87.9/54.4/
69.8
91.9/46.8/
68.3
90.5/53.1/
70.5
89.1/53.3/
70.7
91.4/43.4/
65.2
School Attendance
(10-14 years old)
Male 84.1 81.5 91.7 87 86.9 80.6 74 75.9 95.3 92.6
Female 85.1 82.1 90.7 85.5 80.8 85.5 81.5 82.9 91.8 93.1
Total 84.6 81.8 91.2 86.3 83.8 83 77.7 79.4 93.6 92.9
Employ
(10-14 years old)
Male 15.6 24.3 12.2 14.4 20 26.2 25.1 24.2 7.7 9.0
Female 4.9 9.0 5.6 6.9 9.5 9.4 6.9 6 2.2 2.1
Total 10.3 16.9 8.9 10.8 14.7 17.9 16.2 15.2 5.1 5.7
Average working hour per week (10-14 years
old) 29.2 28.2 29.1 25.6 32 31.5 31.8 29.9 19.6 23.2
Work only M/F/T (10-14 years old) 8.5/2.1/
5.3
12.0/2.9/
7.6
4.1/2.0/
3.0
5.5/2.8/
4.2
9.2/4.2/
6.7
11.0/3.3/
7.2
14.3/3.0/
8.8
14.0/2.5/
8.3
2.6/1.2/
2.0
3.7/0.7/
2.2
Field work period May-July 2002 05/2001-
06/2001
09/2001 -
12/2001
09/2001-
12/2001
3/8/2003-
30/11/2003 October 2000
Academic year February-December September-June February-December October 2000

76
TOWARDS CONSISTENCY IN CHILD LABOUR MEASUREMENT: ASSESSING THE
COMPARABILITY OF ESTIMATES GENERATED BY DIFFERENT SURVEY INSTRUMENTS
LATIN AMERICA AND CARIBBEAN cont’d
Country Paraguay Peru Venezuela
Year 2005 2004 1999 2000 1994 2005 2000 1998
Survey Name
Enc
uest
a
Per
man
ente
de
Hog
ares
Enc
uest
a
Per
man
ente
de
Hog
ares
Enc
uest
a
Per
man
ente
de
Hog
ares
Enc
uest
a
Nac
iona
l de
Hog
ares
Sob
ra
Med
ició
n de
Niv
eles
de
Vid
a
Enc
uest
a
Nac
iona
l de
Hog
ares
Sob
ra
Med
ició
n de
Niv
eles
de
Vid
a
Enc
uest
a de
Hog
ares
por
Mue
stre
o (E
HM
)
Enc
uest
a de
Hog
ares
por
Mue
stre
o (E
HM
)
Enc
uest
a de
Hog
ares
por
Mue
stre
o (E
HM
)
Survey type LSMS LSMS LSMS LSMS LSMS LSMS LSMS LSMS
Recall period of eco. activity/ form of the question 7 days/
long
7 days/
long
7 days/
long
7 days/
long
7 days/
short
7 days/
long
7 days/
long
7 days/
long
Total Sample size/ 10-14 sample size 19,579/
2,483
34,636/
4,445
24,193/
3,144
19,957/
2,359
19,278/
2,322
165,079/
19,367 - / 9,208 - / 9,246
Expanded numbers of URBAN/RURAL 3,383,873/
2,453,380
3241503/
2460172
3,035,224/
2,599,118
16734932/
8,890,099
15,449,288/
7,012,730 - - -
Adult empl. rate (25-55 year-olds) M/F/T 93.9/64.7/
79.3
91.8/64.9/
78.4
92.1/55.4/
73.6
90.4/64.2/
76.7
90.1/58.3/
73.2
87.8/59.7/
73.8 - -
School Attendance
(10-14 year-olds)
Male 93.1 91.9 92.3 97.3 95.1 94.8 93.1 92.7
Female 93.1 91.7 91.1 96.6 92.2 96.9 95.3 94.5
Total 93.1 91.8 91.7 96.9 93.6 95.8 94.2 93.6
Employ
(10-14 year-olds)
Male 22.6 27.5 18.7 29.9 25.5 7.1 7.2 6.4
Female 7.7 11.1 7.1 25.8 18.0 3.6 2.4 2.1
Total 15.3 19.5 12.9 27.9 21.7 5.4 4.9 4.3
Average working hour per week (10-14 year-olds) 33.2 30.3 33 15.2 4.6 24.1 29.7 29.5
Work only M/F/T (10-14 year-olds) 4.4/1.9/
3.2
5.5/2.5/
4.0
4.6/1.8/
3.2
1.7/1.9/
1.8
2.1/1.7/
1.9
2.2/0.4/
1.3
2.9/0.3/
1.6
2.7/0.7/
1.7
Field work period 01/10/2005-8/02/2006 1/08/2004- 15/01/2005 1/08/1999-31/12/1999 05/06/2000 06/1994-08/1994
Academic year February-November April-December September-July

77 UCW WORKING PAPER SERIES, JUNE 2010
ASIA
Country Bangladesh Cambodia Mongolia
Year 2004 2002-2003 2000 2003-2004 2001 2002 2000
Survey Name
Dem
ogra
phic
and
Hea
lth S
urve
y
Chi
ld la
bour
Sur
vey
Hou
seho
ld
Inco
me
and
Exp
endi
ture
Sur
vey
Soc
io E
cono
mic
Sur
vey
Cam
bodi
a C
hild
Labo
ur S
urve
y
Nat
iona
l Chi
ld
Labo
ur S
urve
y
Mul
tiple
Indi
cato
r
Clu
ster
Sur
vey
2
Survey type DHS SIMPOC HIES IS SIMPOC SIMPOC MICS-2
Recall period of eco. activity/ form of the
question
current/
short
7 days/
short
7 days/
short
7 days/
short
7 days/
short
?/working
hours
7 days/
short
Total Sample size/ 10-14 sample size 55,883(5-17 year-olds=16,743/
6,920
60,850/ 24,303 (5-17
year-olds)
38,515(5-17 year-olds =12,941
/5,406
74,719/
10,746
69,549/
11,443
49,948/
6,527
29,948/
3,235
Expanded numbers of URBAN/RURAL
29760498/
107,062,276(5-17 yea-olds
5,567,062/22510688)
8,924,290/
32268989 (5-17 year
olds)
25294325/
100,815,729 (5-17 year-olds
6,068,960/25480452)
2,600,853/
10838281
2,470,365/
9,843,150
1,198,320/
1,030,509
1,100,832/
1,297,168
Adult empl. rate
(25-55 yearolds) M/F/T 96.1/24.3/61.2 - 94.5/12.6/53.3
94.7/81.4/
87.5 94.8/86.3/90.2 - -
School Attendance
(10-14 yearolds)
Male 72.89 78.6 67.9 90.5 87.6 92.2 78.6
Female 78.8 87.3 76.5 88.2 84.8 95.3 85.4
Total 75.8 82.7 72.2 89.4 86.2 93.7 82.1
Employ
(10-14 yearolds)
Male 17.8 35.8 15.2 49.6 65.3 9.1 25
Female 4.7 15.3 3.5 48.1 64.4 5.4 22
Total 11..2 26.1 9.4 48.9 64.9 7.3 23.4
Average working hour per week (10-14
yearolds) - 24.3 8.5 23.7 22.9 25.4 25
Work only M/F/T (10-14 yearolds) 15.2/4.0/
9.6
18.7/9.0/
14.1
13.3/3.0/
8.2
6.0/7.4/
6.7
8.5/10.3/
9.4
4.4/1.7/
3.1
5.6/3.5/
4.5
Field work period January-May 2004 October-November
2002 January 2000-December 2000 ??
November 2003-January
2004 April 2001
06/2000-09/2000 (mainly 06/2000-
07/2000)
Academic year January-December October-July September-June

78
TOWARDS CONSISTENCY IN CHILD LABOUR MEASUREMENT: ASSESSING THE
COMPARABILITY OF ESTIMATES GENERATED BY DIFFERENT SURVEY INSTRUMENTS