st. john’s university undergraduate student managed ... · share data : fundamentals ... some of...
TRANSCRIPT
St. John’s University Undergraduate Student Managed Investment Fund
Presents: UnitedHealth Group, Inc. (UNH)
Analysts: Maria Hernandez ([email protected]) Stylianos Karas ([email protected])
Joshua Rounds ([email protected]) Yan Hua Tang ([email protected])
Recommendation: Buy 325 shares (=$16,279.25)
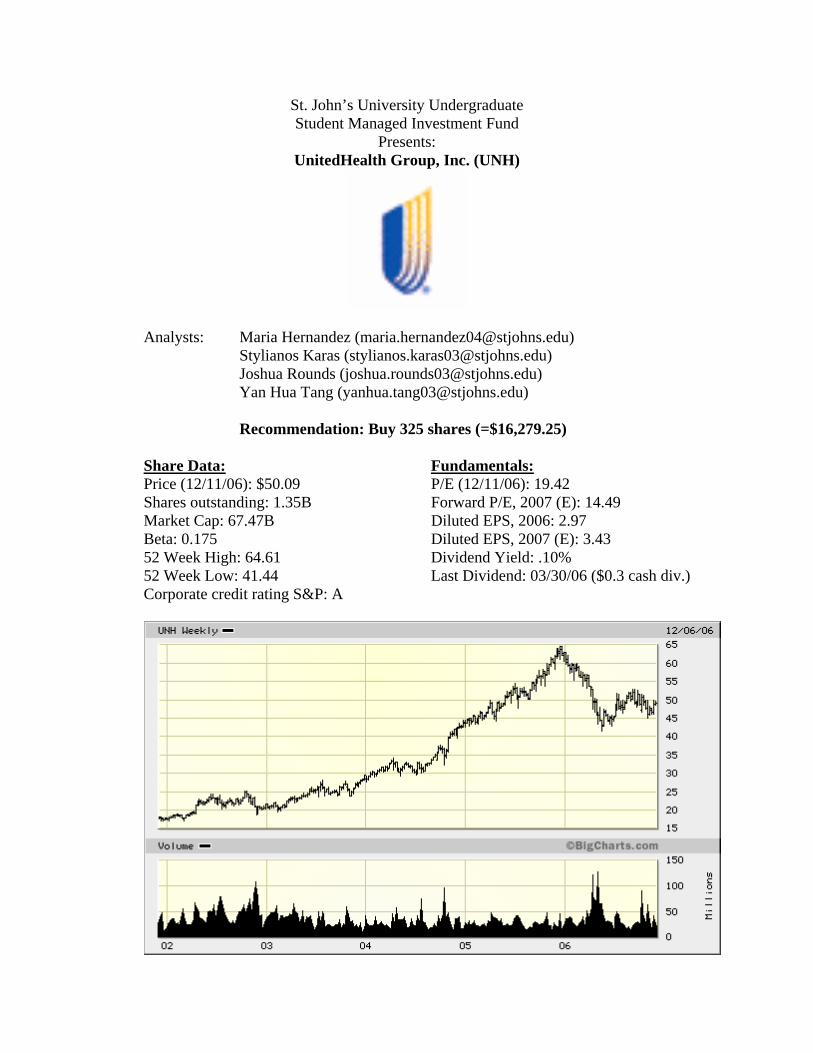
Share Data: Fundamentals: Price (12/11/06): $50.09 P/E (12/11/06): 19.42 Shares outstanding: 1.35B Forward P/E, 2007 (E): 14.49 Market Cap: 67.47B Diluted EPS, 2006: 2.97 Beta: 0.175 Diluted EPS, 2007 (E): 3.43 52 Week High: 64.61 Dividend Yield: .10% 52 Week Low: 41.44 Last Dividend: 03/30/06 ($0.3 cash div.) Corporate credit rating S&P: A

2
I. EXECUTIVE SUMMARY Upon analysis of UnitedHealth Group, Inc.’s financials, future growth prospects, and the managed health care industry as a whole, we recommend that 325 shares of UnitedHealth be added to the Student Managed Investment Fund portfolio. We base this decision on the following factors:
• Increasing demand for managed care and UnitedHealth’s proven ability to offer competitive prices and new innovations to its customers.
• Our relative valuation gave us a conservative target price between $63 and $73. Our absolute valuation also showed UnitedHealth to be undervalued.
• UnitedHealth has shown continued strong performance through its financial ratios relative to its competitors.
II. COMPANY OVERVIEW Company Overview UnitedHealth Group, which is a Minnesota corporation incorporated in 1977, is “a diversified health and well-being company” that provides health care and well being services to Americans. It is the second largest health insurer in the United States serving more than 70 millions people. The company operates its business both nationally and internationally. UnitedHealth Group (UNH) was ranked as No. 1 in Fortune’s list of the most admired health care companies in 2006. UnitedHealth Group was ranked No. 4 on the 2006 Business Week 50, a list of the nation’s best-performing large public corporations. (The company has been ranked in the top five of the Business Week 50 for the past four years.) In addition, in 2006, the company was ranked No. 37 in Fortune’s list of 500 largest U.S. corporations based on 2005 revenues and sales. Also, Fortune also ranked the company No. 103 on the Forbes Global 2000, a list of the world’s largest companies based on sales, profits, assets and market value. The main objective of the company is providing “quality, affordability, accessibility, and usability” services to its customers. The company provides diverse and comprehensive services to improve health and well being and its customers. The company operates its business primarily in the four business segments:
• Uniprise – it delivers customized, integrated benefit services to more than 300 large organizations, representing more than 9 million individuals. It provides health care services to large, multi-location employers and other organizations in three units: Uniprise Strategic Solutions (USS), Definity Health and Excante Financial Service (Excante).
1. Uniprise Strategic Solutions (USS) – is the leading provider of benefit delivery and service solution. The segment also provides large national employers with access to health and well-being services, large scale transaction processing services and technology-based service support.
2. Definity Health – provides consumer-driven health plans and services to employers and their employees.

3
3. Excante Financial Service – provides health-focused financial services for consumers, employers, and providers.
• Health Care Services –is the leading national provider of health benefit plans
and services to small and mid-sized employers. Currently, UnitedHealthCare serves 165,000 small and mid-sized employers, representing nearly 8 million individuals. It consists of the company’s business in UnitedHealthCare, Ovations and AmeriChoice.
1. UnitedHealthCare – provides health services for small and mid-sized employers, and individuals in the U.S. As of December 31, 2005, it provides services to 14 million Americans.
2. Ovations – provides specialized health and well-being services to customers who are 50 years old or older.
3. AmeriChoice – provides services to beneficiaries of state Medicaid, Children’s Health Insurance Programs, and many other government sponsored health care programs.
• Specialized Care Services -- offer a “comprehensive platform of specialty health and
wellness and ancillary benefits, services and resources to specific customer markets nationwide” Some of its services include dental and vision benefits and services and groups insurance services.
• Ingenix – is an international leader in the field of health care data, technology, and
analytics. Some of its services include database and data management services, software products, publications, consulting services, outsourced services and pharmaceutical development and consulting services on a nationwide and international basis.
2005 Revenue by Segments
Healthcare Services
84%
Uniprise8%
Ingenix2%
Specialized Care Services
6%
Healthcare ServicesUnipriseIngenixSpecialized Care Services

4
History & Innovation The company was founded by Richard T. Burke. Richard T. Burke established United HealthCare in 1974 to manage the not-for-profit Physicians Health Plan of Minnesota. Then, the company was incorporated in Minnesota in 1977. However, the United Health Group did not become a public traded company until 1984. Through out its 30 years of history, the company has expanded its business by acquiring many other companies. Since the company was incorporated in 1977, the company has led the market by introducing innovations that make healthcare services more accessible and affordable for Americans. It was the first company to produce Report Card on health care access, quality, and cost measures. In 2002, the company launches myuhc.com, which enables individual customers to order ID cards, check the status of claims, and access relevant health information online. By doing so, the company will meet customers’ needs faster. In addition, the company introduces electronic medical ID card that uses magnetic technology and the MasterCard system and network to make it easy to verify patient eligibility and benefits in a short time. UnitedHealth Group promises to bring more key innovations to enhance its services to its customers. Competitive Strategy The strategic plan for United Health Group, as indicated in the 2005 Annual Report, shows the company’s strengths, challenges and goals for the future. The Chairman of United Health highlights some of these new challenges in his letter to the shareholders. William McGuire states “The challenges are accelerating demographic changes, the escalating cost of new technologies, clinical interventions and research, and increasing complexities around medical decision-making.” The chairman emphasizes the lack of performance through the health care system as the root of all the problems. The Chairman also says that the way the health care system is organized, delivered and administered has to change. The company’s aim is to provide affordable health care for all people. They have been putting into service affordable plans for small business owners. Another goal of United Health Group was investing in new technology and business process improvements. This new technology has allowed United Health to produce modernized and broad applications that scale across the entire health care services industry. Today, United Health is better equipped to improve their health care system. One of the biggest strategies of United Health in the 21st century is the acquisitions of companies to expand its market and to increase its customer base. The company hopes to build its HMO network through acquisitions. In 2002, the company bought AmeriChoice in hoping to expand its Medicaid services business. To enter the individual health insurance market, UnitedHealth Group purchased Golden Rule in 2003 and Definity Health in 2004. In addition, in 2004, the company acquired Mid Atlantic Medical Services, Inc. (MAMSI) in February for a total amount of approximately $2.7 billion and Oxford Health Plans, Inc. (Oxford) in July for $5 billion. Last, but not the least, the company acquired PacifiCare Health Plans, Inc. (PacifiCare) in December 2005 for a total amount of approximately $8.8 billion.

5
Key Executives Robert T. Burke Chairman of the Board William W. McGuire Chief Executive Officer Stephen J. Hemsley Chief Executive Officer, UnitedHealth Group Richard H. Anderson Executive Vice President, UnitedHealth Group,
and CEO, Ingenix G. Mike Mikan Executive Vice President and Chief Financial
Officer, UnitedHealth Group Jeannine M. Rivet Executive Vice President, UnitedHealth Group Reed V. Tuckson Senior Vice President, Consumer Health & Medical Care Advancement, UnitedHealth Group Howard Phanstiel Executive Vice President, Chairman and Chief Executive Officer, PacifiCare L. Robert Dapper Senior Vice President, Human Capital, UnitedHealth Group John S. Penshore Senior Vice President, UnitedHealth Group Tracy L. Bahl Chief Executive Officer, Uniprise William A. Munsell Chief Executive Officer, Specialized Care Services Lois E. Quam Chief Executive Officer, Ovations Robert J. Sheehy Chief Executive Officer, UnitedHealthcare Anthony Welters President and CEO, AmeriChoice David S. Wichmann President and Chief Operating Officer,
UnitedHealthcare, and Senior Vice President, UnitedHealth Group
Simon Stevens Vice President, UnitedHealth Europe James B. Hudak Chief Executive Officer, United Behavioral Health Craig Keyes Chief Executive Officer, UnitedHealthcare of Colorado and New Mexico David Lewis Chief Executive Officer, UnitedHealthcare of Central/North Florida Richard Smith Chief Executive Officer, UnitedHealth Europe Kevin Ruth Chief Executive Officer, Mid Atlantic Region Corporation Management Highlights In the most current new, the company announced some changes to executive management. On December 1, 2006, the company announced that the former CEO, William McGuire, had step down from the position. The new CEO, Stephen J. Hemsley, took the new position. The company strongly believes that under new leadership of CEO, the company will continue to innovate, grow and diversify.
In addition, there are also changes in different levels of management. Richard Anderson, former executive vice president of UnitedHealth Group and chief executive officer of Ingenix, become president of the new Commercial Services Group, including Specialized Care Services, Ingenix

6
and Exante Financial Services. He will also broadly oversee legal and regulatory administration until the chief administrative officer and chief legal officer positions are filled.
Lois Quam, former chief executive officer of Ovations, became the president of the new Public and Senior Markets Group. She will play important roles in developing capabilities and infrastructure on an enterprise level in communications, public relations and government affairs. She also will be in charge of the corporation’s social responsibility programs and health care issues.
William Munsell, former chief executive officer of one the business segments of the company, Specialized Care Services, and Anthony Welters, former chief executive officer of AmeriChoice, are assigned to new tasks. Their new tasks will be reporting directly to the new CEO, Hemsley, to provide greater executive insights. The company anticipates with these changes in the corporation’s management level will help the company to prosper in the future. It strongly believe that under these new leadership, the company will continue to grow. As of December 1, 2006, the company is managed by the Board of Directors that composed of ten highly-experienced executive members and other committees such as Audit Committee, Compensation & Human Resources Committee, Public Responsibility Committee, Nominating Committee, and Executive Committee. These members are highly-experienced who has been in the healthcare industry for many years. All these members work together to achieve the company’s objectives, which are to improve access to health and well-being services, to simplify the health care experience, to promote quality, and to make health care more affordable. III. INDUSTRY ANALYSIS Sector: Health Care Industry: Managed Health
Industry Overview UnitedHealth Group is a member of the Health Care sector as part of the Managed Health Care industry. Healthcare is the largest sector in the U.S. economy and represented an estimated 16.2% of GDP in 2005 as healthcare spending reached $2 trillion. The totals for 2006 are expected to be around $2.2 trillion, and the long term forecasts predict healthcare spending to represent 20% of GDP by 2015. UnitedHealth Group is the second largest publicly traded health insurer in the United States, trailing only WellPoint Inc. and its 34.2 million members. UnitedHealth has 28.3 million health plan members as well as several million specialty plan members. 54.9% of total healthcare spending in 2004 was covered by private health plans. Halfway through 2005, 97% of all covered employees’ health plan memberships were made up by

7
managed care plans. This figure has increased significantly since 1996 when managed care plans made up 73% of private health plans for employees. As opposed to fee-for-service or indemnity plans, managed healthcare plans are prepaid. There are three major types of plans members of managed care companies can choose from. They include Health Maintenance Organizations (HMOs), Preferred Provider Organizations (PPOs), and Point of Service (POS) coverage. In 2005 21% of members were enrolled in HMOs, 61% in PPOs, and 15% in POS plans. Industry Trends Current economic and operating conditions for managed care organizations (MCOs) are improving. Rapidly rising health care costs have slowed; the unemployment rate is steady, and the government continues to fund the industry at increasing levels. In order to counteract the decreasing enrollment in private sector health plans, including a shrinking employer-sponsored health insurance market, MCOs are making several adjustments in their business strategies. These include adding specialty products to their product base in order to offer potential customers a diverse set of choices, and attempting to gain a greater share in programs run by the federal government. The larger companies, UnitedHealth at the forefront, continue their practice of expanding across the U.S. in order to serve corporate clients who operate on a national level and are seeking to limit the number of healthcare vendors they use. Two of the new products MCOs are offering are pharmacy benefits management (PBM), and specialty insurance programs. The two functions of PBMs are pharmaceutical cost control and delivering drugs to clients through mail-order services. Specialty insurance programs include behavioral health services and wellness programs, both of which offer lower premiums as a reward to those customers who live a healthy lifestyle. The other method being used to combat slowing private sector enrollment is an increased focus being placed on entering government markets such as Medicaid and Medicare. Consolidation is another major trend within the managed care sector. In 1996, 27% of the managed care industry was covered by the ten largest health plans. Today that total has reached 65%. Companies are motivated by two factors. The first is increased power in the managed care market. This enables providers to negotiate more favorable contracts with employers and other clients who need coverage across the United States. The second is economies of scale. This reduces administrative costs and helps providers keep premium prices attractive to potential customers. UnitedHealth and WellPoint have been the most active in this respect in recent years, with UnitedHealth purchasing PacifiCare Health Systems Inc. and WellPoint buying WellChoice Inc. Despite these positive trends there remain a number of potential issues and challenges for managed care industry. Healthcare costs may be difficult to control for a number of reasons, and the number of people without health insurance is still increasing. While the aging baby boom generation will undoubtedly add more customers for managed care companies, it will also increase the medical costs associated with their care. Intensifying that issue is the implementation of new and expensive drugs and technology. Biotechnology drugs in particular
8
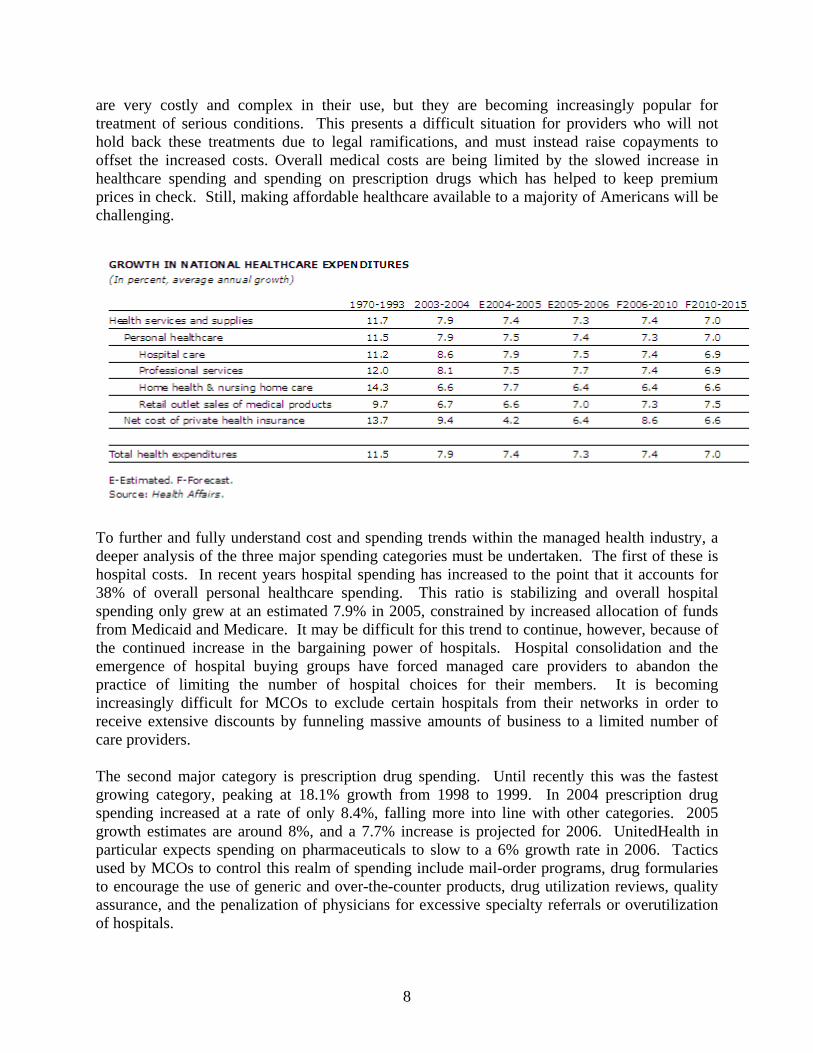
are very costly and complex in their use, but they are becoming increasingly popular for treatment of serious conditions. This presents a difficult situation for providers who will not hold back these treatments due to legal ramifications, and must instead raise copayments to offset the increased costs. Overall medical costs are being limited by the slowed increase in healthcare spending and spending on prescription drugs which has helped to keep premium prices in check. Still, making affordable healthcare available to a majority of Americans will be challenging.
To further and fully understand cost and spending trends within the managed health industry, a deeper analysis of the three major spending categories must be undertaken. The first of these is hospital costs. In recent years hospital spending has increased to the point that it accounts for 38% of overall personal healthcare spending. This ratio is stabilizing and overall hospital spending only grew at an estimated 7.9% in 2005, constrained by increased allocation of funds from Medicaid and Medicare. It may be difficult for this trend to continue, however, because of the continued increase in the bargaining power of hospitals. Hospital consolidation and the emergence of hospital buying groups have forced managed care providers to abandon the practice of limiting the number of hospital choices for their members. It is becoming increasingly difficult for MCOs to exclude certain hospitals from their networks in order to receive extensive discounts by funneling massive amounts of business to a limited number of care providers. The second major category is prescription drug spending. Until recently this was the fastest growing category, peaking at 18.1% growth from 1998 to 1999. In 2004 prescription drug spending increased at a rate of only 8.4%, falling more into line with other categories. 2005 growth estimates are around 8%, and a 7.7% increase is projected for 2006. UnitedHealth in particular expects spending on pharmaceuticals to slow to a 6% growth rate in 2006. Tactics used by MCOs to control this realm of spending include mail-order programs, drug formularies to encourage the use of generic and over-the-counter products, drug utilization reviews, quality assurance, and the penalization of physicians for excessive specialty referrals or overutilization of hospitals.
9
The final spending category is physician services. Slowing price hikes and decreased spending on doctors led to physician care growing at a rate of 7.9% in 2005 compared with 8.2% in 2004. From 2002 to 2004 spending on physician services accounted for up to 29% of the total growth in healthcare spending. Industry Growth Over the past ten years the managed health care industry has outperformed the rest of the health care sector and markets as a whole. Midway through 2006 average revenue for the industry was up 24.4% and analysts, including those from Standard & Poor’s, expect similar results through the end of the year. Earnings per share figures are also expected to grow as much as 20% on average. This is a result of premium prices increasing at a higher rate than medical costs and adding new clients through the sale of new products to markets previously ignored. The largest of these markets includes those individuals and small businesses which remain uninsured, a group estimated to contain 45 million people.
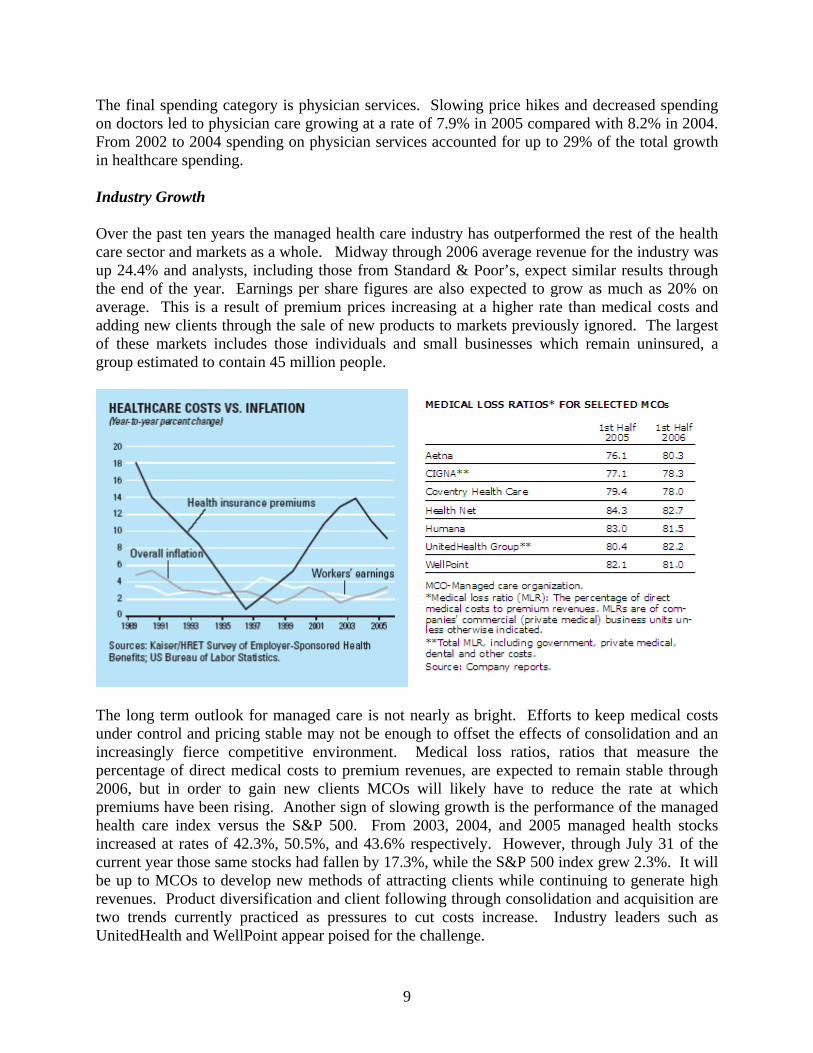
The long term outlook for managed care is not nearly as bright. Efforts to keep medical costs under control and pricing stable may not be enough to offset the effects of consolidation and an increasingly fierce competitive environment. Medical loss ratios, ratios that measure the percentage of direct medical costs to premium revenues, are expected to remain stable through 2006, but in order to gain new clients MCOs will likely have to reduce the rate at which premiums have been rising. Another sign of slowing growth is the performance of the managed health care index versus the S&P 500. From 2003, 2004, and 2005 managed health stocks increased at rates of 42.3%, 50.5%, and 43.6% respectively. However, through July 31 of the current year those same stocks had fallen by 17.3%, while the S&P 500 index grew 2.3%. It will be up to MCOs to develop new methods of attracting clients while continuing to generate high revenues. Product diversification and client following through consolidation and acquisition are two trends currently practiced as pressures to cut costs increase. Industry leaders such as UnitedHealth and WellPoint appear poised for the challenge.

10
Analysis of Competitive Forces- Michael Porter Method Rivalry The managed care industry is extremely competitive and the struggle to maintain current clients and attract new customers is consistently challenging. Price pressures on premiums are continually increasing and major players within the industry seek to grow revenues through several methods. As mentioned before, these include product diversification and acquisition of smaller companies to serve clients in different regions. Providers such as Coventry and Humana that have traditionally been regional enterprises are prime candidates for takeover by the larger managed health companies. To remain successful MCOs will have to continue to effectively manage costs, offer new and improved technologies, and be ready to take advantage of potential acquisitions. Threat of New Entrants The threat of start up companies entering the managed care market is very minimal with current consolidation trends. An existing large company joining the industry by acquiring an existing managed care enterprise is always a possibility, but is not considered to be a real threat. The grip the major players have on market share will likely strengthen as these large companies continue to make innovations service and plan options and grow nationally. Threat of Substitute Products or Services UnitedHealth faces the challenge of continuing to offer competitive prices for its services in the face of new and expensive drugs and technology being introduced. Expectations are for premiums to rise moderately across the industry and customers will stay with those providers who can offer the best services and affordable prices. UnitedHealth looks to remain an industry

11
leader in making these new biotechnology drugs and customized service plans available to their customers, with the increased use of generic prescription drugs helping to contain costs. Ensuring clients have sufficient choice of hospitals and specialty service plans such as wellness and behavioral health services is essential to maintaining market share and customer loyalty. Bargaining Power of Suppliers As previously discussed, hospitals have gained significant leverage in their dealings with MCOs. Through consolidation and the emergence of hospital buying groups, hospitals have been able to avoid the giving sizeable discounts in order to attract business. This has led to medical costs becoming a larger percent of total costs for MCOs in recent years. To combat this MCOs have become more focused on monitoring physician referrals and drug prescriptions. As hospitals continue to use new technologies for patient care, keeping costs under control will become increasingly important and challenging. Bargaining Power of Customers Customers including individuals, small businesses, and corporate buyers are gaining increased power to negotiate specialty plans, choose hospitals and physicians, and select specific prescription drugs according to price. With companies looking to consolidate their health care vendors, MCOs need to expand nationally to service these clients and maintain profitability. The challenges are significant, and despite premium rates continuing to rise, MCOs will have to overcome increasing medical costs while still offering competitive prices. Relative Industry Valuation Over the past year the overall healthcare sector has slightly underperformed compared to the S&P 500, especially in the 4th quarter.
Stocks within the managed care industry have underperformed as well.

12
However, P/E multiples within the industry have traditionally moved with the market as a whole and are 20% higher than the S&P 500 thus far in 2006. Analysts project managed care P/E figures to remain as high as 15% above the S&P in 2007. From this analysis we believe that earnings for companies in the managed care industry have significant room to grow relative to the S&P 500, and their earnings appear to be highly valued and attractive to investors at this time.

13
IV. FUNDAMENTAL ANALYSIS 1. Financial Ratio Analysis 1)Operating Ratios: Operating ratios show the efficiency witch income dollars are generated form revenue. Gross Margin: The Gross Margin has been in line with its competitors over the past five years and outperformed the industry from 2000-2005. This is a good sign because it shows that the company has been keeping goods costs under control. It also shows that the company has outperformed over the past five years against the Industry.
Gross Margin
0.00%10.00%20.00%30.00%40.00%50.00%
2000 2001 2002 2003 2004 2005
United Health
Aetna
Wellpoint
Humana
Industry Avg
Operating Margin: This measurement shows the company’s income after paying for costs. The company has been in line with its competitors in 2005 and outperformed its competitors 2001 to 2004. UNH outperformed its competitors.
Operating Margin
-2.00%
0.00%
2.00%
4.00%
6.00%
8.00%
10.00%
12.00%
14.00%
2000 2001 2002 2003 2004 2005
United HealthAetnaWellpointHumana Industry Avg

14
2)Profitability Ratios: These ratios are the most important ratios because they show the business’s ability to generate earnings or profits compared to its expenses or other cost during a specific period of time. Net Profit Margin: Net Profit margin has been in line with its competitors from 2000-2005 and outperformed the industry from 2000-2005. Net profit margin is a ratio of profitability calculated as net income divided by revenues, or net profits divided by sales. It measures how much out of every dollar of sales a company actually keeps in earnings. Net Income hasn’t been growing higher the past 2 years because the company paid their acquisitions of 2004 and 2005.
Net Profit Margin
-15.00%
-10.00%
-5.00%
0.00%
5.00%
10.00%
15.00%
2000 2001 2002 2003 2004 2005
United HealthAetnaWellpointHumana Industry Avg
ROE: The company’s return on equity outperformed tremendously relative to its competitors and industry from 2000-2005. In 2005, UNH reported 23.20%, greater than the industry average at 15.54%. Return on Equity is one of major profitability ratios that measures how much profit a company generates with the money shareholders invested. The company has the highest profitability ratio in the industry form 2000-2005.

15
ROE
-40.00%-30.00%-20.00%-10.00%
0.00%10.00%20.00%30.00%40.00%50.00%
2000 2001 2002 2003 2004 2005
United HealthAetnaWellpointHumana Industry Avg
ROA: UNH return on assets outperformed its competitors and industry from 2000-2005. Return on Assets shows an income dollar generated per dollar of assets. It also shows how profitable a company it’s relative to its assets. It also demonstrates how efficient management is at using its assets to generate earnings. The ratio went down in 2005 because growth of assets was higher than net income.
ROA
-8.00%-6.00%-4.00%-2.00%0.00%2.00%4.00%6.00%8.00%
10.00%12.00%14.00%
2000 2001 2002 2003 2004 2005
United HealthAetnaWellpointHumana Industry Avg
3)Long- term Solvency and Debt Capacity: Long-term solvency shows the company’s ability to meet their debts obligations. Debt to Equity: It indicates what proportion of equity and debt the company is using to finance its assets. The company is in-line with the industry and competitors. UNH is less risky than Aetna and Humana in 2005. United Health has a higher debt/equity ratio in 2002 and 2004 because of their acquisition of Americhoice in 2002 and Mid-Atlantic Medical Services and Golden Rule Financial Corporation in 2004.

16
Debt/Equity
0.000.200.400.600.801.001.201.401.601.80
2000 2001 2002 2003 2004 2005
United HealthAetnaWellpointHumana Industry Avg
TIE: Total Interest Expense is calculated by taking the company’s earnings before interest taxes divided by their interest expenses. The company outperformed the industry from 2000-2005, competitors from 2000-2005. This is an important ratio because it measures the company’s ability to meet the interest on its debts obligations. It indicates that UNH has a great ability to pay interest payment when it’s due.
TIE
-5
0
5
10
15
20
25
30
35
2000 2001 2002 2003 2004 2005
United Health
Aetna
Wellpoint
Humana
Industry Avg
4)Liquidity Ratios: Liquidity ratios show the capability to convert an asset into cash quickly. Current Ratio: Current ratio is the ability to pay back its short-term liabilities with its short-term assets. The company underperformed the competitors and industry from 2000-2005. The reason why the ratio is low is because of their acquisitions in the 21th century. In 2004, the company issued 1.2 billion of commercial paper to fund portion of Oxford purchase price, which helps to explain

17
the increase in current liabilities. In November and December 2005, the company issued $2.6 billion of commercial paper, primarily to finance the cash portion of the purchase price of the PacifiCare acquisition to retire a portion of the PacifiCare debt upon closing of the acquisition as well as to refinance maturing long term debt.
Current Ratio
0.00
0.50
1.00
1.50
2.00
2.50
3.00
2000 2001 2002 2003 2004 2005
United Health
Aetna
Wellpoint
Humana
Industry Avg
Receivables Turnover: The receivables turnover outperformed the industry from 2000-2005 and competitors from 2002-2005. This ratio quantifies the firm’s effectiveness in extending credit as well as collecting debts. This shows that the company’s collection of accounts receivable is the most efficient compared to its competitors.
Receivables Turnover
0.00
10.00
20.00
30.00
40.00
50.00
60.00
2000 2001 2002 2003 2004 2005
United Health
Aetna
Wellpoint
Humana
Industry Avg
The DuPont Analysis is a method that shows the effect of asset turnover, net profit margin and financial leverage on return of equity. The return of equity is equal to the multiplication of those three ratios. By analyzing each of these ratios, we can compare each ratio with its previous years.

18
The asset turnover shows how effectively a company is using its assets to generate sales which it means the amount of sales generated per $ 1 of assets. The Net Profit Margin is a ratio of profitability- it measures the company’s earnings. In 2005, the company’s net profit margin is 7.27, higher than the previous years. The net profit margin has been increasing every year because United Health costs are under control. In addition, the financial leverage in 2005 is 2.43 lower than 2004 at 2.87. This ratio shows the company’s capacity to pay debt. In 2005, the return on equity for United Health Group is 23.14%, lowest than the previous years, which is basically driven by slightly lower asset turnover and slightly lower financial leverage. Even though, the return of equity is not higher in 2005 than other years; the company outperformed the competitors and industry in 2005. DuPont Analysis 2002 2003 2004 2005 ROE 31.97 38.15 32.71 23.14 Asset Turnover 1.85 1.81 1.64 1.31 Net Profit Margin 5.4 6.33 6.95 7.27 Financial Leverage 3.2 3.33 2.87 2.43
2. Valuation Models Selecting the proper valuation model in determining what a stock is worth today can be a daunting task. Using the relative valuation models, we compared UnitedHealth Group to competitors, its industry, and S&P 500 allowing us to come up with five price estimates. Through many calculations during the absolute valuation, we were able to calculate present values of discounted cash flows with the help of the Dividend Discount Model (DDM). Estimated price of the stock’s intrinsic value was found if grown at a certain percent over the next five years using two different costs of capital. After completion of both models, UnitedHealth Group was found to be undervalued by a great deal given its closing price of $50.09 on 12/11/06. Relative Valuation This part of the report allows us to exemplify the company’s position relative to Aetna, WellPoint, Humana, the Managed Healthcare industry, and the S&P 500. The following charts show how the five price estimates came about using the P/E ratios from 2000-2006 along with expected multiples for 2007 and the 7-year industry average, the arithmetic averages, and E[EPS2007]:

19
Looking at UnitedHealth compared to three of its competitors, they have had higher multiples in every year other than WellPoint in 2005. Although in 2000 Humana had a higher multiple, it was by .34 which is a minute number when comparing the two. This signifies UNH has expected higher growth in the future relative to competitors and investors may be willing to pay a higher price for each dollar of their earnings. The higher the P/E, the more valuable the market believes UnitedHealth’s earnings are.
In comparison to the Managed Healthcare industry, 2000 was the only year where the industry had a higher multiple where the difference with UNH was greater than eight. Although the industry was slightly more in 2002 and 2003, UNH has been close to or exceeded the industries multiple and is predicted to do so next year as well.
From 2001 to 2003, the S&P 500 had a higher multiple due to the large growth that was expected in the beginning of the millennium and although its multiple was cut in more than half by 2003, it still remained higher than UnitedHealth.
The arithmetic averages were achieved by adding the relative P/E’s in each row, where a number was listed, and dividing by the number of years. These are key figures, as they were part of the equation in determining each price estimate.
P/E2000 2001 2002 2003 2004 2005 2006 E2007
UnitedHealth 27.90 25.28 19.69 19.66 22.34 25.06 25.06 20.27
Ind. Average 36.60 23.80 20.10 21.10 19.00 17.30 19.12 16.57
P/E2000 2001 2002 2003 2004 2005 2006 E2007
UnitedHealth 27.90 25.28 19.69 19.66 22.34 25.06 25.06 20.27
P/E2000 2001 2002 2003 2004 2005 2006 E2007
UnitedHealth 27.90 25.28 19.69 19.66 22.34 25.06 25.06 20.27Aetna --- --- --- 11.42 16.08 17.46 14.75 14.70Wellpoint 15.00 14.00 13.80 18.90 20.30 16.05 15.40Humana 28.24 16.84 11.76 16.21 17.26 29.05 19.00 18.80Ind. Average 36.60 23.80 20.10 21.10 19.00 17.30 19.12 16.57S&P500 26.40 46.49 31.89 22.82 20.70 17.85 15.89 14.39
7-Yr Ind Avg 22.43
UNH's P/E Relative to Competitors, Industry Average, S&P500 Arithmetic Avg MedianUNH/AET --- --- --- 1.72 1.39 1.44 1.70 1.56 1.57UNH/Wellpoint 1.69 1.41 1.42 1.18 1.23 1.56 1.42 1.33UNH/Humana 0.99 1.50 1.67 1.21 1.29 0.86 1.32 1.26 1.25UNH/Ind.Avg. 0.76 1.06 0.98 0.93 1.18 1.45 1.31 1.10 1.24UNH/S&P500 1.06 0.54 0.62 0.86 1.08 1.40 1.58 1.02 1.24
S&P500 26.40 46.49 31.89 22.82 20.70 17.85 15.89 14.39

20
The above price estimates were calculated by multiplying the expected 2007 P/E’s of each comparable listed, the E[EPS2007], and the arithmetic average of the historical relationship between UNH and each comparable. The average of the five price estimates is $69.53; $20 more than its current trading price. The $84.31 was calculated using the 7-year industry average P/E, which was 22.43. As we can see, using this valuation model signifies that UnitedHealth Group is currently undervalued across the board. Given these estimates from this model, the company cannot be overlooked as this seems to be an ideal buying opportunity. Absolute Valuation This valuation model allowed us to estimate UnitedHealth’s intrinsic value by discounting their cash flows (CF’s) through the use of the Dividend Discount Model (DDM). The first step was to determine two different costs of capital, k1 and k2, to calculate the PV of the dividend CF’s. This can be seen through the following:
Then, in order to estimate the dividend for 2007, we had to calculate the average payout ratio over the last ten years and obtain an E[EPS2007]. UnitedHealth has historically displayed a similar pattern in the way they payout dividends. For this reason, we decided to estimate dividends from 2008 to 2011 rather than grow them by a certain percent. Let it be known, over the last ten years UnitedHealth’s dividends per share have grown no less than 23.11% annually and in the nearer term, no less than 31.95% annually. These staggering figures allow us to draw the conclusion UnitedHealth is showing no signs of slowing down in the near future. The chart below gives us a better understanding of how UnitedHealth has paid out dividends:
E[EPS2007]: Price Estimates Average of 5 Price Estimates$3.43 $69.53
Aetna $78.72Wellpoint $74.78Humana $81.55 7-Yr Ind Avg ValueInd. Average $62.28 $84.31S&P500 $50.34
CURRENT PRICE: $50.09(as of 12/11/06)
UNH PAYOUT RATIOS FOR LAST 10 YEARSYEARS 1996 1997 1998 1999 2000 2001 2002 2003 2004 2005 2006
DPS 0.00375 0.00375 0.00375 0.00375 0.00375 0.0075 0.0075 0.0075 0.015 0.015 0.03EPS 0.22 0.14 -0.14 0.40 0.55 0.70 1.06 1.48 1.97 2.48 2.95
Payout Ratios 0.0170455 0.02678571 -0.02679 0.009375 0.006818 0.010714 0.007075 0.005068 0.007614 0.006048 0.010169
Cost of Capital, k CAPM… YTM on bonds outstanding = 5.41% 10-year treasury strip (11/17/06) = 4.65% beta = 0.175 Another k, cost of capital = rmkt - rf = 5.70% YTM = 5.41%
E(runh) = .0465 + .175 (.057) Cost of Equity Premium = 3.00% E(runh) = k1 = 5.65% E(rbond) = k2 = 8.41%

21
Next, assuming a dividend of $0.06 for 2011, we grew this figure by seven different growth rates to estimate 2012 dividends. Once these figures were calculated, we implemented the DDM to estimate intrinsic values of all post-2011 dividends using the formula of E[DPS1] / (k-g). As mentioned and shown earlier, the two costs of capital (k1 from CAPM and k2 from YTM on 10-year bonds from UnitedHealth) were used in separate charts showing seven different PV’s as of 2011.
Using the above intrinsic values, we had to calculate PV’s using different costs of capital under a series of growth rates. The second k, 8.41% remained the same while the first k was different. To get the five different k’s, we used Treasury Strips on 11/17/06 that mature each year for the next five years. The final task was to find the growth rate which would produce a PV that matched the price of UnitedHealth as of December 31, 2006 (highlighted blue). These values (highlighted red), signify that if UnitedHealth experiences growth of 5.55% at k1 and 8.32% at k2 every year after 2011, its value will be $63.14 and $73.30 respectively in 2011.
DDM…E[DPS1] / k - g
E[DPS2012] k1 g est(IVEOY2011) E[DPS2012] k2 g est(IVEOY2011)est(IVEOY2011)1 = 0.0618 0.0565 0.03 2.332 est(IVEOY2011)1 = 0.0618 0.0841 0.03 1.142est(IVEOY2011)2 = 0.0624 0.0565 0.04 3.782 est(IVEOY2011)2 = 0.0624 0.0841 0.04 1.415est(IVEOY2011)3 = 0.063 0.0565 0.05 9.692 est(IVEOY2011)3 = 0.063 0.0841 0.05 1.848est(IVEOY2011)4 = 0.0636 0.0565 0.06 -18.171 est(IVEOY2011)4 = 0.0636 0.0841 0.06 2.639est(IVEOY2011)5 = 0.0642 0.0565 0.07 -4.756 est(IVEOY2011)5 = 0.0642 0.0841 0.07 4.553est(IVEOY2011)6 = 0.0648 0.0565 0.08 -2.757 est(IVEOY2011)6 = 0.0648 0.0841 0.08 15.805est(IVEOY2011)7 = 0.0654 0.0565 0.09 -1.952 est(IVEOY2011)7 = 0.0654 0.0841 0.09 -11.085
7 Estimates of 2012 Dividends - - - - - - - - - - - - - > DPS2011 (1+g) est(DPS2012)0.06 1.03 0.0618
2011 2012 0.06 1.04 0.06240.06 1.05 0.0630.06 1.06 0.0636
0.06 ? 0.06 1.07 0.06420.06 1.08 0.06480.06 1.09 0.0654
AVERAGE ANNUAL GROWTH RATE OF UNH'S DPS Average Annual Growth Rate10 YEARS 1996 1997 1998 1999 2000 2001 2002 2003 2004 2005 2006 (Geometric Average)
0.00375 0.00375 0.00375 0.00375 0.00375 0.0075 0.0075 0.0075 0.015 0.015 0.030.00 0.00 0.00 0.00 1.00 0.00 0.00 1.00 0.00 1.00 23.11%
5 YEARS 2001 2002 2003 2004 2005 20060.0075 0.0075 0.0075 0.015 0.015 0.03
0.00 0.00 1.00 0.00 1.00 31.95%
4 YEARS 2002 2003 2004 2005 20060.0075 0.0075 0.015 0.015 0.03
0.00 1.00 0.00 1.00 41.42%
E[EPS2007] = $3.43 2007 2008 2009 2010 2011Payout2007 = 0.00786E[DPS2007] = 0.02696
0.03 0.03 0.06 0.06 0.06

22
As we saw on the previous page, UnitedHealth hasn’t experienced dividend growth any less than 23.11% for the last ten years and no less than 31.95% its last five. Based on this valuation model, we believe the company’s growth will not slow down to growth levels of 5.55% or 8.32%, which leads us to believe that the value of the stock should be higher than its current price. 3. Potential Risk Factors: Throughout the report we have covered many of the issues facing UnitedHealth Group and the managed health care industry as a whole. Following is a quick recap of challenges that may lie ahead:
• Historical Volatility of Stock Prices Within the Healthcare Sector • Balancing Rising Healthcare Costs With Downward Pressure On Premium Rates
to Maintain High Profits • Disturbance Caused By Review of Past Stock Option Grant Practices
o Potential Fines and Litigation o William Maguire Steps Down as CEO o Financial Restatements o Short Term Low Trading Volume Probable
However, UnitedHealth has taken positive steps to handle the stock option problem and mitigate these risks. Current COO Steve Hemsley signed a 4 year deal as CEO. He is considered one of the best operators in the industry and on the Street and his presence should ease potential concerns about the future of the company. Also, these restatements are likely to be non-cash related.
E[DPS2012] k2 g est(IVEOY2011)0.0650 0.0841 0.0832 73.2990
E[DPS2012] k1 g est(IVEOY2011)0.0633 0.0565 0.0555 63.1398
est(IVEOY 2006)0.95731.13941.4283
---1.95683.2351
10.749149.14
-7.2080
0.80290.98501.2739
---1.80243.080710.594749.0105-7.3624
est(IVEOY 2006)2.00853.13227.713349.14
-13.8836-3.4851-1.9364
----1.3123
1.85412.97787.5589
48.9857-14.0380-3.6395-2.0908
----1.4667
g0.030.040.05
0.0554970.060.070.08
0.08320.09
k2 PVK20.0841 0.02770.0841 0.02550.0841 0.04710.0841 0.04340.0841 49.0105
Years E[DPS1] k1 PVK12007 0.03 0.0589 0.02832008 0.03 0.0573 0.02682009 0.06 0.0565 0.05092010 0.06 0.0555 0.04832011 0.06 0.0523 48.9857
PV of "7 Lump Sum Terminal Values"

23
4. Investment Drivers: UnitedHealth Group is the second largest managed care provider in the United States, serving large, mid, and small-sized companies across the country. Through their three major business segments, Uniprise, Health Care Services, and Ingenix, plus their Specialized Care Services, United Health reaches over 70 million individuals with their diverse service plans and competitive prices. With the U.S. population aging, the demand for managed care services will continue to increase. The baby boomer generation will lead the search for competitively priced and flexible health care plans that offer both access to new technologies and hospitals with high quality service. The challenge for MCOs will be to manage rising medical costs, contain premium rates, and continue to generate revenue. Leaders in the managed care industry such as UnitedHealth are going to see increased revenue and profitability due to this increase in demand and their ability to expand nationally. UnitedHealth has been one of the most active companies within managed care in terms of acquisitions, including their latest purchase of PacifiCare Health Plans. This strategy will allow UnitedHealth to serve those of its clients who operate on a national level, and it will allow the company to enjoy economies of scale. Also, the increased use of generic prescription drugs across the industry will help to keep drug costs at a reasonable level and positively affect the bottom line. V. Recommendation Since 1977, UnitedHealth has grown to become a dominant force within the managed care industry. By consistently employing innovative strategies the company continues to make healthcare services more accessible and affordable for its members. Investment in new technology and business process improvement has allowed UnitedHealth to slow the growth of operating costs over the past five years. This has helped to limit premiums and make healthcare plans more affordable for small and mid-sized businesses. Also, the company has engaged in several acquisitions in recent years to better accommodate its larger customers and operate efficiently on a national scale. These strategies will help UnitedHealth to respond to the increasing demand for managed care. As previously mentioned, the population is aging and the need for quality healthcare service is growing. Millions of Americans remain uninsured, and as the number one most admired healthcare company according to Fortune, UnitedHealth is poised to gain a significant percentage of this and other markets. Finally, UnitedHealth stands out among competitors in terms of its financials. The company has been among the industry leaders in Operating Margin, Net Profit Margin, and Times Interest Earned. Also, UnitedHealth has been the clear leader in Return on Equity and Return on Assets. These are clear signs of a well-run and financially efficient company. This coupled with the

24
relative and absolute valuations which show UnitedHealth to be undervalued lead us to believe the company is a very attractive candidate for the Investment Fund. Therefore, we recommend the purchase of 325 shares at the current market price of ($50.09) for a total investment of $16,279.25.
References
• http://www.unitedhealthgroup.com
• UnitedHealth Group’s Annual Reports (1999-2005)
• http://www.hoovers.com
• http://www.marketwatch.com
• http://www.morningstar.com
• http://www.finance.yahoo.com
• http://www.bigcharts.com
• http://www.netadvantage.standardandpoors.com