ssrn-id277549
TRANSCRIPT

Fondazione Eni Enrico Mattei
Climate Change Impacts on theMediterranean Coastal Zones
Frédéric Brochier* and Emiliano Ramieri**
NOTA DI LAVORO 27.2001
APRIL 2001CLIM – Climate Change, Modelling and Policy
*Fondazione Eni Enrico Mattei**Thetis, Venice, Italy
This paper can be downloaded without charge at:
The Fondazione Eni Enrico Mattei Note di Lavoro Series Index:http://www.feem.it/web/activ/_activ.html
Social Science Research Network Electronic Paper Collection:http://papers.ssrn.com/abstract=277549
Fondazione Eni Enrico MatteiCorso Magenta, 63, 20123 Milano, tel. +39/02/52036934 – fax +39/02/52036946
E-mail: [email protected]. 97080600154
CLIMATE CHANGE IMPACTSON THE MEDITERRANEAN
COASTAL ZONES
Frédéric BROCHIEREmiliano RAMIERI

2
CONTENTS
INTRODUCTION................................................................................................................................................................................3
I / CLIMATE CHANGE AND THE GLOBAL WARMING: OVERVIEW.......................................................................4
1.1 THE GREENHOUSE EFFECT AND ITS CAUSES.............................................................................................................................41.2 THE PAST AS A KEY TO THE FUTURE.........................................................................................................................................9
1.2.1 Past trends of climatic variables.....................................................................................................................................91.2.2 Past trends in sea level .................................................................................................................................................. 11
1.3 PROJECTIONS OF CLIMATE CHANGE .......................................................................................................................................131.3.1 IPCC scenarios for the future....................................................................................................................................... 131.3.2 Temperature projections.............................................................................................................................................1761.3.3 Projections of other variables...................................................................................................................................... 161.3.4 Sea level projections...................................................................................................................................................... 18
II THE MEDITERRANEAN BASIN............................................................................................................................................22
2.1 DESCRIPTION .............................................................................................................................................................................222.1.1 Morphology and hydrology .......................................................................................................................................... 222.1.2 The climate of the Mediterranean................................................................................................................................ 232.1.3 Natural features.............................................................................................................................................................. 242.1.4 The human factor............................................................................................................................................................ 25
2.2 CLIMATE CHANGE IN THE MEDITERRANEAN BASIN.............................................................................................................282.2.1 Past trends of climatic variables and related parameters....................................................................................... 282.2.2 Future projections for the Mediterranean ................................................................................................................. 32
III IMPACTS OF CLIMATE CHANGE.....................................................................................................................................37
3.1 VULNERABILITY, SENSITIVITY AND ADAPTABILITY OF NATURAL AND HUMAN SYSTEMS.............................................373.2 CLIMATE CHANGE IMPACTS ON COASTAL ZONES IN THE MEDITERRANEAN....................................................................38
3.2.1 Biogeophysical impacts................................................................................................................................................. 393.2.2 Socio-economic Impacts................................................................................................................................................ 463.2.3 The UNEP/MAP Site specific studies.......................................................................................................................... 583.2.4 Climate change impacts on the Mediterranean islands........................................................................................... 61
CONCLUSIONS .................................................................................................................................................................................63
REFERENCES....................................................................................................................................................................................67

3
INTRODUCTION
Climate change is widely recognised as a serious threat to the world’s environment. In 1995, theIntergovernmental Panel on Climate Change [IPCC, 1996a]1 concluded that: “the balance ofevidence suggests that there is a discernible human influence on climate change” and asserted thatclimate is expected to continue to change in the future. More recently Tett et al. [1999] argued thatthe increase of the superficial temperature of the earth-atmosphere system is nearly entirelycorrelated with anthropic pressures on the climate system. The fact that these changes are likely tooccur at a faster rate than any that have occurred during mankind’s recorded history, is alsogenerally agreed upon.
The United Nations Framework Convention on Climate Change (UNFCCC) defines climate changeas “a change of climate which is attributed directly or indirectly to human activity that alters thecomposition of the global atmosphere and which is in addition to natural climate variabilityobserved over comparable time periods”. In this paper we employ this definition, and will refer toclimate change as those variations in climate which are associated with the enhanced greenhouseeffect, the latter effect being caused by human induced variations in the atmospheric concentrationand distribution of greenhouse gases and aerosols.
The main objective of this paper is to highlight the potential impacts of changes in climaticconditions and in related variables, which could affect coastal areas, as well as to identify potentialresponse measures which could reduce the vulnerability of coastal systems and enhance theiradaptability. Attention will be focused on the Mediterranean basin which is in the climate changecontext, a zone of great interest and of recent concern at the world scale by some features:§ strong ocean-atmosphere-land interactions;§ contrast between the small size of the sea and its significant role in the global climate system;§ possibility to use it at a scaled down model for the monitoring of environmental and climate
evolution;§ critical environmental conditions of some areas and high human pressure;§ strong geographical, socio-economic and climatic contrasts.
Although understanding of climatic processes and the capacity of climatic models to simulate themare improving rapidly, uncertainty remains a common denominator of present scenarios, previsionand assessment of future climate evolution and impacts [ECLAT-2, 1999]. In addition, mainly dueto the coarse resolution of global climate models, uncertainty tends to increase when narrowingdown to the regional scale. The quantification of climate change impacts is therefore a complextask, in particular socio-economic implications are difficult to forecast, because of the complexinter-relation between environmental and socio-economic parameters. The result of theseconstraints is that many studies have focused on particular areas of specific vulnerability (like theNile delta) rather than considering the vulnerability of the whole Mediterranean basin in the light ofthe climate change and sea level rise impacts. This paper is therefore an attempt to draw a generalpicture of the likely impacts of climate change on coastal zones of the Mediterranean.
The paper is structured as follows. The fist section provides an introduction to the climate changeissue, the past trends and the projections of future climate at the global scale. The second sectionpresents the main features of the Mediterranean basin and some relevant regional projections offuture climatic variables. The third section focuses on the main likely impacts on the Mediterraneancoasts. Different coastal systems - such as islands, deltas, estuaries, coastal wetlands and coastal 1 pp. 4-5

4
cities – and different climate change impacts – such as inundation, increased flooding, salinisation,salt water intrusion, desertification, and increased erosion - are addressed in this section. Finally thelast section brings some conclusions and identify some strategies of adaptations and directions forfuture research aimed at improving our ability to predict and assess the local impacts of climatechange in the region.
I / CLIMATE CHANGE AND THE GLOBAL WARMING: OVERVIEW
1.1 THE GREENHOUSE EFFECT AND ITS CAUSES
The earth’s climate system is controlled by a continuous flow of energy coming from the sun. Tobalance the incoming solar energy, the Earth exports the same amount of energy to space in theform of longer wavelength radiation (infrared). The gases of the atmosphere which have the abilityto absorb and successively emit infrared radiation are known as greenhouse gases. They are capableof trapping part of the thermal radiation emitted by the earth’s surface, producing a naturalgreenhouse effect that keeps the planet warmer (by 33 °C)2 than it otherwise would be. Clouds alsocontribute in controlling the Earth’s energy balance by absorbing and emitting thermal radiation.Moreover, they have a primary role in reflecting incoming solar radiation. On average these twoprocesses tend to balance each other, even if on a global scale the net effect of clouds on the climateis a small cooling of the surface. Changes in greenhouse gas concentrations influence the energybalance of the Earth. An increase in the concentration of these compounds produces an increase inthe capacity of the atmosphere to trap thermal radiation and tends to warm the lower atmosphereand the earth’s surface. The IPCC has called this process the enhanced greenhouse effect. Since theindustrial revolution, human activities have increased continuously the concentration of greenhousegases in the atmosphere. The magnitude of warming depends on the size of this increase and on theradiative properties of gases. In order to quantify through a simple measure the importance of aclimate change mechanism, such as the increase of carbon dioxide concentration in the atmosphere,IPCC [1994] has introduced the concept of radiative forcing as: “the perturbation of energy balance(in W/m2) on the surface-troposphere3 system, after allowing for the stratosphere4 to re-adjust to astate of global mean radiative equilibrium”. In practice a positive radiative forcing, such as thatinduced by an increase in greenhouse gas concentration, tends to warm the surface and a negativeradiative forcing tends to cool the surface. In the following section, we sum up briefly the evolutionof the main greenhouse gas and aerosol in the atmosphere, and the feedback processes which arelikely to modify the climate response.
According to IPCC [1996a]5 the concentration of the main greenhouse gas, carbon dioxide, hasincreased from about 280 ppmv6 in pre-industrial times to 358 ppmv in 1994 (figure 1). Thisincrease is mainly due to human activities such as fossil fuel combustion, cement production andchanges in land use.
The concentrations of methane have also increased since pre-industrial times. The rise from about700 ppbv to 1720 ppbv is mainly the result of human activities such as agriculture, waste disposaland production and use of fossil fuel. According to the IPCC [1996a]7, anthropogenic activities are
2 The annual average temperature of the earth’s surface is about 15 °C.3 The lowest part of the atmosphere from the surface to about 10 km in altitude in mid-latitudes. It is generally definedas the region where temperature generally decrease with height.4 The high region of the atmosphere above the troposphere, extending from about 10 km to 50 km.5 pp. 14-176 1 ppmv = 1 part per million by volume.7 pp. 17-19

5
responsible for about 60-80% of current methane emissions. Climate change can have a retroactiveeffect on methane emissions by indirectly increasing emissions due to greater microbial activities.
Table 1: Greenhouse gases concentration in relation to human activities [source: IPCC 1996a]8
CO2 CH4 N2O CFC-11 HCFC-22•• CF4♣♣
Pre-industrial concentration ∼280 ppmv ∼700 ppbv9 ∼275 ppbv 0 0 0
Concentration in 1994 358 ppmv 1720 ppbv 312♦ ppbv 268♦ pptv10 110 pptv 72♦ pptv
Rate of concentration change ♠♠ 1.5 ppmv/yr0.4%/yr
10 ppbv/yr0.6%/yr
0.8 ppbv/y r0.25%/yr
0 pptv/y r0%/yr
5 pptv/y r5%/yr
1.2 pptv/y r2%/yr
• a CFC substitute♣ a per-fluorocarbon♦ estimated from 1992-1993 data♠ the growth rates of CO2, CH4, and N2O are averaged over the decade beginning 1984; halocarbon growth rates
are based on recent years (1990s).
Figure 1: CO2 concentration over the past 1000 years from ice core records (D47, D57, Siple andSouth Pole) and (since 1958) from Mauna Loa, Hawaii, measurement site. All ice covermeasurements were made in Antarctica. The smooth curve is based on a hundred year running mean[source: IPCC 1996a]11.
800 1000 1200 1400 1600 1800 2000
Year
380
360
340
320
300
280
260
D57
D47Siple
South PoleMauna Loa
Fossil CO emissions2
One hundred yearrunning mean
380
360
340
320
300
280
CO
con
cent
ratio
n (p
pmv)
2
CO
con
cent
ratio
n (p
pmv)
2 1850 1900 1950 2000
Foss
il C
O e
mis
sion
s (G
tC/y
r)2
0
2
4
6
8 pp. 14-179 1 ppbv = 1 part per billion by volume10 1 pptv = 1 part per trillion (million of million) by volume11 pp. 16-17

6
Nitrous oxide concentrations have increased since pre-industrial times from 275 ppbv to 312 ppbv.Many sources contribute to the generation of N2O emissions. The most important souces are naturalones which are probably twice as large as human induced ones. The main anthropogenic sources arerepresented by agriculture and some industrial processes, for example nitric acid production.
Halocarbons are compounds that contain fluorine, chlorine, bromine and iodine. Emission of manyhalocarbons is exclusively due to human sources. They have contributed significantly to theenhanced greenhouse effect (according to IPCC [1996a]12, radiative forcing since pre-industrialtimes is about 0.25 W/m2) but as a consequence of limitations in their emissions set by theMontreal Protocol (1987) their positive radiative forcing should decline in the future.
Changes in ozone concentration in the atmosphere may influence the greenhouse effect in twodifferent ways. Increase of ozone concentration in the troposphere since pre-industrial time hascaused positive radiative forcing contributing to the enhanced greenhouse effect. Some studiessuggest that tropospheric ozone may have doubled in the Northern hemisphere (while no evidenceabout change in ozone concentration is available for the Southern hemisphere) [IPCC, 1996a]13. Onthe contrary, stratospheric ozone layer depletion due to the indirect effect of chlorine and brominehalocarbons is associated with negative radiative forcing. The concentration of stratospheric ozonehas decreased since 1970s and as a consequence of the Montreal Protocol, it is expected that ozonewill return to its natural level before the middle of the 21st century [Brown et al., 1996].
An increase in natural and anthropogenic aerosol concentration in the lower atmosphere is an otherfactor which can influence the global and regional climate system. Aerosols are small particles anddroplets which are originated by natural and anthropic sources. An increase in the concentration ofthese particles tends to produce negative radiative forcing and to cool the atmosphere through twodifferent processes [Charlson et al. 1998]. Aerosols can directly reflect the incoming solar radiationand change cloud properties and their reflectivity, inducing an indirect cooling effect. Theseparticles can also act as nuclei on which cloud droplets condense and can therefore affect thenumber and size of droplets in the cloud. Some aerosols (for example carbon and soot produced byfossil fuels) can cause heating of the atmosphere through the direct absorption of solar radiation.Large amounts of natural aerosols are generated by volcanic activity. These aerosols can have atemporary cooling effect on the earth’s surface and the lower atmosphere. The cooling effectsgenerally do not last more than few years as it was observed after big volcanic eruptions such as thePinatubo in 1991.
Anthropogenic sulphate aerosols are the most well known and studied aerosols generated by humanactivities and are principally produced by fossil fuel combustion – which emits sulphur dioxide intothe atmosphere - as well as by minor sources such as biomass burning. They are mainly composedof sulphuric acid. It is recognised that these aerosols tend to have a cooling effect that can partiallyneutralise or mask the positive radiative forcing induced by the increase in greenhouse gases14
concentration. In general, aerosols have a shorter lifetime (days to weeks) than the majority ofgreenhouse gases (centuries). This is mainly due to the fact that they undergo rapid chemical andphysical transformation in the atmosphere and are removed by precipitation. This means that theeffect of aerosols is expected to become less consistent as time passes and that the cooling effect ofthese particles would end in a very short time if all aerosol emissions were stopped. At the contrary
12 p. 1913 pp. 19-2014 Sulphate aerosols are also major contributors to acid rain, which produces negative effects on crops, materials andecosystems.

7
the warming effect due to greenhouse gases would continue for a period of time from decades tocenturies even after the stabilisation of greenhouse gas concentrations in the atmosphere.
Aerosols are not homogeneously distributed in the lower troposphere and tend to concentrate in theproximity of natural - especially desert - and anthropogenic sources - for instance the industrialareas of the boreal hemisphere15.. The high regional variability of aerosols distribution and theincomplete understanding of aerosol indirect effect, make the estimation of their role in thegreenhouse effect complex and uncertain.
In order to quantify the contribution of the described factors to global warning, the IPCC [1996a]16
has estimated the globally averaged radiative forcing due to changes in concentrations ofgreenhouse gases and aerosols from pre-industrial times to 1992, due also to natural changes insolar output from 1850 to 1992 (figure 2).
Figure 2: Estimates of the globally and annually averaged anthropogenic radiative forcing (inW/m2) due to changes in concentrations of greenhouse gases and aerosols from pre-industrial timesto 1992 and to natural changes in solar output from 1850 to 1992. The height of the rectangular barsindicates a mid-range estimate of the forcing, whilst the error bars show an estimate of theuncertainty range. The ‘confidence level’ indicates the IPCC’s subjective confidence that the actualforcing lies within the error bars [source: IPCC 1996a]17.
HalocarbonsN O2
CH4
CO2
Stratosphericozone
Troposphericozone
Sulphate
Fossilfuelsoot Biomass
burning
Solar
Tropospheric aerosol- indirect effect
Tropospheric aerosol- direct effect
Glo
bal-
mea
n ra
diat
ive
forc
ing
(Wm
)-2
-2
-1
0
1
2
3
High Low Low Low Verylow
Verylow
Verylow
Verylow
Confidence level
The differences in the geographical distribution of greenhouse gases, aerosols and ozone can lead tosignificant variations in the distribution of their radiative forcing and in their contribution to climatechange. For this reason, the negative radiative forcing due to aerosols can only partially andregionally counterbalance the positive radiative forcing induced by greenhouse gases.
15 More than two thirds of gases containing sulphur are emitted by anthropogenic sources, mainly in the form of sulphurdioxide. 90% of them are generated by human activities located in the boreal hemisphere. Boreal human emissionsexceed natural ones by a factor of five. On the contrary, in the austral hemisphere human sulphur-gases emissions areone third of natural ones.16 p. 2117 p. 117

8
Moreover, important feedback processes are liable to modify the responses of climate to changes inradiative forcing and make the exploration of climate changes more complex. In particular, thesefeedbacks could affect the global surface temperature either in a positive or in a negative way i.e.amplifying or reducing the surface warming. Climate feedbacks mainly concern water vapour,cloudiness, ocean circulation, ice, snow albedo and land/atmosphere interactions:
r Global warming can increase the atmospheric capacity to store water in the form of vapour. Thiseffect would imply a positive feedback as water vapour is a powerful greenhouse compoundwhich would lead to a further enhancement of the greenhouse effect;
r Cloudiness is related both to a positive and to a negative feedback. Clouds are able to reflectsolar radiation – causing a cooling effect – and to absorb and re-emit long wave radiation –causing a warming of the surface. Their behaviour depends on different cloud characteristicssuch as height, thickness and radiative properties. The range of ‘climate sensitivity’ variablesdepends largely on this uncertainty;
r Oceans have a crucial role in controlling the climate. They have an enormous heat and carbonstoring capacity and transport large amounts of heat from the tropical areas to the poles throughthe great oceanic currents. Ocean thermal inertia is likely to cause a delay in global warmingand to contribute in its non-uniform distribution. That is to say that the ocean mean surfacetemperature, and consequently the mean sea level, will continue to increase for many centurieseven after the greenhouse gases stabilise. The global thermohaline circulation (also called the‘conveyor belt’) is responsible for a large portion of the heat transport from the tropics to higherlatitudes. The Gulf Stream in the Atlantic Ocean is an important component of this globalcirculation and transports warmer waters northward, thereby contributing to western Europe'srelatively mild climate for its latitude. Global warming is likely to produce a weakening of theglobal oceanic thermohaline circulation leading to a local negative temperature feedback and toa likely decrease of sea surface temperatures in the northern North Atlantic. The global oceanicthermohaline circulation is generated by the sinking of water in the Norwegian Sea and is drivenby two opposite forces, acting in the North Atlantic. Haline forcing, due to the salt gradient, isresponsible for the cold deep current which transfers water from the North Atlantic to the Indianand Pacific Ocean. On the contrary, thermal forcing, due to the temperature gradient, isresponsible for a north poleward surface current, i.e. the global flow of upper warm ocean waterfrom the tropical Pacific Ocean to the Atlantic Ocean, through the Indonesian Archipelago andthe Indian Ocean [IPCC, 1996b]18. At present, thermal forcing dominates. Increase in thestrength of haline forcing, caused by an increase of the salt gradient associated with increasedprecipitation, runoff and ice melt, could produce a weakening of the conveyor belt. This wouldproduce changes in Europe climate conditions.
r The high albedo19 which characterises ice and snow cover, can have a feedback effect in regardto future climate change. Warming will increase the melting rate of snow cover, ice caps,glaciers, large ice sheets, sea ice and the retreat of the ice and snow occupied surfaces. This willlead to a reduction of global albedo and of the reflecting capacity of the Earth. Global warmingwill consequently be enhanced.
r Variations of land surface characteristics (due for example to deforestation), such as changes insoil moisture, roughness, and vegetation cover, may lead to the alteration of the climateproperties on a local and regional scale. These changes can affect the water and energy
18 p. 27119 The capacity of a surface to reflect solar radiation

9
exchange capacity between land surface and atmosphere, leading to the modifications inprecipitation, water vapour, cloudiness and albedo.
1.2 THE PAST AS A KEY TO THE FUTURE
Projections concerning future changes in climatic variables and related parameters, for example sealevel, must take into account analysis of the present situation and the assessment of the pastobserved trends. The comparison between recent and past conditions allows us to understandwhether, and in what measure, climate change has occurred. In this regard, it is important to notethat systematic global temperature records, as well as complete data sets concerning other climaticvariables (including land-based air temperature and sea surface temperatures) are available onlysince 1860. Hypotheses about earlier climate characteristics can be derived from the combination ofhistorical documents, instrumental records and environmental indicators and by using models anddetective systems which permit the estimation of past climate conditions. Environmental indicatorsare indirect climate indicators and include the study of tree rings, coral reefs, marine and lakesediments and ice cores. The reconstruction of past climatic conditions through these naturalarchives can also be used as a check of projections from climatic models. Significant progresseshave been made in attempting to reconstruct temperatures and climate changes during past centuriesand in particular over the 10 000 years [e.g. Jones et al. 1998, White et al. 1998, Antonielli etal.1999]. Nevertheless considerable efforts and explorations are still required to have acomprehensive overview of past climatic variations.
1.2.1 Past trends of climatic variables
Large and rapid climatic changes characterised the last glacial period (20,000 - 100,000 years ago)and the transition to the current interglacial period (i.e. the Holocene, covering the last 10,000years). During the Holocene, it is likely that global mean temperature did not vary by more than1°C/100 yr [IPCC, 1996a]20. Nevertheless, its last decades seem to have been the warmest since atleast 1400, and the 20th century is likely to have been one of the warmest centuries in the lastthousand years.
Presently, the mean global surface temperature of the air is about 15 °C, with the exception of thetemperature of Antarctica. It has been estimated an increase in the global average temperature ofabout 0.3 to 0.6 °C since the late 19th century (figure 3) and in a lesser extent about 0.2 to 0.3 °Cover the last 40 years [IPCC, 1996a]21. The greatest warming occurred in the period 1910-1940 andsince the mid-1970s. The most recent years, and in particular 1997 and 1998 have turned out to bethe warmest of the whole series of measures since 1856 [Jones et al 1999]. Temperatures of 0.57°Cabove the 1961-1990 mean temperature have been recorded for 1998 and have been correlated tothe 1997-1998 El Niño /Southern Oscillation event. It has been suggested that 1998 could representa breaking point of the complete series of measures which would be a sign of acceleration of therate of the global temperature increase [Karl et al. 2000]. The global mean surface temperature in1999 was substantially lower (due to the cool El Niño phase in the tropical Pacific) than thatrecorded in 1998 but it is still one of the highest 10 on record [DETR, 1999].
Most of the studies agreed on the fact that warming has occurred both over the continents and thesea with similar trends [Parker et al. 1994]. Warming has not been geographically uniform. Forinstance, the greatest recent increase in temperature has been measured over the continents between40 °N and 70 °N, while other regions, such as the North Atlantic Ocean and in particular the portionof it located to the north of 30 °N, have been subjected to a decrease in temperature. Many indirect 20 pp. 26-3021 p. 26

10
warming indicators such as borehole temperature, retreat of snow cover and glaciers and sub-surface ocean temperature, are in agreement with the observed global warming. Short-term changesproduced by local events can affect long term temperature trends. In recent years, for example,negative temperature variations were caused by the Pinatubo eruption. In particular in 1992 adecrease of about 0.5 °C in the surface temperature was measured, followed by the reappearance ofwarmer temperatures in 1994 after the natural removal of the volcanic aerosols.
Figure 3: Combined global land and marine surface temperature record from 1956 to 1999, relativeto 1961-1990. The solid curve represents smoothing of the annual mean values shown by the bars tosuppress inter-annual variability [source: Jones et al, 1999].
As far as precipitation is concerned, a small positive global trend (1%) has been recorded over theland areas during the 20th century. The geographic distribution of these variations appears to bemore heterogeneous than that concerning temperature. In particular precipitation has increased inthe higher latitudes of the Northern Hemisphere, especially during the cold season [IPCC, 1996a]22.In general, precipitation over land areas increased on average in the period 1900-1960, while since1980 it has begun to decrease. Rainfall has also increased over the central equatorial Pacific Oceanin recent decades. On the other hand, a decrease in rainfall has occurred in tropical and subtropicalareas since 1960, in accordance with the increase of temperatures.
Evaporation has probably increased over the tropical oceans, and a major amount of water vapourhas been observed in the tropics since 1973 [IPCC, 1992]. This parameter has probably decreasedover many regions of the former Soviet Union and North America since 1951. Cloudiness seems tohave also increased over the oceans since the 50s and between the 50s and the 70s in many landareas in which the daily temperature range has diminished.
The snow cover over the Northern Hemisphere has diminished since 1988, resulting in a 10%decrease with respect to the average of the period 1974-1994. The deficit of snow has been moreevident during the spring time, but in recent years a low expansion of the snow cover has beenobserved also during summer and autumn. Similar trends over the North America and Asia havealso been suggested [Groisman et al. 1994]. Decrease in the snow cover is regarded closely linkedto the increase in temperature.
22 pp. 137-139

11
The natural variability is an intrinsic characteristic of the climatic system. The understanding of thedriven complex mechanisms of climate variability is not complete. In particular it is difficult todetect whether past changes lie outside the level of natural variability. Furthermore indicators ofclimate change bring clear evidence of regional changes in extreme events and in climatevariability. For example, the persistence of the El Niño -Southern Oscillation (ENSO) events hasconsistently increased since the mid-70s, and particularly since 1989. The importance of the ElNiño-ENSO events relies on the fact that they can have seriously negative effects in many part ofthe world, contributing in causing droughts and floods.
1.2.2 Past trends in sea level
The rise in sea level is generally considered as one of the more significant consequence of globalwarming. Studies suggested that over the past two millennia the global sea level variation did notexceed few tens of centimetres [IPCC, 1996a]23. Over the last 100 years the IPCC has estimated thatglobal mean sea level has risen by about 10-25 cm, with a best estimate of 18 cm. Numerous studies(table 2) agree on a mean sea level rise rate between 1 and 3 cm/year. However it has beenconsidered that over the last century if the average rise has been greater than that of the lastthousand years there is as yet no evidence of a consistent increase in the rate of sea level rise duringthis century [IPCC, 1996a]24.
Over the last century, variations in global sea level have typically been estimated through analysisof tide gauge measurements. Tide gauge records provide important information about long termchanges in global mean sea level. A comprehensive review of the estimated rates of sea level risefrom these measurements has been carried out by Gornitz [1994]. Most of the estimates consideringthe last 100 years range between 1 and 3 mm/yr (table 2). Recent estimates of global mean sea levelrise from tide gauge measurements range from 1.7 to 2.4 mm/yr [Douglas, 1997].
Table 2: Sea level rise values for the 20th century reported by various researchers and deduced fromthe analysis of tide gauge records.
Source Region Data used (years) SLR (mm/yr)
Gornitz and Lebedeff (1987) Global 1880-1982 1,2 ± 0,3
Trupin and Waht (1990) Global 1900-1979 1,7 ± 0,1
Douglas (1991) Global 1880-1980 1,8 ± 0,1
Peltier and Tushingham (1991) Global 1920-1970 2,4 ± 0,9
Shennan and Woodworth (1992) North Occidental Europe _ 1,0 ± 0,15
Gornitz (1995b) Eastern USA _ 1,5
Unal and Ghil (1995) _ 1807-1988 1.62± 0.38
Douglas (1997) Global _ 1,8 ± 0,1
In situ observations provided by tide gauges, constitute a very important historical reference. Alarge number of tide gauges were installed in the years following the second world war and long
23 p 33624 pp. 363-364

12
term records are available in various part of the world. Nevertheless their geographical distributionis very heterogeneous and they provide only indications of relative sea level variations in relation tothe coast. In addition vertical movements due to land subsidence, post-glacial rebounds and tectonicprocesses may affect the measures and complicate the determination of global trends [Douglas,1995]. Alternatively, recent satellite radiar altimetery provide measurements of the absolute level ofthe sea and a more homogeneous coverage of the changes in oceans level. Since August of 1992 theTopex/Poseidon satellite mission has been measuring sea level on a global basis (figure 4) in orderto provide an improved measurement of global sea level changes, especially over shorter periods[Nerem, 1995; Cazenave, et al.,1998]. Results confirm a global mean sea level rise of the sameorder as estimated by long term tides gauges records.
Figure 4: Temporal variations in global mean sea level computed from Topex/Poseidon over theperiod from December 1992 to August 1999. Each dot is a single 10-day estimate of global meansea level.
Although the complex processes affecting sea level operate on time scales varying from hours tomillion of years, factors of main concern are those regarding changes on time scales from ten to onehundred years and are described below:
r The thermal ocean expansion is a phenomenon linked to changes in water density (stericchanges) and is dependant on the temperature and the salinity of the water. Ocean expansionover the last 100 years has been estimated to have contributed about 2-7 cm to sea level rise[IPCC, 1996a]25.
r Melting of glaciers, ice caps and ice sheets are likely to increase as a consequence of globalwarming. There is a great uncertainty regarding the mass balance of the ice sheet on the globesurface and the precise contribution to sea level rise. The thinning of glaciers has been presentin many regions of the world since the middle of the 19th century. Negative mass balance hasbeen registered, for example, in the Alps [Haeberli et al. 1995] and in south central Alaska, butnot in the Canadian Arctic [Fisher et al. 1994]. Observed data and recent models estimate thatthe retreat of ice (glaciers and ice caps) has contributed to sea level rise over the last 100 yearsby about 2-5 cm. The rate of sea level rise due to glacier volume reduction has been estimated atabout 0.35 mm/yr. in the period 1890 – 1990 and 0.6 mm/yr. between 1985 and 1993 [IPCC,1996a]26. The contribution of the Greenland and Antarctic ice sheets to sea level rise remains not
25 pp 366-37026 pp. 371-373
1993 1994 1995 1996 1997 1998 1999
- 20
- 10
0
30
20
10

13
clear. The observational evidence is not sufficient to have a complete understanding of theirmass balance and their past role in sea level changes. As most of the fresh water is stored inthese two huge ice sheets, even a small loss in their volume could have extensive effects on sealevel. A warmer climate in the future will probably increase the melting rate at the margins ofthe Greenland ice sheet. This effect is unlikely to be counterbalanced by an equal increase in theaccumulation rate in its internal part. This could result in a positive contribution to the sea levelrise. The Antarctic ice sheet will on the contrary probably experience an increase in theaccumulation rate and could consequently cause a sea level fall. As Antarctic temperatures arevery low, only little surface melting occurs and the ice loss is mainly due to the breaking-off oficebergs.
r Variations in the quantity of terrestrial liquid water stored in ground and on the surface isthought to have a direct effect on sea level changes water, although it is not clear whether it hashad a significant role in past sea level rise. Human interventions - such as the building of waterretention infrastructures, excessive ground water withdrawal, deforestation, wetland loss andpermafrost thawing - and natural processes may influence the hydrological cycle in aconsiderable but not fully understood manner. Despite of the uncertainty regarding thecontribution of these factors to sea level rise and the lack of result homogeneity, many studiessuggest that the hydrologic contribution to sea level rise over the past century could have beensignificant [Gornitz et al. 1997, IPCC 1996a27]. The IPCC28. [1996a] has estimated that thecurrent contribution may range between –0.4mm/yr and +0.75 mm/yr with a mean estimate of0.1mm/yr and that over the last 100 years the contribution could be about 0.5 cm, with a highuncertainty.
r Coastal processes such as subsidence, accretion and erosion as well as tectonic phenomenon aresite specific and may produce important localised effects reinforcing or reversing sea level risetrend. On the global scale their contribution to sea level rise is considered to be insignificant.
1.3 PROJECTIONS OF CLIMATE CHANGE
The exploration of future changes in climatic and related variables are characterised by a highdegree of uncertainty. Giving this consideration, the term of projection is more appropriate thanprediction when considering climate change as well as the use of the concept of climate changescenario which “is intended to be an internally consistent picture of possible future climaticconditions” [Wigley 1992].
1.3.1 IPCC scenarios for the future
Future greenhouse gas emissions are the result of complex and dynamic processes driven bydemographic trends and socio-economic development and technological changes. The evolution ofthese factors is uncertain, and different assumptions regarding future economic, political anddemographic trends, provide different projections and scenarios.
In order to assess variations in the atmospheric composition and to generate projections of climatechange for the horizon 2100, the IPCC [1992] has developed six emission scenarios (IS92 a, b, c, d,e and f) (figures 4a and 4b). They provide different projections for the emissions of the maingreenhouse gases, the precursors of tropospheric ozone and the sulphate aerosols, as well as for theaerosols generated by biomass burning. These scenarios, and particularly the IS92a known as 27 p 37928 p. 380

14
“central” scenario 29 have been widely used as a common reference for the analysis of possibleclimate change impacts and mitigation [IPCC, 2000]. On the basis of the IS92 emission scenarios,IPCC elaborated a set of projections of greenhouse gas concentrations. All these projectionsconsider an increase in the concentrations of greenhouse gases in the period 1990 – 2100 (figures 4aand b) which magnitude varies according to the considered scenario. For example, the percentageincrease in CO2 ranges between 35 and 170%, the increase in CH4 between 22 and 175% and theincrease in N2O between 26 and 40%. Projections of climate change are realised by means ofclimate models which allow the mathematical simulation of the interactions between land, oceanand atmosphere. These models are able to reproduce climate variations which have been observedin the past and to generate projections of the future trends and values. Given the uncertainty offuture trends, the IPCC advised to consider the full range changes included in IS92 scenarios ratherthat a unique “central” scenario for the assessment of climate change implications [IPCC, 2000].
Figure 5. a) Total anthropogenic CO2 emissions under the IS92 emission scenarios developed bythe IPCC and b) the resulting atmospheric CO2 concentrations [source: IPCC 1996a]30.
IS92e
IS92e
IS92f
IS92f
IS92a
IS92a
IS92b
IS92b
IS92d
IS92d
IS92c
IS92c
2000 20002020 20202040 20402060 20602080 20802100 2100
Ant
hrop
ogen
ic C
O e
mis
sion
(G
tC/y
r)2
CO
con
cent
ratio
n (p
pmv)
2
0
10
20
30
40
Year Year
(b)(a)
300
350
400
450
500
550
600
650
700
750
800
In 1995 the scenarios have been evaluated and published in the Second Assessment Report (SAR)and in 1996 the IPCC decided to develop a new set of emission scenarios with the aim to accountfor a wider range of likely future trends (figure 6). The Special Report on Emissions Scenarios(SRES) 31 provides emission profiles as inputs to GCMs and models of regional climate change aswell as other information (such as population growth or rates of technological change) required forthe assessment of impacts related to climate change. SRES scenarios are based on different naturaland socio-economic assumptions grouped into the following four distinct “storyline" families,which are qualitative descriptions of main scenario characteristics and relationships among drivingforces (SRES98):
r A1: Rapid economic growth, technological progress, globalisation, and convergence;
29 IS92a is also known as "nonintervention" scenario, assuming that no new policies are adopted to reduce emissions inresponse to the threat of climate change.30 pp. 285-40631 More information on SRES98 can be found in http://sres.ciesin.org

15
r A2: Regionally oriented economic development resulting in less convergence and morefragmented and slower technological progress and growth than in A1;
r B1: Global co-operative solutions to economic, social, and environmental sustainability,including improved equity;
r B2: Local and regional solutions to economic, social, and environmental sustainability, resultingin more fragmented and slower technological progress and growth than in B1.
Six ‘marker scenarios’ have been developed, covering all scenarios and representing thequantification of the storylines. These ‘marker scenarios’ provide the base for the generation ofclimate change scenarios. The Data Distribution Centre (DDC)32 of the IPCC made available thefirst set of temperature rise and sea level rise projections based on these scenarios and elaborated bymeans of models used in the Second Assessment Report (SAR) of the IPCC [Wigley 1995; Wigleyand Raper 1987; 1992]. The preliminary results, reported on the figures 7, 9 and 11, display generaltrends of future CO2 concentration, temperature and sea level rise. For instance, the range of CO2concentration appears to be lower than in the IS92 projections. In addition, a higher increase inglobal mean temperature (due to the lower estimation of levels of sulphur dioxide emissions than inthe previous IS92 projections) and a higher amplitude of global sea level rise are projected with therange of SRES 98 emissions scenarios. Nevertheless, these results should be take with precautionsince more precise scenarios will be formally used in the IPCC Third Assessment Report (TAR)which is expected to be completed by mid-2001.
1.3.2 Temperature projections
The IPCC elaborated the mean global temperature projections for the period 1990-2100 (figure 8)based on IS92 emission scenarios, considering three different values for climate sensitivity: a lowervalue of 1.5 °C, a ‘best estimate’ of 2.5 °C and a higher value of 4.5 °C. Taking into considerationall the IS92 emission scenarios and all the different values of sensitivity, the models project anincrease in global mean temperature by the year 2100 in the range of 0.9 and 3.5 °C [IPCC,1996a]33. The mid-range emission scenario (IS92a) projects a non-linear increase in anthropogenicCO2 emission from about 7.5 GtC/yr in 1990 to about 20 GtC/yr in 2100. The best estimate ofclimate sensitivity and the IS92a scenario produces a temperature increase projection of 2 °C by2100. All the presented temperature projections consider the effects due to the increase in both thegreenhouse gases and the anthropogenic aerosols concentration.
Otherwise, assuming a constant aerosol concentration at 1990 levels and an increasingconcentration of greenhouse gases, the increase of the global mean temperature growth by 2100ranges between 0.8 and 4.5 °C. In this case, the IS92a and the best estimate of climate sensitivitygenerates a temperature increase projection of 2.4 °C by 2100 [IPCC,1996a]34. The full set of IS92scenarios and a climate sensitivity value of 2.5 °C produce temperature projections for the year2100 ranging between 1.3 and 2.5 °C in the case of changing aerosol concentrations beyond 1990and between 1.2 and 3.2 °C assuming constant aerosol concentrations beyond 1990. In all casesthese scenarios would be consistent with a significant temperature increase. The maximum increasein temperature is likely to affect high northern latitudes during late autumn and winter (causing areduction of sea ice and snow cover), while the minimum temperature increase will occur aroundAntarctica and in the northern North Atlantic. A smaller warming will also affect the Arctic insummer. Southern circumpolar ocean and low latitudes will probably be affected by a limitedseasonal warming variation. Finally a contraction in the range of diurnal temperature on the land inmost seasons and regions of the globe is likely to occur. 32 http://ipcc-ddc.cru.uea.ac.uk33 p 4034 p. 40

16
Figure 6: Total global annual CO2 emissions from all sources (energy, industry, and land-usechange) from 1990 to 2100 (in gigatonnes of carbon (GtC/yr) for the four families and six scenariogroups. The 40 SRES scenarios are presented by the four families (A1, A2, B1, and B2) and sixscenario groups: the fossil-intensive A1FI (comprising the high-coal and high-oil-and-gasscenarios), the predominantly non-fossil fuel A1T, the balanced A1B in Figure SPM-3a; A2 inFigure SPM-3b; B1 in Figure SPM-3c, and B2 in Figure SPM-3d. Each coloured emission bandshows the range of harmonised and non-harmonised scenarios within each group. For each of thesix scenario groups an illustrative scenario is provided, including the four illustrative markerscenarios (A1, A2, B1, B2, solid lines) and two illustrative scenarios for A1FI and A1T (dashedlines) [source, IPCC, 2000].
1.3.3 Projections of other variables
All models project an increase in global mean precipitation. Such increase will cause anenhancement of the global hydrological cycle. At the regional scale, projections of future changes inprecipitation vary from zone to zone and from model to model. An increase in precipitation isexpected in high latitudes, except around the Norwegian Sea, during winter. Global warming islikely to increase the quantity of atmospheric water vapour and to enhance the pole-ward vapourtransport to northern high latitudes leading to an increase in precipitation [Manabe et al., 1975].Most of models project that the increase in precipitation will extend into mid-lattitudes. Pattern ofchange for other areas vary according to the model which is considered. Many models whichexclude the aerosol effect, project general decrease in rainfall over southern Europe and an increaseover India and south-east Asia. On the contrary, if the effect of aerosol forcing is taken intoconsideration, precipitation is projected to increase over southern Europe and to decrease over theAsian monsoon region. This latter effect is due to aerosol cooling, which is likely to reduce thetemperature contrast between land and sea and consequently the strength of monsoon occurrence. Ingeneral, rainfall variations in the dry subtropics are expected to be small [IPCC, 1996a]35.
35 pp. 307-309
A1F1
A1B
A1T

17
Figure 7: Carbon Dioxide concentration in ppmv based on SRES carbon dioxide emissionsscenarios.
1.3.2 Temperature projections
IPCC SRES98A1 emissions scenarios harmonisedIPCC SRES 98 A2 emission scenarios harmonised
IPCC SRES 98 B1 emission scenarios harmonisedIPCC SRES 98 B2 emission scenarios harmonised

18
Figure 8. Projected global mean surface temperature change extremes from 1990 to 2100. Thehighest temperature changes assume a climate sensitivity of 4.5 °C and the IS92e emission scenario;the lowest a climate sensitivity of 1.5 °C and the IS92c emission scenario; the mid-range curve aclimate sensitivity of 2.5 °C and the IS92a scenario. The solid curves include the effect of change inaerosol concentrations, while the dashed curves assume that aerosol concentrations remain constantat their 1990 levels [source: IPCC 1996a]36.
Some general results concerning the effects of climate change on the global ocean circulationemerge from the analysis of various model simulations IPCC [1996a]37. During winter, surfacewarming is expected to be more consistent on land than on oceans. Numerical simulations of globalocean circulation have also calculated that small changes in the forces presently controlling thethermohaline circulation at high latitudes could lead to a significant weakening of the ‘conveyorbelt’ which normally transports heat poleward. The projected precipitation increase over higherlatitudes can, in fact, diminish surface water salinity and density, leading to a reduction in thesinking of seawater and to a consequent inhibition of the global ocean circulation. In particular,models have predicted that the strength of the ocean circulation in the northern North Atlantic willprobably decrease, leading to a reduction of the warming capacity of the ocean around the NorthernAtlantic.
1.3.4 Sea level projections
On the basis of the described climate projections and emission scenarios, the IPCC [1996a]38 hasestimated the magnitude of future change in sea level for the period 1990-2100 in response to globalwarming. If all the IS92 scenarios - which include an increase both in the greenhouse gases andaerosol precursors concentration - the range in the estimates of climate sensitivity (1.5-4.5 °C) andthe range of values of ice melt parameters (low, mid and high ice parameters) are taken intoconsideration, the models project a global mean sea level rise in the period 1990-2100 varyingbetween 13 and 94 cm (Figure 10).
36 p. 4037 pp. 39-4638 pp. 359-405
Glo
bal t
empe
ratu
re c
hang
e (°
C)
2000 2020 2040 2060 2080 21000
1
2
3
4
5
IS92c/1.5
IS92a/2.5
IS92e/4.5
Including changes in aerosol beyond 1990
Constant 1990 aerosol

19
Figure 9: Implications of the SRES emission scenarios - Temperature Change (°C) w.r.t 1961-90
1.3.3 Other variables projections
Considering the complete set of emission scenarios, the ‘best estimate’ value of the climatesensitivity (2.5 °C) and the mid-values of the ice melt parameters, this range is reduced to 38-55 cm(in the case of aerosol concentrations constant at 1990 level this range is 38-66 cm). For the IS92ascenario, which is the mid-range emission scenario, the IPCC provides high, middle and lowprojections of the sea level rise in regard to the uncertainties of the model, linked to climatesensitivity and ice melt parameters. In this case sea level rise is expected to vary between 20 and 86cm by the year 2100 (in the case of aerosol concentrations constant at 1990 level this range is 23-96cm) and 7 and 39 cm for the year 2050. The ‘best estimate’ for the IS92a scenario is generated if the‘best estimate’ value of climate sensitivity and the mid-values of ice melt parameters are taken inaccount. This best estimate is about 49 cm by the year 2100 (this best estimate is 55 cm if aerosol
IPCC SRES98A1 emissions scenarios harmonised IPCC SRES98A2 emissions scenarios harmonised
IPCC SRES98B1 emissions scenarios harmonised IPCC SRES98A1 emissions scenarios harmonised

20
amounts constant at 1990 levels are taken into consideration) and about 20 cm by the year 2050[IPCC,1996a]39.
Thermal expansion is expected to be the most important cause of sea level rise. It will beresponsible for long term changes as it is capable to affect sea level even beyond the stabilisation ofgreenhouse gas concentrations. In the models simulation, the great thermal inertia of the ocean-ice-atmosphere system affects the projected sea level rise in such a way that the various adoptedscenarios (IS92a-f) produce very little differences in sea level increase for the first half of the nextcentury. Different scenarios generate greater difference in the projected sea level rise in the secondpart of the considered period (1990-2100). Great uncertainty in sea level rise projection is linked tothe role of the polar ice sheets, in particular to their mass balance and to their future response to theglobal warming. For example, it is likely that warmer polar ocean temperature would cause themelting of part of the Ross and other Antarctic shelves but at the same time warmer polar airtemperatures could lead to an increase in annual snowfall [Titus et al., 1995].
Changes in future sea level will not be uniform around the world. The response of regional seascould be substantially different and will depend on local factors. Local climate characteristics, suchas some variations in temperature, precipitation, wind and pressure patterns as well as changes inoceanic circulation and water density, will be significant in sea level variations. Other importantfactors which could influence regional sea level rise are vertical land movements induced both bynatural and anthropogenic causes, such as tectonic movements, natural and human inducedsubsidence, natural uplift, erosion or sediment depletion.
Figure 10: Projected global mean sea level rise extremes from 1990 to 2100. The highest sea levelrise curves assume a climate sensitivity of 4.5 °C, high ice melt parameters and the IS92e emissionscenario; the lowest a climate sensitivity of 1.5 °C, low ice melt parameters and the IS92c emissionscenario; the middle curves a climate sensitivity of 2.5 °C, mid-value ice melt parameters and theIS92a emission scenario. The solid curves include the effects of change in aerosol concentrations,while the dashed curves assume that aerosol concentrations remain constant at their 1990 levels[source: IPCC 1996a]40.
Including changes in aerosol beyond 1990
Constant 1990 aerosol
110
94
5549
13
IS92e
IS92a
IS92c
Sea
leve
l cha
nge
(cm
)
02000 2020 2040 2060 2080 2100
20
40
60
80
100
120
Year
39 p. 4040 p. 385

21
Figure 11: implications of the preliminary SRES emission scenarios - Sea Level Change (cm) w.r.t1961-90
IPCC SRES98A1 emissions scenarios harmonised IPCC SRES98A2 emissions scenarios harmonised
IPCC SRES98 B1 emissions scenarios harmonised IPCC SRES98 B2 emissions scenarios harmonised

22
II THE MEDITERRANEAN BASIN
2.1 DESCRIPTION
2.1.1 Morphology and hydrology
The Mediterranean Sea is a semi-enclosed sea covering an area of approximately 2.5 million km2,(3800 km wide east-west, and a maximum north-south distance of 900 km). It represents 0.69% ofthe world ocean surface and 0.27% of the global ocean volume. The Mediterranean Sea isconnected to the Atlantic ocean by the Strait of Gibraltar, to the Black sea by the strait of Çanakkale(Dardanelles) and to the Red Sea through the Suez Canal. The mean depth is about 1.5 km and halfof the total water volume is characterised by a depth ranging between 2 and 3 km. TheMediterranean is also constituted by zones with limited depth (below 200 m), which occupy 20% ofthe total surface and 1.5% of the total volume [Grenon and Batisse, 1989]. The length of theMediterranean coastline is about 46,000 km, of which 18,000 km belong to islands. TheMediterranean basin (figure 12) is characterised by a complex fragmented relief, submitted tostrong seismic and volcanic activity. About 54% of the coastline is rocky and 46% is sedimentary.Sedimentary coastlines are subject to the strongest human pressure and are generally morevulnerable to climate change. There are 162 islands exceeding 10 km2 and another 4,000 smallerislands, which are mainly concentrated in the eastern Mediterranean.
Only a few important rivers flow in the Mediterranean sea (table 4). The four principal ones arerespectively: the Nile, the Rhone, the Po and the Ebro. The estimated associated riverine input isabout 15,000 m3/s [UNEP/EEA, 1999b]. 92% of this water input comes from the northern part ofthe basin shores. Dams and large scale irrigation schemes have decreased the total discharge ofsome rivers, causing sediment deficit and significant negative consequences. For example, in thedelta of the Ebro, erosion has increased as a result of the strong reduction in sediment discharge.Likewise, since the closure of the High Aswan Dam in 1964, discharges of sediments at the mouthsof the Nile have been reduced nearly to zero and consequently the shorelines have been affected byan evident erosion [Frihy et al., 1996].
The Mediterranean basin is considered as a “concentration basin” that is to say that evaporationexceeds precipitation. This negative hydrological balance is mainly due to the high rate ofevaporation, the poor rainfall during the dry season and the low runoff of the relatively short rivers[Milliman et al., 1992]. As a consequence, the balance is achieved through the marine water ofAtlantic Ocean, entering into the Mediterranean basin and the water contribution of the Black sea.The net incoming flow from the Atlantic Ocean is estimated of being about 41,000 m3/s and theflow from the Black Sea at about 6,000 m3/s [UNEP, 1989a].
High evaporation and limited input of fresh water and rivers represent the main causes of therelatively high Mediterranean salinity (ranging from 36 to 39 g/l). Mediterranean waters arecharacterised by warmer temperatures with respect to the Atlantic Ocean and by a complex andvariable superficial current system, which transports Atlantic water from the Straits of Gibraltartoward the east, forming numerous whirlpools. Mediterranean sea level is lower than the Atlanticoceanic level, and diminishes progressively from Gibraltar to the Northern Aegean Sea, withmaximum differences of about 80 cm [UNEP, 1989a]. Furthermore, the Mediterranean ischaracterised by a weak tide system, with a very highly oscillation width.
23
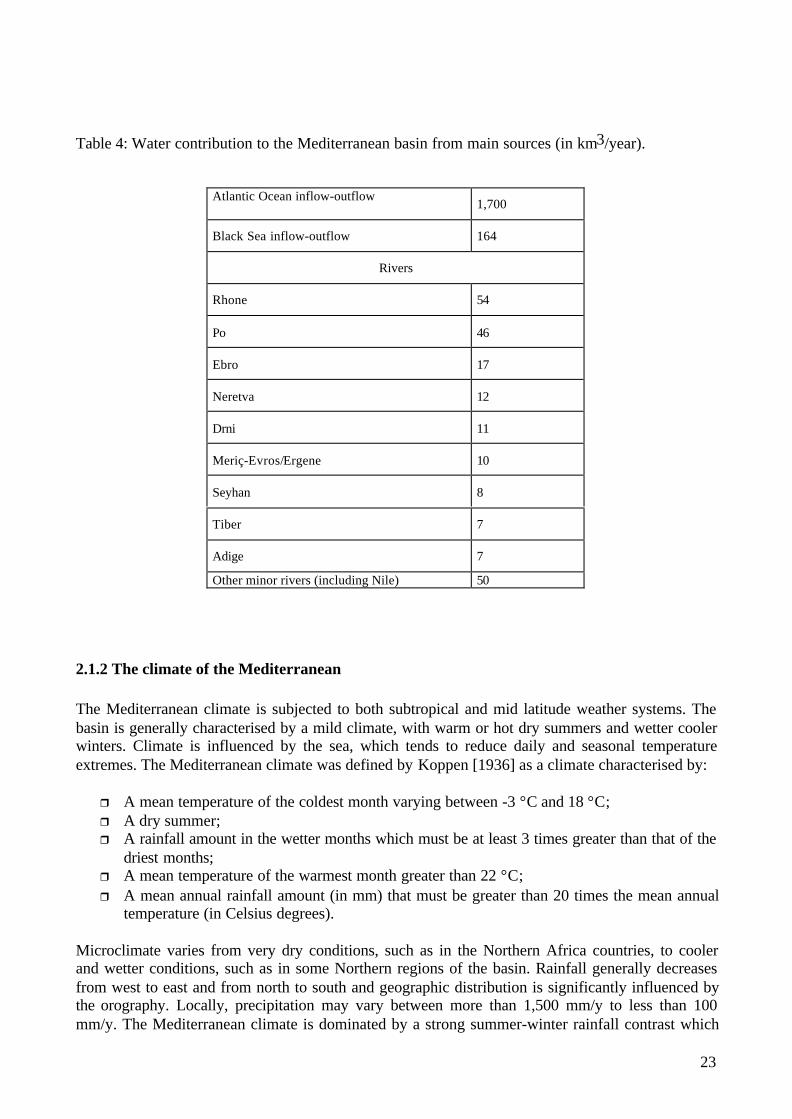
Table 4: Water contribution to the Mediterranean basin from main sources (in km3/year).
Atlantic Ocean inflow-outflow1,700
Black Sea inflow-outflow 164
Rivers
Rhone 54
Po 46
Ebro 17
Neretva 12
Drni 11
Meriç-Evros/Ergene 10
Seyhan 8
Tiber 7
Adige 7
Other minor rivers (including Nile) 50
2.1.2 The climate of the Mediterranean
The Mediterranean climate is subjected to both subtropical and mid latitude weather systems. Thebasin is generally characterised by a mild climate, with warm or hot dry summers and wetter coolerwinters. Climate is influenced by the sea, which tends to reduce daily and seasonal temperatureextremes. The Mediterranean climate was defined by Koppen [1936] as a climate characterised by:
r A mean temperature of the coldest month varying between -3 °C and 18 °C;r A dry summer;r A rainfall amount in the wetter months which must be at least 3 times greater than that of the
driest months;r A mean temperature of the warmest month greater than 22 °C;r A mean annual rainfall amount (in mm) that must be greater than 20 times the mean annual
temperature (in Celsius degrees).
Microclimate varies from very dry conditions, such as in the Northern Africa countries, to coolerand wetter conditions, such as in some Northern regions of the basin. Rainfall generally decreasesfrom west to east and from north to south and geographic distribution is significantly influenced bythe orography. Locally, precipitation may vary between more than 1,500 mm/y to less than 100mm/y. The Mediterranean climate is dominated by a strong summer-winter rainfall contrast which

24
is also associated with a well-pronounced seasonal cycle in almost all the climate variables. Therainy season generally starts no earlier than September/October and continues until the end of April.The highest rainfall generally occurs in December and the lowest in July. The western region of theMediterranean is characterised by a more prolonged rainfall season and a less pronounced seasonalcycle. In many regions of the basin, summer rainfall is often zero and in this season water shortagecan be a very acute problem [Milliman et al., 1992]. This is particularly true for the southern part ofthe Mediterranean, where the dry season can even last more than six months.
Potential evapotranspiration shows a north-south gradient [Palutikof et al., 1994]. The greatestspatial variation occurs in summer, when potential evapotranspiration ranges between less than 5mm/day in the north to more than 8 mm/day in the south. During the other seasons spatialvariability is more limited, being slighter in winter (1-3 mm/day). The main Mediterranean windscome from north and west directions. The combination of dry winds and sunny days has aconsiderable positive effect on surface water evaporation. Extra-tropical storms occur duringautumn, winter or spring and can contribute to causing significant waves and surges.
Figure 12: The Mediterranean Basin
2.1.3 Natural features
Many important natural ecosystems are present in the Mediterranean region. The peculiar climateand the relief and soil characteristics make the Mediterranean basin one of the most original bio-geographic regions in the world. The Mediterranean is characterised by distinct features, such asparticular ecosystems composition and plants and animal associations.
The Mediterranean vegetation is constituted by a high variety of plants and includes about 25,000different species, half of which are endemic. Many plant associations can be considered as relicts,since they represent what remains of periods of more favourable ecological or climatic conditions.

25
Endemic and relict plant species are the most vulnerable to degradation, since once they have beeneliminated, their regeneration can be very difficult. The present climatic and ecological conditions,which are different from the original ones, do not represent the optimal and limit the plants’regeneration [Grenon and Batisse, 1989]. Mediterranean vegetation is mostly constituted by plantswhich have adapted to heat and dryness, developing drought-resistant characteristics. Thedominating associations are represented by the “maquis” and “garrigue”, which are often the resultof degradation processes from the “climax” stage41. The most organised level of the Mediterraneanplant community is constituted by evergreen forest, in which the prevailing species are holm-oak(Quercus ilex) and cork-oak (Quercus suber). Proceeding towards lower latitudes, oaks are replacedby trees more resistant to drought conditions, such as thuja. The degradation processes - mainlyinduced by human factors such as overgrazing, fire, unsustainable management and deforestation –have led to the involution of the evergreen forest into “maquis” and into “garrigue” in many areasof the basin. If the process continues, the “garrigue” can be transformed into steppe and finally intobare soil. The more the degrading process is advanced, the less the soil protection is ensured by thevegetation and the more the process becomes irreversible. Due to the limited capacity of thereduced plant cover to protect the soil Mediterranean soils are widely threatened by erosionprocesses and by physical and chemical degradation. As far as animal communities are concerned,it is important to stress that many of them are already in a critical situation and some species are atrisk of extinction. This is for example the case for some anatidae and some mammals, such as bear,lynxes, some antelopes and monk seal as well as large birds of prey.
The Mediterranean sea is characterised by a low biomass and a high diversity. It contains 7% of theknown world marine fauna, 18% of the world marine flora. Many species are endemic. There havebeen recorded a total between 10 000 and 12 000 marine species for the Mediterranean[UNEP/EEA 1999b]. Species are distributed heterogeneously in the sea, and the western part of theMediterranean sea is richer than the eastern part. The higher biodiversity is concentrated betweenthe surface and the 50 metre depth [Fredj et al. 1992], i.e. the zone strongly influenced by the land-sea interactions.
2.1.4 The human factor
The Mediterranean region is a unique frontier dividing two adjacent zones with marked differencesin demographic features and levels of development. The considered Mediterranean zone include 22countries and territories than are generally divided in three geographical sub-regions [Margat J.Vallee D. 1999]:
§ The North: Spain, France and Monaco, Italy, Malta, Bosnia Herzegovina, Croatia,Slovenia, FR of Yugoslavia, Albania, Greece;
§ The Est: Turkey, Cyprus, Syria, Lebanon, Israel, Gaza strip;§ The South: Egypt, Libya, Tunisia, Algeria, Morocco.
The overall basin is characterised by a large population which tends to concentrate in coastal areasand which is growing rapidly especially in Turkey, Syria and Northern African countries (figure13). The total resident population of the 22 Mediterranean states is estimated to be currently of 450million and is expected to reach the threshold of 600 million in 2050. The coastal population isestimated one third of the total population (i.e. 150 million) and could reach 220 million by the year2025 [Grenon and Batisse, 1989]. This increase will be less consistent in northern countries than insouthern ones (where the total population is expected to double by 2025) [e.g Ben Jannet-Allal,
41 Without human intervention, a vegetal association tends to reach an equilibrium and to conserve a constant speciescomposition. That is the climax. The climax represents a reference point to study the other evolution stages.

26
1999] (figure 14). In 2025 Northern population is expected to represent only one third of the totalpopulation of the basin [UNEP/EEA 1999b].
The most artificial and urbanised coastlines are located in the Northern countries. Mediterranean-European countries have 1500 km of artificial coastlines of which 83% is represented by harbourand port areas [UNEP/EEA, 1999a]. The “Blue Plan” estimated in 1985 that 90% of the urbanisedland are on the coastal zone of Spain, France, Greece, Italy and the former states of Yugoslavia[Blue Plan, 1988b]. The urbanisation is expected to increase, and this particularly in southern andeastern parts of the Mediterranean basin [Baric and Gasparovic 1990]. At the horizon 2025, for thewhole Mediterranean countries, urban population could represent 275 millions people [Plan Bleu,2000].
The Mediterranean is the preferred destination of one third of the world’s tourists. Tourism is atypical seasonal economic activity with a peak period in May-September. Annually about 120million tourists visit the Mediterranean coasts for recreational purposes, lands utilised by touristfacilities amount to more than 2 million m2 and tourist water consumption to about 569 million m3
[UNEP, 1989a]. Spain, France, Italy and Greece are the major destinations and accommodate about80 % of the annual tourist flow [Blue Plan, 1998b]. Tourist pressure on the coasts is expected toincrease with the number of tourists which according to some estimates could reach 220-350million by 2025 [Vallega, 1997; Grenon and Batisse, 1989, UNEP/EEA 1999b].
In addition, Mediterranean coasts represent the physical place where many economic activities,such as industry, agriculture, fisheries, aquaculture, port and maritime transport are located. Coastalzones do not provide a large amount of suitable agricultural land but host agriculture of high qualityparticularly in deltaic areas. Most of the European countries are characterised by extensive marketoriented agriculture with typical Mediterranean crops (such as olive and cereals) and good yields[UNEP/EEA, 1999b] whereas more traditional types of agriculture are represented in the southernand eastern regions of the basin [Bindi and Olesen 1999]. Long-term misuse and overexploitationoften threaten agricultural yield. Further constraints are represented by poor soils, dry conditions,land degradation and soil erosion. In the southern regions, where some of these conditions are moreacute, heavy irrigation is required. Irrigation is an important factor of pressure on surface andgroundwater reserves and is estimated to account for 72% of water consumption in theMediterranean [Blue Plan, 1988a]. The evolution of agricultural land use is marked by a strongnorth-south contrast. A decrease of agricultural land and an increase of irrigated agricultural landscharacterise the north and west part on the basin while the south and east are marked by an increaseof agricultural surfaces [UNEP/EEA, 1999a]. In these regions, driven by a strong demographicpressure, agriculture has expanded into marginal and natural areas, reclaiming land which waspreviously occupied by fragile ecosystems, such as arid steppes and rangelands.
Mediterranean coastal zones are currently experiencing increased pressures due to rapidurbanisation, development of tourist facilities and industries, and overexploitation of marineresources. The most frequent problems resulting from these pressures include coastal erosion,depletion of aquifers, water shortage, salinisation of freshwater systems, desertification,deforestation, loss of wetland and natural habitat, pollution, human-induced subsidence and forestfire.

27
Figure 13: Increase of the population in the different Mediterranean countries [Source :UNEP/EEA, 1999].
Figure 14: The demography evolution in the Mediterranean countries [Source : Allal, 1999]
SEMCs: Southern and eastern Countries
0
10000
20000
30000
40000
50000
60000
70000
80000
90000
100000
Spa
in
Fra
nce
Ital
y
Mal
ta
Slo
veni
a
Cro
atia
Bos
nia
Her
zego
vini
a
FR
of
You
gosl
avia
Alb
ania
Gre
ece
Tur
key
Cyp
rus
Syr
ia
Leb
anon
Isra
el
Gaz
a S
trip
Egy
pt
Lyb
ia
Tun
isia
Alg
eria
Mar
occo
Tho
usan
ds
1960 1990 2030
100
150
200
250
300
350
400
1970 1980 1990 2000 2010 2020 2030
mil
lion
s in
habi
tant
s
SEMCs
North

28
2.2 CLIMATE CHANGE IN THE M EDITERRANEAN BASIN
2.2.1 Past trends of climatic variables and related parameters
The high natural variability of the Mediterranean climate makes difficult the detection of changes inclimatic variables and the attribution of their cause. Different studies have attempted to analysetrends of long data series of climatic parameters in the Mediterranean basin, with the aim ofassessing whether climate modification is already occurring and whether this modification can beascribed to human-activities. All parts of Europe seem to have experienced a temperature increaseduring the last century with some exceptions such as in the case of the eastern Mediterranean wheretemperature has decreased in the period 1981-1990 [ECSN, 1995]. On the other hand precipitationseem to have decreased in southern Europe. Signals of climate change in terms of surface warmingand increase in extreme rainfall events have been recently detected all over the Mediterranean basin[Maracchi et al., 1998]. Piervitali et al. [1997] have identified the following variations in thecentral-western Mediterranean:
r An increase in air pressure at the surface and at the upper levels since 1940 after a period duringwhich this parameter did not change.
r A reduction in cloudiness (by about 1%) and in precipitation (by about 20%) levels during theperiod 1950-1990. This latter trend agrees with measurements reported by the IPCC [199842]that indicates a reduction in rainfall by as much as 20% over the same area. More recent works[Piervitali et al., 1998; Piervitali et al., 1999] have highlighted that the stronger reduction hasoccurred in the southern belt43 of the analysed area (-26%), and that this reduction has been lessconsistent in the central (-20%) and in the northern (-13%) belts.
r An increase by about 1 °C in surface air temperature during the period 1860-1995 (0.8 °C/ 100years). This temperature increase is greater than that found at a global scale. Various authors[Jones et al., 1986; Hansen et al., 1987; Vinnikov, 1990] agree on a 0.5 °C/100 years increase ofglobal temperature over the last century. IPCC [1996a]44 has concluded that global surfacetemperature has increased by about 0.3 to 0.6 °C since the end of the 19th century, and by about0.2 to 0.3 °C over the last 40 years. The IPCC [1996a]45 has similarly reported that in thecentral-western Mediterranean the average temperature in the period 1975-1995 was greaterthan that measured in the period 1955-1975. On the contrary, the comparison of the two averagetemperatures in the eastern Mediterranean shows a decrease in this parameter.
r Alpine glaciers have retired in altitude by as much as 100-130 meters in the last century[Comitato Nazionale per la lotta contro la desertificazione, 1998]. This trend seems to confirmthat climate change has occurred. If Alpine glaciers retirement is attributed to global warming, itis possible to estimate that the temperature has increased by 0.5-0.7 °C in the last century.
r A reduction of strong wind events46 in the period 1951-1990.
42 pp. 156-15843 In the studies, the southern belt corresponds to a latitude < 38° N, the central to a latitude included between 38° and42° N and the northern to a latitude > 42° N.44 pp. 141-15145 pp. 137-19246 In the analysis carried out by Piervitali et al. [1997] strong winds are defined as those winds with an intensity greaterthan 25 knots and a duration greater than 6 hours. In the study, three Mediterranean winds were investigated: the Mistralthe Bora, and the Scirocco.

29
r A reduction of strong cyclogenetic events in the period 1965-1992 and an increase of heatwaves in the period 1950-1992. Geeson and Thornes [1996] have also measured an increase inthe frequency of heat waves affecting the whole Mediterranean region in the period 1952-1992.Occurrence of other extreme events in the early 90s, such as unusual coldness over the easternMediterranean region and extreme drought over much of the Mediterranean, have been linked tothe NAO (North Atlantic Oscillation) and partly to the ENSO (El-Niño Southern Oscillation)phenomena [Greenpeace; Hurrell, 1995; Trenberth and Shea, 1997].
Recent trends of sea water temperature and salinity increase have also been reported. In the westernMediterranean basin a significant increase in average deep water temperature and salinity has beenobserved in the past 30-40 years [Béthoux et al. 1990, Béthoux et al. 1998]. In particular at a depthof 1000 to 2700 metres the water temperature and salinity have increased by 0.13°C and 0.04 psu47
respectively (figure 15). Temperature increases twice as high have been recorded as well for themiddle water of the Ligurian sea of Nice [Béthoux and Gentili, 1996]. The same temperature andsalinity trends have been observed for the Levantine water in the Sicilian channel [Sparnocchia etal. 1994]. The causes of such changes, in particular global warming and the reduction of fresh waterdischarge from Mediterranean rivers are still debated.
Increase in sea surface temperature may equally have occurred but general trends have not beenhighlighted. Sea surface temperature records show variations in the last 120 years, but it is difficultto separate seasonal and inter-annual variability from the overall trend of this parameter [Metaxas etal., 1991]. Measures reported by Metaxas et al. [1991] for the period 1873-1989 show a minimumaround 1910 and a rapid increase until 1940. After this year, the sea surface temperature stabiliseduntil 1960 and decreased until the late 70s (at a global level a continuous increase corresponded tothis decrease). A new increase was registered until 1989, when a new maximum (lower than the1940 one) was reached.
The study of biological indicators can bring useful information for analysing past sea watertemperature trends. In particular the analysis of the composition and the distribution of sensitivemarine species to temperature changes can give evidence of sea water temperature variations [Sara,1985]. For instance, recent observations of variations in species richness patterns in theMediterranean have been attributed to an increase in sea water temperature [Astraldi et al, 1995].Likewise, Francour et al. [1994] have observed an increase in the relative abundance of somethermophilic marine flora and fauna species in the north-western Mediterranean waters and havesuggested that these changes may be correlated to an increase in sea surface temperature.
Estimates of sea level fluctuations over the past few thousand years are not precise enough to allowthe determination of global trends. However, precise specific studies do exist. Holocene (the periodcovering the last 10 000 years) fluctuations in sea level have been explored through the dating offossil and coral reefs, and have been successfully interpreted using these paleoclimatic indicatorsfor particular areas [Antonelly et al.1999]. Examples of comprehensive studies are those carried outby Bard et al.[1996] using Tahiti coral reefs, and Sartoretto et al. using submarine coralline alga ofthe north-western Mediterranean. Mediterranean “substitute reef” indicators have also been recentlyused (such as Mediterranean gastropods) combined with archaeological data. During the Holocene(figure 16), the most important increase seems to be on the first half part, followed by a significantdecrease of sea level rise rate in the late Holocene of about 12-15 cm.
47 Unity of salinity

30
Figure 15: Temperature and salinity trends observed in the deep water of the Algero-Provençalbasin over the 1959-1997 period. The trends concern the entire deep water from a depth of about800 m depth [source: Béthoux and Gentili, 1996].
Piervitali et al. [1997] estimated an average gradual increase of the sea level of about 15 cm overthe past 100 years. This estimate is in accordance with the range of 1-2 mm/yr reported by variousstudies (table 5). Nicholls and Hoozemans [1996] reported the following sea level trends for threesites of the Northwest Mediterranean: 1.1 mm/yr for Trieste (figure 17) [Carbognin L., and TaroniG., 1996], 1.2 mm/yr for Genoa and 1.2 mm/yr for Marseilles. In some specific areas the relativesea level rise has been less consistent (e.g. in the eastern Mediterranean as a consequence oftectonic uplift) or more significant (e.g. in Venice, as a consequence of natural and human-inducedsubsidence, the average sea level rise rate has been 2.5 mm/y; see figure 17) as results of localnatural and human-induced factors. The analysis of satellite data provides a new way to monitor thechanges in the mean level of the Mediterranean. Analyses of the altimetric remote sensing data ofTopex/Poseidon have shown unexpected seasonal variation of the Mediterranean sea level, with anaverage summer-winter difference of about 20 cm (figure 18). The signal is related to the stericeffect of water surface (phenomenon of concentration and dilatation), to seasonal imbalance of theGibraltar incoming and outgoing flows and to phenomenon of evaporation/precipitation [Le traon etal, 1996].
Figure 16: sea level rise in the Mediterranean region over the past 10 000years [source: Pirazzoli,1991, Antonielli et al.1999].

31
Figure 17: Sea level trend at Venice and Trieste in the period 1896-1996. Sea level refers to theaverage tide level of 1897 measured at Punta della Salute in Venice [source: Carbognin, L., andTaroni G., 1996].
Figure 18 : Mean sea level (in m) in the Mediterranean, October 1992 to August 1995(Topex/Poseidon cycles 2 to 106) [source: Le traon et al., 1996].
Due to high natural variability and the short period of observations, researchers generally highlightthe difficulties in identifying clear trends representing climate change at a regional scale. Naturalvariability can mask the potential influence of global warming on climatic factors. Wigley [1992]has noted that in the period 1947-1986 the whole Mediterranean basin has experienced a decrease intemperature. This has been attributed to the natural variability of the climatic system and to‘anomalies’48 which are also expected to affect the global warming pattern in the future. Moreover,the influence of human activities (such as urbanisation, deforestation or irrigation) on the local-regional climate system can mask, mitigate and accentuate the effects of global warming. Thecontinuous measurement of significant climate and related variables, in combination with modellingof past trends, assumes a relevant role in detecting the causes of the observed changes and theoccurrence of human-induced modification of climatic condition, also at the regional scale.
48 Defined by Wigley as “departures from greenhouse effect expectations”
cycle
Mea
n he
ight
(m
)
-5
0
5
10
15
20
25
30
1896
1900
1904
1908
1912
1916
1920
1924
1928
1932
1936
1940
1944
1948
1952
1956
1960
1964
1968
1972
1976
1980
1984
1988
1992
1996
cm
Trieste Venezia

32
Table 5: Estimates of regional sea level rise rate for the 20th century reported by different authors.
Source Region Sea level rise.(mm/year)
Shennan and Woodworth [1992] North-western Europe 1.0 ± 0.15
Milliman [1992] Mediterranean basin 1-2
Piervitali et al. [1997] Central and western Mediterranean 1.5
Nicholls and Hoozemans [1996]
Zerbini et al., [1996]
Genoa (1930-1992)
Genoa (1884-1988)
1.2
1.3
Nicholls and Hoozemans [1996]
Zerbini et al., [1996]
Marseilles (1885-1992)
Marseilles (1885-1989)
1.2
1.1
2.2.2 Future projections for the Mediterranean
The reliability of projections decreases generally when we move from the global to the regional andfurther to the local scale. The problem for the Mediterranean lies in the fact that marked regionaldifferences in the rate of change are expected at different locations and that a wide disagreementexists between patterns of change projected by various models. In the following section generaltrends in the projections of Mediterranean future climate will be identified.
Global Circulation Models (GCMs) have been widely used to examine climate changes and toconstruct climate scenarios over the Mediterranean basin (figure 18) [Palutikof et al., 1996]. TheIPCC [1990, 1992] developed a climate change scenario for Southern Europe and Turkey, usingthree GCMs and equilibrium-mode experiments49. The scenarios projected a warming of 2 °C inwinter and 2-3 °C during summer by the year 2030 and suggested a small average increase inprecipitation in winter and a decrease in summer (5-15%) as well as a decrease in summer soilmoisture of about 15-25%. Rosenzweig et al. (1997) have reported for the Mediterranean a changeof the same order with a temperature increase of 1.4-2.6 °C by the year 2020. It is important to notethat above scenarios have not taken into consideration the cooling effect due to aerosols which can,at least in some regions, partially compensate for the warming effect caused by the increase ingreenhouse gases concentrations. Mitchell et al. (1995) have suggested that aerosols may reducewarming over the Mediterranean region by 1-2 °C over a period from 1795 to 2030-2050. In theshort term aerosols can also partially influence the effects of climate change on precipitation,evapotranspiration and soil moisture. In any case, the role of these particles is still unclear andprobably over-estimated, as discussed in the first chapter.
49 In equilibrium mode experiments, models are run with two different atmospheric CO2 concentrations. Firstly, pre-
industrial CO2 concentration is used. Successively the model is run with doubled (or sometimes quadrupled) CO2concentration. The results generated by the model in the two different modes are compared in order to quantify theperturbation of climatic conditions due to the doubling of the CO2 concentration. Equilibrium mode experiments do not
take time-dependent effects into consideration, such as the effect of the thermal inertia of oceans, which can initiallyslow down the warming process of the atmosphere, or variation in the radiative forcing of greenhouse gases andaerosols. This means that, among other things, the climate changes predicted by equilibrium mode models will notactually occur by the year when doubling of CO2 concentration is expected. There will be a delay in the manifestation
of the climate changes, whose magnitude depends on various factors, such as properties of ocean heat transport.

33
Palutikof et al. [1992] have developed a regional scenario for the Mediterranean, interpolating andaggregating the results generated by four GCMs50. The predicted average increase in temperaturespatially varies between 0.9 and 1.3 °C/°C global warming (Figure 18). These projections areexpressed as change per 1°C global mean temperature increase in order to avoid the problem of thedifferent sensitivities of the models. According to this scenario the least increase is expected tooccur over the Mediterranean sea and the coasts of the Western Italy, Greece and North Africa.Elsewhere, the projected temperature increase exceeds 1 °C/°C global warming. When the Wigleyand Raper’s [1992] global temperature projections 51 are applied to the scenario previouslydescribed, the temperature increase in the Mediterranean basin is estimated to vary between 1.5 and3.4 °C by the year 2100 over the Mediterranean sea and between 2.2 and 4.9 °C in the north-eastregion of the basin [Palutikof et al. 1996].
Figure 18: Scenarios of changes in average annual temperature (changes are expressed as variationin °C per an unitary global temperature increase) obtained through equilibrium mode GCMexperiments [source: Palutikof and Wigley, 1995].
Recent results from the Hadley Centre Model indicate that the Mediterranean will experience aprobable warming of 2 °C in the next 50 years [Gregory et al., 1997]. This increase, according toPiervitali and his collaborators could reach 2-3 °C in the next 100 years over the Mediterraneanbasin with greatest temperature increase in summer over land regions and particularly on NorthwestAfrica and Eastern Turkey [Piervitali et al. 1997].
Precipitation changes are more difficult to predict than temperature variations and projections aregenerally considered less reliable [Palutikof et al., 1996]. It is generally accepted that precipitationwill decrease in the southern Mediterranean region (south of latitude 40-45° N) and will increase inthe northern Mediterranean region [Cubasch et al., 1996; Barrow et al., 1995; Palutikof et al.,1996]. Palutikof et al. [1992] have projected an increase in winter precipitation of 10% and adecrease in summer precipitation of 10% by the year 2100 over the Mediterranean. Similar patterns(an increase of up to 10% in winter precipitation and a decrease of 5 to 15% in summerprecipitation) have been projected by the IPCC [1996a]52 for Southern Europe and Turkey. In
50 The four GCMs are: GFDL, Geophysical Fluid Dynamic Laboratory [Wetherald et al, 1986]; GISS, Goddard Instituteof Space Studies [Hansen et al., 1984]; OSU, Oregon State University [Schlesinger et al., 1989]; and UKMO, UKMeteorological Office [Wilson et al., 1987].51 These projections have been calculated taking the ozone-depletion feedback and the aerosols cooling effect intoconsideration. They foresee, for the IS92a scenario developed by the IPCC [1992], an increase in temperature duringthe period 1990-2100 ranging between 1.7-3.8 °C.52 pp. 289-357

34
addition Piervitali et al. [1997, 1998a; 1998b] have observed that a decrease in precipitation isalready occurring in the western-central Mediterranean basin. The authors have projected a furtherreduction of precipitation in the same area, amounting to –18% (respect to the 1951-1980 referencemean) in 2010 and –24% in 2030. They have also considered that soil moisture reduction couldoccur when taking into account a simultaneous increase in temperature.
Moisture availability is determined by the balance between precipitation and water loss due toevapotranspiration and runoff. Even where precipitation is expected to increase, moistureavailability can decrease if higher temperature and increased runoff produce a negative waterbalance. Jeftic et al. [1996b] have reported that potential evapotranspiration is likely to increasethroughout the Mediterranean and consequently, a negative change in the ratio of rainfall topotential evapotranspiration could occur. According to the IPCC [1996a]53 summer moistureavailability in Southern Europe and Turkey is expected to decrease by 15 to 25%. The greatestchange could occur in spring and autumn in Italian mainland and over Sardinia and Corsica[Palutikof et al. 1994]. As a consequence of a reduction in moisture availability, aridity mayincrease in turn and desertification may affect many areas of southern Mediterranean regions up toSicily, Calabria and Puglia [Piervitali et al., 1997; 1998; 1999].
In addition, authors suggest that the frequency of exceptional events of drought, flood, rainfall,marine storm, tidal surge and eutrophication may increase [Jeftic et al. [1996b]. Due to warmerconditions it is also likely that the occurrence of extremely high temperatures will increase. Areasexperiencing a decrease in precipitation are likely to be affected by more frequent droughts andlonger dry spells. The IPCC [1996a]54 has reported that the doubling of CO2 concentration couldincrease the probability of dry spells lasting more than 30 days in summer in southern Europe by afactor varying between two and five, although the mean precipitation would decrease by only 22%.
Statistical downscaling methods and regional climate change scenarios in the Mediterranean
The spatial resolution of global climate models’ (GCMs) is relatively coarse (generally 300 km forthe current generation) and GCMs’ reliability decreases moving from the global, to the regional andthe local scale and moving from the annual, to the monthly and the daily scale. GCMs are not ableto represent regional and local climate patterns in a precise manner. Therefore analyses of impactsgenerally require regional climate scenarios and a finer spatial and temporal resolution. Differentresearch groups have been developing methods, such as downscaling which permit the generationof reliable regional and local scenarios. Von Storch et al [1993] defined technique of downscalingas “sensibly projecting the large scale information on the regional scale” and used this method toobtain finer resolution scenarios for the Iberian Peninsula. These scenarios can constitute the basisfor the assessment of regional and local climate change impacts and for the development of possiblesolutions, policies and measures for their mitigation. Various downscaling methods have beenrecently developed (e.g. Wilby, [1998], Goodess and Palutikof [1998]) and are the object of on-going relevant researches. The statistical downscaling method requires the identification ofrelationships between the observed variables describing large-scale and regional climate which arethen applied to large-scale GCM output [Goodess and Palutikof 1998]. Figure 19 reports anexample of average temperature change scenario obtained using a statistical downscaling method.The resolution of this scenario is greater than that characterising the scenario presented in figure 18and therefore the produced pattern is more precise. Recently statistical downscaling procedureswere used by the Climatic Research Unit of the University of East Anglia (CRU/UEA) in the EU-funded MEDALUS project (MEDALUS III) in order to construct temperature and precipitation
53 pp. 289-35754 p. 336
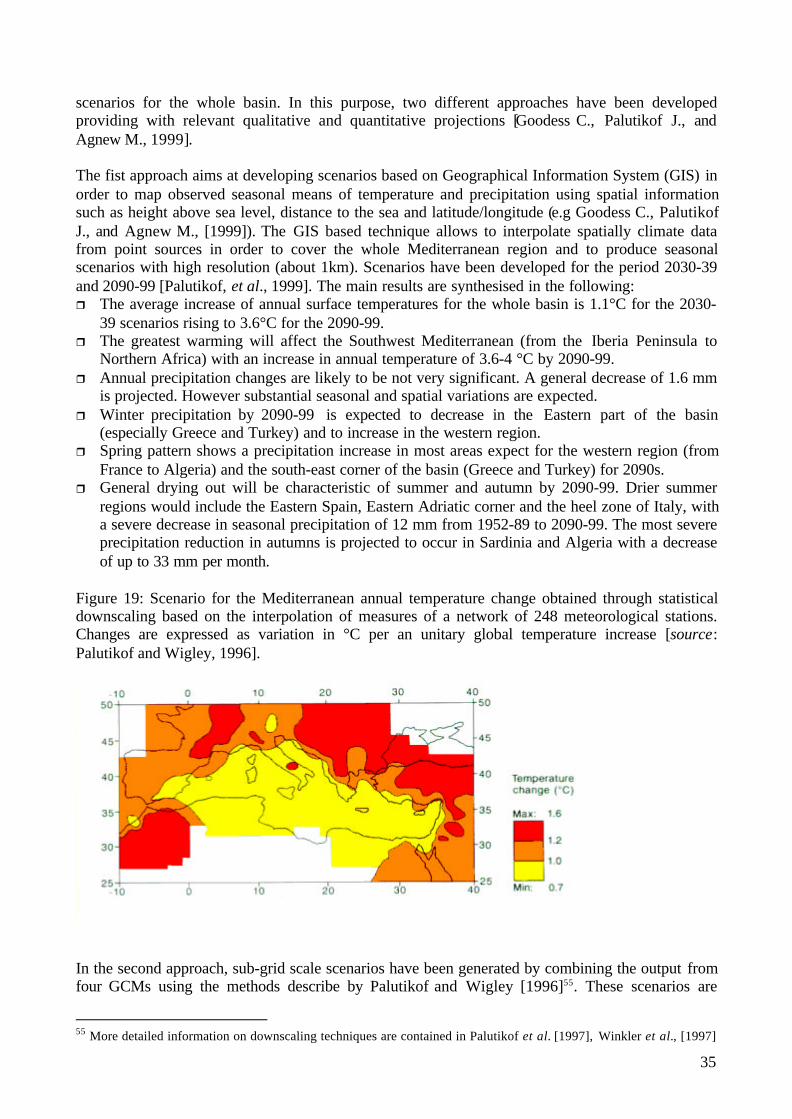
35
scenarios for the whole basin. In this purpose, two different approaches have been developedproviding with relevant qualitative and quantitative projections [Goodess C., Palutikof J., andAgnew M., 1999].
The fist approach aims at developing scenarios based on Geographical Information System (GIS) inorder to map observed seasonal means of temperature and precipitation using spatial informationsuch as height above sea level, distance to the sea and latitude/longitude (e.g Goodess C., PalutikofJ., and Agnew M., [1999]). The GIS based technique allows to interpolate spatially climate datafrom point sources in order to cover the whole Mediterranean region and to produce seasonalscenarios with high resolution (about 1km). Scenarios have been developed for the period 2030-39and 2090-99 [Palutikof, et al., 1999]. The main results are synthesised in the following:r The average increase of annual surface temperatures for the whole basin is 1.1°C for the 2030-
39 scenarios rising to 3.6°C for the 2090-99.r The greatest warming will affect the Southwest Mediterranean (from the Iberia Peninsula to
Northern Africa) with an increase in annual temperature of 3.6-4 °C by 2090-99.r Annual precipitation changes are likely to be not very significant. A general decrease of 1.6 mm
is projected. However substantial seasonal and spatial variations are expected.r Winter precipitation by 2090-99 is expected to decrease in the Eastern part of the basin
(especially Greece and Turkey) and to increase in the western region.r Spring pattern shows a precipitation increase in most areas expect for the western region (from
France to Algeria) and the south-east corner of the basin (Greece and Turkey) for 2090s.r General drying out will be characteristic of summer and autumn by 2090-99. Drier summer
regions would include the Eastern Spain, Eastern Adriatic corner and the heel zone of Italy, witha severe decrease in seasonal precipitation of 12 mm from 1952-89 to 2090-99. The most severeprecipitation reduction in autumns is projected to occur in Sardinia and Algeria with a decreaseof up to 33 mm per month.
Figure 19: Scenario for the Mediterranean annual temperature change obtained through statisticaldownscaling based on the interpolation of measures of a network of 248 meteorological stations.Changes are expressed as variation in °C per an unitary global temperature increase [source:Palutikof and Wigley, 1996].
In the second approach, sub-grid scale scenarios have been generated by combining the output fromfour GCMs using the methods describe by Palutikof and Wigley [1996]55. These scenarios are
55 More detailed information on downscaling techniques are contained in Palutikof et al. [1997], Winkler et al., [1997]

36
expressed as change per 1°C global mean temperature increase. Annual and seasonal sub-gridscenarios of mean temperature and precipitation changes for the Mediterranean have beenconstructed for the periods 1990-1999, 2030-2039, and 2090-99 [Palutikof, et al., 1999]. The mainresults are:r Annual temperatures are expected to increase in all regions of the basin by 2030 and 2099. The
greatest increase would occur in summer over land region (former Yugoslavia, northern Africa,and eastern corner of the basin). For the former Yugoslavia the temperature increase will be inthe order of 1.6°C per °C global mean temperature (gmt) by 2099. The lower increase wouldoccur in winter.
r Predicted changes in precipitation are less homogeneous and vary between seasons and regions.r As a general trend, increase in precipitation by 2099 is expected in autumn and winter over
north Africa (20-30% for per °C gmt), in summer over Northern Adriatic, Northeast Africa andTurkey and in spring over Spain. Decrease in precipitation could occur in spring over the centralMediterranean (around 20% per °C gmt), in summer over Europe and the central Mediterranean,and autumn over a large part of the basin.
Both approaches project a temperature increase annually and seasonally for all areas. The higherincrease is expected in summer over land areas. Regions susceptible to experience higher increaseinclude North Africa, eastern basin (Greece and Turkey) and former Yugoslavia. As regardsprecipitation, it is more difficult to identify a general trends as precipitation patterns are morevariables and shows marked seasonal contrasts. Nevertheless, annual precipitation is expected todecrease slightly in most of the regions.
Narrowing projections down to local scale, specific relevant scenarios have been developed in theMediterranean Action Plan (MAP site-specific studies, see 3.2.3) by the CRU/UEA. Statisticaldownscaling procedure has been used for 5 coastal areas. Local scenarios permit only to provide aqualitative indication of changes in climatic variables as a response of an increase of greenhousegases and aerosols concentrations, by means of sensitivity classes. Sensitivity depends on very localand variable factors. Results of these local scenarios are reported in tables 6 and 7, and are largelyheterogeneous, making impossible the identification of local trends.
Table 6: Temperature sensitivity to a change in global mean temperature in five Mediterranean sites[source: Palutikof et al., 1996].
Annual Winter Spring Summer AutumnRhodesGreece
<< << << > <<
Kastela BayCroatia
< << < < <
Syrian coastSyria
= > < > >>
Maltese islandsMalta
< < < > <
Cres-LosinjCroatia
= < > >> >
<< very low sensitivity< low sensitivity= sensitivity approximately equal to global> high sensitivity>> very high sensitivity
and Goodess and Palutikof [1998].

37
Table 7: Probable direction of variation in rainfall variation as a consequence of global warming[source: Palutikof et al, 1996].
Annual Winter spring Summer AutumnRhodesGreece
N/A Increase increase Increase Increase
Kastela BayCroatia
Increase Increase increase Increase Decrease
Syrian coastSyria
Decrease Increase no change Decrease Decrease
Maltese islandsMalta
no change Decrease decrease N/A Increase
Cres-LosinjCroatia
no change Increase increase Decrease Decrease
N/A not available
III IMPACTS OF CLIMATE CHANGE
3.1 VULNERABILITY, SENSITIVITY AND ADAPTABILITY OF NATURAL AND HUMAN SYSTEMS
The quantitative assessment of climate change impacts is generally a complex task. Uncertaintyassociated with the projections of changes in climate related parameters, on which impacts analysisare based on, represents a major constraint. Other constraints are exerted by (1) the difficulty inmodelling the relationship between potential variations in climatic factors and resulting impacts (2)the complexity of the affected systems and (3) the incomplete understanding of ecological processeswhich come into play. In addition most systems are sensitive to both the rate and the magnitude ofclimate change. In order to facilitate the quantitative approach to impacts studies, the IPCC hasintroduced the concepts of vulnerability, sensitivity and adaptability.
Vulnerability can be defined as the “extent to which climate change may damage or harm asystem”[IPCC 1996b]56. It is directly related to the system’s sensitivity and to its capability to adaptto changed conditions. The most vulnerable systems are those with a great sensitivity to climatechange and a low adaptability. Sensitivity is “the degree to which a system will respond to a changein climatic conditions”, for example the extent of the variation in the composition, structure andfunctioning of an ecosystem undergoing a temperature or precipitation change. Adaptability refersto “the degree to which adjustments are possible in practices, processes or structures of systems toprojected or actual changes of climate”. Adjustments can be spontaneous or planned, reactive oranticipatory, even if planned and anticipatory options are not possible for all systems. Adaptationsmay reduce negative impacts and in some cases can even enable some systems to take advantage ofthe new conditions induced by climate changes. Human-induced stresses and non-sustainablemanagement options can greatly influence the vulnerability, sensitivity and adaptability of a system.In addition, the economic and institutional context influences the capacity of the system to adoptsuitable responses to climate change. Developing countries are generally very vulnerable to climatechange both because of the less favourable economic and institutional situation and because of themany human-induced problems affecting them. Vulnerability assessment must therefore considerthe influence of human-induced stresses and the socio-economic context of affected system.
56 pp. 23-24
38
3.2 CLIMATE CHANGE IMPACTS ON COASTAL ZONES IN THE M EDITERRANEAN
Coastal zones are commonly the geographical space of transition between land and sea,encompassing shoreline environments as well as adjacent coastal waters. They include manydiverse systems such as river deltas, estuaries, tidal wetlands, lagoons, small islands, low-lyingcoastal plains, sandy beaches, and sedimentary coasts. The limits of coastal zone boundaries areoften defined arbitrarily and differ among nations. Coastal zones are inherently dynamic systems,characterised by interacting morphological, ecological and socio-economic processes. Some generalfeatures distinguish them from any other systems [IPCC, 1996b]57:
r A high rate of dynamic changes in the natural environment;r A high biological productivity and diversity;r A high rate of human population growth and economic development;r A high rate of degradation of natural resources;r Exposure to natural hazards such as cyclones and severe storms;r The need for management regimes that address both terrestrial and marine issues.
Coastal zones provide natural resources and suitable space for economic activities and humansettlements, leading to high concentration rate of population. It is estimated that 50-70% of theglobal human population currently lives in coastal zones. Climate change is likely to alter coastalzone dynamic by acting on each of its components causing linked and mutually coupled effects[Klein and Nicholls, 1998]. Coastal zones will be especially affected by sea-level rise and changesin temperature and precipitation patterns, as well as by possible variation in the frequency,distribution and intensity of extreme events such as cyclones and storm surges. Climate changeswill have a distinct regional character and impacts on different coastal zones will vary from regionto region, depending on environmental, social, cultural and economic conditions. Likewise relativesea level changes at regional and local scales may differ from the global mean sea level accordingto land movements (due to tectonic and volcanic activity, subsidence, sediment depletion anderosion), hydrological processes (such as variation in currents, water density, water exchangesbetween the Mediterranean and the Atlantic ocean) and climatic factors (such as atmosphericpressure and the wind patterns).
The Mediterranean basin is widely recognised as particularly vulnerable to climate changes [Jefticet al., 1992; Hoozemans et al., 1993; Nicholls et al., 1996]. Most of current stresses linked to theeffects of high human pressures are expected to be exacerbated by climate change. As a generalrule, most damaging impacts will be on Mediterranean coastal systems already under stress andwhere human activities have diminished natural and socio-economic adaptive capacities.
Only a relatively limited number of studies have analysed the vulnerability of the Mediterraneanbasin in the light of climate change and sea level rise impacts. Consequently, these issues haverarely been considered in coastal planning and management. As highlighted by There is nouniversally applicable methodologies for the assessment of the impacts of future climate changesand the identification of the vulnerability of a system [Georgas, 1999]. In addition, contrasts inrelief, geology, climate and in human activity rates are so marked on the Mediterranean basin thataccurate estimates of the impact could be possible only by narrowing down to the very local level.Some coastal systems, such as deltas [Capobianco, 1996a; Corre, 1992; El-Raey et al., 1995;Marino, 1992; Sestini, 1992a, 1992b; Sanchez-Arcilla et al., 1996; Jimenez et al., 1997; Sanchez-Arcilla et al., 1997] have been subjects of particular attention. Notwithstanding this partiallimitation, it is possible to analyse the main impacts of climate change on Mediterranean coastalzones on the basis of studies similar to those conducted by UNEP [UNEP, 1989b, Georgas,1999] or
57 pp. 293

39
by Nicholls and Hoozemans [1996]. In the present paper biogeophysical and socio-economicimpacts will be treated in two different sections.
3.2.1 Biogeophysical impacts
According to Klein and Nicholls [1998] the six more important biogeophysical impacts induced byclimate changes on coastal zones are: (1) erosion and sediment deficit, (2) increased floodfrequency, (3) inundation of low-lying areas, (4) rising of water tables, (5) saltwater intrusion and(6) consequent biological effects. Due to their significant socio-economic implications, inundationand increased flood frequency will be treated in the socio-economic impacts section, rather than inthe biogeophysical impacts one. The enhancement of the desertification process and the related soildegradation is another relevant impact which is already an environmental stress of concern forvarious Mediterranean regions.
Coastal erosion, sediment deficit and land loss
Coastal erosion is often the result of the combination of natural processes and human intervention.The rise in sea level is likely to increase coastal erosion processes and to affect particularly sandyshorelines. About 20% of the world’s coastlines are sandy and according to Bird [1993] about 70%of these coasts have been eroded over the last 100 years. Sedimentary coasts including sandybeaches, dune systems and wetlands represent 46% of the Mediterranean coasts that is theequivalent of around 21,000 km and are highly vulnerable to erosion. The increase of currenterosion processes will undoubtedly be the most severe impact of climate change on Mediterraneansandy shores. It has been estimated that around one fifth of the Mediterranean coastal zones arepresently affected by coastal erosion [Corine Coastal Erosion Atlas, 1998] and that about 25 % ofthe Italian Adriatic coast already show erosion trends (figure 20) [UNEP/EEA 1999b]. Theshoreline retreat (using the Bruun Rule 58) according to ACACIA scenarios for Europe could rangebetween 25 m to 110 m in most of European countries by 2080s [ACACIA, 1999].
Mediterranean coastal wetlands are expected to suffer particularly from sea level changes. It hasbeen estimated that a 1 m rise in sea level would harm half of the world’s coastal wetlands that haveinternational importance (according to the criteria established by the Ramsar Wetland Convention[1971]). The potential wetland loss in Europe has been assessed by the ACACIA59 project using thewetland loss model described by Nicholls et al. [1999]. According to the most pessimist scenariothe wetland loss due to sea level rise for the EU Mediterranean countries could be nearly total by2080s (figure 21). The high vulnerability of Mediterranean wetlands is due to the low tidal rangewhich determine the potential capacity for wetland vertical accretion and the high human activityrate which reduce the capacity of horizontal migration (inland migration). The limited tidal range ofthe Mediterranean sea restricts the vertical range of wetlands and their ability to cope with sea levelrise by means of vertical accretion [Stevenson et al., 1986]. On the other hand, infrastructures,urbanised areas and protection works such as barriers, bulkheads or levees can represent constraintsto inland migration. The ability of wetlands to cope with climate change impacts requires thatsedimentation keep pace with these changes and that sea level rise occurs at a rate which allows thesystem to adapt.
58 According to the Bruun Rule, the magnitude of shoreline retreat corresponds to 100 times the sea level rise.59 ACACIA (A Consortium for the Application of Climate Impact Assessments) is public/private sector program; moreinformation can be found at http://www.cgd.ucar.edu/cas/ACACIA/
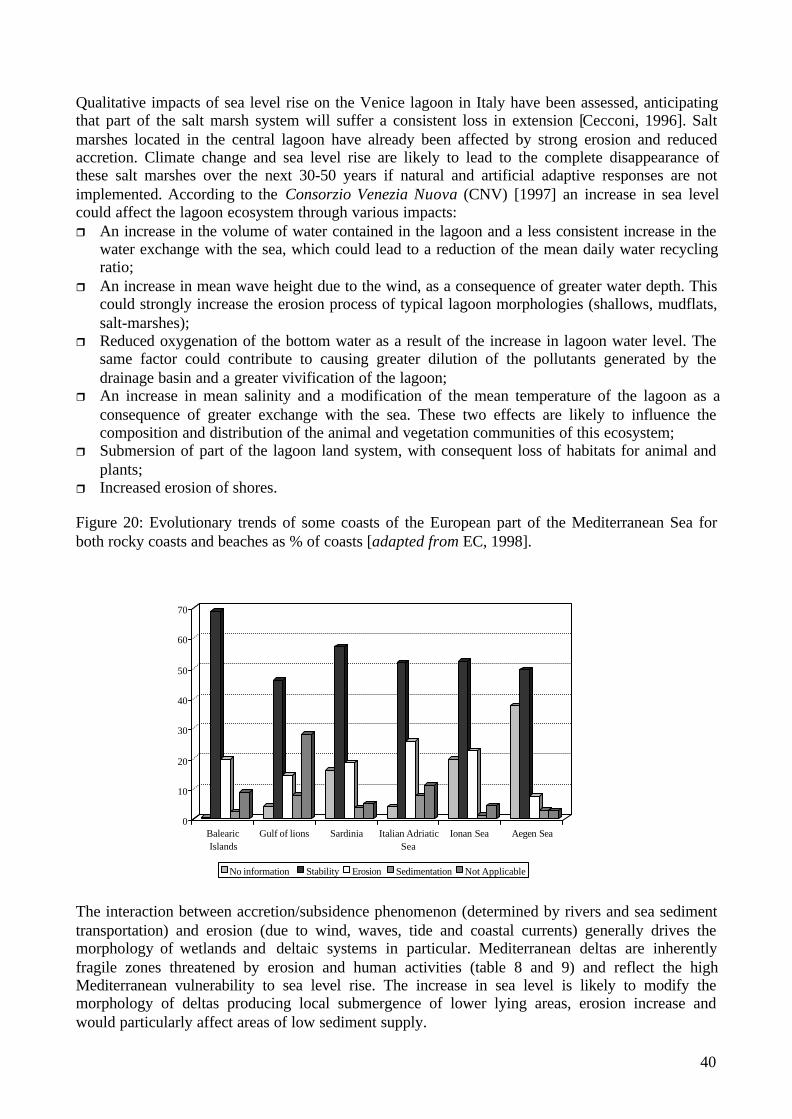
40
Qualitative impacts of sea level rise on the Venice lagoon in Italy have been assessed, anticipatingthat part of the salt marsh system will suffer a consistent loss in extension [Cecconi, 1996]. Saltmarshes located in the central lagoon have already been affected by strong erosion and reducedaccretion. Climate change and sea level rise are likely to lead to the complete disappearance ofthese salt marshes over the next 30-50 years if natural and artificial adaptive responses are notimplemented. According to the Consorzio Venezia Nuova (CNV) [1997] an increase in sea levelcould affect the lagoon ecosystem through various impacts:r An increase in the volume of water contained in the lagoon and a less consistent increase in the
water exchange with the sea, which could lead to a reduction of the mean daily water recyclingratio;
r An increase in mean wave height due to the wind, as a consequence of greater water depth. Thiscould strongly increase the erosion process of typical lagoon morphologies (shallows, mudflats,salt-marshes);
r Reduced oxygenation of the bottom water as a result of the increase in lagoon water level. Thesame factor could contribute to causing greater dilution of the pollutants generated by thedrainage basin and a greater vivification of the lagoon;
r An increase in mean salinity and a modification of the mean temperature of the lagoon as aconsequence of greater exchange with the sea. These two effects are likely to influence thecomposition and distribution of the animal and vegetation communities of this ecosystem;
r Submersion of part of the lagoon land system, with consequent loss of habitats for animal andplants;
r Increased erosion of shores.
Figure 20: Evolutionary trends of some coasts of the European part of the Mediterranean Sea forboth rocky coasts and beaches as % of coasts [adapted from EC, 1998].
The interaction between accretion/subsidence phenomenon (determined by rivers and sea sedimenttransportation) and erosion (due to wind, waves, tide and coastal currents) generally drives themorphology of wetlands and deltaic systems in particular. Mediterranean deltas are inherentlyfragile zones threatened by erosion and human activities (table 8 and 9) and reflect the highMediterranean vulnerability to sea level rise. The increase in sea level is likely to modify themorphology of deltas producing local submergence of lower lying areas, erosion increase andwould particularly affect areas of low sediment supply.
0
10
20
30
40
50
60
70
BalearicIslands
Gulf of lions Sardinia Italian AdriaticSea
Ionan Sea Aegen Sea
No information Stability Erosion Sedimentation Not Applicable

41
Figure 21: Range of wetland losses due to sea level rise by 2080s according to ACACIA scenarios.Given the range of uncertainties a high loss estimate (grey) and low loss estimate (white) have beendetermined [source: ACACIA, 1999].
The risk is particularly high for the more important deltas the Nile, the Rhone, the Po and the Ebrowhich have already been subjected to erosion and shoreline retreat. These problems result both fromthe aggression from the sea side (due to waves, storms surges and flooding) and the reduction ofsediment flow from inland areas due to natural processes and human intervention (construction ofdams and dikes, excavation of canals, habitat destruction and river sediment mining).
Table 8: Major sources/causes of the present problems in the major Mediterranean deltas [source:Jeftic et al., 1996b].
Ebro Rhone Po Niledrought L L L Mfloods and storms M H H Hchange in relative sea level M M H Mreduction in river discharges H H H Hdepletion/salinisation of aquifers L L H Hpollution M H H Hpoorly planned development L L M Hpressure of coastal population L L H Hpressure of tourism L M H Hpressure of industry L M H Hpressure of urban development L L H Hcoastal erosion H M H H
L = low; M = medium; H = high
The Nile delta and the adjacent areas have been subject of particular attention, and are characteristicof a high vulnerability to climate change due to natural conditions and human intervention[Milliman et al., 1989; Jeftic et al., 1992; El- Raey, 1998]. Egypt is widely dependant on resourcesfrom the Nile river and delta, in particular for water resources (90% come from the Nile). Humaninterventions have completely modified the natural annual cycle of the Nile, the water flow andsediment discharge [Stanley et al., 1993]. The construction of the large dams60 and the increasingregulation of the Nile have actually de-coupled the delta from the river system [Stanley, 1990].According to Stanley’s studies, as a consequence of the dramatic reduction in transportation of
60 The construction of the Low Aswan Dam in 1902 and its successive modifications in 1912 and 1934 as well as thebuilding of the High Aswan Dam (1964),
0
20
40
60
80
100
total EuropeanUnion
Atlantic/North Sea Baltic Mediterranean
% lo
ss

42
fluvial sediments to the coasts, the Nile can no longer be considered an active delta. It is rather awave-dominated coastal plain along the Mediterranean coast, subjected to erosion by waves andcurrents. In addition, overexploitation of the Nile water for irrigation purposes seriously hindersfreshwater from reaching the sea. Other negative impacts which can be attributed to the profoundmodification of the natural cycle of the Nile flow and sediment discharge are: marine intrusion intolow-lying areas of the northern delta, curtailment of flood silt deposits that formerly served asnatural fertilisers and also offset subsidence, increased soil salinisation, and decline in fishpopulations as a result of a decrease in fluvial transportation of nutrients to the coast and thelagoons [Stanley et al., 1993].
Table 9: Systems and processes under stress at the present in the major Mediterranean deltas[source: Jeftic et al., 1996b].
Ebro Rhone Po Nileshoreline dynamics H H L Msoil erosion L L L Laquaculture/fishery L L M Hagriculture M M L Lforest fires L L L Lurban sanitation L L M Hdrinking water supply L L M Hhistoric settlements L L H Lcoastal structures L M H M
L = low; M = medium; H = high
The potential sea level rise could therefore have dramatic consequences. It has been estimated[Khafagy et al. 1992] that in the Nile delta a 1 m sea level rise could lead to:
r the inundation of about 2000 km2 of land in coastal areas;r a substantial erosion of the deltaic area, possibly leading to land losses of as much as 100
km2;r the loss of about 1,000 km2 (very rough estimate) of agricultural land;r severe problems of saltwater intrusions and drainage capacity reduction
Similarly to the Nile delta, the Ebro, Po and Rhone deltas have also been profoundly modified andsuffer from sediment deficit as a consequence of human-induced changes in their catchment areas.The Ebro is the delta which has experienced the greatest reduction (96%) in its sediment supply[Sanchez-Arcilla et al., 1996]. Locally natural and human-induced subsidence have contributed todetermining a high relative sea level rise. Some areas of these deltas therefore already lie below sealevel and are protected from inundation by defensive structures. In the case of Po delta, thesubsidence locally reached the exceptional value of 30 cm/y and produced a lowering of the land byalmost 3.5 m between 1958 and 1967 in the inner part of this system [Caputo et al. 1970; Sestini1992a]. Recent data have shown a stabilisation of subsidence in the Po delta at values lower than 2-3 mm/y but potential sea level rise could contribute to the permanent submersion of a surface arearanging from 690 km2 to 910 km2 by 2100 (table 10). Figure 22 represents the potential regressionof the coastline by the year 2100 as a consequence of sea level rise induced by climate change andthe pessimistic subsidence scenario. According to the figure the most vulnerable area appears to bethat between Ravenna and the Po delta.

43
Table 10: Surface area of the zones permanently submerged in the Northern Adriatic as aconsequence of sea level rise caused by global warming and two subsidence scenarios (optimisticand pessimistic) by the year 2050 and 2100. The area considered in the analysis is the coastal stripbetween the locality of Monfalcone and Cattolica. Other local studies were conducted in the zonesof Rimini, Ravenna and Cesenatico [source: Gonella et al. 1997].
Optimistic subsidencescenario
Pessimistic subsidencescenario
Year 2050 2100 2050 2100
Surface area (km2) 65 690 600 910
Figure 22: Potential regression of the Northern Adriatic coastline by 2100 as a consequence of sealevel rise induced by climate change and the pessimistic subsidence scenario [source: Gonella et al.1997].
Saltwater intrusion
Saltwater intrusion into freshwater systems and in particular into aquifers is expected to be animpact of great concern in the Mediterranean. Higher sea level and increased frequency andmagnitude of storm surges can adversely impact freshwater supplies in coastal areas. Saline waterprofiles in river mouths and deltas would be pushed farther inland, and coastal aquifers would facean increase threat of salt water intrusion [Frederick and Major, 1997]. In some areas and during
44
specific seasons, the salt wedge could penetrate as far as 10-50 km inland from the coastline[Vallega, 1997]. The implications of an increase in saltwater penetration in terms of decrease inwater availability and increase in water stress are evident. For example, it has been calculated that a1 metre rise in sea level could reduce Malta water availability by 40% [Attard et al., 1996].
Intrusion of saltwater already affects many Mediterranean areas (for example in Italy, Spain, Greeceand North Africa) and will be more severe in regions where freshwater flows have been reduced byoverexploitation and bad management of water resources. The growth of population and theincrease in per-capita demand of water in the last decades have enhanced the human pressure onMediterranean freshwater reservoirs, favouring the process of saline intrusion [Vallega, 1997]. Ithas been estimated that 50% of the irrigated land in the Euphrates valley, 30 % in the Nile valleyand 33% in Greece are currently threatened by salinisation due to soil degradation and inadequateuse of water [Baric and Gasparovic, 1992]. Likewise, in Tunisia, 26% of surface water, 90% ofwater pumped from water tables and 80% of that extracted from deep aquifers have a salinity ofmore than 1.5 g/l [Greenpeace].
The severity of the effects produced by saltwater intrusion into aquifers depends on the differencebetween the densities of fresh and salt water, the hydrodynamic properties of the aquifer and theflow that the aquifer discharges into the sea [Estrella, et al. 1996]. In any case, saline intrusion incombination with other climate related factors is likely to affect freshwater supply and to exacerbaterisks of water scarcity in the Mediterranean basin. These factors include the reduction inprecipitation and in soil moisture, the increase in evaporation and in infiltration rates due to soildegradation and the increase of sedimentation processes in water reservoirs.
The increase in magnitude of saltwater intrusion into freshwater systems is likely to impose otherimpacts on the natural and human systems. Lower ponds of Camargue (the Vaccares) for exampleare likely to experience hyper saline conditions in the case of sea level rise (50-70 g/l) [Corre,1992]. This would have relevant ecological implication, leading to significant modifications in thedistribution and relative abundance of various animal and vegetal species. Saltwater intrusion couldalso negatively influence agriculture through soil salinisation and salt contamination of irrigationwater, in particular in arid and semiarid regions of the Mediterranean basin. Excessiveconcentration of sea water at water intakes could create a public health risk, damage machinery andincrease the cost of water treatment [Lindh, 1992].
Land degradation and desertification
Desertification is defined as “land degradation in arid, semi-arid and dry sub-humid areasresulting from various factors, including climatic variations and human activities” [UNEP, 1992;Hulme and Kelly, 1993]. Desertification is thus the result of the combination of climate and non-climate related factors as well as natural and human induced processes such as erosion, salinisation,deforestation and overexploitation of natural resources. Middle Eastern Asian and Northern Africancountries of the Mediterranean basin, are traditionally affected by desertification, but this processalso threatens some parts of Southern Europe, such as Corsica, the Iberian peninsula, Greece,southern Italy and Sicily [UNEP, 1992] with some substantial economic and human costs. It hasbeen estimated that in Spain desertification causes about US$200 million of damages every year[Greenpeace].
The Mediterranean region presents some features that facilitate desertification and erosive processes[Comitato Nazionale per la lotta contro la desertificazione, 1998]. These include: semi-arid and aridclimatic conditions, seasonal droughts, high rainfall variability, sudden and violent rainfall events,presence of poor soils which are vulnerable to erosion and crust formation, presence of steep slopes,

45
loss of vegetation cover due to deforestation and fire, crisis of the traditional agricultural system andland abandonment, overexploitation of water resources (in particular of aquifers) and soilsalinisation. Climate change is likely to exacerbate and expand desertification. The vulnerability ofarid and semi-arid areas can be intensified even by small changes in climatic conditions [IPCC,1996b]61. According to Lavee et al. [1998] small changes are also sufficient to cause a shift of theborders between Mediterranean and arid areas and to spread the desertification process in regionswhich are currently affected only in a marginal way [Piervitali et al., 1998b].
The process is generally driven by water availability and therefore by the distribution and intensityof rainfall events. Rainfall is not only important in terms of the annual amount, but also in terms ofthe duration and length of the intervals between successive events. Lavee et al. [1998] havedescribed the influence of climate change on the desertification process as follows. In general, apotential decrease in the amount of rainfall, a decrease in the duration of the rainfall events and anincrease in the duration of the interval between successive rainfall events diminish the availabilityof water for vegetation and micro-biological activity.
Increase in temperature and in evaporation can be additional stresses and are likely to limit wateravailability. Consequently, the organic matter contained in the soil decreases, while saltconcentration may increase. The long-term effects of a decrease in water availability include thereduction in clay content and soil stability, due to modification of soil particles aggregation. Allthese processes can lead to lower water carrying capacity, lower permeability, crust formation, anddecrease in the infiltration rate. Less water will therefore be available for vegetation and more waterwill run over the surface, contributing to the erosion of the more fertile topsoil. Increased run-offwill lead to a decrease in the nutrients content of the soil and to a further reduction of the soilfertility. Indirect factors related to climate change that could intensify desertification includeincreased fire risk due to higher temperatures and drier conditions, and increased salinisation or saltwater intrusion.
Biological effects
Climate changes are able to alter the structure, the functions and the productivity of many terrestrialand aquatic ecosystems. The present section focuses on marine ecosystems and in particular on thetwo ecosystems, vital for the Mediterranean sea biodiversity: sea-grass meadows and coralcommunities.
Mechanisms linking climate and marine ecosystems are complex and incompletely understood. Ithas been demonstrated that even small changes in climatic variables often produce significantchanges in the abundance of species because of direct and indirect effects. Direct effects are linkedto changes in water temperature and salinity which can affect organism survival, reproductionpattern and biotic interactions. Indirect effects are linked mainly to hydrodynamic variations[Bakun. 1996, Kawasaki et al. 1991] such as those affecting ocean circulation, stratification ofwater, mixing patterns and consequently nutrient availability for marine organisms [Ittekkot, 1996].According to the UNEP/EEA [1999b] report, warmer water temperatures may act positively onbiodiversity, allowing the formation of species enriched assemblages. Nevertheless, major negativeecological impact could occur through the expansion of warm water species, the introduction ofnew competitors and some changes in inter-specific relation. In addition, warmer water is likely tointensify the invasion of migrants from the red sea through the Suez Canal62, and the competition
61 pp. 170-18962 The phenomenon is known as Lessepsian migration related to the engineer of the Canal, Ferdinand de Lesseps

46
between colonisers and native species, implying drastic changes in Mediterranean speciesdistribution at the expense of the more sensitive species.
The most important sea-grass in the Mediterranean sea is the Posidonia oceanica which is anendemic species, symbolic of the Mediterranean biodiversity. Posidonia beds represent the mostimportant Mediterranean ecosystem, supporting 25% of the Mediterranean flora and fauna, andproviding important feeding grounds, nurseries and protective places for many species (fishes, seaturtle, cephalopods, crustaceans, etc.). Sea-grass meadows are also extremely important because oftheir capacity to function as natural coastal protection agents. They can diminish waves aggressionon coasts and contribute in counterbalancing erosion, trough the trapping and stabilisation ofunconsolidated sediments. It has been estimated that a loss of 1 m of Posidonia bed may cause ashoreline regression of nearly 20 m [Salman and Kooijman, 1998]. Posidonia meadows cover about350 000 square kilometres and have already regressed throughout the Mediterranean (for instance inFrance the loss is estimated to amount to 10-15%). Climate change can further threaten theseecosystems. It has been noted that shallow and inter-tidal sea-grass in particular will suffer from anincrease in sea-surface temperature and in some cases from an enhanced freshwater land runoff[Eduards, 1995]. Sea level rise will affect sea-grass meadows through indirect effects, such as theintensification of erosion and the consequent increase in turbidity as well as through a decrease inlight infiltration. Nevertheless, climate change impacts are likely to be less significant than thoseproduced by other human-induced disturbances, such as sediment dredging, water pollution,eutrophication, increase in turbidity, use of highly impacting fishing techniques and excessivemarine traffic.
Coral ecosystems are also extremely sensitive to shifts in seawater temperature and salinity, as wellas in irradiance. A limited increase in temperature (1-2 °C) for a short period can lead to bleaching,of coral while a substantial temperature elevation over a longer period can provoke a significantmortality of corals and inhibit their reproductive functions [Brown et al., 1990, 1993]. The mostextensive coral bleaching event ever reported has occurred during the 1997-1998 period with a highmortality in some particular regions (Maldives, Sri Lanka, Thailand). This unprecedentedphenomenon coincided with the El Niño event followed by a strong La Niña. Coral bleaching mayoccur as a response to many stresses, but the recent apparent increase in incidence and severity ofthis phenomenon might be linked with global climate change [Wilkinson, C. 1998]. Tropical coralsare particularly sensible to temperature changes as many species already live near their tolerancelimit of temperature [Goreau, 1992] and are subject to intense human pressures. Nevertheless in theMediterranean sea, recent observations of coral bleaching have also been reported by the marinelaboratory of the university of Nice. High mortality of gorgoons have been observed in France(from the Italian frontier to Marseilles), on Italian coasts (Liguria, Portofino), and in a lowermagnitude in Corsica. Most of Mediterranean gorgoon species appear to be affected (Paramuriceaclavata, Eunicella singularis, Lophogorgia ceratophyta, and Eunicella cavolini) [Perez, et al.2000]. This recent phenomenon is not well understood and studies are still in progress.Nevertheless, the scientific community maintains that sea water temperature anomalies areundoubtedly implicated.
3.2.2 Socio-economic Impacts
Socio-economic implications of sea level rise and climate change on coastal zones are mainlylinked to the increase in the risks of flooding of human settlements, goods, infrastructure andservices and to the loss of coastal land and habitats due to inundation of low-lying areas [Klein andNicholls, 1998; Sterr and Klein, 1999]. Other socio-economic impacts are those directly affecting

47
important economic activities, such as coastal agriculture, fishery and tourism or those concerningwater availability and human health (table 11).
Table 11: Qualitative synthesis of direct socio-economic impacts of climate change and sea-levelrise on a number of sectors in coastal zones [source: Sterr and Klein 1999].
Biogeophysical Effect
Sector FloodFrequency
Erosion Inundation Rising WaterTables
SaltwaterIntrusion
BiologicalEffects
Water Resources 3 3 3
Agriculture 3 3 3 3
Human Health 3 3 3
Fisheries 3 3 3 3 3
Tourism 3 3 3 3
HumanSettlements
3 3 3 3
Flooding and permanent inundation of coastal areas
Increase in the risk of flooding and inundation of low-lying coastal areas represent the two mostevident impacts of sea level rise. Their socio-economic implications are intuitive, since theseimpacts are able to negatively affect all human activities located in coastal area. The level of riskwill depend on the level of human presence and on the effectiveness of existing defensivestructures. Mediterranean coasts, especially those located in European countries, are generallyheavily urbanised. As a consequence a great number of human settlements, including large cities,will have to face serious sea level rise implications, such as increased risk of flooding, impededdrainage, inundation of low-lying areas, salinisation of freshwater supplies, higher water tableswhich may reduce the safety of foundation, beach erosion [Timmerman et al. 1997].
Increase in the frequency and intensity of flooding produced by temporary sea level rise caused bystorm surge or wave set up is a particular impact of climate change effects that must be properlytaken into consideration. In the Mediterranean, even a small rise in sea level can significantlyreduce the return period of a given elevation flood [Nicholls and Hoozemans, 1996]. According toNicholls and Hoozemans [1996] in 1990 about 10 million people in the basin lived in areas at riskfrom flooding63 (table 12). If population growth is not taken into consideration, a 1.0 m sea levelrise will produce an increase of the total number of people at risk from flooding by 70%. As aconsistent population growth is expected (table 12, the 2020 scenario) for the southern basincountries (especially in Turkey and Egypt) the total number of people at risk by 2020 will rise by83% with a 0.5 m sea level rise and 132% with a 1 m increase in sea level with respect to 1990level. However, these estimates could be overestimated in the reality since in many cases naturaland artificial defence structures protect the coasts.
According to Nicholls and Hoozemans [1996] on average each year, one million people experienceflooding around the Mediterranean and particularly in the southern region. Coasts of Northernregions are generally better protected but a sea level rise could severely limit the effectiveness oftheir defences. A 0.5 m and 1.0 m sea level rise - through the expansion of the potentially affectedarea and the decline of the level of protection - will increase number of people experiencing
63 Defined as the areas beneath the 1000 year storm surge
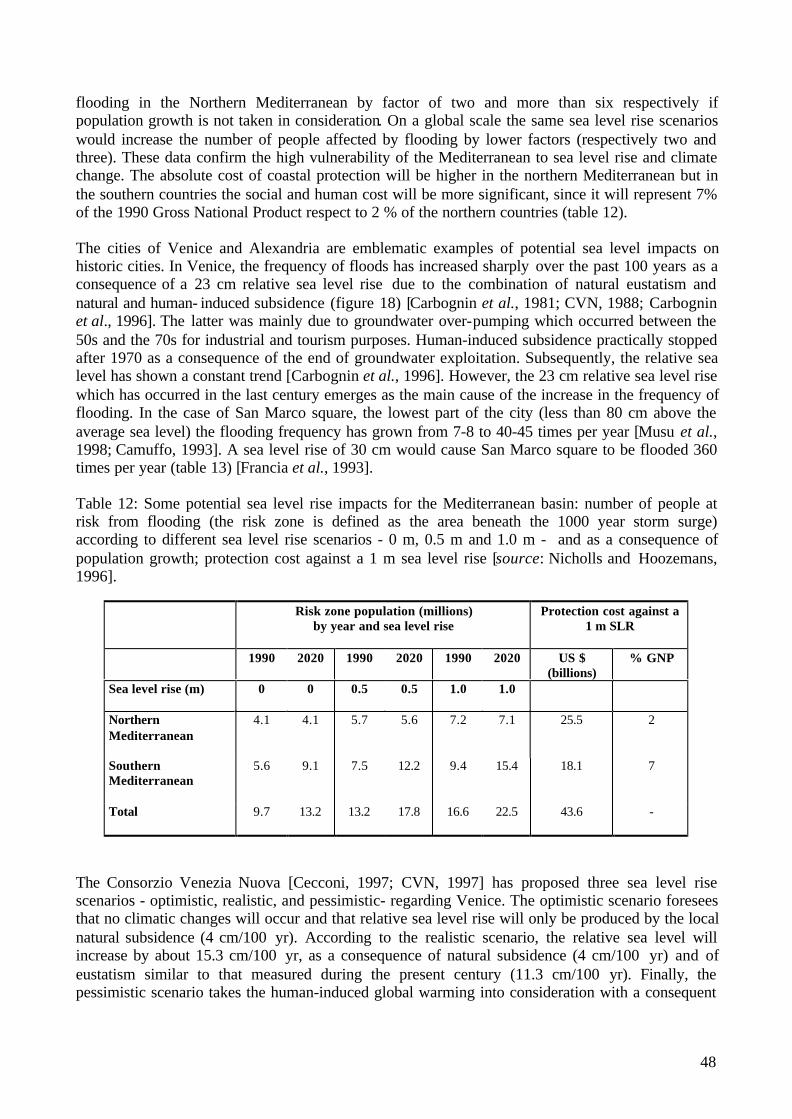
48
flooding in the Northern Mediterranean by factor of two and more than six respectively ifpopulation growth is not taken in consideration. On a global scale the same sea level rise scenarioswould increase the number of people affected by flooding by lower factors (respectively two andthree). These data confirm the high vulnerability of the Mediterranean to sea level rise and climatechange. The absolute cost of coastal protection will be higher in the northern Mediterranean but inthe southern countries the social and human cost will be more significant, since it will represent 7%of the 1990 Gross National Product respect to 2 % of the northern countries (table 12).
The cities of Venice and Alexandria are emblematic examples of potential sea level impacts onhistoric cities. In Venice, the frequency of floods has increased sharply over the past 100 years as aconsequence of a 23 cm relative sea level rise due to the combination of natural eustatism andnatural and human- induced subsidence (figure 18) [Carbognin et al., 1981; CVN, 1988; Carbogninet al., 1996]. The latter was mainly due to groundwater over-pumping which occurred between the50s and the 70s for industrial and tourism purposes. Human-induced subsidence practically stoppedafter 1970 as a consequence of the end of groundwater exploitation. Subsequently, the relative sealevel has shown a constant trend [Carbognin et al., 1996]. However, the 23 cm relative sea level risewhich has occurred in the last century emerges as the main cause of the increase in the frequency offlooding. In the case of San Marco square, the lowest part of the city (less than 80 cm above theaverage sea level) the flooding frequency has grown from 7-8 to 40-45 times per year [Musu et al.,1998; Camuffo, 1993]. A sea level rise of 30 cm would cause San Marco square to be flooded 360times per year (table 13) [Francia et al., 1993].
Table 12: Some potential sea level rise impacts for the Mediterranean basin: number of people atrisk from flooding (the risk zone is defined as the area beneath the 1000 year storm surge)according to different sea level rise scenarios - 0 m, 0.5 m and 1.0 m - and as a consequence ofpopulation growth; protection cost against a 1 m sea level rise [source: Nicholls and Hoozemans,1996].
Risk zone population (millions)by year and sea level rise
Protection cost against a1 m SLR
1990 2020 1990 2020 1990 2020 US $(billions)
% GNP
Sea level rise (m) 0 0 0.5 0.5 1.0 1.0
NorthernMediterranean
4.1 4.1 5.7 5.6 7.2 7.1 25.5 2
SouthernMediterranean
5.6 9.1 7.5 12.2 9.4 15.4 18.1 7
Total 9.7 13.2 13.2 17.8 16.6 22.5 43.6 -
The Consorzio Venezia Nuova [Cecconi, 1997; CVN, 1997] has proposed three sea level risescenarios - optimistic, realistic, and pessimistic- regarding Venice. The optimistic scenario foreseesthat no climatic changes will occur and that relative sea level rise will only be produced by the localnatural subsidence (4 cm/100 yr). According to the realistic scenario, the relative sea level willincrease by about 15.3 cm/100 yr, as a consequence of natural subsidence (4 cm/100 yr) and ofeustatism similar to that measured during the present century (11.3 cm/100 yr). Finally, thepessimistic scenario takes the human-induced global warming into consideration with a consequent
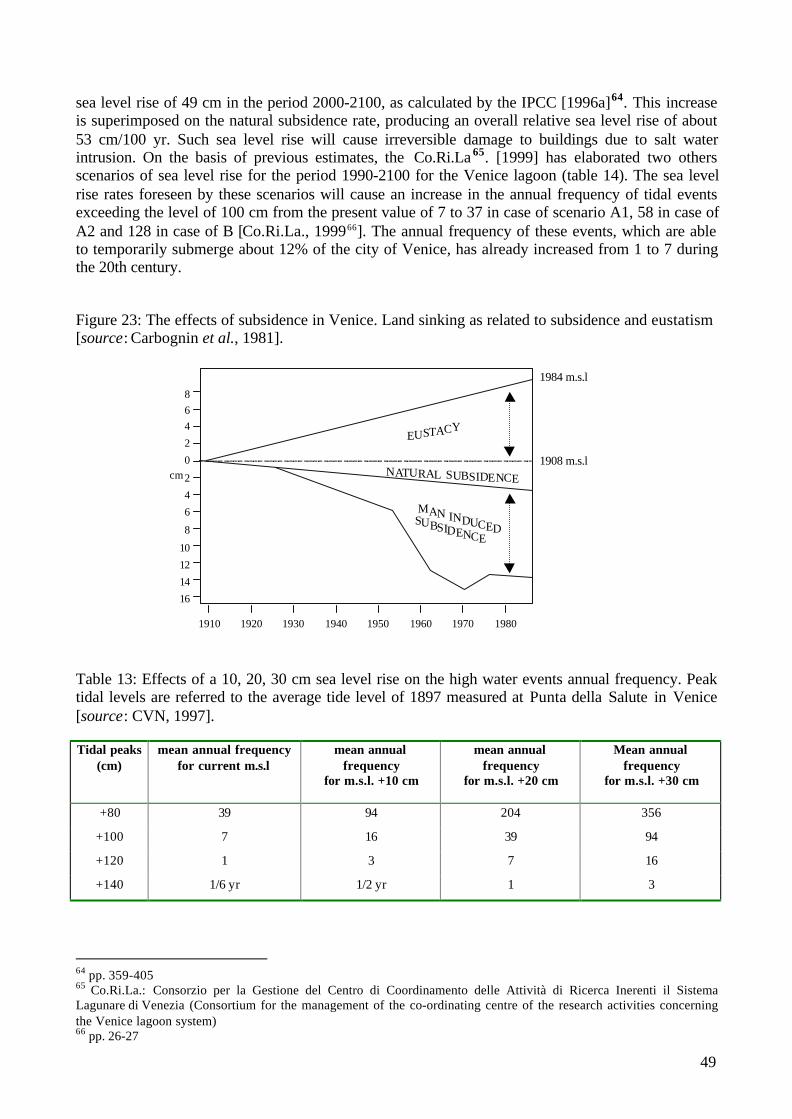
49
sea level rise of 49 cm in the period 2000-2100, as calculated by the IPCC [1996a]64. This increaseis superimposed on the natural subsidence rate, producing an overall relative sea level rise of about53 cm/100 yr. Such sea level rise will cause irreversible damage to buildings due to salt waterintrusion. On the basis of previous estimates, the Co.Ri.La 65. [1999] has elaborated two othersscenarios of sea level rise for the period 1990-2100 for the Venice lagoon (table 14). The sea levelrise rates foreseen by these scenarios will cause an increase in the annual frequency of tidal eventsexceeding the level of 100 cm from the present value of 7 to 37 in case of scenario A1, 58 in case ofA2 and 128 in case of B [Co.Ri.La., 199966]. The annual frequency of these events, which are ableto temporarily submerge about 12% of the city of Venice, has already increased from 1 to 7 duringthe 20th century.
Figure 23: The effects of subsidence in Venice. Land sinking as related to subsidence and eustatism[source: Carbognin et al., 1981].
Table 13: Effects of a 10, 20, 30 cm sea level rise on the high water events annual frequency. Peaktidal levels are referred to the average tide level of 1897 measured at Punta della Salute in Venice[source: CVN, 1997]. Tidal peaks
(cm) mean annual frequency
for current m.s.l mean annual
frequency for m.s.l. +10 cm
mean annualfrequency
for m.s.l. +20 cm
Mean annualfrequency
for m.s.l. +30 cm
+80 39 94 204 356
+100 7 16 39 94
+120 1 3 7 16
+140 1/6 yr 1/2 yr 1 3
64 pp. 359-40565 Co.Ri.La.: Consorzio per la Gestione del Centro di Coordinamento delle Attività di Ricerca Inerenti il SistemaLagunare di Venezia (Consortium for the management of the co-ordinating centre of the research activities concerningthe Venice lagoon system)66 pp. 26-27
1910 1920 1930 1940 1950 1960 1970 1980
16
14
12
10
8
6
4
2
0
2
4
6
8
cm1908 m.s.l
MAN INDUCEDSUBSIDENCE
NATURAL SUBSIDENCE
EUSTACY
1984 m.s.l

50
Table 14: Co.Ri.La scenarios of sea level rise for the period 1990-2100 for the Venice lagoon.
Scenarios Sea level rise Contributing factors Comments Annual frequency of
tidal events > 100 cm *A1 16.4 cm • Eustacy: 1.13 mm/y
• Natural subsidence 0.4mm/y
• rates similar to thosemeasured during the 20th
century• assumption that before
2100, Climate change willexert a significant influenceon relative sea level
37
A2 21-23 cm • Eustacy rate 1.5 mm/y• Natural subsidence 0.4
mm/y
58
B 31.4 cm • Global warmingcontribution based onIS92a emission scenario,and advanced models 67
• Natural subsidence 0.4mm/y
128
*actual annual frequency of 7 tidal events > 100 cm
The Nile valley and delta (figure 24) which occupies only the 4% of the total Egypt surface area,presents one of highest population densities of the world with 1492 inhabitant/km2 (the averagepopulation density of the rest of Egypt is 2 inabitant/km2) [FAO, 1997]. Sea level rise will thereforeproduce significant socio-economic impacts on this area. According to some authors [Broadus etal., 1986; Milliman et al., 1989] 8 million people would be displaced in Egypt by a 1 m sea levelrise, assuming no protection and existing population levels. The city of Alexandria is experiencing arapid population growth (population of the city was 3 million in 1990 and is now about 5 million[Timmerman et al., 1997]) and a worsening of local environmental problems, such as beach erosionand pollution [Frihy et al., 1996]. This has forced the city to expand towards low-lying areas (thelake of Maryut) and to reclaim wetlands for agricultural purposes. Some studies have quantitativelyassessed the Alexandria and adjacent coastal areas vulnerability to sea level rise using geographicinformation systems, remote sensing, modelling techniques and ground-based surveys [El- Raey etal., 1995, El- Raey et al., 1997, El-Raey, 1998, El- Raey et al., 1998b].
Potential socio-economic impacts in relation to diverse sea level rise scenarios for Alexandria areshown on the figure 25. A significant percentage of population and of area used by humans isalready at risk of permanent inundation. In reality natural and artificial defensive structures ensureprotection of people and the city. Sea level rise would increase the inundation risk both byincreasing the percentage of people and areas potentially affected and reducing the level of safety ofdefence structures, such as sea walls and drainage systems. The studies have estimated that if noresponse measure is taken, the 0.50 m sea level rise scenario will cause the displacement of about1.5 million people, the loss of 195,000 jobs and an economic loss of more than 35 billion Americandollars, over the 21th century.
The most vulnerable economic sectors are the agricultural sector which employs 38% of theEgyptian labour force [FAO, 1997], followed by the industrial and tourism sector. The
67 These models incorporate various advancements in modelling respect to the other models used by IPCC in 1995. Theconsidered climate sensitivity is 2.2 °C, while for glaciers and ice caps a range of values of sensitivity was used. The 27cm projection assumes changes in aerosol concentration beyond 1990.

51
intensification of beach erosion combined with the risk of inundation will produce significantnegative economical impacts on the tourism sector. A potential sea level rise of 30-50 cm couldcause nearly all Alexandria’s beaches to disappear [Frihy et al., 1996]. Sea level rise will alsonegatively affect coastal infrastructures such as harbours, coastal roads, tourist installations, coastalindustrial installations, and coastal defence structures.
Figure 24: Percentage of population and areas with different land uses of the city of Alexandria atrisk of inundation with no sea level rise (SL = 0.00 m) and with three sea level rise scenarios (0.25m; 0.50 m; 1.00 m) [adapted from El-Raey et al., 1998a].
Water shortage
Water resources are unequally distributed in the Mediterranean basin. France, Italy, Turkey and theformer Yugoslavia account for 2/3 of the total water resources of the region (825 km3/year). Watershortage and deterioration of water quality already represent serious problems in many southernMediterranean countries. At the catchment level, the rate of water exploitation68 defined as the ratiobetween withdrawn water quantities and available resources is already close to 100 % in Egypt, andeven higher than 100% for Israel and Libya (figure 25). Likewise, the availability of water perinhabitant presents in the basin a strong north-south imbalance. The per capita water availabilityfalls below the threshold values (defined as 1000 m3/yr/per capita) in eight Mediterraneancountries, Israel, Egypt, Malta, Tunisia, Libya, Lebanon, Syria and Algeria, which therefore appearas the most vulnerable to climatic changes [WRI/IIED/UNEP,1997]. With rapid population growth,the per capita availability is expected to be further reduced. It is predicted by 2025 that only France,Italy, states of the former Yugoslavia, Greece and Turkey would exceed the threshold of per capitawater availability (table 15).
It is reasonable to believe that climate changes will exacerbate the problems of water stress andshortage. Higher temperatures and variation of rainfall intensity and frequency, as well as changesin evapotranspiration and soil moisture will influence the magnitude and timing of runoff, floodsand droughts. In arid and semi-arid areas a temperature growth will greatly increase the amount of
68 Also known as the exploitation index
0
20
40
60
80
100
SL = 0.00 m SLR = 0.25 m SLR = 0.50 m SLR = 1.00 m
Population Beaches Residential areas
Industrial areas Services Tourist areas
Urban areas Wetland Bare soil

52
water which will evaporate from plants, soils, lakes and rivers, reducing soil moisture and affectinggroundwater recharge. This latter aspect is very important since groundwater reservoirs oftenrepresent the only water supply of arid and semi-arid regions. It has been estimated that a 1-2 °Cincrease in temperature and a 10% decrease in rainfall would diminish the water availability of aridand semi-arid zones by one-half [UNEP, 1993]. Likewise, a 20% decrease in rainfall in theAcheloos basin (Greece) would increase the risk of water system failure (inability to providetargeted supplies) from the present value of less than 1% to 38% [Mimikou et al, 1991].
Figure 25: Exploitation Index in the Mediterranean countries [source: Plan Bleu, 2000]
In case of climate change and sea level rise, water quality and availability will be further threatenedby the decrease in aquifer recharge due to alteration of soil processes and by saline intrusions intofreshwater systems.
Water shortage depends on the ratio of water availability and the scocio-economic demand.Changes in climatic factors in combination with growing population and maladaptive managementpractices of water resources would increase the water demand and consumption, in particular inurban zones and for agricultural purposes. It has been estimated for example that the increase inurban water demand in Crete could increase the probability of water shortage in this nation from20% in 1980 to 85% in 2010 [MEDALUS II, 1996]. On the Mediterranean basin scale, the waterconsumption due to agricultural land irrigation assumes a primary importance. In 1988 this sectoraccounted for the 72% of the annual water consumption, while only 10% was used for drinkingpurposes [Blue Plan, 1988]. It is clear that any factors, including those linked to change in climaticconditions will produce significant negative implications for water availability and consumption, inparticular in the Southern and Eastern countries of the basin.

53
Table 15: Water availability per inhabitant in m3/yr/inhabitant in the Mediterranean countries by2025. The projections consider an average population growth [source: Blue Plan, 1998].
FranceItalyGreeceFormer YugoslaviaLebanonTurkeyAlbaniaSpainCyprus
MoroccoSyriaAlgeriaMaltaIsraelTunisiaEgyptLibya
> 1000 Availabilitym3/year/inhab 500-1000 Water stress
< 500 Water shortage /moderate demand < 500 Water shortage/high demand
Problems associated with the deterioration of water quality can also be expected with an increase ofwater pollution concentrations, due to higher water temperature, reduction of river levels, andpollution by salts. Climate change will clearly increase the severity of problems the wateravailability and supply with some implications in the whole socio-economic system and especiallyon the southern side of the basin, where water shortage is already a limiting factor for development.Mediterranean countries need to improve supply and to increase the efficiency of water use. Thelack of current efficiency is emphasised by the example of the Syrian coastal zones, where it hasbeen estimated that 40% of water supplied is lost through poorly constructed and maintained mains[Greenpeace]. Like wise, implementation of measures to improved irrigation systems, and to adaptagricultural techniques (in particular for crops’ irrigation) to climate change will be required.
Coastal agriculture and fisheries
Agricultural sector has been the focus of interest world-wide by the climate change impactcommunity as it represents a vital economical for many regions. Nevertheless there is a lack ofconsensus about the potential impact and of consistencies in the application of climate changescenarios in agricultural assessment [ECLAT-2,1999].
The total agricultural area of Mediterranean countries represents about 220 millions ha. Littlesurface changes have occurred over the last 30 years (decrease of around 1.36% equivalent to 3millions hectares due mainly to the development of urban infrastructures) [Bindi and Olesen, 1999].In the Mediterranean coasts intensive agriculture is limited by topographic characteristics and tendsto concentrate in the alluvial plains [EEA/UNEP, 1999a]. Yields, in particular those concerningcereals, are generally limited by water availability and heat stress conditions. However, theagricultural production of the basin is important in terms of economic revenue and foodconsumption. The main crops are cereals, olives, grapes, and fruit.
Increase in the concentration of CO2 and variations in climatic conditions can directly affectMediterranean agriculture. Higher CO2 concentrations may stimulate the plant productivity and

55
produce benefits on yield quantity and affect yield quality in a way depending on the type of crop.Under controlled conditions, the doubling of present day CO2 levels can produce an increase in the
yields of C3 plants (wheat, rice, soybean) of about 30% [Rogers and Dahlman, 1993]. However,there is no certainty about crop responses in real conditions. Besides the benefits, it is very likelythat climate changes will negatively affect agriculture in various ways. An increase in temperaturewill enhance plants respiration and reduce their growing season. Rainfall reduction would beresponsible for moisture stress, particularly during the summer season, with negative effect on cropdevelopment, such as in the case of maize, soybean and wheat [Bindi and Olesen, 1999]. In generalthe response of crop production will depend on the type of crop and the specific agricultural site.However, yields of major crops are expected to decrease in Northern Africa and in the Middle East[Fischer et al. 1994]. In particular some studies suggest sharp decreases in yield for wheat andmaize in four sites along the Nile by 2050 [El-Shaer and al.1997]. Decrease of yield for Maizecould also affect Euro-Mediterranean countries such as Greece and Spain due to reduced duration ofthe growing period [Kapetanaki and Rosenzweig, 1997].
Indirect impacts of climate changes on agriculture include proliferation of pest and diseases anddecrease in the availability of water. Indeed higher temperatures could facilitate the spread of insectpests as a consequence of a longer growing season and of more favourable conditions for theirsurvival. Besides producing direct negative impacts on plant productivity, decrease in wateravailability could have other consequences in some regions of the Mediterranean basin, such as agrowing demand of water for crop irrigation (with a peak in the dryer season), an increase in therisk of soil salinisation and a consequent decrease in soil fertility. All these impacts can furtherincrease water stress conditions for crops. Other indirect impacts on coastal agriculture include:agricultural land inundation due to sea level rise, increased fire risks, increased soil degradation anderosion.
Response measures and policies are necessary to mitigate or avoid negative climate change impactson agriculture and to exploit possible positive effects. Likely changes in climatic conditions areconsidered to be sufficiently gradual to be counteracted by adequate response measures. Economicand agronomic adaptation strategies include: changes in crops and crop varieties, improved watermanagement and irrigation schemes, changes in planting schedules prevention of soil erosion andprotection of soil fertility [IPCC, 1995]69.
In the planning of mitigation strategies, it is important to consider that impacts on agriculture willprobably be more significant in the southern and eastern regions of the Mediterranean basin whichare characterised by more traditional crops. As a general indication table 16 reports the differenteffects of climate change on cereal production in developed and developing countries at the globalscale. These data can only been interpreted as an example of the different response to climatechange of agriculture existing between these two categories of nations. In these areas, problems ofwater shortage would be worsened by higher inter-annual variability of precipitation and increase inthe frequency of extreme events, such as droughts, which will make the implementation of responsemeasures more difficult.
The combination of population growth and changes in land use as well as water related problems(such as increase in the domestic water consumption) would produce significant impacts on theagriculture of these countries. The vulnerability of the overall economy of Southern and EasternMediterranean countries to impacts affecting agriculture will be particularly elevated, since in thesenations agriculture represents the most important economic sector and the basis of the national foodsecurity. On the contrary, the economy of other countries, in particular European ones (with the
69 p 449

56
exception of Albania) will be much less threatened by negative effects of climate change on thisspecific sector (figure 26).
Figure 26: Contribution of the agricultural activities to the economy of Mediterranean countries (%)[adapted from Bindi and Olesen, 1999].
Table 16: Change in cereal production under 3 different equilibrium GCM scenarios (percent frombase estimated in 2060) [source: Rosenzweig and Parry, 1994].
Regions GISS70 GFDL71 UKMO72
GlobalClimate effects only -10.9 -12.1 -19.6Plus physiological effect of C02 -1.2 -2.8 -7.6Plus adaptation level 1 0.0 -1.6 -5.2Plus adaptation level 2 1.1 -0.1 -2.4
DevelopedClimate effects only -3.9 -10.1 -23.9Plus physiological effect of C02 11.3 5.2 -3.6Plus adaptation level 1 14.2 7.9 3.8Plus adaptation level 2 11.0 3.0 1.8
DevelopingClimate effects only -16.2 -13.7 -16.3Plus physiological effect of C02 -11.0 -9.2 -10.9Plus adaptation level 1 -11.2 -9.2 -12.5Plus adaptation level 2 -6.6 -5.6 -5.8
Note: Adaptation level 1 includes: shifts in the planting date of less than 1 month, additional water for crops alreadyirrigated, and change in crop varieties to different varieties that are already available.Adaptation level 2 includes: in addition, shifts in the planting date of more than 1 month, increase fertiliserapplication, installation of irrigation, and development of new crop varieties
70 Goddard Institute for Space Studies71 Geophysical Fluid Dynamics Laboratory transient model experiment.72 U.K. Meteorological. Office transient model experiment
0
10
20
30
40
50
60
Spai
n
Fran
ce
Italy
Cro
atia
Alb
ania
Gre
ece
Turk
ey
Leb
anon
Isra
el
Egy
pt
Lyb
ia
Tun
isia
Alg
eria
Mar
occo
Employment GDP

57
Climate changes will also exert negative impacts on many marine ecosystems and consequently onliving marine resources. The interrelations between climatic factors and marine productivity arecomplex and the understanding of the potential impact of shifts is limited and often derived fromstudies on a few important commercial species.
Variations in abiotic factors (physical parameters such as winds, currents, salinity) and in bioticfactors (such as food availability and species composition) induced by climate change can have aneffect on fish populations. Water temperature is one of the main parameters affecting the abundanceand distribution of species. Increase in temperature can have a direct negative effect on fish growthand reproduction rate by acting on the fishes physiological processes, and an indirect effect on foodavailability through changes of water biogeochimical processes.
General negative climate change impacts on fish stocks and fishing can be induced by:
r Variations in physical and chemical parameters of water;r Degradation and loss of coastal habitats and nursery areas (sea-grass meadows, wetlands) due to
increased erosion and direct impacts exerted by change in climatic conditions;r Increase in the frequency of alga blooms,r Increase in UV-B radiation;r Intensification of eutrophication process in some areas;r Increase in the diffusion of allochthonous species, in particular through Lessespsian migration,
due to change in various variables - such as temperature and salinity - which can negativelyaffect the ecological balance of ecosystems and inter species relations.
On the global scale, climate change is not expected to generate significant variations of fish stocks,whereas on regional and local scales relevant changes could occur [IPCC, 1996b]73. The mostimportant effects are expected to affect species distribution, inter species relations (predation andcompetition), and reproduction patterns [Murawski, 1993]. As a response to changes in temperature,salinity and other chemical-physical parameters, fish species are likely to migrate towards morefavourable habitats, producing consequent impacts on regional fishing practice and techniques.Mediterranean fish stocks are already in critical conditions because of over-fishing (the overallincrease of total marine catches by Mediterranean countries has been of 17.5% between 1984 and1996 [UNEP/EEA, 1999b]) and human perturbation (pollution, eutrophication, loss of habitat). Thefishing industry will probably experience little additional stress due to climate change impacts[Jeftic et al., 1996b]. However, fishing production could be particularly affected in some specificecosystems, such as shallow water areas, coastal lagoons and estuaries as a consequence of theincrease of water salinity and temperature [Wood and McDonald, 1997].
There have not been significant changes in fishing techniques in the Mediterranean during recentyears [UNEP/EEA 1999]. Climate change impacts on marine fisheries productivity will depend onthe capacity to improve and adapt the existing techniques and to change current managementpractices of fish stocks, as well as to reduce fleets conflicts, competitive usage and negativeimplications of fishing on the natural environment. This could include the acquisition of newdevices and equipment for detecting fish, of larger boats with an increased fishing capacity infarther and deeper waters, and new fishing equipment [Baric and Gasparovic, 1992].
73 p.7

58
Climate change impacts on human health
Both direct and indirect climate change impacts on human health can be identified. It has beenestimated that in the long term, indirect effects will have greater repercussions on health than thoseacting in a direct manner [IPCC, 1996b]74.
q Direct effects include the increase in heat-related illness (mainly cardio-respiratory diseases)and mortality and the effects associated with extreme events and weather disasters, such asdeaths and injuries of people as well as damage to health care infrastructures. Coastal floodingcan have serious consequences on human health.
q Indirect effects consist mainly in the potential increase of transmission of vector-borneinfectious diseases, such as malaria, dengue, yellow fever and some viral encephalitis. Thisincrease could be caused by the spreading of suitable conditions for vector organisms inducedby change in climatic variables, such as temperature or humidity. Furthermore, maturation ofsome infectious parasites (for example those implicated in malaria) could be accelerated. As faras malaria is concerned, 45% of the world’s population presently lives in areas characterised byclimatic conditions which permit the transmission of the disease by mosquitoes. Globalwarming could enlarge the geographical area where malaria would be potentially transmitted.As a consequence of a 3-5 °C temperature increase by the year 2100, the total population livingin a potential malaria transmission region would grow to 60% of the world population [IPCC,1998]75. Evidence of current changes in the prevalence or distribution of pathogens and theirvectors in the Mediterranean has been identified by Jackson [1995]. He has considered theresurgence of Mediterranean spotted fever in Spain and Italy, as a sign of climate-relatedchanges.
q Warm temperatures can increase air and water pollution, which in turn harm human health.Temperatures directly control chemical reactions that produce urban smog (i.e. troposphericozone). Further indirect effects on human health include the increase in the cases of asthma,allergies and cardio-respiratory problems caused by the intensification of pollen and sporesproduction or the enhancement of the persistence and respiratory impacts of certain pollutants.A striking example is what occurred in Athens during the summer 1973, where an anomalousheat wave combined to atmospheric pollution was responsible of respiratory problems for morethan thousand persons [WHO/UNEP, 1995].
The capacity to implement planned response strategies and mitigation measures to the impactsimposed by climate change generally depends on the availability of technical and economicalresources. This is also true in the case of the human health sector. The general lack of resources andthe present poor health conditions of Northern Africa and Middle-East Mediterranean countriesimplies major risks in the health sector for these nations. As in other sectors climate change is thenlikely to increase the present gap in the quality of human health between richer and poorer countriesof the basin [WRI/IIED/UNEP, 1989].
3.2.3 The UNEP/MAP site-specific studies
In 1987 the UNEP’s co-ordinating unit for the Mediterranean Action Plan (MAP) launched, withina wider international programme, an important series of site-specific studies, concerning theanalysis of the potential impacts of climate change in the Mediterranean basin [UNEP, 1989b; 74 pp. 37-3975 p. 7

59
Gabrielides, 1998]. The aim of the various studies was to identify the economic, social andenvironmental problems which already exert stresses on coastal zones of some specific sites of theMediterranean, as well as to assess the potential impacts induced by climate change and sea levelrise. Moreover these studies sought to identify the most vulnerable areas and systems and to suggestsome possible response measures and policy options that could be implemented in order to mitigateor avoid the negative impacts induced by climate change. Different site-specific case studies havebeen addressed because significant differences in the magnitude and distribution of impacts ofclimate change are expected to occur within the Mediterranean. Until now fourteen sites have beenstudied in the UNEP/MAP project. The first six, labelled as ‘first-generation’ site-specific studiesinclude the Ebro Delta, the Rhone Delta, the Po Delta, the Nile Delta, the Thermakois Gulf and theLakes Ichkeul/Bizerte. The second five as ‘second generation’ site-specific studies76 include theCres/Losinj Islands, the Kastela Bay, the Rhodes Island, the Syrian coast and the Malta Island. Thelast three as ‘third generation’ site-specific studies77 include the Albanian coast, the Fuka-Matrouhregion in Egypt and the Sfax coastal area in Tunisia. Further five case studies are in the process ofbeing developed in Morocco, Algeria, Israel, Lebanon and Malta. A more detailed description of thefirst and the second generation case studies and of the methodology used is contained in Jeftic et al.[1992, 1996a]. An overview of the methodology adopted and of the results achieved in the analysisof the implemented case studies is contained in Gabrielides [1998] and Gorgas [1999]. The mainlikely impacts identified in the studies are briefly summarised in tables 17.
Comparative analysis of the case studies led the authors [Jeftic et al., 1996b] to draw someconclusions:
r The most likely impacts of climate changes and sea level rise common to the studied deltaiczones and to the Thermakois Gulf are: increased erosion, increased flooding, inundation ofcoastal flatlands, loss of wetlands and salinisation of lagoons and coastal lakes. Factors that willcontribute in determining these effects are: relative sea level rise, decreased water and sedimentflows from rivers, and increased frequency and intensity of storm event and waves. Theseimpacts are also common to other studied areas.
r Salinisation of aquifers due to sea level rise could be another widespread impact, which willparticularly affect the studied islands, Kastela Bay, Sfax region and the Syrian and the Albaniancoasts. Salinisation of aquifers, which are important water resources, will contribute toaggravating the water shortage problem that is already experienced by many Mediterraneancountries.
r The studies have identified some impacts that will affect specific components of the coastalsystems and that will add further stress to the threatened areas. The negative impacts will affect:
76 The impacts analysis of climate change in the second and third generation site-specific studies was based on theregional (covering the Mediterranean basin), sub-regional and local scenarios for future climatic conditions developedby the Climatic Research Unit of the University of East Anglia (CRU/UEA) [Palutikof et al., 1992]. These scenariosexpress variations of temperature and rainfall conditions at a sub-regional and a local scale as a function of globaltemperature change. In the case of the ‘second generation’ studies, the projections adopted by the Second WorldClimate Conference were considered as the global scenario of reference. This scenario foresaw an increase intemperature of 2-5 °C, and a sea level rise of 65 ± 35 cm by the end of the 21st century [UNEP/ ICSU/WMO, 1990]. Forthe purposes of the ‘second generation studies’, the global scenario was modified by the sub-regional and localscenarios developed by CRU/UEA and by the available information on relative local sea level rise trends.
77 In the ‘third generation case studies’ a similar methodology was adopted. The 1992 IPCC projections of globaltemperature increase (0.3 °C per decade e.g a temperature increase of 0.9 °C 2030 and 2100 of and 2.5 °C respectively)[IPCC, 1992]77, were modified by the sub-regional and local scale scenarios prepared by CRU/UEA. A global sea levelrise of 16 cm by 2030 and 48 cm by 2100 was assumed on the basis of Wigley and Raper’s analysis [Wigley and Raper,1992], as modified by available information on local relative variation of the sea level.

60
agriculture, aquaculture and fisheries, coastal infrastructures and harbour installations (such asin Alexandria and Port Said in Egypt or La Golette-Tunis in Tunisia), coastal defence systems(such as in the deltas of Po or Nile) and important historic and artistic places (such as Veniceand Rhodes).
r Impacts which are not specific to coastal zones, but typical of Mediterranean areas have beenidentified. They represent in many Mediterranean countries exacerbation of existing problems:increased soil erosion and decreased soil fertility (for example in the islands of Rhodes andMalta, in the Thermaikos Gulf, in the Fuka-Matrouh region or in the Syrian coast), increasedrisk of forest fire (for example in Rhodes or in the Cres-Losinj islands) and negative impacts onagriculture due to the projected increase in the intensity and frequency of extreme events, aswell as reduced rainfall, increased evapotranspiration and reduced soil moisture.
Table 17. Potential impacts induced by climate change on fourteen Mediterranean coastal areasidentified in the UNEP/MAP studies [sources: Jeftic et al., 1996b; Gabrielides, 1998].
Delta of EbroSpain
increased coastal erosion; reshaping of coastline; loss and flooding of wetlands; reduced fisheries yield.
Delta of RhoneFrance
erosion of unstable and threatened parts of coastline; reduction of wetlands and agricultural land;increased impact of waves; increased salinisation of coastal lakes; destabilisation of dunes; intensifiedtourism.
Delta of PoItaly
increased flooding and high water events; increased coastal erosion; retreat of dunes; damage to coastalinfrastructure; salinisation of soils; alteration to seasonal water discharge regimes; reduced near-shorewater mixing and primary production; increased bottom water anoxia.
Delta of NileEgypt
increased coastal erosion; overtopping of coastal defences and increased flooding; damage to port andcity infrastructure; retreat of barrier dunes; decreased soil moisture; increased soil and lagoon watersalinity; decreased fishery production.
Ichkeul-Bizerte LakesTunisia
increased evapotranspiration leading to decreased soil moisture; reduced fertility and enhanced salinity;increased salinity of the lakes and shift to marine fish fauna; reduced extent of wetlands and loss ofwaterfowl habitat.
Thermaikos GulfGreece
inundation of coastal lowlands; saline water penetration in rivers; drowning of marshland; increased seawater stratification and bottom anoxia; decreased river runoff, salinisation of groundwater, decreasedsoil fertility; damage to coastal protective structures; extension of tourist season.
Island of RhodeGreece
increased coastal erosion; salinisation of aquifers; increased soil erosion.
Maltese IslandsMalta
salinisation of aquifers; increased soil erosion; loss of freshwater habitats; increased risk for humanhealth; increased risk for livestock and crops from pathogens and pests.
Kastela BayCroatia
inundation of Pantana spring and Zrnovica estuary; increased salinisation of estuaries and groundwater;negative impact on coastal services and infrastructure; accelerated deterioration of historic buildings;increase in domestic, industrial and agricultural water requirements.
Syrian coastSyria
increased soil erosion; modification of vegetation cover due to increased aridity; increased salinisation ofaquifers; erosion of beaches and damage to coastal structures and human settlements due to exceptionalstorm surges.
Cres-LosinjCroatia
increased salinisation of lake Vana; extension of tourist season; increased risk of forest fire.
Albanian coastAlbania
salinisation of coastal aquifers and shortage of adequate quality drinking water; soil erosion; extension ofsummer drought; extension of tourist season.
Fuka-MatrouhEgypt
increased evapotranspiration and decreased rainfall; extension of summer aridity; increased coastalerosion; flooding in the eastern part; decreased soil fertility.
Sfax coastal areaTunisia
salinisation of ground water; increased rainfall; possible flooding.

61
r Significant impacts will affect the coastal flora and fauna through direct and indirect effects. Forexample, in the case of the Ichkeul-Bizerte lakes and of large deltaic areas, it is possible toforesee a considerable shift from the present fresh and brackish-water vegetation and animalcommunities to communities composed by species which are more typical of marineenvironments. This shift, together with the retreat of wetlands, will affect migratory birds.Mediterranean wetlands and coasts are in fact very important over-wintering and transit areasfor many bird species.
r Some positive impacts have been hypothesised. Tourism would benefit from a longer touristseason (e.g. Perry, 1999). In some cases, for example the delta of Ebro and the Cres-Losinjarchipelago, a positive influence can be foreseen for agriculture and aquaculture, if appropriatemeasures are taken into consideration.
3.2.4 Climate change impacts on the Mediterranean islands
Islands are generally considered vulnerable to sea-level rise due to significant socio-economicdependence (settlements, tourism, agriculture) on coastal zones. Increase beach erosion andworsening of water shortage situation are expected to be the most important climate change impactsaffecting Mediterranean islands.
Beach erosion is particularly harmful because it can undermine the tourism industry which is oftenthe basic economic activity like in the case of Cyprus where tourism generates 18% of the nationalGDP [UNEP/EEA, 1999a]. Likewise, an increase in evaporation and a decline in mean summerprecipitation, which according to some authors [Wigley, 1992; Palutikof et al., 1996] can beexpected in some Mediterranean areas, could create serious problems of availability of adequatewater supply and of water resources management, particularly in Malta and Cyprus. The increase insaltwater intrusion into groundwater reservoirs due to sea level rise can represent a synergetic factorwhich is likely to exacerbate water shortage problems. A 1 m sea level rise could for examplereduce water reservoirs in Malta by 40% [Attard et al., 1996]. With regards to the expected increasein water demand, in Crete water demand for urban consumption could increase the probability ofwater shortage in 2010 by fourfold [MEDALUS II, 1996].
Cyprus can be considered as an example of a Mediterranean island which will particularly sufferfrom climate change and sea level rise impacts. The Cyprus coastline is 784 km long and presentssensitive areas such as sand-dune systems, banks of shingle, cliffs, and coastal wetlands subject tointense human pressures. Georgiades [1998] has qualitatively identified the following likely climatechange impacts for the island of Cyprus which will add to current human pressure (due to touristinfrastructure development, urbanisation, industrial and port development, and development of roadinfrastructures) on coastal zones:
r Physical impacts on the historical and cultural heritage of the island due to sea level rise;r Impact on agriculture through changes in the precipitation pattern, increased competition
between weeds and agricultural crops, reduced soil moisture;r Potential eutrophication of the sea environment and consequent impact on fishery;r Negative impacts on aquaculture due to higher water temperature, increased drought frequency,
enhanced wave action and sea level rise;r Exacerbation of water shortage as a result of drier conditions and enhanced saltwater intrusion
into the largely depleted groundwater system;r Increased erosion of coastal systems, in particular of beaches;r Reduced effectiveness of existing coastal defences;

62
r Negative impacts on coastal infrastructures and installations as well as on the central seweragesystem and major roads;
r Aggravation of desertification problems and increased soil salinisation;r Negative impacts (not yet well identified) on important natural systems such as turtles’ breeding
areas and coastal wetlands of the Akrotiri lake, the Phasouri marsh and the Larnaka salt lake;r Negative impacts on tourism due to excessive heat and sudden spells of heat waves as well as
reduced water supply and disruption of beaches
According to Nicholls and Hoozeman [1996], the relative sea level rise (taking into considerationthe counteract effect of natural uplift) in Cyprus will be on the order of 0.4-0.5 m by 2100. Theresulting shoreline retreat is likely to range according to the Brunn rule between 40 to 100 metresand could be locally higher as a consequence of possible changes in waves characteristics (forexample due to the increase in storm frequency) and changes in river discharges. The catchmentregulation and management have already reduced sand supplies in a consistent way for the coastand beaches nourishment increasing the vulnerability to erosion processes of beaches [Nicholls andHoozemans, 1996]. In order to sustain the Cyprus vital tourist industry, adoption of retreat andprotection strategies for coasts are necessary: for instance the beach area should be protected andmaintained by erecting hard structures, enforced building set backs and using artificial sandnourishment.

63
CONCLUSIONS
Climate change is likely to affect coastal systems through the variation of mean sea level,precipitation patterns, sea hydrodynamics (wave height and direction, currents, tides), water salinityand temperature, frequency and magnitude of extreme events (such as floods and storms). Themajor impacts of climate change on Mediterranean coastal zones include increased erosion - inparticular on currently threatened and unstable coastlines - permanent inundation of low-lyingcoastal areas, increased risk of flooding, loss of wetlands, increased saltwater intrusion intofreshwater systems, changes in ecological parameters and consequent effect on marine populations.Mediterranean coasts will also be affected by other impacts which are not limited to coastalsystems, such as the intensification and expansion of the desertification process, soil degradationand increased risk of fire.
It is likely that climate change and sea level rise will, rather than generating new impacts, affectMediterranean coasts through the exacerbation and expansion of existing critical problems due toincreasing human pressures such as rapid urbanisation, development of tourist facilities andindustries, and overexploitation of marine resource. In both the short and medium term (the nextfew decades) Mediterranean coasts will probably experience greater stresses produced by non-climatic factors such as population growth, intensification of tourism, poor land and watermanagement, resources overexploitation, urbanisation, coastal infrastructure development. Highpopulation densities and overexploitation of coastal resources have already made some sensitiveareas particularly vulnerable to hazards - such as storm surges, permanent inundation, and droughts-and exposed human activities and settlements to significant impacts, which could be exacerbated byclimate change. This is particularly evident in the case of human expansion into or intensemodification of fragile ecosystems (for example the Nile delta) or marginal land, such as arid andsemi-arid zones (for example marginal lands close to Alexandria). Nevertheless, the negativeimpacts of climate change will probably be more significant on the coastal zones in the medium andlong term.
The most vulnerable systems are considered to be those with the greatest sensitivity and the lowestadaptability to climate change effects, such as wetland areas (for example the Camargue or thelagoon of Venice), large deltas (Nile, Po, Ebro, Rhone), small islands (for example Rhodes andMalta), low-lying coastal areas, sandy coasts and arid or semi-arid lands. In addition, socio-economic implications of the impacts of climate change on coastal zones will be particularly severein the context of coastal infrastructures, harbour installations, historic sites, water availability andmanagement, agriculture, tourism and fisheries. Climate change and the impacts of sea level rise areexpected to be more severe in the southern and eastern regions of the Mediterranean basin, whoseadaptability is generally limited by weaker economic and institutional conditions as well as bypoorer availability of financial, technological resources. In these regions, the more affectedeconomic sectors are expected to be the agriculture and the water resources management. Indeedagriculture is increasingly unable to satisfy food demand and water availability is oftendeteriorating. Climate change could exacerbate these trends and lead to social problems anddisruption.
It is recognised that an immediate cut in global greenhouse gas emissions would not preventcompletely but rather delay climate changes and resulting impacts because of the inertia of naturalsystems in response to change in CO2 concentrations [DETR, 1999]. That underlines theimportance of combining efforts to control greenhouse gas emissions, which is a priority, withefforts and strategies to minimise damage. International agreement on emissions reduction whichsets significant targets with regards to climate change prevention appears at the moment to be

64
impossible. International prevention strategies must then be accompanied by the definition andimplementation of adaptation actions and policies at the regional, sub-regional and local levels,which can mitigate, or in some successful cases eliminate, the negative impacts induced by climatechanges. Adaptation strategies can be useful to respond both to present-day climatic variability (inparticular extreme events, such as drought and storm surges), and to longer term changes producedby the greenhouse effect, not only in climatic variables but also in associated environmental andsocio-economic factors. As an example, table 19 reports some possible adaptation measures whichcan be implemented in response to some key climate change and sea level rise impacts for theMediterranean basin. In terms of adaptation, the first step is generally represented by the resolutionor at least the mitigation of existing critical problems. The latter are often the result of strong humanpressures and of a cumulative set of inappropriate practices such as development in hazardous zonesand sand mining and which limit the flexibility and adaptability of a considered system in the faceof climate change. They have been called ‘maladaptation’ by Burton [1996] and are defined ashuman interventions and their effects which are capable of significantly reducing natural coastalsystem’s adaptability and resilience.
The impacts of climate change and vulnerability assessment and the definition of adequateadaptation measures should be included in the broader scheme of Integrated Coastal ZoneManagement (ICZM). ICZM allows an analysis of the effects of pressures and stressing factors oncoastal systems, including climate change and sea level rise, and of their interrelations [EC, 1999].Furthermore, ICZM, is increasingly recognised as the best way to deal with current and long termcoastal problems [WCC, 1993]. The implementation of an ICZM scheme and the realisation ofclimate change adaptation measures not only requires a relevant change of perspective (long termrather than short term; prevention rather than emergence, integrated approach rather than sectoralinterventions) but, at least in some national contexts, radical modification of institutions, legal andregulatory aspects and socio-economic development plans. Given the political, cultural, economicand social differences existing within the Mediterranean basin, international co-operation and thetransfer of technology and know-how are extremely important in order to allow a sustainable futurefor the whole region.
In this context, scientific communities are important in order to provide decision makers withscientific support. As regards climate change impacts assessment, it emerges from the analysisconducted that the spatial scale of the studies should be narrowed down to the sub-regional andlocal level. The quantification of main impacts is a difficult task which requires the modelling of theinterrelations between climatic changes and sea level variations, and of potential effects on naturaland human sub-systems. Efforts should be concentrated on the elaboration of future local reliablescenarios which describe how critical parameters will change in future. Nevertheless, the reliabilityof current scenarios are limited by the uncertainty which increases moving from a global to aregional, a sub-regional or a local scale. Regional and local studies are also constrained by otherfactors, such as the greater natural variability of climatic conditions at these scales; the non-uniformdistribution of atmospheric aerosols and of its ‘cooling’ effect; and the influence on the climatesystem exerted by variations in local characteristics, such as those concerning land use.
Not only climate change and sea level rise scenarios are required. According to Klein and Nicholls[1998; 1999] since vulnerability is a multi-dimensional concept which embraces biogeophysical,economic, institutional, and socio-cultural factors, it is important to generate various scenarioswhich can be grouped in four classes: scenarios of climate-induced change in environmentalvariables (e.g. sea level, rain and temperature pattern), scenarios of non climate-induced change inenvironmental variables (e.g. vertical land movement), scenarios of climate-induced change insocio-economic variables (e.g. autonomous and planned adaptation), scenarios of non climate-induced change in socio-economic variables (e.g. population, land use). In addition, it is important

65
to consider a wide spectrum of scenarios which are able to include in the evaluation process theuncertainty of the future. Since at the moment our knowledge on future climate change scenariosare far from definitive, it is very important that defensive and mitigation structures are projected tobe flexible and to function in a wide range of options (for example different values of sea level,frequency of intense rain events or length of dry spells). A gradual evolution of the vulnerabilitystudy which, as suggested by Klein and Nicholls [1998], is firstly performed through a screeningassessment, secondly through a vulnerability assessment and finally through a planning assessmentshould also be considered. In the perspective highlighted above, the final vulnerability and planningassessments should be included in a wider ICZM scheme.
Table 19: Key Impacts Possible adaptive measures [adapted from WISE, 1999 and Gabrielides,1998].
Sectors Key Impacts Possible adaptation measures
Water q Variability of water supplyq Prolonged summer season droughtq Reduction of water availability from aquifer
and surface resourcesq Increased uncertainty in the planning of water
resources managementq Increased flood risk from rivers and streamsq Deterioration of water quality
• More flexible planning of water resource management• Improvement of the efficiency of supply networks• Investment in increased supply (reservoirs) and transfer
options (pipelines)• Improvement of irrigation schemes• Investment in improved waste water/ storm flow
management• Investment in leakage reduction• Improvement of flood plain/ river catchment
management
Coastalzones
q Increased flood risk from the sea (due to SLRand increased frequency of storm surgesevents)
q Change in flood return periodsq Permanent inundation and consequent loss of
land (coastal habitats, in particular wetlandsand dunes)
q Saltwater intrusion into freshwater systemsq Change in sea water temperature and salinityq Change in river discharges into the seaq Increase in algal blooms frequency and
consequent intensification of associated healthand environmental impacts
q Increased coastal erosion
• Elaboration of climate change scenarios and theirintegration into coastal management plans
• Improvement in the prediction of extreme eventsoccurrence (such as storm surges or intenseprecipitation)
• Managed retreat where coastal development is not toodense
• Elaboration of flood monitoring system and mapping ofhigh risk areas
• Readjustment of present flood defence• Plantation of suitable protecting plant species in coastal
zone• Protection and artificial sand nourishment of beaches• Hard engineering intervention for the protection of
coasts, where no other options are possible• Definition of Integrated Coastal Zones Management
Plans, in particular through the collaboration betweendifferent local stakeholders

66
Ecology q Loss and deterioration of designated protectedareas
q Loss of habitat (for example salt marshes anddunes)
q Change in ecological parameters (such astemperature, salinity, availability of nutrients,etc.)
q Change in species composition anddistribution
q Introduction of marine alien species (inparticular through the Canal of Suez)
q Increased fire risksq Water quality related impacts, such as
intensification of eutrophication and toxicblooms of algae
• Re- evaluation of designated protected areas anddefinition of new strategy for the protection of relevantecosystems
• Planning of new reserves and wildlife corridors betweenfragmented habitats
• Changes in scale and type of habitat management• Investment in and application of measures against forest
fire (monitoring, mapping of high risk areas, prevention)
Agriculture q Decreased water availability and quality – inparticular in the southern basin - as a result oflower precipitation, higher temperature andevapotranspiration rates, increased droughtfrequency and salt water intrusion.
q Increased soil erosionq Soil salinisationq Livestock stress as a result of hotter summers
and decreased water availabilityq Increase in pest and disease outbreaksq Increased yields and new agricultural
opportunities in some specific regions
• Adoption of better adapted crop varieties• Development of new adapted crop varieties, for example
with greater drought resistance or delayed maturity• Adoption of better adapted animal breeds• Monitoring of crop responses to change in climatic
conditions• Adoption of techniques which allow the protection from
and prevent of soil erosion• Physical protection of coastal agricultural land from sea
level rise and storm surge• Continued monitoring of plant pests and disease and
development of reliable forecasting systems.• Development of weed, pest and disease control strategies
and techniques• Development and adoption of appropriate and low- cost
water conservation and water- efficient irrigationmethods
Health q Direct impacts due to changes in meantemperature, precipitation and air circulation
q Impacts due to change in the frequency anddistribution of extreme events and weatherdisaster
q Increased risk of food related diseasesq Increased risk of waterborne diseasesq Increase risk of malariaq Increase in heat related deaths and illnessesq Increase in the incidence of illness related to
air pollution
• Strengthening of public health defences• Strengthening of infectious disease surveillance
programmes, which also take into account climaterelated issues and the spreading of new diseases
• Training of health professionals in the specific field ofclimate related disease
• Health education in order to reduce exposure to heatstress
• Development of heat early warning systems• Promotion of food hygiene related issues

67
REFERENCES
ACACIA, 1999: Assessment of the potential effects of climate change in Europe, ACACIA project,Second draft, Jackson Environment Institute, London.
Agnew, M.D and Palutikoff, J.P. 1999: GIS-based downscaling of climate model data for theMediterranean using terrain variables. Submitted to climate research.
Antonielli C. R., Improta S. and Riggio S.1999: Dendropoma Lower Intertidal Reef Formationsand their Palaeoclimatological Significance, NW Sicily. Mar. Geol.161, pp.155-170.
Astraldi M.F., Bianchi C.N., Gasparini G.P. & Morri C., 1995: Climatic fluctuations, currentvariability and marine species distribution: A case study in the Ligurian Sea (north-westernMediterranean). Oceanol. Acta, 18:139-149.
Attard, D.J., Axiak V., Borg S., Borg S.F., Cachia J., De Bono G., Lanfranco E., Micaleff R.E.and Mifsud J., 1996: Implications of expected climatic changes for Malta. In Climate change andthe Mediterranean, volume 2 [Jeftic, L., S. Keckes, and J.C. Pernetta (eds)]. Edward Arnold,London, UK, pp. 322-430.
Baarse, G., 1995: Development of an operational tool for global vulnerability assessment (GVA):update to the number of people at risk due to sea level rise and increased flooding probabilities.CZM-Centre publication, n. 3, Rijkswaterstaat, The Hague, The Netherlands.
Bakun, A., 1996: Patterns in the Oceans. The California Seagrant Pub. CIB, Mexico.
Bard, E. Hamelin, B. Arnold, M. Montaggioni, L. Cabioch,G. Faure, G. Rougerie, F. 1996:Deglacial sea records from Tahiti coral and timing of global meltwater discharge. Nature 382, 241-244.
Baric and Gasparovic, 1992: Implications of Climate Change on the Social-Economic Activitiesin the Mediterranean Coastal Zones In Climate change and the Mediterranean [Jeftic, L., J.D.Milliman, and G. Sestini, (eds)]. Edward Arnold, London, UK, pp. 428-494.
Barrow, E., and Hulme M., 1995: Construction of regional scenarios. In Climate change andagriculture in Europe. Assessment of impacts and adaptations [Harrison, R.A., R. Butterfield andT.E. Downing (eds.)]. Research Report, n. 9, Environmental Change Unit, University of Oxford,UK, pp. 21-30.
Ben Jannet-Allal Houda 1999: Mitigation Policies and Measures in the Energy and IndustrySectors in the Mediterranean Countries paper presented at the international workshop on “Theimpacts of climate change on the Mediterranean area: Regional scenarios and vulnerabilityassessment., Venice, 9-10 December 1999
Béthoux, J.P., Gentili B., Raunet J., Talliez D., 1990: Warming trends in the westernMediterranean deep water. Nature, 347, pp. 660-662.
Béthoux, J.-P. and Gentili, B. 1996: The Mediterranean Sea, coastal and deep-sea signatures ofclimatic and environmental changes. J. Mar. Systems, 7:383-394.

68
Bethoux J. P., Gentili B. and Tailliez D. 1998: ‘Warming and freshwater budget change in theMediterranean since the 1940s, their possible relation to the greenhouse effect’. Geophysical Res.Let., 25:1023-1026.
Bird, E.C.F., 1993: Submerging coasts: The effects of a rising sea level on coastal environments.John Wiley, Chichester, UK.
Bindi M. and. Olesen J. E 1999: Climate change impacts and adaptation for agricultural land usein the Mediterranean regions paper presented at the international workshop on “The impacts ofclimate change on the Mediterranean area: Regional scenarios and vulnerability assessment.,Venice, 9-10 December 1999.
Blue Plan, 1988a: Futures of the Mediterranean Basin: Environment Development 2000-2025,Sophia, Antipolis.
Blue Plan, 1998b: a Blue Plan for the Mediterranean Peoples – from ideas to action. Nice, Francepp 32.
Broadus, J, Milliman S., Edwards D., Aubrey D.G., and Bable F., 1986: Rise in sea level anddamming of rivers: possible effects in Egypt and in Bangladesh. In Effects of changes instratospheric ozone and global climate, volume 4 [Titus, J.G., (ed)]. U.S. Environmental ProtectionAgency and UNEP, Washington DC, USA, pp. 165-189.
Brown, B.E., and Suharsono, 1990: Damage and recovery of coral reefs affected by El Nino-related sea water warming in the Thousand Islands, Indonesia. Coral Reefs, 8, pp. 163-170.
Brown, B.E., and Ogden J.C., 1993: Coral Bleaching. Scientific American, 268, pp. 64-70.
Brown, L.R., Flavin C., and Kane H., 1996: Vital Sign 1996. W.W. Norton, New York, USA, pp.68-69.
Burton, I., 1996: The growth of adaptation capacity: practice and policy. In Adapting to climatechange: an international perspective [Smith, J. B., N. Bhatti, G.V. Menzhulin, R. Benioff, M.Campos, B. Jallow, F. Rijsberman, M. I. Budyko, and R. K. Dixon (eds.)], Springer-Verlag, NewYork, USA, pp. 55-67.
Camuffo, D., 1993: Analysis of the sea surges at Venice from A.D. 782 to 1990. Theoretical andApplied Climatology, 47, pp. 1-14.
Capobianco, M., 1996a: Impact of climatic change on Po delta, natural change and managementscenarios. In Impact of climatic change on North-western Mediterranean deltas, volume II: thepresent and the future. Report from the final MEDDELT workshop, October, 2-6, 1996, VeniceItaly, pp. 4.29-4.50.
Capobianco, M., 1996b: Meddelt – impact of climatic change on North-western Mediterraneandeltas. In IGBP, Ricerche Italiane, proceeding of the Workshop organised by CNR, Italian NationalResearch Centre, March 25-26, 1996 Rome. Canal & Stamperia ed., Venice, Italy, pp.191-193.
Caputo, M., Pieri L. and Unguendoli M., 1970: Geometric investigation of the subsidence in thePo delta. T.R. 2, CNR, ISDGM, Venice, Italy
69
Carbognin, L., Gatto P., and Mozzi G., 1981: La riduzione altimetrica del territorio veneziano esue cause. Rapporto e studi dell’Istituto Veneto di Scienze, Lettere ed Arti, vol. VIII, pp. 55-83.
Carbognin, L., and Taroni G., 1996: Eustatismo a Venezia e a Trieste nell’ultimo secolo. Attidell’Istituto Veneto di Scienze, Lettere ed Arti, Tomo CLIV (1995-1996), pp. 281-298.
Cazenave A., Dominh K., Gennero M.C. and Brossier C. 1998: Global mean sea level changesfrom Topex-Poseidon and ERS-1, Physics and Chemistry of the Earth,.
Cazenave, A., Dominh K., Brossier C., Gennero M.C., Bonnefond P., Barlier F. and ExertierP., 1998: Mean Sea Level Investigation at Global and Regional Scales From TOPEX/POSEIDON,AVISO newsletter, 6, document available at :http://sirius-ci.cst.cnes.fr:8090/HTML/information/frames/publication/news/news6/som_uk.html
Cecconi, G., 1996: Monitoring Venice lagoon wetlands for relative sea level rise. In IGBP,Ricerche Italiane, proceeding of the Workshop organised by CNR, Italian National ResearchCentre, March 25-26, 1996 Rome. Canal & Stamperia ed., Venice, Italy, pp.203-204.
Cecconi, G., 1997: Venezia e il problema delle acque alte. Il rischio di danno al patrimonio urbanoa causa della crescita relativa del livello del mare. Consorzio Venezia Nuova, Quaderni Trimestrali,anno V n. 2, pp. 23-44.
Charlson, R.J., and Wigley T.M.L, 1998: Aerosol solforici e clima terreste. Le Scienze quaderni,104 [la dinamica del clima], pp. 62-69.
Comitato Nazionale per la lotta contro la desertificazione (National Committee against thedesertification), 1998: Prima comunicazione nazionale alla convenzione delle nazioni unite per lalotta contro la desertificazione nei paesi gravemente colpiti dalla siccità e/o desertificazione, conparticolare urgenza in Africa (UNCCD). Edited by the Italian Ministry of the Environment andENEA (National Body for the Environment and Energy).
Co.Ri.La., 1999: Scenari di crescita del livello del mare per la Laguna di Venezia. Consorzio per laGestione del centro di Coordinamento delle Attività di Ricerca Inerenti il Sistema LagunareVeneziano, vol. 1, November 1999.
Corine Coastal Erosion Project 1998: Corine Coastal Erosion Atlas, Luxembourg, office forOfficial Publications of The European Communities 1998.
Corre, J.J., 1992: Implications des changements climatiques étude de cas: le Golfe du Lion. InClimate change and the Mediterranean [Jeftic, L., J.D. Milliman, and G. Sestini, (eds)]. EdwardArnold, London, UK, pp. 328-427.
Coudert, E. 1989: Aménagement de l’Espace et Régions Cotières Méditerranéennes. Blue Plan,Sophia Antipolis.
Cubasch, U., Von Storch H., Waszkewitz, and Zorita E., 1996: Estimates of climate change inSouthern Europe derived from dynamical climate model output. Climate Research, 7, pp. 129-149.
CVN, Consorzio Venezia Nuova, 1988: Nuovi interventi per la salvaguardia di Venezia, studiosullo stato delle conoscenza in materia di subsidenza e eustatismo e per la realizzazione di uncaposaldo profondo. Studio 3.1.4, ottobre 1998, CVN, Venice, Italy.

70
CVN, Consorzio Venezia Nuova, 1997: Interventi alle bocche lagunari per la regolazione deiflussi di marea: Studio di impatto ambientale (SIA) del progetto di massima – non technicalsummary. Consorzio Venezia Nuova, Venice, Italy, April 1997.
Delft Hydraulics, Resource Analysis, Ministry of Transport, Public Works and WaterManagement, and Coastal Research Institute, 1992: Vulnerability assessment to accelerated sealevel rise: case study Egypt. Delft Hydraulics, Delft, The Netherlands.
DETR, 1999: Climate change and its impacts: stabilisation of carbon dioxide in the atmosphere.Prepared by the Hadley Centre, The Meteorological office, UK for the Department of theEnvironment, Transport and the Regions, UK. p 27. http://www.meteo.gov.uk
Douglas, B.C. 1991: Global sea level rise. Journal of Geophysical Research., 96 (C4), pp. 6981-6992.
Douglas, B.C., 1997: Global sea rise: a redetermination. Surveys in Geophysics, 18, 279-292.
Douglas, B.C., 1995: Global sea level change: Determination and interpretation., U.S. NationalReport to IUGG, 1991-1994, Rev. Geophys. Vol. 33 Suppl.. report available at:http://earth.agu.org/revgeophys/dougla01/dougla01.html
ECSN, European Climate Support Network, 1995: Climate of Europe. Recent variations, presentstate and future prospects.
EC, European Commission, 1998: CORINE Coastal Erosion, Environment and quality of lifeseries, Office of Official Publications of the European Communities EUR 13298, Luxembourg,1998.
EC, 1999: Lessons from the European Commission’s demonstration programme on integratedcoastal zone management (ICZM). Directorates-General Environment, Nuclear Safety and CivilProtection; Fishery; Regional Policy and Cohesion, Luxembourg.
ECLAT-2, 1999: Representing Uncertainty in Climate Change scenarios and Impact studies,ECLAT-2 Workshop report n.1, Helsinky, 4-16 april 1999, published by the climate Research Unit,UEA,UK.
Eduards, A.J.,1995: Impact of climate change on coral reefs, mangroves and tropical seagrassecosystems. In Climate change: impact on coastal habitation [Eisma, D.(ed.)]. Lewis publishers,Boca Raton, FL, USA, pp. 209-234.
El-Shaer, H.M., C. Rosenzweig, A. Iglesias, M.H. Eid, and D. Hillel 1997: Impact of climatechange on possible scenarios for Egyptian agriculture in the future. Mitig. Adapt. Strategies GlobalChange 1, 233-250.
El-Raey, M., S, Nasr, O. Frihy, S. Desouki, and Kh. Dewidar, 1995: Potential impacts ofaccelerated sea level rise on Alexandria Governorate, Egypt. Journal of Coastal Research, specialissue n. 14, pp. 190-204.
El-Raey, M., Y. Fouda, and S. Nasr, 1997: GIS assessment of the vulnerability of the Rosettaarea, Egypt, to impacts of sea rise. Environmental Monitoring and Assessment, 47 (1), pp. 59-77.

71
El-Raey, M., 1998: Vulnerability assessment and adaptation measure of the Mediterranean coastalzone of Egypt to the impacts of sea level rise. In proceeding of “The International conference on theimpacts of climate change on the Mediterranean countries”, September 1998, Metsovo, Greece.
El-Raey, M., Ahmed S., and Korany E., 1998a: Remote sensing and GIS for vulnerabilityassessment of the impact of sea level rise over Alexandria city and vicinity, Egypt. InternationalJournal Remote Sensing, in print.
El-Raey, M., Frihy O., Nasr S., and Dewidar Kh., 1998b: Vulnerability assessment of sea levelrise over Port-Said Governorate, Egypt. International Journal Remote Sensing, in print.
Estrella, T; Marcuello, C and Iglesias. A 1996: Water Resources: Problem in Southern Europe,an Overview Report – EEA, Copenhagen.
FAO, 1997: AQUASTAT – Egypt. http://www.fao.org/ag/agl/aglw/aquastat/egypto.htm
Fischer, G. Frohberg K. Parry M.L., and Rosenzweig C. 1994: Climate change and world foodsupply, demand and trade: Who benefits, who loses? Global Environ. Change 4, 7-23.
Fisher, D.A., and Koerner R.M., 1994: Signal and noise in four ice-core records from the AgassizIce Cap, Ellesmere Island, Canada: details of the last millennium for stable isotopes, melt, and solidconductivity. Holocene, 4 (2), pp.113-120.
Francia, C, and Juhasz F., 1993: The lagoon of Venice, Italy. Coastal zone management: selectedcase studies, Organisation for Economic Co-operation and Development (OECD), Paris, France, pp.109-134.
Francour, P., C.F. Boudouresque, J.G. Harmelin, M.L. Harmelin-Vivien, and J.P. Quignard,1994: Are the Mediterranean waters becoming warmer? Information from biological indicators.Marine Pollution Bulletin, 28 (9), pp. 523-526.
Fredj G., Bellan-Santini D. & Menardi M. 1992: Etat des connaissances sur la faune marineméditerranéenne. Bull. Inst. Oc.Monaco, 9:133-145.
Frederick K. D. and Major D.C .997: Climate change and water resources in Climate Change 37:7-23, Kluwer Academic Publisher.
Frihy, O., Dewidar Kh., and El-Raey M., 1996: Evaluation of coastal problems at Alexandria,Egypt. Ocean and Coastal Management, 30 (2-3), pp. 281-295.
Gabrielides, G.P., 1998: MAP’s activity on climate change impacts in the Mediterranean coastalregion. In proceeding of “The International conference on the impacts of climate change on theMediterranean countries”, September 1998, Metsovo, Greece.
Gambolati, G., Giunta G., Putti M., Teatini P., Tomasi L., Betti I., Morelli M., Berlamont J.,De Backer K., Decouttere C., Monbaliu J., Yu C.S., Broker I., Christensen E.D., Elfrink B.,Dante A. and Gonella M., 1997: Coastal evolution of the upper Adriatic sea due to sea level riseand natural and anthropic land subsidence. In CENAS study on the coastal evolution of the easternPo plain due to sea level changed caused by climate variations and to natural and anthropogenic

72
subsidence, Dip. di Metodi e Modelli Matematici per le Scienze Applicate dell’Università diPadova, Italy, pp. 1-39.
Geeson, N.A., and Thornes J.B., 1996: MEDALUS II. Executive summary phase II. Commissionof the European Community, DG XII.
Georgiades, N.S., 1998: Expected impacts of climate change on small islands states, like Cyprus,and measures to be adopted. In proceeding of “The International conference on the impacts ofclimate change on the Mediterranean countries”, September 1998, Metsovo, Greece.
Gonella, M., Teatini P., Tomasi L., and Gambolati G., 1997: Flood risk analysis in the UpperAdriatic Sea due to storm surge, tide, waves and natural and anthropic land subsidence. In CENAS:Study on the coastal evolution of the eastern Po plain due to sea level changed caused by climatevariations and to natural and anthropogenic subsidence, Dipartimento di Metodi e ModelliMatematici per le Scienze Applicate, University of Padua, Italy, pp. 323-342.
Goodess, C.M., and Palutikof J.P., 1998: Development of daily rainfall scenarios for south-eastSpain using a circulation-type approach to downscaling. International Journal of Climatology, 10,pp. 1051-1083.
Goodess, C., Palutikof, J., and Agnew, M., 1999: Climate change scenarios for theMediterranean: a basis for regional impact assessment, paper presented at the internationalworkshop on “The impacts of climate change on the Mediterranean area: Regional scenarios andvulnerability assessment., Venice, 9-10 December 1999.
Goreau, T.J., 1992: Bleaching and reef community change in Jamaica: 1951-1991. AmericanZoology, 32, pp. 683-695.
Gorgas D, 1999: Assessment of climate change impact on coastal zones in the Mediterranean .UNEP’s vulnerability assessments methodology and evidence from case studies paper presented atthe international workshop on “The impacts of climate change on the Mediterranean area: Regionalscenarios and vulnerability assessment., Venice, 9-10 December 1999.
Gornitz, V. and Lebedeff S. 1987: Global sea level changes during the past century. In Sea levelchanges and coastal evolution [Hammedal, H., O.H. Pilkey and J.D. Howard (eds)]. SEPM specialpublication n. 41.
Gornitz,V. 1994: Sea Level Rise: a review of recent past and near-future trends, Earth SurfaceProcesses and Trends.
Gornitz, V. 1995: A comparison of difference between recent and late Holocene sea level trendsfrom eastern North America and other selected regions. Journal Coastal Research, 17, pp. 287-297.
Gornitz, V. 1995b: Sea level rise: a review of recent past and near future trends. Earth SurfaceProcesses and Landforms, 20, pp. 7-20.
Gornitz, V. 1997: Effects of anthropogenic intervention in the land hydrological cycle on globalsea level rise. Global and Planetary Change, 14, 147-161.

73
Greenpeace: Desertification, climate change and the Mediterranean region. The document is takenfrom the following web site http://www.greenpeace.org/∼climate/kimpacts/fulldeserts.html as of22.02.1999.
Gregory, J.M., and Mitchell J.F.B., 1997: The climate response to CO2 of the Hadley Centrecoupled OAGCM with and without flux adjustment. Gephys. Res. Let., 24, pp. 1943-1946.
Grenon, M., and Batisse M. (eds), 1989: Future for the Mediterranean basin (The Blue Plan).Oxford University Press, Oxford, UK.
Groisman, P.Y, Karl T.R, and Knight R.W, 1994: Observed impact of snow cover on the heatbalance and the rise of continental spring temperatures. Science, 263, pp. 198-200.
Haeberli, W. and Hoelzle M., 1995: Application of inventory data for estimating characteristics ofand regional climate change effect on mountain glaciers – a pilot study with the European Alps.Annals of Glaciology, 21, pp. 206-212.
Hansen, J.E., Lacis A., Rind D., Russel L., Stone P., Fung I., Ruedy R., and Lerner J., 1984:Climate sensitivity analysis of feedback mechanisms. In Climate processes and climate sensitivity[Hansen, J.E, and T. Takahashi (eds)]. Geophysical Monograph, 29, American Geophysical Union,Washington, D.C., USA, pp. 130-163.
Hansen, J.E., and Lebedeff S., 1987: Global trends of measured surface air temperature. JournalGeophysics Research, 29 (D11), pp. 13345-13372.
Holland G.J., 1997: The maximum potential intensity of tropical cyclones. Journal of theAtmospheric Sciences, 54, pp. 2519-2541.
Hollis, G.E., 1992: Implications of climatic changes in the Mediterranean basin. Garaet el Ichkeuland Lac de Bizerte, Tunisia. In Climate change and the Mediterranean [Jeftic, L., J.D. Milliman,and G. Sestini (eds)]. Edward Arnold, London, UK, pp.602-665.
Hoozemans, F.M.J., Marchand M., and Pennekamp H.A., 1993: A global vulnerability analysis,vulnerability assessment for population, coastal wetlands and rice production on a global scale, 2nd
edition. Delft Hydraulics and Rijkswaterstaat, Delft and The Hague, The Netherlands.
Hulme, M., and Kelly M., 1993: Exploring the link between desertification and climate change.Environment, 35, pp. 4-19.
Hurrell, J.W., 1995: Decadal trends in the North Atlantic Oscillation: regional temperatures andprecipitation. Science, 269, pp.676-679.
IPCC, 1990: Climate Change: the IPCC Scientific Assessment [Houghton, J.T., G.J. Jenkins, andJ.J. Ephraums (eds.)]. IPCC, Cambridge University Press, Cambridge, UK.
IPCC, Working Group I, 1992: Climate Change 1992: the supplementary report to the IPCCscientific assessment [Houghton, J.T., B.A. Callender and S.K. Varney (eds)]. IPCC, CambridgeUniversity Press, Cambridge, UK.

74
IPCC, 1994: Climate Change 1994: radiative forcing of climate change and an evaluation of theIPCC IS92 emission scenarios [J.T. Houghton, L.G. Meira Filho, J. Bruce, H. Lee, B.A. Callander,E. Haites, N. Harris and K. Maskell (eds.)]. IPCC, Cambridge University Press, Cambridge, UK.
IPCC, 1996a: Climate Change 1995, the sciences of climate change [J.T. Houghton, L.G. MeiraFilho, B.A. Callander, N. Harris, A. Kattenberg and K. Maskell (eds.)]. Contribution of WorkingGroup I to the Second Assessment Report of IPCC, Cambridge University Press, Cambridge, UK.
IPCC, 1996b: Climate Change 1995, impacts, adaptations and mitigation of climate change:scientific-technical analysis [Watson, R.T., M.C. Zinyowera, and R.H. Moss (eds.)]. Contributionof Working Group II to the Second Assessment Report of IPCC, Cambridge University Press,Cambridge, UK.
IPCC, 1998: The regional impacts of climate change: an assessment of vulnerability [Watson, R.T.,M.C. Zinyowera, and R.H. Moss (eds.)]. IPCC, Cambridge University Press, Cambridge, UK.
IPCC, 2000: Special Report on Emission Scenarios – Summary for Policy Makers., Special reportof the WGIII of the IPCC, May 2000, available at: www. Ipcc/pub/SPM_SRES.pdf
IPCC CZMS, 1990: Strategies for adaptation to sea level rise - Report of the Coastal ZonesManagement Subgroup; IPCC Response Strategies Working Group; Ministry of Transport, PublicWorks and Water Management, The Hague, The Netherlands.
IPCC CZMS, 1992: Global climate change and the rising challenge of the sea - Report of theCoastal Zones Management Subgroup; IPCC Response Strategies Working Group; Ministry ofTransport, Public Works and Water Management, The Hague, The Netherlands.
Ittekkot, V., Su Jilan, E. Miles, E., Desa, B.N., Desai, J.T., Everett, J.J., Magnuson, A.,Tsyban, and Zuta S., 1996: Impacts, Adaptations and Mitigation of Climate Change: Scientific -19 Technical Analyses. Oceans. In: Climate Change 1995 [Watson, R.T., M.C. Zinyowera, andR.H. Moss (eds.)]. Contribution of Working Group II 20 to the Second Assessment Report of theIntergovernmental Panel on Climate Change, Cambridge University 21 Press, Cambridge, UK, pp.267-288.
Jackson E. 1995: Climate Change And Global Infectious Disease Threats. Medical Journal ofAustralia, vol.163, , pp. 570-574. http://www.greenpeace.org/~climate/impacts/index.html
Jeftic, L., Milliman J.D., and Sestini G., 1992: Climate change and the Mediterranean. EdwardArnold, London, UK.
Jeftic, L., Keckes S., and Pernetta J.C., 1996a: Climate change and the Mediterranean, volume 2.Edward Arnold, London, UK.
Jeftic, L., Keckes S., and Pernetta J.C., 1996b: Implications of future climatic changes for theMediterranean coastal region. In Climate change and the Mediterranean, volume 2 [Jeftic, L., S.Keckes, and J.C. Pernetta (eds)]. Edward Arnold, London, UK, pp.1-25.
Jimenez, J.A., and Sanchez-Arcilla, A. 1997: Physical impacts of climatic change on deltaiccoastal systems (II): driving terms. Climatic Change, 35, pp. 95-118.

75
Jones, P.D., T.M.L. Wigley, and P.B. Wright, 1986: Global temperature variations between 1861and 1984. Nature, 322, pp. 430-434.
Jones, P. D., Briffa, K. R., Barnett, T. P., and S. F. B. Tett, 1998: High-resolution palaeoclimaticrecords for the last millennium: interpretation, integration and comparison with General CirculationModel control run 52 temperatures, Holocene, 8, 477-483. 53
Jones, P.D., New, M., Parker, D.E., Martin, S. and Rigor, I.G.,1999: Surface air temperature andits changes over the past 150 years. Review of Geophysics, 37, 173-199.Kapetanaki, G., and Rosenzweig C. 1997: Impact of climate change on maize yield in central andnorthern Greece: A simulation study with CERES-Maize. Mitig. Adapt. Strategies Global Change1, 251-271
Karl, T. R., R. W. Knight, and B. Baker, 2000: The record breaking global temperatures of 1997and 1998: evidence for an increase in the rate of global warming? Geophys. Res. Lett. Vol.27, No.5,p.79.
Kawasaki, T., Tanaka, S, Toba,Y. and A. Taniguchi (Eds.), 1991: Long –term Variability ofPelagic Fish Populations and Their Environment. Pergamon Press, Oxford, New York, Beijing,Frankfort, Seoul, Sydney, Tokyo, 402pp.
Kennneth D. F and David C. M. 1997: Climate change and Water Resources in Climate Change37: 7-23, Kluwer Academic Publisher.
Khafagy, A.A., Hulsbergen C.H., and Baarse G., 1992: Assessment of the vulnerability of Egyptto sea level rise. In Global climate change and the rising challenge of the sea [O’Callahan, J., (ed)].Proceedings of the IPCC Workshop, March 1992, Margarita Island, Venezuela. National Oceanicand Atmospheric Administration, Silver Spring, MD, USA.
Klein Richard J.T and Nicholls Robert J. 1998. Coastal Zones in Handbook on methods forclimate change impact Assessment and Adaptation Strategies., version 2,UNEP/IV Handbook,October 1998, chap.7 35p.
Klein, R. J. T. and Nicholls R. J., 1999: Assessment of coastal vulnerability to climate change.Ambio, 28 (2), pp. 182-187.
Koppen, W, 1936: Das geographische system der klimate. In Handbuch der klimatologie 3[Koppen, W, and R., Geiger (eds)]. Gebruder Borntraeger, Berlin, Germany.
Lavee, H., Imeson A.C., and Sarah P., 1998: The impact of climate change on geomorphologyand desertification. In proceeding of “The International conference on the impacts of climatechange on the Mediterranean countries”, September 1998, Metsovo, Greece.
Le Traon P.Y., Larnicol G., Ayoub N., De Mey P., 1996: Sea level variability in theMediterranean. AVISO Altimetry newsletter, 4.
Lindh, G., 1992: Hydrological and water resources impact of climate change. In Climate changeand the Mediterranean [Jeftic, L., J.D. Milliman, and G. Sestini, (eds)]. Edward Arnold, London,UK, pp. 58-93.

76
Manabe, S, and R.T, Wetherald, 1975: The effects of doubling the CO2 concentration on theclimate of a general circulation model. Journal of Atmospheric Science, 32, pp.3-15.
Maracchi, G., Crisci A., Grifoni D., Gozzini B., Meneguzzo F., and Zipoli G., 1998: Somefeatures of climate variation in central Italy: need for a Mediterranean co-operation. In proceedingof “The International conference on the impacts of climate change on the Mediterranean countries”,September 1998, Metsovo, Greece.
Margat J. Vallee D. 1999: Vision méditerranéenne sur l’eau, la population et l’environnement auXXI ème siècle - Contribution à la vision mondiale sur l’eau promue par le Conseil Mondial del’eau et le Global Water Partnership, élaborée par le Plan Bleu dans le cadre du MEDTAC/GWPPlan Bleu.
Marino, M.G., 1992: Implication of climatic change on the Ebro delta. In Climate change and theMediterranean [Jeftic, L., J.D. Milliman, and G. Sestini, (eds)]. Edward Arnold, London, UK, pp.304-327.
MEDALUS II, 1996: The MEDALUS II. Mediterranean Desertification and Land Use. ExecutiveSummary Phase II. Commission of European Communities DG XII.
Merino, J.O. and Villar R: Impact of Climatic Change in the Scrub of the Doñana BiologicalReserve (SW Spain). Faculty of Biology, Sevilla, Spain.
Metaxas, D.A., Bartzokas A., and Vitsas A., 1991: Temperature fluctuations in the Mediterraneanarea during the last 120 years. International Journal of Climatology, 11, pp. 897-908.
Milliman, J.D., Brodaus J.M., and Gable F., 1989: Environmental and economic implications ofrising sea level and subsiding deltas: the Nile and Bengal examples. Ambio, 18, pp. 340-345.
Milliman, J.D., 1992: Sea level response to climate change and tectonics in the Mediterranean sea.In Climate change and the Mediterranean [Jeftic, L., J.D. Milliman, and G. Sestini, (eds)]. EdwardArnold, London, UK, pp. 45-57.
Milliman, J.D., Jeftic L., and Sestini G., 1992: The Mediterranean sea and climate change: anoverview. In Climate change and the Mediterranean [Jeftic, L., J.D. Milliman, and G. Sestini,(eds)]. Edward Arnold, London, UK, pp. 1-14.
Mimikou, M. et al, 1991: Regional climate change impacts: impacts on water management works.Hydrol. Sci. J., 259-270.
Murawski, S.A. 1993: Climate change and marine fish distributions: Forecasting from historicalanalogy. Trans. Am. Fish. Soc., 122 (5), 647-658. 53
Musu, I., Ramieri E., and Cogo V., 1998: Indicatori di sostenibilità, uno strumento per l’Agenda21 a Venezia. Working paper 1.98, Fondazione Eni Enrico Mattei, Venice, Italy.
Nerem, R. S., 1995: Global Mean Sea Level Variations from TOPEX/POSEIDON Altimeter Data,Science, 268, 708-710.
77
Nerem, RS, Haines B.J., Hendricks J., Minster J.F., Mitchum G.T. and White W.B., 1997:Improved determination of global mean sea level variations using TOPEX/POSEIDON altimeterdata, Geophys. Res. Lett., 24, 1331-1334.
Nicholls, N., 1984: The southern oscillation, sea-surface temperature, and interannual fluctuation inAustralian tropical cyclone activity. Journal of Climate, 4, pp. 661-670.
Nicholls, N., Landsea C. W., and Gill J., 1998: Australian tropical cyclones: Trends and seasonalpredictability. Accepted in Meteorology and Atmospheric Physics.
Nicholls, R.J., 1995: Coastal megacities and climate change. Geojournal, 37 (3).
Nicholls, R.J., Mimura N., and Topping J., 1995: Climate change in South and Southeast Asia:some implications for coastal areas. Journal of Global Environment Engineering, 1, pp. 137-154.
Nicholls, R.J., and Hoozemans F.M.J., 1996: The Mediterranean: vulnerability to coastalimplication of climate change. Ocean and Coastal Management, 31 (2-3), pp. 105-132.
Odingo, R.S., 1998: The likely impacts of global warming and climate change on the agriculturalresources of the Mediterranean basin. In proceeding of “The International conference on theimpacts of climate change on the Mediterranean countries”, September 1998, Metsovo, Greece.
Palutikof, J.P., Guo X., Wigley T.M.L., and Gregory J.Y., 1992: Regional changes in climate inthe Mediterranean basin due to global greenhouse gas warming. MAP Technical Report Series, n.66, UNEP, Athens, Greece.
Palutikof, J.P., Goodess C.M., and Guo X., 1994: Climate change, potential evapotranspirationand moisture availability in the Mediterranean basin. International Journal of Climatology, 14, pp.853-869.
Palutikof, J.P., and Wigley T.M.L., 1996: Developing climate change scenarios for theMediterranean region. In Climate change and the Mediterranean, volume 2 [Jeftic, L., S. Keckes,and J.C. Pernetta (eds)]. Edward Arnold, London, UK, pp. 27-56.
Palutikof, J.P., Winkler A., Goodess C.M., and Andresen J.A., 1997: The simulation of dailytemperature time series from GCM output. Part I: comparison of model data with observations.Journal of Climate, 10, pp. 2497-2513.
Palutikof, J.P, Agnew, M.D., Watkins S.J., 1999: Statistical downscaling of model data inMEDALUS III, 1999: The MEDALUS III. Mediterranean Desertification and Land Use. FinalReport, Project 3: regional indicators, chapter 11.2, p. 365-412.
Parker, D. E., Jones P. D., Folland C. K., and Bevan A., 1994: Interdecadal changes of surfacetemperature since the late nineteenth century, Journal of Geophysical Research, 99, 14,373-14,399.51.
Peltier, W.R., and Tushingham A.M., 1991: Influence of glacial isostatic adjustment on tidegauge measurements of secular sea level change. Journal of Geophysical Research., 96, pp. 6779-6796.

78
Perez, et al. 2000: Mortalité massive d’invertebrés marins: un événement sans précedent enMediterrannée Nord Occidentale. Compte rendu de l’Académie des sciences de Paris. Life Science,323 pp 853-865.
Perry A.1999: Impacts of climate change on tourism in the Mediterranean: adaptive responses.paper presented at the international workshop on “The impacts of climate change on theMediterranean area: Regional scenarios and vulnerability assessment., Venice, 9-10 December1999.
Piervitali, E., M. Colacino, and Conte M., 1997: Signals of climatic change in the central westernMediterranean basin. Theoretical and Applied Climatology, 58, pp. 211-219.
Piervitali, E., M. Colacino, and M. Conte, 1998a: Rainfall over the Central-WesternMediterranean basin in the period 1951-1955. Part I: precipitation trends Il Nuovo Cimento. Vol.21,C, N.3.
Piervitali, E., Colacino M., and Conte M., 1999: Rainfall over the Central-Western Mediterraneanbasin in the period 1951-1955. Part II: precipitation scenarios. Submitted to Il Nuovo Cimento.Vol.22,C. N.5.
Pirazzoli P.A. 1991: World Atlas of Holocene Sea level Changes. Elsevier Oceanography Series,No. 58, quoted in UNEP/EEA [1999].
Plan Bleu, 2000: http://www.planbleu.org
Rogers, H. H. and Dahlman, R. C., 1993: Plant responses to atmospheric CO2 enrichment.Vegetation, 104/5, 117-131. Quoted in: [Greenpeace].
Rosenzweig C. and Parry M.L., 1994: Potential impacts of climate changes on world food supply. Nature, 367, 133-138 Quoted in [Greenpeace].
Rosenzweig, C., and Tubiello F.N., 1997: Impacts of global climate change on Mediterraneanagriculture: current methodologies and future directions. An introductory essay. Mitigation andAdaptation Strategies for Global Change, 1 (3), pp. 219-232.
Rosenzweig, C. et al, 1993: Climate Change and World Food Supply. Research Report No. 3.Oxford: Environmental Change Unit cited in [Greenpeace].
Salman A. Kooijman M. 1998: Loss and decline of coastal habitats, EUCC European Union forCoastal Conservation, document html available http://www.coastalguide.org/eco/index.html
Sanchez-Arcilla, A., Jimenez J.A., Stive M.J.F., Ibanez C., Pratt N., Day Jr J.W., andCapobianco M., 1996: Impacts of sea level rise on the Ebro Delta: a first approach. Ocean andCoastal Management, 30 (2-3).
Sanchez-Arcilla, A, and Jimenez J.A., 1997: Physical impacts of climate change on deltaic coastalsystems (I): an approach. Climatic Change, 35, pp. 71-93.
Sarà, M., 1985: Ecological factors and their biogeographic consequences in the Mediterraneanecosystems. In Mediterranean marine ecosystems . Moraitou-Apostolopoulou M., and V. Kiortsis(eds.) Plenum Press, New York, USA.

79
Sartoretto S., Velarque M., Laborel J. 1996: Age of settlement and accumulation rate ofsubmarine “corraligène” (-10 to –60m) of the northwestern Mediterranean Sea; relation to Holocenerise in sea level. Marine Geology, Vol. 131(1-2) pp 75-88.
Schlesinger, M.E., and Zhao Z.C., 1989: Seasonal climate changes induced by doubled CO2 assimulated by the OSU atmospheric GCM/mixed-layer ocean model. Journal of Climate, 2, pp. 459-495.
Sestini, G,. 1992a: Implications of climatic changes for the Po delta and the Venice lagoon. InClimate change and the Mediterranean [Jeftic, L., J.D. Milliman, and G. Sestini, (eds)]. EdwardArnold, London, UK, pp. 428-494.
Sestini, G., 1992b: Implications of climate changes for the Nile delta. In Climate change and theMediterranean [Jeftic, L., J.D. Milliman, and G. Sestini, (eds)]. Edward Arnold, London, UK, pp.535-601.
Sestini, G., 1992c: Sea level rise in the Mediterranean region: likely consequences and responseoptions. In Semi-enclosed seas [Fabbri, P. and G. Fierro (eds)]. Elsevier Applied Sceince, Essex,UK, pp. 79-109.
Shennan, I., and Woodworth P.L., 1992: A comparison of late Holocene and twentieth centurysea level trends from the UK and North Sea region. Geophysical Journal International, 109, pp. 96-105.
Sparnocchia, S., Manzella, G. M. R., and LaViolette, P. 1994: The interannual and seasonalvariability of the MAW and LIW core properties in the Western Mediterranean Sea. In Coastal andEstuarine Studies, volume 46, pages177-194. Ed.: P.E. La Violette, American Geophysical Union,177-194.
Sterr H. and Klein R. 1999: Climate Change and Coastal Zones: An overview of the state-of-the-art on regional and local Vulnerability Assessment paper presented at the international workshopon “The impacts of climate change on the Mediterranean area: Regional scenarios and vulnerabilityassessment., Venice, 9-10 December 1999.
Stanley, D.J., 1990: Recent subsidence and north-east tilt of the Nile delta, Egypt. Marine Geology,94, pp. 147-154.
Stanley, D.J., and Warne A.G., 1993: Nile Delta: recent geological evolution and human impact.Science, 260, pp. 628-634.
Stevenson, J.C., Ward L.G., and Kearney M.S., 1986: Vertical accretion in marshes with varyingrates of sea level rise. In Estuarine variability [Wolfe, D.A. (ed)]. Academic Press, New York,USA, pp. 241-259.
Stone, R.D. 1996: Impacts of climate change on selected ecosystems in Europe. Parks, Vol. 6, 2,pp. 25-37. IUCN, Gland, Switzerland
Tett, S.F.B., Stott P.A., Allen M.R., Ingram W.J., and Mitchell J.F.B., 1999: Causes oftwentieth-century temperature change near the Earth’s surface. Nature, 399, pp. 569-572.

80
Timmmerman, P., and White R., 1997: Megahydropolis: coastal cities in the context of globalenvironmental change. Global Environmental Change, vol. 7. (3), pp. 205-234.
Titus, J.G., and Narayanan V.K., 1995: The probability of sea level rise. EPA; EnvironmentalProtection Agency, Washington, D.C., USA.
Trenberth, K.E., and Shea D., 1997: Atmospheric circulation changes and links to changes inrainfall and drought. Paper presented to: Seventh Conference on Climate Variations, Long Beach,California, USA, February 2-7, 1997.
Trupin, A., and Wahr J., 1990: Spectroscopic analysis of global tide gauge sea level data.Geophysical Journal International, 100, pp. 441-453.
Unal, Y. S., and Ghil M., 1995. Interannual and interdecadal oscillation patterns in sea level, Clim.Dyn., 11, 255-278.
UNEP, ICSU, and WMO, 1986: Report of the international conference on the assessment of therole of CO2 and other greenhouse gases in climate variation and associated impacts, Villach, 9-15October 1985, WMO, Geneva.
UNEP United Nations Environment Programme, 1989a: State of the Mediterranean marineenvironment [Jeftic, L. (ed)]. MAP Technical Reports Series, n. 28, UNEP, Athens, Greece.
UNEP United Nations Environment Programme, 1989b: Implications of expected climatechanges in the Mediterranean region: an overview [Sestini, G, L. Jeftic, and J.D. Milliman (eds)].MAP Technical Reports Series, n. 27, UNEP, Athens, Greece.
UNEP, 1992: World atlas on desertification. Nairobi & Edward Arnold, London, UK.
UNEP, 1993: The impact of climate change. UNEP/GEMS Environmental library No 10.
UNEP, 1997a: Bilan Diagnostique Transfrontière pour la Mer Méditerranée (BDT MED). Rapportprovisoire. Plan d’Action pour la Méditerranée, Réunion d’experts, Ischia, 15- 18 juin 1997.
UNEP, 1997b: Climate change information kit. UNEP/IUC, UNEP’s Information Unit forConventions, Geneva, Switzerland.
UNEP/EEA 1999a: Coastal and Marine Zones - Environment in the European Union at the turn ofthe century – Chapter 3.14, p357- 380. http://www.eea.eu.int
UNEP/EEA 1999b: State and pressures of the marine and coastal Mediterranean environment.,European Communities pp. 137, Luxembourg. http://www.eea.eu.int
UNEP, ICSU, and WMO, 1990: Statement by the UNEP/WMO/ICSU International Conferenceon the assessment of the role of carbon dioxide and other greenhouse gases in climate variations andassociated impacts, Geneva, 29 October - 7 November 1990. In The greenhouse effect, climaticchange and ecosystems, SCOPE report n. 29, Wiley, London, UK, pp. xx-xxiv.
UNEP and WMO, 1997: Common questions about climate change. United Nations EnvironmentProgramme and World Meteorological Organisation.

81
Vallega, A., 1997: Water resources and Mediterranean ecosystems. Paper presented at theInternational Conference “Water in the Mediterranean countries. Problems in the management of ascarce resource”, December 4-5 1997, Naples, Italy.
Vinnikov, K.Ya., P.Ya. Groismann, and Lugina K.M. 1990: Empirical data of contemporaryglobal. Climate changes (temperature and precipitation). Journal of Climate, 6, pp. 1161-1171.
von Storch, H., Zorita, E. and Cubasch, U., 199: Downscaling of global climate change estimatesto regional scales: An application to Iberian rainfall in winter, Journal of Climate, 6, 1161-1171.
World Coast Conference, WCC 1993: How to Account for Impacts of Climate Change in CoastalZone Management: Concepts and Tools for Approach and Analysis, Versions 1 and 2. World CoastConference 1993, November 1-5, Noordwijk, Netherlands. The Hague: Ministry of Transport,Public Works, and Water Management. National Institute for Coastal and Marine Management,Coastal Zone Management Centre.
Wetherland, R.T. and S. Manabe, 1986: An investigation of cloud cover change in response tothermal forcing. Climatic Change, 8, pp. 5-23.
WHO/UNEP, 1995: Climate Change and Human Health. Personal communication from AthenaRonquillo of Greenpeace Southeast Asia.
Wigley, T.M.L., 1992: Future climate of the Mediterranean basin with particular emphasis onchange in precipitation. In Climate change and the Mediterranean [Jeftic, L., J.D. Milliman, and G.Sestini, (eds)]. Edward Arnold, London, UK, pp. 15-44.
Wigley, T.M.L., 1995: Global mean temperature and sea level consequences of greenhouse gasconcentration stabilisation. Geophysical Research Letters., 22, pp. 45-48.
Wigley, T.M.L., and Raper S.C.B. 1992: Implications for climate and sea-level of revised IPCCemissions scenarios. Nature, 357, pp. 293-300.
Wigley, T.M.L., and S.C.B. Raper, 1995: An heuristic model for sea level rise due to the meltingof small glaciers. Geophysical Research Letters, 22, pp. 2749-2752.
Wilby, R.L., 1998: Statistical downscaling of daily precipitation using daily airflow and seasonalteleconnection indices. Clim. Res. 10:163Ð178.
Wilson, C.A, and J.F.B., Mitchell, 1987: Simulated climate and CO2 induced climate change overwestern Europe. Climatic Change, 10, pp. 11-42.
Wilkinson. C. 1998: The 1997-1998 Mass Bleaching Event Around the World report available athttp://coral.aoml.noaa.gov/gcrmn/
White, J. W. C., Barlow, L. K., Fisher, D.A., Grootes, P., Jouzel, J., Johnsen, S. and MayewskiP. A. 1998:The climate signal in the stable isotopes of snow from Summit Greenland: results ofcomparisons with modern climate observations, Special Issue J.G.R. published by AGU,
WISE, 1999: Economic and Social Impacts of Climate Extremes: Risks and Benefits - Report ofthe WISE project “Weather Impacts on Natural, Social and Economic Systems” meeting on ‘Economicand Social Impacts of Climate Extremes’, 14-16 October 1999, Amsterdam p.39.

82
Wood, C.M. and. McDonald D.G (eds), 1997: Global Warming: Implications for freshwater andmarine fish. Cambridge University. Press. Cambridge, United Kingdom. 425pp. 28.
WRI/IIED/UNEP, 1989: World Resources 1988-89. New York: Basic Books.
WRI/IIED/UNEP, 1997: World Resources 1996-97. New York: Basic Books.
Zerbini, S. et al. 1996: Sea level in the Mediterranean: a step towards separating crustal movementsand absolute sea-level variations. Global and Planetary Change, (14) 1-2, pp 1-48.