ssm st. clare health center: fenton, missouri technical ... · pdf filessm – st. clare...
TRANSCRIPT

SSM – St. Clare Health Center: Fenton, Missouri
Technical Report 4 Dr. Linda Hanagan, Advisor
Christopher Brandmeier 11-17-2014

Brandmeier | 1
TECHNICAL REPORT 4
Executive Summary
SSM St. Clare Health Center is a 420,000 square foot hospital located in a residential area of
Fenton, Missouri. The building and parking areas sit on a 54 acre site, which was previously a 9-hole golf
course with gently varying topography, large stands of trees, and a 3 acre pond. The hospital program
contains a wide variety of medical use spaces, including 158 emergency supported inpatient beds,
diagnostic and surgical services, administrative offices, dietary facilities, and pharmaceutical
dispensaries. Budgeted at $226.8 million, the hospital was constructed with an Integrated Project
Delivery method and came in well under budget at $223.5 million.
Structurally, the hospital is a composite steel frame building resting on massive concrete drilled
piers which are connected by grade beams. The structure is broken up into three buildings (bed tower,
surgery tower, and interventional care unit) isolated by expansion joints. These individual buildings
each contain their own lateral force resisting systems which include special moment frames (SMF),
special concentrically braced frames (SCBF), special reinforced concrete shear walls (SRCSW), and
ordinary concentrically braced frames (OCBF).
HGA Architects and Engineers served as the primary architects and structural engineers on the
project. They worked closely with the MEP engineers, KJWW, and the construction manager, Alberici
Construction, through an integrated “Lean” project delivery contract that focused on improving
coordination and quality by sharing project risks. The project began construction in September of 2006
and reached completion in March of 2009.
SSM St. Clare Health Center was designed in 2004 and uses the 2003 Edition of the International
Building Code and ASCE 7-02 as a reference standard. Design loads were determined based on these
codes, additional St. Louis County Codes and Ordinances, and practical engineering judgments. This
report uses ASCE 7-10 as the reference for calculating wind and seismic lateral forces.

Brandmeier | 2
TECHNICAL REPORT 4

Brandmeier | 3
TECHNICAL REPORT 4
TABLE OF CONTENTS 1 General Information ............................................................................................................................. 4
1.1 Purpose ......................................................................................................................................... 4
1.2 Scope ............................................................................................................................................. 4
1.3 Site Location and Plan ................................................................................................................... 4
1.4 List of Preparatory Documents ..................................................................................................... 7
2 Gravity Loads ......................................................................................................................................... 8
2.1 Dead and Live Loads...................................................................................................................... 8
2.2 Snow Loads ................................................................................................................................... 9
3 Lateral Loads ....................................................................................................................................... 10
3.1 Wind Loads .................................................................................................................................. 10
3.2 Seismic Loads .............................................................................................................................. 12
4 Computer Modeling ............................................................................................................................ 13
4.1 Model Development ................................................................................................................... 13
4.2 Assumptions ................................................................................................................................ 14
4.3 Model Validation ......................................................................................................................... 15
4.3.1 Center of Rigidity and Center of Mass Checks .................................................................... 15
4.3.2 Wind Load Comparison ....................................................................................................... 17
4.3.3 Seismic Load Comparison ................................................................................................... 17
4.3.4 Torsional Shear Check ......................................................................................................... 17
4.3.5 Equilibrium Check ............................................................................................................... 18
5 Code and Member Checks .................................................................................................................. 18
5.1 Drift Checks ................................................................................................................................. 18
5.2 Member Checks .......................................................................................................................... 20
5.2.1 Brace and Column Member Check ..................................................................................... 21
5.2.2 Beam Check ......................................................................................................................... 25
5.2.3 Concrete Shear Wall Member Check .................................................................................. 27
6 Appendix A: Gravity Loads ................................................................................................................. 29
7 Appendix B: Wind Loads ..................................................................................................................... 33
8 Appendix C: Seismic Loads ................................................................................................................. 35

Brandmeier | 4
TECHNICAL REPORT 4
1 GENERAL INFORMATION
1.1 PURPOSE This report details the process and results of a lateral system analysis conducted on SSM St.
Clare Health Center. The document is intended to show a mastery of modeling techniques and model
validation proceedures.
1.2 SCOPE The major sections of this document discuss controlling load cases and the lateral systems that
resist them. The building’s location and relevant resource documents used in its design are also
presented. The appendices to this document contain the original load calculations from HGA Architects
and Engineers. The analysis focuses on the bed tower, labelled sections “A” and “B” on the record
drawings.
1.3 SITE LOCATION AND PLAN SSM St. Clare Health Center is located in Fenton, Missouri (St. Louis County) in a relatively open
residential area. The site was previously a golf course, which provided open space and gently sloping
terrain. Figure 1 shows the relative placement of the site in Missouri, while Figures 2 through 5 show
the building’s location on the site as dictated by zoning codes and city ordinances as well as its relative
proximity to the New Madrid fault line, which has a great effect on the site’s seismic characteristics and
is of particular relevance to this report.

Brandmeier | 5
TECHNICAL REPORT 4
Figure 1: Building Location
Figure 2: Location relative to New Madrid Fault Line
Figure 3: Rendering of SSM Health Center Complex

Brandmeier | 6
TECHNICAL REPORT 4
Figure 4: Original Site, Golf Course
Figure 5: Building Orientation on Site

Brandmeier | 7
TECHNICAL REPORT 4
1.4 LIST OF PREPARATORY DOCUMENTS SSM St. Clare Health Center Site Development Plan
o Produced by Stock & Associates Consulting Engineers Inc.
SSM St. Clare Health Center Replacement Hospital Project Manual
o CP-11 E/T Document Issuance
IBC
o 2003 Edition (as reference)
o 2012 Edition (for further design studies)
ASCE 7
o ASCE 7-02 (as reference)
o ASCE 7-10 (for further design studies and load calculations)
ACI 318
o ACI 318-11 (for modeling modifiers)
Vulcraft Steel Deck Catalogue, 2008 Edition
AISC Steel Manual 14th Edition

Brandmeier | 8
TECHNICAL REPORT 4
2 GRAVITY LOADS
This section examines the dead, live, and snow loads used to design the building’s gravity
system. The original design calculations for gravity loads can be found in Appendix A. Dead loads are
determined based on standard material weights, manufacturer data, and engineering experience.
Future analyses of the building will focus on the bed tower. The majority of these loads are not present
in the bed tower, but are listed here for comparison to the calculated loads, and as a reference.
2.1 DEAD AND LIVE LOADS Table 1: Typical Live Loads
Live Load Value (psf) Code Minimum (psf)
Operating Room 60 60
Offices 50 50
Private Rooms 40 40
Corridors (1st Floor) 100 100
Corridors (other) 80 80
Stairs and Exits 100 100
Equipment Rooms 125 125
Table 2: Typical Floor Dead Loads
Dead Load Original Design Values (psf) Thesis Calculated Values (psf)
Hospital Floor 60 64
Hospital Roof 78 70
Note in Figure 6 on the next page that the bed tower’s floor plan is congested with corridors.
This means that conservatively, a live load of 80 psf can be assumed for the entire floor area unless a
higher load occurs. The highest load to occur in the hospital outside of a corridor is an operating room
with movable partitions; however, 60 psf + 20 psf returns the load conservatively to 80psf. The entire
floor slab is the same 64 psf “Hospital Floor” assembly.
The presence of the 20 psf movable partition load becomes relevant when calculating the
seismic mass of the building. ASCE 7-10 requires an additional 10 psf mass load to be applied to all
diaphragms where a movable partition load is used. In the case of this report, the 60 psf + 20 psf case is
assumed to control for its effect on the lateral loads (particularly seismic).


Brandmeier | 9
TECHNICAL REPORT 4
Figure 6: Architectural Plan of Bed Tower (example typical 30’x30’ bays in red)
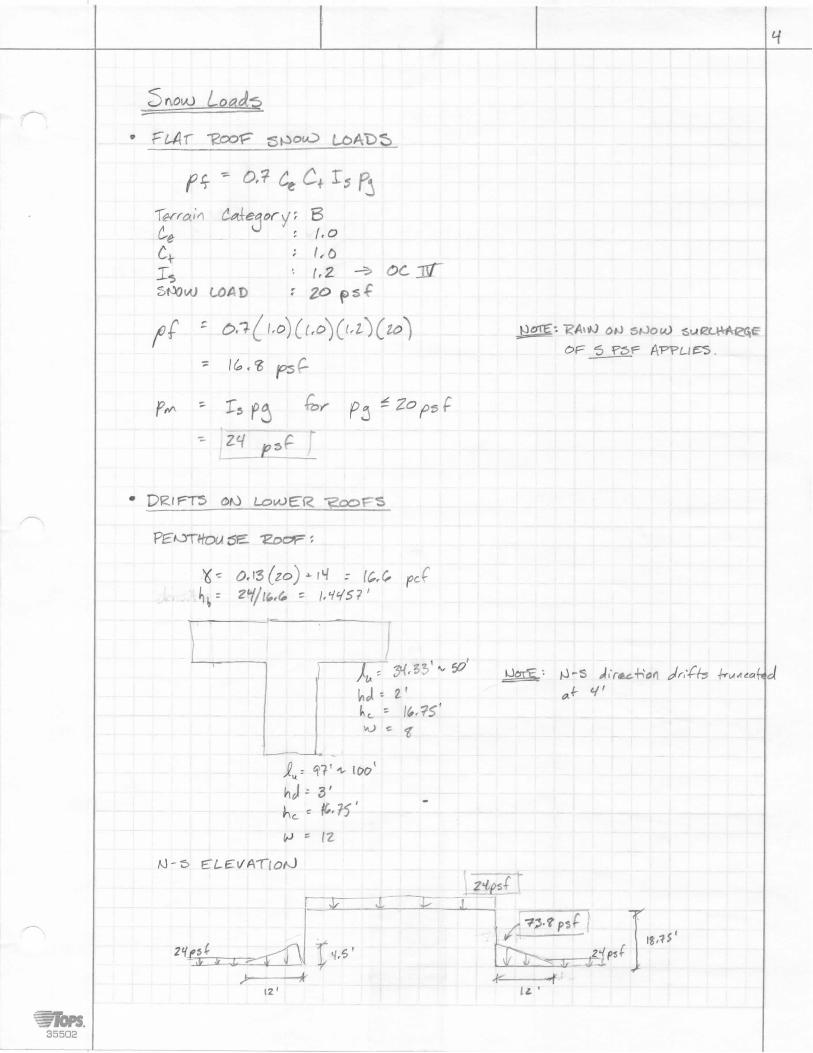
2.2 SNOW LOADS The following section contains example calculations of snow loads and snow drift loads on SSM
St. Clare Health Center.


Brandmeier | 10
TECHNICAL REPORT 4
3 LATERAL LOADS
This section begins the discussion of lateral loads on SSM St. Clare Health Center. The primary
loads reviewed were the wind load patterns and seismic load patterns. Appendix C contains the original
design calculation values for design. The loads were determined the basic wind procedure. This report
uses a newer version of the code and different calculation method as discussed below.
3.1 WIND LOADS The original structural design team used wind loads calculated by ASCE 7-02 methods; however,
for simplification with software and comparison to current codes, the wind loads calculated in this
report reference ASCE 7-10.
The building is located in Fenton, Missouri on an open site that was previously a golf course.
The surrounding landscape consists mainly of trees and residential neighborhoods, making the site
exposure category B. The risk category is IV for a hospital and the importance factor is 1.5. Based on
wind maps from ASCE 7-10, the basic wind speed for the area is 115 mph. Important design parameters
used in calculations can be seen in Table 3 below.
Table 3: Wind Design Parameters
Parameter Symbol Value
Occupancy Category - IV
Basic Wind Speed V 115 mph
Exposure Category - B
Wind Directionality Factor Kd 0.85
Importance Factor Ie 1.5
Topographical Factor Kzt 1.0
Gust Effect Factor G 0.8205
Enclosure Classification - Enclosed
The building’s reentrant corner geometries made calculation of wind loads challenging. To
approximate length to width ratios, the main bed tower and the arm of the tower were separated into
individual sections and calculated independently. The total forces were then added back together to
achieve a story shear value. Tables 4 and 5 contain the raw wind load data for the two building
portions. The graphics that follow show the data as applied to the building elevation in the East-West
and North-South directions.


Brandmeier | 11
TECHNICAL REPORT 4
Table 4: Wind Loads in the East-West Direction
Table 5: Wind Loads in the North-South Direction
East-West Direction
Location z (ft)
Story Height
(ft)
qzGCp
(psf)
Tributary
Width
External
Pressure (kip) GCpi
qhGCpi
(psf)
Tributary
Width
Internal
Pressure (kip)
Total Pressure
(kip)
Windward -16 16.0 11.0 0.0 0.0 0.18 5.0 0.0 0.0 0.0
0 16.0 11.0 42.3 0.0 0.18 5.0 0.0 0.0 0.0
16 14.0 11.2 42.3 7.1 0.18 5.0 0.0 0.0 7.1
30 14.0 13.4 42.3 7.9 0.18 5.0 0.0 0.0 7.9
44 14.0 14.9 42.3 8.8 0.18 5.0 0.0 0.0 8.8
58 14.0 16.1 42.3 9.5 0.18 5.0 0.0 0.0 9.5
72 18.8 17.2 42.3 11.9 0.18 5.0 0.0 0.0 11.9
90.75 0.0 18.3 42.3 7.3 0.18 5.0 0.0 0.0 7.3
Leeward 90.75 90.8 -11.5 42.3 43.9 0.18 5.0 0.0 0.0 43.9
Parapet WW 93 2.2 34.6 42.3 3.2 1.5 41.5 0.0 0.0 3.2
Parapet LW 93 2.2 23.1 42.3 2.1 -1 -27.7 0.0 0.0 2.1
Windward -16 16.0 11.4 0.0 0.0 0.18 5.0 0.0 0.0 0.0
0 16.0 11.4 224.8 0.0 0.18 5.0 0.0 0.0 0.0
16 14.0 11.6 224.8 39.0 0.18 5.0 150.0 11.2 50.2
30 14.0 13.9 374.8 72.7 0.18 5.0 0.0 0.0 72.7
44 14.0 15.5 374.8 81.1 0.18 5.0 0.0 0.0 81.1
58 14.0 16.7 374.8 87.7 0.18 5.0 0.0 0.0 87.7
72 18.8 17.8 374.8 109.1 0.18 5.0 0.0 0.0 109.1
90.75 0.0 19.0 71.0 12.6 0.18 5.0 0.0 0.0 12.6
Leeward 90.75 90.8 -4.8 374.8 161.6 0.18 5.0 0.0 0.0 161.6
Parapet WW 93 2.2 41.5 374.8 33.7 1.5 41.5 0.0 0.0 33.7
Parapet LW 93 2.2 27.7 374.8 22.5 -1 -27.7 0.0 0.0 374.8
Base Shear: 1085.2 kips
ARM External Pressure Internal Pressure
TOWER External Pressure Internal Pressure
North-South Direction
Location z (ft)
Story Height
(ft)
qzGCp
(psf)
Tributary
Width
External
Pressure (kip) GCpi
qhGCpi
(psf)
Tributary
Width
Internal
Pressure (kip)
Total Pressure
(kip)
Windward -16 16.0 11.7 0.0 0.0 0.18 5.0 0.0 0.0 0.0
0 16.0 11.7 113.8 0.0 0.18 5.0 0.0 0.0 0.0
16 14.0 11.9 113.8 20.3 0.18 5.0 0.0 0.0 20.3
30 14.0 14.2 113.8 22.6 0.18 5.0 0.0 0.0 22.6
44 14.0 15.8 113.8 25.2 0.18 5.0 0.0 0.0 25.2
58 14.0 17.1 113.8 27.3 0.18 5.0 0.0 0.0 27.3
72 18.8 18.2 113.8 34.0 0.18 5.0 0.0 0.0 34.0
90.75 0.0 19.5 67.0 12.2 0.18 5.0 0.0 0.0 12.2
Leeward 90.75 90.8 -7.3 113.8 75.4 0.18 5.0 0.0 0.0 75.4
Parapet WW 93 2.2 0.0 113.8 0.0 1.5 41.5 0.0 0.0 0.0
Parapet LW 93 2.2 0.0 113.8 0.0 -1 -27.7 0.0 0.0 0.0
Windward -16 16.0 10.5 0.0 0.0 0.18 5.0 0.0 0.0 0.0
0 16.0 10.5 0.0 0.0 0.18 5.0 0.0 0.0 0.0
16 14.0 10.7 0.0 0.0 0.18 5.0 77.3 5.8 5.8
30 14.0 12.7 77.3 13.8 0.18 5.0 0.0 0.0 13.8
44 14.0 14.2 77.3 15.4 0.18 5.0 0.0 0.0 15.4
58 14.0 15.4 77.3 16.7 0.18 5.0 0.0 0.0 16.7
72 18.8 16.4 77.3 20.7 0.18 5.0 0.0 0.0 20.7
90.75 0.0 17.5 31.0 5.1 0.18 5.0 0.0 0.0 5.1
Leeward 90.75 90.8 -10.9 77.3 76.7 0.18 5.0 0.0 0.0 76.7
Parapet WW 93 2.2 33.0 77.3 5.5 1.5 41.5 0.0 0.0 5.5
Parapet LW 93 2.2 22.0 77.3 3.7 -1 -27.7 0.0 0.0 77.33
Base Shear: 454.1 kips
External Pressure Internal Pressure
External Pressure Internal Pressure
ARM
TOWER

Brandmeier | 12
TECHNICAL REPORT 4
3.2 SEISMIC LOADS Seismic design loads were also originally calculated using ASCE 7-02; however, this report uses
ASCE 7-10 load criteria.
The site is located within a New Madrid Fault affected area, and the site soil conditions are
relatively poor. This combination of factors places the structure in a seismic design category D. Other
relevant seismic design parameters are shown below in Table 6.
Table 6: Seismic Design Parameters
Parameter Symbol Value
Occupancy Category - IV
Site Class - D
Seismic Design Category - D
Short Period Spectral Response Acceleration Ss 0.414
One Second Spectral Response Acceleration S1 0.163
Seismic loads have been calculated based on building mass. For simplification, the building mass
consists of 4 main components: diaphragms and framing, building enclosure, concrete shear walls, and
superimposed movable partitions. The combined mass of these elements has been calculated at each
story for a given story height and diaphragm area. The forces are then given an eccentricity of 5% to
either direction to account for accidental torsions. The forces applied at each story, calculated
manually, are shown below.
The building has several types of structural irregularities that should be noted for future design
considerations. According to ASCE 7-10 Tables 12.3-1 and 12.3-2, the building has reentrant corner
irregularities and out-of-plane offset irregularities (at the penthouse floor) in the plan dimension, and a
weight irregularity and in-plane discontinuity irregularity (brace frame at grid Ra) in the vertical
dimension. These irregularities influence the amplification of design loads for the design of connections,
collectors, and other special elements. For the sake of this report, design forces are assessed from the
3D computer model after validation, and overstrength is not applied. The Cd factors for drift are applied
where appropriate. For more information on assumptions related to seismic factors, see the “Computer
Modeling” section.
Table 7: Seismic Design Loads
Story Dia. Wx (kips) Hx (ft) k Hxk Wx*Hxk Cvx Fx
First Floor 1 5076.90 16.00 1.23 30.66 155682.65 0.05 77.89
Second Floor 2 4987.50 32.00 1.23 72.16 359902.54 0.13 180.07
Third Floor 3 3417.40 46.00 1.23 112.95 385998.01 0.13 193.12
Fourth Floor 4 3417.40 60.00 1.23 156.80 535862.22 0.19 268.10
Fifth Floor 5 3147.40 74.00 1.23 203.15 639381.21 0.22 319.90
Roof 6 3141.90 88.00 1.23 251.60 790509.88 0.28 395.51
Penthouse Roof 7 640.00 106.00 1.23 316.59 202619.66 0.07 101.37
23828.5 422 7.4 827.3 2867336.5 1 1434.6


Brandmeier | 13
TECHNICAL REPORT 4
4 COMPUTER MODELING
This section details the process and results of creating a lateral system model of SSM St. Clare
Health Center’s patient bed tower. The three dimensional model was constructed in Etabs, while two
dimensional rigidity checks were conducted in SAP 2000.
4.1 MODEL DEVELOPMENT Each lateral element was first constructed in two dimensions in SAP 2000 to verify that the
modeling technique and modeling assumtions were effective. Then, the same technique was used to
model the elements in Etabs along a three dimensional grid. Rigid diaphragms were created to
represent the 3 inch steel deck with 3.5 inches of concrete topping.
Loads were applied to the model by automatic generation. These automatically generated loads
were then compared to manual calculations to verify the software’s method and assumptions.
Several models were generated with different assumptions for base fixity; from fixed to pinned
columns and pins at the base versus diaphragm constraints at the first level (ground level). It was
determined that the foundation walls did not have sufficient connection to the first floor diaphragm to
warrant a pinned connection at the first level. The final model exhibited the most realistic behavior and
most similar loading to hand calculations. Figures 7 through 10 are depictions of the final Etabs model.
Further refinement can be conducted on seismic loading. Also, a modal analysis would be
interesting for studying the effects of mass participation in torsional modes.
Figure 8: Example SRCSW Figure 7: Example SCBF Figure 9: Example SMF

Brandmeier | 14
TECHNICAL REPORT 4
4.2 ASSUMPTIONS Table provides a list of major assumptions associated with each component of the lateral
system.
Lateral Component
Element Type
Assumptions Modifiers
Special Moment Frames
Beam Beams are fixed-fixed
Composite action is negligible
Full moment fixity at base (pinned with fixed moment in-plane)
Self-weight set to zero
Insertion point 8 (top center) with 6.5 in. vertical offset for beams
Nodes at similar levels constrained to diaphragm
Special Concentrically Braced Frames
Beam Beams are pinned-pinned
Braces are pinned-pinned
Columns are fixed-fixed
Composite action is negligible
Full moment fixity at base (pinned with fixed moment in-plane)
Braces automatically adjust to insertion point to remain concentric
Self-weight set to zero
Insertion point 8 (top center) with 6.5 in. vertical offset for beams
Moment releases at both ends of beams and braces
Nodes at similar levels constrained to diaphragm
Special Reinforced Concrete Shear Walls
Thin-Shell 16 in. thick shell element
Shear wall extends below base to foundations where it is fixed at the sub-base level.
Shell method is more accurate than frame method.
No out-of-plane rigidity
All floors are cracked (designed as “special” reinforced for ductility)
Self-weight set to zero
Moment and shear modifiers out-of-plane set to zero.
Moment in-plane set to 0.7 per ACI 318-11
Diaphragms N/A Rigid diaphragm
Continuous over entire level.
Center of diaphragm mass is center of story mass
Penthouse loads applied at 6th story COM.
Mass distributed uniformly
Self-weight set to zero
Superimposed mass equal to total of floor assembly, facades, shear walls, and misc. applied uniformly

Brandmeier | 15
TECHNICAL REPORT 4
4.3 MODEL VALIDATION Validation of the lateral Etabs model included COR/COM checks, wind load comparisons, seismic
load comparisons, and torsional behavior comparisons.
4.3.1 Center of Rigidity and Center of Mass Checks
The center of rigidity was checked using stiffness values from two dimensional SAP 2000 models
of each of the lateral components. Single kip loads were applied to each story of the lateral resisting
elements and total deflection was measured at that story. Relative stiffness for each story was
calculated, and from these relative stiffnesses the centers of rigidity of each story were evaluated as
shown in Tables 8 and 9. The COR values are compared to the model generated values and mostly agree
to within 5%, indicating that the model is using correct stiffness values.
Table 8: Center of Rigidity in Model Global Y (N-S axis)
Element Story Disp. Rel. K (k/in) Dist X Dist Y Ri*Xi Sum(Ri*Xi) Sum(Ri) COR Model Values % Error
1B-smf 1 0.001680 595.24 0.000 191.165 113788.6905 487622.2108 3518 138.6012 137.71 0.65
1A-smf 1 0.001130 884.96 0.000 191.165 169172.5664
4B-smf 1 0.001680 595.24 0.000 113.749 67707.55952
4A-smf 1 0.001130 884.96 0.000 113.749 100662.5664
8-smf 1 0.009190 108.81 0.000 0.000 0
5B-smf 1 0.003560 280.90 0.000 80.832 22705.61798
5A-smf 1 0.005950 168.07 0.000 80.832 13585.21008
1B-smf 2 0.007110 140.65 0.000 191.165 26886.77918 118917.7762 870 136.6731 134.6118 1.53
1A-smf 2 0.004540 220.26 0.000 191.165 42106.82819
4B-smf 2 0.007110 140.65 0.000 113.749 15998.41069
4A-smf 2 0.004540 220.26 0.000 113.749 25054.77974
8-smf 2 0.025960 38.52 0.000 0.000 0
5B-smf 2 0.014040 71.23 0.000 80.832 5757.264957
5A-smf 2 0.025960 38.52 0.000 80.832 3113.713405
1B-smf 3 0.013430 74.46 0.000 191.165 14234.17722 59264.31973 408 145.3599 135.763 7.07
1A-smf 3 0.008340 119.90 0.000 191.165 22921.46283
4B-smf 3 0.013430 74.46 0.000 113.749 8469.746835
4A-smf 3 0.008340 119.90 0.000 113.749 13638.93285
8-smf 3 0.052690 18.98 0.000 0.000 0
1B-smf 4 0.020370 49.09 0.000 191.165 9384.634266 39518.98028 272 145.1722 138.02 5.18
1A-smf 4 0.012420 80.52 0.000 191.165 15391.70692
4B-smf 4 0.020370 49.09 0.000 113.749 5584.128621
4A-smf 4 0.012420 80.52 0.000 113.749 9158.510467
8-smf 4 0.076880 13.01 0.000 0.000 0
1B-smf 5 0.027780 36.00 0.000 191.165 6881.389489 29147.27257 201 145.1857 139.952 3.74
1A-smf 5 0.016780 59.59 0.000 191.165 11392.43147
4B-smf 5 0.027780 36.00 0.000 113.749 4094.62563
4A-smf 5 0.016780 59.59 0.000 113.749 6778.825983
8-smf 5 0.104440 9.57 0.000 0.000 0
1B-smf 6 0.036170 27.65 0.000 191.165 5285.181089 22507.28806 155 145.2776 141.6316 2.57
1A-smf 6 0.021660 46.17 0.000 191.165 8825.715605
4B-smf 6 0.036170 27.65 0.000 113.749 3144.835499
4A-smf 6 0.021660 46.17 0.000 113.749 5251.555863
8-smf 6 0.137070 7.30 0.000 0.000 0

Brandmeier | 16
TECHNICAL REPORT 4
Table 9: Center of Rigidity in Model Global X (E-W axis)
The center of mass was approximated using geometric forms as shown on the following page.
Checking one floor was sufficient to verify the model’s accuracy, as the values were nearly identical.
Element Story Disp. Rel. K (k/in)Dist X Dist Y Ri*Xi Sum(Ri*Xi)Sum(Ri) COR Model Values % Error
S-srcsw 1 0.000244 4092 165.668 0.000 677856 2437450 14145 172.3206 172.1045 0.13
N-srcsw 1 0.000217 4608 194.683 0.000 897157.6
Aa1-scbf 1 0.000628 1592 0.000 0.000 0
Aa3-scbf 1 0.000580 1724 0.000 0.000 0
Ra-scbf 1 0.000470 2129 405.000 0.000 862436.1
S-srcsw 2 0.000559 1789 165.668 0.000 296364.9 1092755 6252 174.7738 176.896 1.20
N-srcsw 2 0.000509 1964 194.683 0.000 382406.6
Aa1-scbf 2 0.001270 787 0.000 0.000 0
Aa3-scbf 2 0.001450 690 0.000 0.000 0
Ra-scbf 2 0.000978 1022 405.000 0.000 413983.4
S-srcsw 3 0.001010 990 165.668 0.000 164027.7 692366.4 3594 192.6556 186.5426 3.28
N-srcsw 3 0.000908 1101 194.683 0.000 214385.2
Aa1-scbf 3 0.002770 361 0.000 0.000 0
Aa3-scbf 3 0.002730 366 0.000 0.000 0
Ra-scbf 3 0.001290 775 405.000 0.000 313953.5
S-srcsw 4 0.001240 806 165.668 0.000 133603.2 475433.9 2487 191.139 190.4143 0.38
N-srcsw 4 0.001500 667 194.683 0.000 129788.8
Aa1-scbf 4 0.004210 238 0.000 0.000 0
Aa3-scbf 4 0.003950 253 0.000 0.000 0
Ra-scbf 4 0.001910 524 405.000 0.000 212041.9
S-srcsw 5 0.002690 372 165.668 0.000 61586.62 283959.8 1447 196.2195 191.9442 2.23
N-srcsw 5 0.002340 427 194.683 0.000 83197.95
Aa1-scbf 5 0.006570 152 0.000 0.000 0
Aa3-scbf 5 0.006570 152 0.000 0.000 0
Ra-scbf 5 0.002910 344 405.000 0.000 139175.3
S-srcsw 6 0.004090 244 165.668 0.000 40505.62 188860.8 968 195.1639 192.6691 1.29
N-srcsw 6 0.003510 285 194.683 0.000 55465.3
Aa1-scbf 6 0.009860 101 0.000 0.000 0
Aa3-scbf 6 0.009300 108 0.000 0.000 0
Ra-scbf 6 0.004360 229 405.000 0.000 92889.91

Brandmeier | 17
TECHNICAL REPORT 4
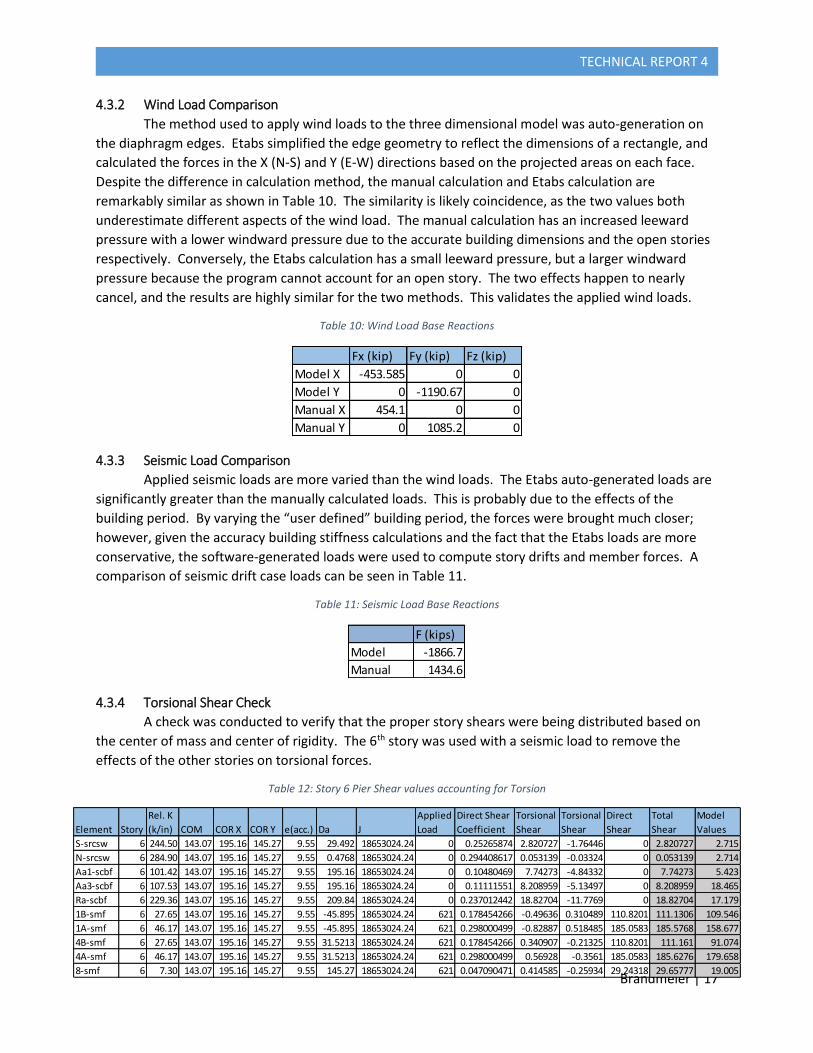
4.3.2 Wind Load Comparison
The method used to apply wind loads to the three dimensional model was auto-generation on
the diaphragm edges. Etabs simplified the edge geometry to reflect the dimensions of a rectangle, and
calculated the forces in the X (N-S) and Y (E-W) directions based on the projected areas on each face.
Despite the difference in calculation method, the manual calculation and Etabs calculation are
remarkably similar as shown in Table 10. The similarity is likely coincidence, as the two values both
underestimate different aspects of the wind load. The manual calculation has an increased leeward
pressure with a lower windward pressure due to the accurate building dimensions and the open stories
respectively. Conversely, the Etabs calculation has a small leeward pressure, but a larger windward
pressure because the program cannot account for an open story. The two effects happen to nearly
cancel, and the results are highly similar for the two methods. This validates the applied wind loads.
Table 10: Wind Load Base Reactions
4.3.3 Seismic Load Comparison
Applied seismic loads are more varied than the wind loads. The Etabs auto-generated loads are
significantly greater than the manually calculated loads. This is probably due to the effects of the
building period. By varying the “user defined” building period, the forces were brought much closer;
however, given the accuracy building stiffness calculations and the fact that the Etabs loads are more
conservative, the software-generated loads were used to compute story drifts and member forces. A
comparison of seismic drift case loads can be seen in Table 11.
Table 11: Seismic Load Base Reactions
4.3.4 Torsional Shear Check
A check was conducted to verify that the proper story shears were being distributed based on
the center of mass and center of rigidity. The 6th story was used with a seismic load to remove the
effects of the other stories on torsional forces.
Table 12: Story 6 Pier Shear values accounting for Torsion
Fx (kip) Fy (kip) Fz (kip)
Model X -453.585 0 0
Model Y 0 -1190.67 0
Manual X 454.1 0 0
Manual Y 0 1085.2 0
F (kips)
Model -1866.7
Manual 1434.6
Element Story
Rel. K
(k/in) COM COR X COR Y e(acc.) Da J
Applied
Load
Direct Shear
Coefficient
Torsional
Shear
Torsional
Shear
Direct
Shear
Total
Shear
Model
Values
S-srcsw 6 244.50 143.07 195.16 145.27 9.55 29.492 18653024.24 0 0.25265874 2.820727 -1.76446 0 2.820727 2.715
N-srcsw 6 284.90 143.07 195.16 145.27 9.55 0.4768 18653024.24 0 0.294408617 0.053139 -0.03324 0 0.053139 2.714
Aa1-scbf 6 101.42 143.07 195.16 145.27 9.55 195.16 18653024.24 0 0.10480469 7.74273 -4.84332 0 7.74273 5.423
Aa3-scbf 6 107.53 143.07 195.16 145.27 9.55 195.16 18653024.24 0 0.11111551 8.208959 -5.13497 0 8.208959 18.465
Ra-scbf 6 229.36 143.07 195.16 145.27 9.55 209.84 18653024.24 0 0.237012442 18.82704 -11.7769 0 18.82704 17.179
1B-smf 6 27.65 143.07 195.16 145.27 9.55 -45.895 18653024.24 621 0.178454266 -0.49636 0.310489 110.8201 111.1306 109.546
1A-smf 6 46.17 143.07 195.16 145.27 9.55 -45.895 18653024.24 621 0.298000499 -0.82887 0.518485 185.0583 185.5768 158.677
4B-smf 6 27.65 143.07 195.16 145.27 9.55 31.5213 18653024.24 621 0.178454266 0.340907 -0.21325 110.8201 111.161 91.074
4A-smf 6 46.17 143.07 195.16 145.27 9.55 31.5213 18653024.24 621 0.298000499 0.56928 -0.3561 185.0583 185.6276 179.658
8-smf 6 7.30 143.07 195.16 145.27 9.55 145.27 18653024.24 621 0.047090471 0.414585 -0.25934 29.24318 29.65777 19.005

Brandmeier | 18
TECHNICAL REPORT 4
4.3.5 Equilibrium Check
An equilibrium check was conducted for wind at the base story (model story 1). Compare the
440.5 kip total value from Table 13 with the previous 453.6 kip total base shear from Table 10. The
difference of 13 kips can be explained by the residual stiffnesses of the shear walls and braced frames in
the out-of-plane direction due to fixed connections at the bases. This source of error is minimal;
however, a more detailed refinement could be undertaken to eliminate out-of-plane shears by adjusting
the base fixities.
Table 13: Story 1 Wind Forces in the X (N-S) Direction
5 CODE AND MEMBER CHECKS
5.1 DRIFT CHECKS The seismic drift for the building is plotted below in Figure 10. Red represents the Y (E-W) axis
and blue, the X (N-S). It is clear that the Y direction is stiffer than the X direction under the same
loading, which makes intuitive sense when comparing the stiffness of concrete shearwalls and braced
frames to that of special moment frames. The largest applicable Cd for the building is 5.5 for special
moment frames. Cd/Ie yields the amplification factor for allowable drift, which in this case is 3.67. The
full calculation can be found on the following pages.
P V2
kip kip
Story1 smf-1B WX Max Bottom 0.372 71.045
Story1 smf-1A WX Max Bottom 7.003 105.246
Story1 smf-4B WX Max Bottom 0.961 71.396
Story1 smf-4A WX Max Bottom 7.469 105.451
Story1 smf-5A WX Max Bottom 0 26.93
Story1 smf-5B WX Max Bottom 0 43.802
Story1 smf-8B WX Max Bottom 0 16.621
Total: 440.491
Story Pier
Load
Case/Co
mbo
Location

Brandmeier | 19
TECHNICAL REPORT 4
Figure 10: Seismic Drifts
Figure 11: Wind Drifts


Brandmeier | 20
TECHNICAL REPORT 4
5.2 MEMBER CHECKS The checks in this section will evaluate one critical member for each element and material type.
Steel Brace
Steel Beam
Steel Column
Concrete Shear Wall Section
The steel members are each part of brace frame “Aa3,” from grid line Aa on the Southernmost
end of the building. The steel brace and column members and their forces under seismic loading (not
seismic drift loading) are shown in Figures 13 through 16. The steel beam on grid line 4 is shown in
figures 17 through 20. The concrete shear wall section is taken from “SWS,” the Southernmost shear
wall.
Figure 12 below shows the locations of the three lateral components on the building plan,
circled in red.
Figure 12: Lateral Component Locations

Brandmeier | 21
TECHNICAL REPORT 4
5.2.1 Brace and Column Member Check
Figure 13: Brace Frame Section Assignments

Brandmeier | 22
TECHNICAL REPORT 4
Figure 14: Brace Frame Axial Forces

Brandmeier | 23
TECHNICAL REPORT 4
Figure 15: Brace Frame Shears

Brandmeier | 24
TECHNICAL REPORT 4
Figure 16: Brace Frame Moments


Brandmeier | 25
TECHNICAL REPORT 4
5.2.2 Beam Check
Figure 17: Special Moment Frame Section Assignments
Figure 18: Special Moment Frame Axial Forces

Brandmeier | 26
TECHNICAL REPORT 4
Figure 19: Special Moment Frame Shears
Figure 20: Special Moment Frame Moments


Brandmeier | 27
TECHNICAL REPORT 4
5.2.3 Concrete Shear Wall Member Check
Rather than a numerical check for the specially reinforced concrete shear wall, this section
provides a qualitative analysis of the resulting shell stresses. Figure 21 shows the F22 vertical stresses in
the wall for the seismic load case in the Y (E-W) direction. Appropriately, the stresses are positive on
one side of the wall and negative on the other, with the extremes at the farthest ends and toward the
bottom. This distribution is consistent with axial forces due to seismic overturning.
Figure 21: Shear Wall Vertical Forces

Brandmeier | 28
TECHNICAL REPORT 4
The horizontal shear stress distribution is more uniform, but shows signs of a conventional shear
distribution including “X” banding across the coupling beams and stress concentrations at corners of the
wall openings. The magnitudes of the shear stresses decrease as the wall height increases, note the
strong corner stresses at the bottom and light stresses at the top. This is also consistent with seismic
loads accumulating in the shear wall from top to bottom.
Figure 22: Shear Wall Shears

Brandmeier | 29
TECHNICAL REPORT 4
6 APPENDIX A: GRAVITY LOADS
Design Criteria (Live Loads) Hospitals Operating rooms, labs 60 PSF * Private rooms 40 PSF * Wards 40 PSF * Corridors (above 1stfloor) 80 PSF *
* Design for uniform load indicated or 1000# concentrated load over 2.5 feet square, whichever produces the greater load effect.
Offices Offices 50 PSF ** Lobbies & 1st floor corridors 100 PSF ** Corridors (above 1st floor) 80 PSF **
** Design for uniform load indicated or 2000# concentrated load over 2.5 feet square whichever produces the greater load effect.
Misc. Live Loads Corridors, except as otherwise indicated 100 PSF Stairs and Exits 100 PSF *** Dining Rooms and Restaurants 100 PSF Retail Stores (first floor) 100 PSF Mechanical rooms 125 PSF (Includes allowance for equipment pads) Storage – Light 125 PSF
*** Design for uniform load indicated or 300# concentrated load over 4 inches square whichever produces the greater load effect Partition loads 20 PSF (Offices & locations where partitions are subject to change) Design Floor Live Loads (Typical unless noted otherwise in calculations) Typical floors: 80 PSF (60 PSF + 20 PSF Partitions) or (80 PSF Corridors) First floor (typical): 100 PSF (60 PSF + 20 PSF Partitions) or (100 PSF Corridors) First floor (equip): 120 PSF (60 PSF + 20 PSF Partitions + 40 PSF Equipment) Mechanical Rooms: 125 PSF Elevator Machine Rooms: 500 PSF Interstitial Level: 25 PSF Roof Top Mechanical Unit Support: 50 PSF (Live Load + Snow Load) Other Live Loads Handrails and guards 50 PLF or 200# concentrated load @ top rail Components 50# over 1 foot square Grab bars, shower seats, dressing rm. seats250# load in any direction at any point

Brandmeier | 30
TECHNICAL REPORT 4
Impact Loads Elevator loads shall be increased by 100 percent for impact Machinery weight shall be increased to allow for impact Elevator machinery: 100 percent Light machinery, shaft or motor driven: 20 percent Reciprocating machinery or power driven units: 50 percent Hangers for floors or balconies: 33 percent Live Load Reduction Live loads to columns will be reduced in accordance with IBC Section 1607.9.1. Live loads that exceed 100 PSF and roof live loads will not be reduced. Distribution of Floor Loads Uniform floor live loads shall be patterned to produce the greatest effect on continuous framing. Roof Loads Uniform roof live loads shall be patterned to produce the greatest effect on continuous framing. Minimum roof load will be less than snow load See section 1607.11 for other roof loads (roof gardens, landscaped roofs, canopies) Interior Walls and Partitions Interior Partitions 5 PSF horizontal pressure Medical Equipment MRI Equipment (four pt loads) 29000 lb/4 = 7250 lb MRI Equip minus equip allowance 7250 lb – (40 PSF)*(25 ft2) = 6250 lb

Brandmeier | 31
TECHNICAL REPORT 4
Design Criteria (Dead Loads) Hospital Floor (Composite slab, 2 Hour) 3" Deck + 3 1/2" LW Conc 48 PSF Beams/Girders/Columns Self Wt (Assume = 9 PSF) Ceiling/Mechanical/Misc 12 PSF 60 PSF (Mass DL = 69 PSF + 10 PSF for Partition Mass) Hospital Roof (Future Floor) (Composite slab, 2 Hour) 3" Deck + 3 1/2" LW Conc 48 PSF Beams/Girders/Columns Self Wt (Assume = 9 PSF) Ceiling/Mechanical/Misc 12 PSF Roofing/Insulation/Ballast 18 PSF 78 PSF (Mass DL = 87 PSF) Hospital Roof (No future floors) (Composite slab, 2 Hour) 3" Deck + 3 1/2" LW Conc 48 PSF Beams/Girders/Columns Self Wt (Assume 9 PSF) Ceiling/Mechanical/Misc 12 PSF Roofing/Insulation/Ballast 18 PSF 78 PSF (Mass DL = 87 PSF) Power Plant Roof (No future floors) (Composite slab, 2 Hour) 3" Deck + 3 1/2" LW Conc 48 PSF Beams/Girders/Columns Self Wt (Assume 9 PSF) Ceiling/Misc 7 PSF Mechanical Piping 60 PSF Roofing/Insulation/Ballast 18 PSF 133 PSF (Mass DL = 142 PSF) Penthouse Floor (Composite slab, 2 Hour) 3" Deck + 3 ½" LW Conc 48 PSF Beams/Girders/Columns Self Wt ( Assume = 9 PSF) Mechanical/Misc 12 PSF 60 PSF (Mass DL = 69 PSF + 10 PSF for Partition Mass) Penthouse Roof (Steel Roof Deck) Steel Deck 3 PSF Beams/Girders/Columns Self Wt ( Assume = 7 PSF) Mechanical/Misc 7 PSF Roofing/Insulation/Ballast 18 PSF 28 PSF (Mass DL = 35 PSF) Roof Top Mechanical Unit Support Beams/Girders/Columns Self Wt ( Assume = 7 PSF) Mechanical Unit 60 PSF Miscellaneous Pipes & Ducts 15 PSF 75 PSF (Mass DL = 82 PSF) Hospital Floor – Piping Zone (Composite slab, 2 Hour) 3" Deck + 3 1/2" LW Conc 48 PSF Beams/Girders/Columns Self Wt (Assume = 9 PSF) Mechanical Piping 60 PSF Ceiling/Misc 7 PSF 115PSF (Mass DL = 94 PSF + 10 PSF for Partition Mass) Hospital Floor/Power Plant (Composite slab, 2 Hour)

Brandmeier | 32
TECHNICAL REPORT 4
3" Deck + 3 1/2" LW Conc 48 PSF Beams/Girders/Columns Self Wt (Assume = 9 PSF) Mechanical Piping 60 PSF Ceiling/Misc 7 PSF 115PSF (Mass DL = 94 PSF + 10 PSF for Partition Mass) Hospital Floor – MRI Zone (Composite slab, 2 Hour) 3" Deck + 3 1/2" LW Conc 48 PSF Beams/Girders/Columns Self Wt (Assume = 9 PSF) 2" Concrete Topping 18 PSF Mass for Permanent Equip (15 PSF Mass DL) Ceiling/Mechanical/Misc 12 PSF 78 PSF (Mass DL = 102 PSF + 10 PSF for Partition Mass) Hospital Floor – Piping Zone plus MRI Zone (Composite slab, 2 Hour) 3" Deck + 3 1/2" LW Conc 48 PSF Beams/Girders/Columns Self Wt (Assume = 9 PSF) 2" Concrete Topping 18 PSF Mass for Permanent Equip (15 PSF Mass DL) Mechanical 30 PSF Ceiling/Misc 7 PSF 103 PSF (Mass DL = 127 PSF + 10 PSF for Partition Mass) MOB Floor (Non-Composite slab, 0 Hour) 1 ½" Deck + 2" LW Conc 29 PSF Beams/Girders/Columns Self Wt (Assume 9 PSF) Ceiling/Mechanical/Misc 7 PSF 36 PSF (Mass DL = 45 PSF + 10 PSF for Partition M ass)

Brandmeier | 33
TECHNICAL REPORT 4
7 APPENDIX B: WIND LOADS

Brandmeier | 34
TECHNICAL REPORT 4

Brandmeier | 35
TECHNICAL REPORT 4
8 APPENDIX C: SEISMIC LOADS

Brandmeier | 36
TECHNICAL REPORT 4
Categories Parameter Value Units Description Reference
Occ. Category IV Occupant Category Table 1-1
Site Class D Site Class (A, B, C, D, E, or F) Chapter 20
SDC D Seismic Design Category 11.6-11.7
IE 1.50 Seismic Importance Factor Table 11.5-1
SS 0.414 Short Period MCE Spectral Response Acceleration (%g) Figure 22-1
S1 0.163 One Second MCE Spectral Response Acceleration (%g) Figure 22-1
Fa 1.468 Site Coefficient at Short Periods Table 11.4-1
Fv 2.148 Site Coefficient at 1 Second Period Table 11.4-2
TL 12.00 s Long-period Transition Period Figure 22-15
Tb 999.00 s Building Period determined from Modal Analysis
Ct 0.02 Building Period Coefficient 12.8.1.1
x 0.75 Building Period Coefficient
hn 106.00 ft Height of building
Cu 1.47
N 0.00 # Number of Stories (leave blank unless apprx Ta desired)
R 6.00 Response Modification Coefficient Table 12.2-1
Ω 2.50 Overstrength Factor Table 12.2-1
Cd 5.00 Deflection Amplication Factor Table 12.2-1
Concrete/masonry
shear walls? NO
Direction X X or Y?
Ab 1200 sqft Area of base of Structure
Categories Calculated Values Value Units Description Reference
SMS 0.608 Short Period MCE Spectral Response Acc., site adjusted Eq. 11.4-1
SM1 0.350 One Second MCE Spectral Response Acc., site adjusted Eq. 11.4-2
SDS 0.405 5% Damped Design Spectral Response Acc. at Short Periods Eq. 11.4-3
SD1 0.233 5% Damped Design Spectral Response Acc. at 1 Second Period Eq. 11.4-4
Sa 2.981 Design Spectral Response Acceleration 11.4.5
Ta 0.66 s Approximate Fundamental Period 12.8.2
T0 0.12 s
Ts 0.58 s
T 0.97 s Period of the Structure
Cw 0.00 Shear Wall Coefficient 12.8-10
Cs 0.060 T<=TL
Cs 0.101 T>TL
Cs 0.101 S1>0.6g
Cs final 0.060 Seismic Response Coefficient 12.8.1.1
Base Shear V 1434.59 Base Shear
Periods
Seismic
Response
Coefficients
Seismic
Response
Site Code
Factors
Design Parameters
Period
SFRS
Coefficients
Shear Wall
Data
Intermediate Calculations

Brandmeier | 37
TECHNICAL REPORT 4
Story Dia. Wx (kips) Hx (ft) k Hxk Wx*Hxk Cvx Fx 0.2SdsIwpx 0.4SdsIwpx Fpx (diaph.)
First Floor 1 5076.90 16.00 1.23 30.66 155682.65 0.05 77.89 617.10 1234.20 617.10
Second Floor 2 4987.50 32.00 1.23 72.16 359902.54 0.13 180.07 606.23 1212.47 606.23
Third Floor 3 3417.40 46.00 1.23 112.95 385998.01 0.13 193.12 415.39 830.77 415.39
Fourth Floor 4 3417.40 60.00 1.23 156.80 535862.22 0.19 268.10 415.39 830.77 415.39
Fifth Floor 5 3147.40 74.00 1.23 203.15 639381.21 0.22 319.90 382.57 765.14 382.57
Roof 6 3141.90 88.00 1.23 251.60 790509.88 0.28 395.51 381.90 763.80 395.51
Penthouse Roof 7 640.00 106.00 1.23 316.59 202619.66 0.07 101.37 77.79 155.58 101.37
1.23 0.00 0.00 0.00 0.00 0.00 0.00 0.00
1.23 0.00 0.00 0.00 0.00 0.00 0.00 0.00
1.23 0.00 0.00 0.00 0.00 0.00 0.00 0.00
1.23 0.00 0.00 0.00 0.00 0.00 0.00 0.00
1.23 0.00 0.00 0.00 0.00 0.00 0.00 0.00
1.23 0.00 0.00 0.00 0.00 0.00 0.00 0.00
1.23 0.00 0.00 0.00 0.00 0.00 0.00 0.00
1.23 0.00 0.00 0.00 0.00 0.00 0.00 0.00
1.23 0.00 0.00 0.00 0.00 0.00 0.00 0.00
1.23 0.00 0.00 0.00 0.00 0.00 0.00 0.00
23828.50 422.00 7.41 827.33 2867336.51 1.00 1434.59 2933.56
Story Data and Forces