ssaattnnaamm oovveerrsseeaass lliimmiiitteeedd · customer relationship management and increased...
TRANSCRIPT

Ø Incorporated in 1989, Satnam Overseas Limited (SOL) is an
emerging global food company with a strong flagship brand “Kohinoor”.
Ø The company has global infrastructure with two subsidiaries in the US and UK, a rice polishing mill in the UK and a Joint Venture in the UAE. It supplies to 57 countries worldwide through 45 distributors and has long term relationships with leading global retail chains such as Tesco, Harrods, Costco, Coles, BJ’s, Somerfield, Whole Food, Tiger Brands International etc.
Ø SOL has state-of-art manufacturing infrastructure with fully automated facilities of 40 MTPH for Basmati rice and 50,000 pouches per day for packaged food. The company has a strong domestic distribution network with 129 distributors, 475 stockists and 215,000 retailers.
Ø SOL has well established global quality processes. The company is ISO 9002 certified and has received the In Process Quality Control (IPQC) certification from the Government of India and the Hazard Analysis & Critical Control Points (HACCP) Certification. The manufacturing facilities are US-FDA, EU-FSA compliant, Kosher and British Retail Consortium certified.
Ø The company has won the export excellence award for 13 years in a row from Agricultural & Processed Foods Export Development Authority (APEDA) and has received National Award for exceptional quality from the Government of India. It was awarded the prestigious “Brand Equity” Award by the Indian Ministry of Commerce and also received the “Trend & Innovation Award” for its Kohinoor ‘Rice & Curry’ range of ready meals at SIAL 2004, the world’s second largest food fair. Also, SOL’s food stall was rated ‘3rd Best Selling’ amongst participants from 108 countries in the 2005 World Exposition held in Aichi, Japan.
Financial Summary (Rs. mn)
Particulars FY’02 FY’03 FY’04 FY’05 Net Sales 3,504.84 4,538.99 5,321.76 5,066.10 Operating Profits 233.29 266.27 325.92 379.38 OPM (%) 6.7% 5.9% 6.1% 7.5% Net Profits 73.54 94.91 129.76 154.79 NPM (%) 2.1% 2.1% 2.4% 3.1% EPS 3.75 4.84 6.62 7.90 Net Worth 767.99 844.71 945.25 1,059.84 RONW (%) 9.6% 11.2% 13.7% 14.6% ROCE (%) 8.1% 8.3% 9.1% 9.1% Debt/Equity (X) 2.54 2.89 2.46 2.51
Strategies and Services for Stakeholder Success
August 9, 2005
India
Food Processing
Reuters: SATN.BO
Bloomberg: STO@IN
Fiscal Year: April-March
Market Cap
Rs. 1,738.52mn
Outstanding Shares
19.6mn
Non-Promoter holding
55.97%
3M avg trading volume
199,779.2shares
52-week high/low
Rs. 130.95/58
Current Price
Rs. 88.7/-
Shareholding Pattern
Promoters 44.03%
FIIs 31.08%
Indian FIs 0.05%
Corp Bodies 10.86%
Others 13.98%
Stock Performance (%)
1M 3M 9M
Absolute 2 7 6
Relative (3) (9) (19)
9M Performance vs Nifty
Source: NSE
www.four -s.com
Indexed to 100
SSSaaatttnnnaaammm OOOvvveeerrrssseeeaaasss LLLiiimmmiiittteeeddd Initiating Coverage
Company Background
Valuation (Trailing) P/E P/B EV/Sales EV/EBIDTA 10.23 1.64 0.85 10.74
Source: Company, Four-S Research
0%
40%
80%
120%
160%
200%
No
v-04
Jan-
05
Mar
-05
May
-05
Jul-
05
Satnam NIFTY

Page 2 of 2
Research Report: Satnam Overseas Limited.
Ø Emerging Global Food Company with strong brand equity of the
flagship brand ‘Kohinoor’
q Ready-to-eat foods to add to top line and profitability. From 5 variants in FY’04, the company today has over 100 variants contributing to 1.8% of total sales with exports to 15 countries. Sales grew from Rs. 49.8mn in FY’04 to Rs. 90.9mn in FY’05. With a well-planned expansion from 7,000 pouches to 50,000 pouches in FY’05, strong brand equity and a well-oiled distribution network, SOL is well on its way to become a global food company.
Ø Branded Exports to drive top-line growth. Growth in Branded
Basmati Exports (growing at a CAGR of 66.2% over the last three years) to continue with the company entering 5 new export markets last year including China & Japan.
o SOL has demonstrated its ability to explore and supply to new
markets. It entered Iran in FY’05 and within the first year executed orders of around 7,000MT. In FY’06 also, it plans to enter new lucrative markets.
o New UK factory of 8 MTPH to start supplying to big retail
chains in Europe like Sainsburys, Tesco, Somerfield etc. The new initiative will help drive sales in Europe through better customer relationship management and increased brand presence of Kohinoor.
o Recently inked strategic alliance with a leading business
enterprise of Saudi Arabia will drive branded revenues from the world’s largest Basmati rice market.
Ø Global infrastructure, distribution network and long term
relationships with global chains to push exports of “Ready to Eat” and “Frozen Foods” business
q Global infrastructure with two subsidiaries in the US and UK, a rice polishing mill in UK and a Joint Venture in the UAE helps strengthen relationship with big retail stores. It has strong relationships with leading global retail chains such as Tesco, Harrods , Costco, Coles, BJ’s, Somerfield, Whole Foods, Tiger Brands International, etc. The company has created its own distribution network in 45 countries to cater to the needs of the customer faster.
Investment Positives
Strong global brand ‘Kohinoor’ Strong global infrastructure, distribution network and associations to drive sales New products, geographies and alliances to drive top-line growth SOL entering ‘largest market’ Saudi Arabia with its own brand Establishing itself as a ‘Comprehensive Food Company’

Page 3 of 3
Research Report: Satnam Overseas Limited.
Ø Foray into the Frozen Food business. Frozen foods to start
contributing to the top-line and profitability by Q3 FY’06. The company has already placed orders for state-of-the-art machinery including freezers from Frigoscandia of Sweden and packing line from G. Mondini of Italy.
Ø Strong brands “Kohinoor” and “Trophy” to drive growth in the
domestic market. SOL, with strong brand equity of Kohinoor and Trophy and supported by a strong distribution network of 129 distributors, 475 stockists and 215,000 retailers across the country, is well positioned to capture the high growing domestic market. The share of Basmati rice in total rice consumption has steadily increased from 0.6% in FY’01 to 1.4% in FY’04 driven by increasing disposable incomes and an expanding consuming class. Domestic Branded Basmati sales of SOL increased at a CAGR (3 years) of 12.5%.
Ø De-risked business model. SOL has well-diversified revenue
streams: Premium Basmati Rice (Kohinoor), Value Basmati Rice (Trophy) and Ready-to-eat food products. The company has well diversified exports in 57 countries and no customer accounts for more than 5% of sales.
Ø Focus on branded business to drive margins. Over the years, the
proportion of sales from low value added private labeling and commodity business has declined from 69% in FY’03 to 51% in FY’05, whereas, branded sales increased to 48.9% in FY’05.
Ø Commitment to global quality standards to give competitive
edge and to help SOL break into big stores in the export markets. SOL is the first ISO 9002 certified Indian company in its category and also recipient of the IPQC and HACCP Certification. Its manufacturing facilities are US-FDA and EU-FSA compliant, Kosher and British Retail Consortium certified. SOL has also received National Award for exceptional quality from the Government of India.
Ø Innovative and pro active management evolving the company to
Food Company. SOL has been an industry trendsetter in v Importing machines for processing to standardize product quality v Branding products in the Indian Basmati market v Appointing exclusive distributors v Creating smaller and attractive packaging v Print advertising & celebrity endorsement of products v Diversifying into related food business
Entering Frozen Foods - to start contributing to top line by Q3, 2005 Increasing GDP and expanding consuming class to drive domestic growth for Kohinoor Well-diversified revenue streams Branded Sales to improve margins Quality Certifications advantage in gaining orders Industry trendsetter in branding, distribution and technology

Page 4 of 4
Research Report: Satnam Overseas Limited.
Ø High Working Capital Requirement. Basmati Rice needs to be
aged for 9-12 months before selling leading to huge working capital requirements. This results in low ROCE for the industry. Combating this risk, an efficient working capital management system has been set in place by SOL and cash flow is monitored on daily basis.
Ø Rice is a natural product dependent on the vagaries of nature. Ø Geographical concentration. Basmati paddy is concentrated in a
small region of the world, therefore, any natural or other calamity could be adverse for the industry. However, adequacy of irrigation facilities in the Basmati producing regions mitigates these uncertainties.
Ø Difficult to brand a generic natural product like rice. The product
is natural and therefore it is very difficult to maintain consistent quality and thus differentiate. The only differentiation could be in the meticulous process of sorting and packaging.
Ø Package Food Industry at a nascent stage. The industry, at a
nascent stage in India, has yet to display a success story. Currently it faces several problems including the high price of processed food, fragmented supply chain, lack of infrastructure, low FDI and the lack of a proper legal framework. The Ready-to-Eat segment is characterized by high competition, with big players like ITC, MTR, Tasty Bites and Dabur at the national level and several local brands. However, the industry’s nature provides immense opportunity for SOL having strong systems and infrastructure, extensive distribution network and access to best technology for package food business.
Investment Risks
Seasonal Industry with high working capital requirement Crop depends on climatic conditions Difficulty in branding a natural product High competition in the Food Business
Industry

Page 5 of 5
Research Report: Satnam Overseas Limited.
18.0%
53.0%
47.1%34.1%30.9%37.5%
16.1%23.9%
15.1%1.8%
0.9%
36.0%41.1%44.4%
0%
25%
50%
75%
100%
FY'02 FY'03 FY'04 FY'05
Branded Basmati Rice Unbranded Basmati RiceFood Commodity & Others
Ø Basmati rice – Branded and Unbranded with sales of Rs. 3,153mn
constituted 62.2% of revenues while, ready-to-eat foods, into which the company diversified in 2004, constituted 1.8% of FY’05 revenues.
Ø Within the rice segment, the focus of SOL is on branded sales, which
constituted 47.1% of total sales in FY’05, up from 30.9% in FY’03. The declining share of the Unbranded Rice and Commodity segments in FY’05 is a result of the company’s strategy to focus on value added and branded segments.
Ø Branded sales (food and rice) amounting to Rs. 2,476.7mn
constituted almost 50% of the business in FY’05.
37.5% 30.9%48.9%
35.0%
51.1%65.0%69.1%62.5%
0%
25%
50%
75%
100%
FY'02 FY'03 FY'04 FY'05Branded Sales Unbranded/ Commodity Sales
Business Background
De-risking by expanding the Food business Packaged Food Segment constituted 1.8% of sales in FY’05 Branded Sales constitute almost 50% of the business Reduced dependence on low value adding activities SOL moving from Unbranded to Branded sales
Revenue Split
Source: Company, Four-S Research
Source: Company, Four-S Research
In %
In
%

Page 6 of 6
Research Report: Satnam Overseas Limited.
Branded Basmati
Branded Basmati Sales
2,385.7
1,813.6
1,400.41,315.4
0
500
1000
1500
2000
2500
FY'02 FY'03 FY'04 FY'05
Rs
mn
Ø There has been a significant increase in the sales of Branded
Basmati rice at a 3 year CAGR of 22% from Rs. 1,315.4mn in FY’02 to Rs. 2,385.7mn in FY’05 driven by strong exports growth and improvement in realization in domestic market.
Ø Kohinoor, the flagship and the premium brand for the company, constitutes 53% of total branded basmati sales while, Trophy, the value for money brand launched in 1995 constitutes 20.5%.
Ø The sales of brands ‘Kohinoor’ & ‘Trophy’ have grown at a 3 year CAGR of 19.1% and 26.5% respectively.
SALES BREAK-UP OF VARIOUS BRANDS
Business Performance
Brand FY'01 FY'02 FY'03 FY’04 FY'05 Kohinoor 628.53 721.24 689.18 908.98 1,264.48 Shehanshah 26.57 17.07 46.10 91.50 70.56 Trophy 190.95 130.03 177.17 350.89 489.47 Falcon 1.41 9.26 48.33 91.79 208.06 Rose 34.19 31.67 33.99 17.72 14.55 Charminar 50.42 67.76 35.78 37.61 70.33 Delta - - 27.3 72.63 112.67 Three Horse 43.8 49.8 66.4 103.93 152.72 Car - 5.5 - 3.06 1.33 Punjabi Dhaba - 0.72 - - 1.55 Football 1.04 - - - - Other brands 267.3 282.2 206.1 135.57 -
Basmati Sales grew at a 3 year CAGR of 22% SOL exports only the ‘Kohinoor’ brand at present but plans to soon start promoting and exporting its ‘Trophy’ brand Sales growth in Kohinoor & Trophy at a 3 year CAGR of 19.1% & 26.5% respectively
3 year CAGR of 22%
Source: Company, Four-S Research

Page 7 of 7
Research Report: Satnam Overseas Limited.
Ø In FY’00, SOL took a pioneering step by taking the ‘Kohinoor’ brand global. As a result, exports of rice grew exponentially to constitute 31% of branded basmati sales in FY’05 from 12.3% in FY’02. It now plans to begin exporting its ‘Trophy’ brand.
12.3% 14.4% 15.7%31.1%
87.7% 85.6% 84.3%68.9%
0%
25%
50%
75%
100%
FY'02 FY'03 FY'04 FY'05
Branded Basmati - Exports Branded Basmati - Domestic
Branded Basmati - Exports
0 200 400 600 800
FY'02
FY'03
FY'04
FY'05
Sales in Rs. mn
Ø Sales of Branded Basmati Exports have increased at a CAGR of
66.2% in the last 3 years from Rs. 161.8mn in FY’02 to Rs. 742.7mn in FY’05, backed by strong branding and marketing initiatives by the company in North America, UK and EU. UK is the largest export market for branded Basmati having a share of around 23% in total branded export volumes, followed by US with 8% share.
Ø Volumes increased from 8,310.3MT in FY’04 to 27,261.7MT in FY’05. Ø The Company has also been exploring new markets for exports. The
launch of its range of Basmati Rice in Iran has received tremendous response within a very short span of time. It has already sold more than 7,000MT of rice in this market. Other successes have been in China, Mauritius, Australia, New Zealand, Japan, Norway, Egypt, Israel, Ukraine and Romania.
Kohinoor established as a global brand from 2000 onwards Exports increase at 3 year CAGR of 66.2% Major Markets- Saudi Arabia, UK and USA
Growth in Exports
Source: Company, Four-S Research
Source: Company, Four-S Research
In %
Page 8 of 8
Research Report: Satnam Overseas Limited.
Branded Basmati - Domestic
0 500 1000 1500 2000
FY'02
FY'03
FY'04
FY'05
Sales in Rs. mn
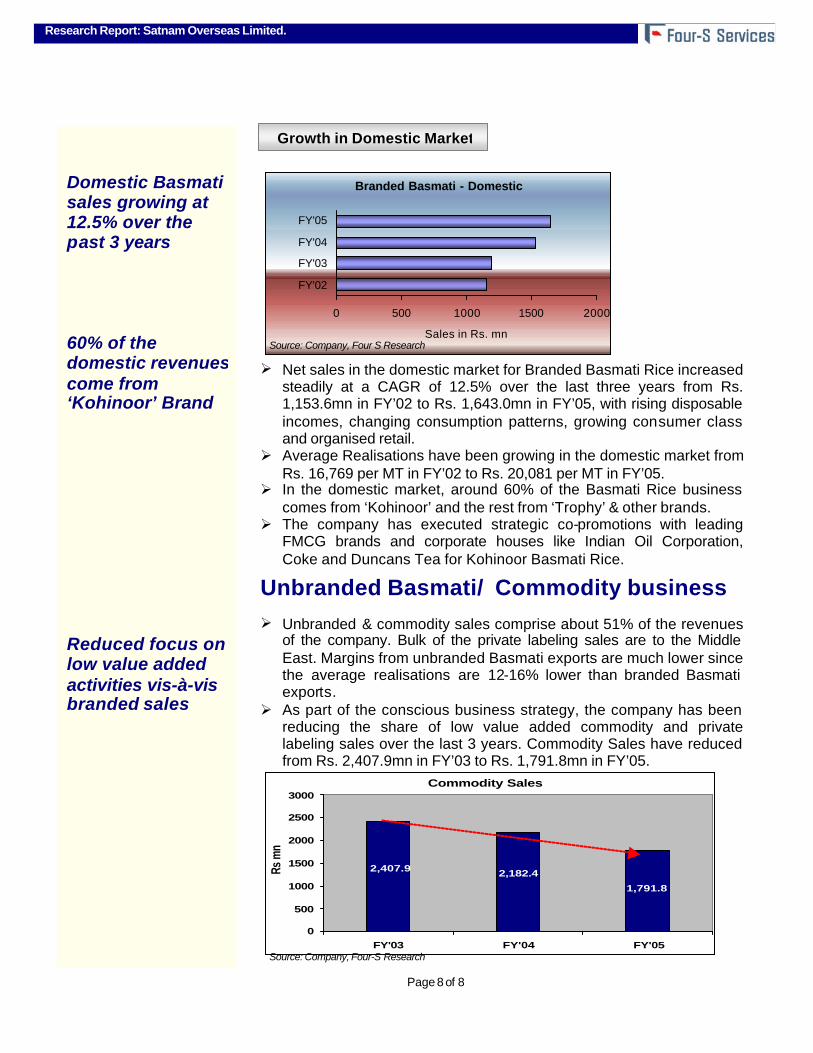
Ø Net sales in the domestic market for Branded Basmati Rice increased
steadily at a CAGR of 12.5% over the last three years from Rs. 1,153.6mn in FY’02 to Rs. 1,643.0mn in FY’05, with rising disposable incomes, changing consumption patterns, growing consumer class and organised retail.
Ø Average Realisations have been growing in the domestic market from Rs. 16,769 per MT in FY’02 to Rs. 20,081 per MT in FY’05.
Ø In the domestic market, around 60% of the Basmati Rice business comes from ‘Kohinoor’ and the rest from ‘Trophy’ & other brands.
Ø The company has executed strategic co-promotions with leading FMCG brands and corporate houses like Indian Oil Corporation, Coke and Duncans Tea for Kohinoor Basmati Rice.
Unbranded Basmati/ Commodity business Ø Unbranded & commodity sales comprise about 51% of the revenues
of the company. Bulk of the private labeling sales are to the Middle East. Margins from unbranded Basmati exports are much lower since the average realisations are 12-16% lower than branded Basmati exports.
Ø As part of the conscious business strategy, the company has been reducing the share of low value added commodity and private labeling sales over the last 3 years. Commodity Sales have reduced from Rs. 2,407.9mn in FY’03 to Rs. 1,791.8mn in FY’05.
Commodity Sales
1,791.8
2,182.42,407.9
0
500
1000
1500
2000
2500
3000
FY'03 FY'04 FY'05
Rs m
n
Growth in Domestic Market
Source: Company, Four S Research
Domestic Basmati sales growing at 12.5% over the past 3 years 60% of the domestic revenues come from ‘Kohinoor’ Brand Reduced focus on low value added activities vis-à-vis branded sales
Source: Company, Four-S Research

Page 9 of 9
Research Report: Satnam Overseas Limited.
Branded Basmati Exports Ø SOL has made a major breakthrough in the UK market in FY’05 by
entering into a tie up with Tesco, the largest retail chain of UK to sell Kohinoor Basmati Rice.
Ø Other major breakthroughs in mainstream markets: Ø The brand ‘Trophy’ is soon to be launched globally. Ø The company has started production in its rice-processing mill in the
UK to qualify as a supplier to large chain stores that control 80% of the total Basmati retail in the UK.
Ø It is finalizing an alliance with a leading business enterprise of Saudi
Arabia, to market its range of Basmati rice. Branded Basmati Domestic Ø The company has executed strategic co-promotions with leading
FMCG brands and corporate houses in the domestic market like Indian Oil Corporation, Coke, and Duncans Tea for Kohinoor Basmati Rice.
Ø It also entered into a co-promotion with Sandesh group of
publications, publishers of the leading newspaper from Gujarat, for promotion of its Kohinoor Basmati rice.
Ø The company conducted an extensive advertising campaign to
promote its ‘Trophy Gold’ Basmati rice in the domestic market. It has started supplying Trophy Basmati Rice to Pizza Hut & KFC outlets .
Ø Over the years, SOL has been consistently adding new markets and
distributors to its list.
Initiativ es and Growth Strategy Tie-ups with large retail chains like Tesco, Costco, Coles, Seven Eleven, etc. ‘Trophy’ soon to be launched globally Co-promotions with IOC, Coke and Duncans Tea for ‘Kohinoor’ Basmati Rice Supplying ‘Trophy’ to Pizza Hut & KFC outlets
Somerfield, UK FY'06 Costco, Canada FY'05 Hankyu, Daimaru, Takashimaya, Mitsukoshi in Japan
FY'05
Coles & Woolworth, Australia FY'05
Seven Eleven, Singapore FY'05

Page 10 of 10
Research Report: Satnam Overseas Limited.
Packaged Foods Ø In 2001, SOL entered the packaged foods sector. It was a synergistic
move to leverage the ‘Kohinoor’ brand strength, organization marketing capabilities in the domestic as well as in the global markets.
Ø The division commenced operations in FY’04 with the launch of 5 variants and with an installed capacity of 7,000 pouches of Ready-to-Eat foods. As of FY’05, SOL has more than 100 variants in the market with a capacity of 50,000 pouches per day.
Ø Revenues from food business have grown from Rs. 49.8mn to Rs. 90.9mn in FY’05.
28.3
64.9
26.121.6
0
10
20
3040
50
60
70
FY'04 FY'05
Rs
mn
Exports Domestic
Ø Exports have grown faster than the domestic market. Traditionally,
Indian Food Products have been popular mainly in the ethnic markets abroad, but rising popularity of Indian Food has led to an increased demand from the mainstream market as well. This market contributes huge volumes of convenience food products and the company expects to take an early lead in this sector.
Ø The Bahalgarh plant is exclusively built for this segment with a capacity of 50,000 pouches a day.
Ø In the Food segment SOL is facing competition from players like MTR, Ashoka and Tasty Bites.
Ø Exports from the segment increased from Rs. 28.3mn in FY’04 to Rs. 64.9mn in FY’05 while domestic sales increased from Rs. 21.6mn in FY’04 to Rs. 26.1mn in FY’05.
McKinsey estimates CAGR in domestic market to be 200% over the next 2 years Bahalgarh plant built exclusively for the Food Segment of the company Global competitors in the segment include MTR, Ashoka and Tasty Bites
READY-TO-EAT CATEGORIES Heat and Rice Curries (More than 20 variants) Heat and Eat Desserts Rice & Curry – Ready Meals (15 variants) Rice Treat Chutney
READY TO COOK CATEGORIES Rice & Spice Cook-in Sauces Cooking Pastes
Product Lines
Source: Company, Four-S Research
Page 11 of 11
Research Report: Satnam Overseas Limited.
Ø SOL entered strategic co-promotions in the domestic market for
Kohinoor ‘Heat & Eat Curries’ with Pizza Hut and Malaysian Airlines. Ø The company commenced commercial production at its newly set up
Bahalgarh food processing facility for development of innovative, healthy, nutritious food products.
Ø It set up an independent food division to look after the sales and
marketing of its new range of ready-to-eat products. It is also in the process of revamping its distribution network and has already appointed a separate distributor in Mumbai.
Ø The company entered into a tie up with Tesco, UK for 3 new food
product lines namely Kohinoor ‘Rice & Curry’, Kohinoor ‘Cooking Pastes’, ‘Chutneys & Indian spices’.
Ø SOL is increasing its product basket by diversifying into the Frozen
Food business. The company has already placed an order for state-of-the-art machinery including freezers from Frigoscandia of Sweden and packing line from G. Mondini of Italy.
Ø The company is planning a capacity expansion in the food plant from
50,000 to 75,000 pouches per day along with expansion of its portfolio of products.
Ø SOL is constantly looking at enhancing its portfolio through mergers
& acquisitions
Initiatives & Growth Strategy Strategic co-promotions with Pizza Hut and Malaysian Airlines Independent food division to look after sales & marketing Foraying into the Frozen Foods business

Page 12 of 12
Research Report: Satnam Overseas Limited.
Source: Company, Four-S Research Ø SOL has 100% in-house production capabilities to maintain
standardized quality through state -of-the-art fully automated plants in two key Basmati rice producing states, Haryana and Punjab. The plants are: –HACCP and ISO 9001:2000 certified –US-FDA and EU-FSA compliant –Kosher Certified –British Retail Consortium certified
Ø The company has set up a rice-processing mill in the UK to qualify as
a supplier to large chain stores that control 80% of the total Basmati retail in the UK.
Ø The commitment to quality has resulted in the Company getting the
coveted ISO 9002 Certification. Ø SOL has an in-house state of the art Quality Control Laboratory that
checks the attributes of paddy and ensures standardization of quality, texture and colour of the Basmati rice and allied products.
2001-02 2002-03 2003-04 2004-05 Installed Capacity
M.T.P.H. 32 40 40 40
Pouches/day 10,000 50,000
Production Facilities 100% in-house production capabilities First Indian company in its category to get ISO9002 certification State-of-the-art, fully automated facilities with cutting-edge technology help in maintaining quality
Page 13 of 13
Research Report: Satnam Overseas Limited.
Ø SOL has developed an extensive distribution network that covers
India and key global markets. In the domestic market, the company has 129 national distributors supporting 475 stockists to reach over 2,15,000 retailers, with its own offices in Delhi, Mumbai and Bangalore. For exports, it has offices in the US, UK, and Dubai and distributors in 45 countries.
Ø Today, SOL has associations with leading food companies, mainstream retail chains and prestigious institutional buyers like § Tesco & Somerfield, UK § Coles and Woolworth, Australia § Tiger Brands International, South Africa § Amway India Enterprise § Malaysia Airlines § Costco, Canada § BJ’s and Whole Food, U.S.A. § Japanese Chains and many more
Ø SOL set up an independent food division to take care of sales and marketing of its new range of ready-to-eat products.
US Operations
Ø Satnam Overseas Limited Inc., the company’s fully owned subsidiary, is based in New Jersey targeting US and Canadian markets. Proximity to the customer in these markets gives Satnam an edge over competition in winning orders. In the US, it has a team of 7 senior officials.
Ø Direct distribution comprises 50% of total sales while the remaining 50% comes through distributors to big stores like Costco, BJ’s, Whole Foods, etc.
UK Operations Ø SOL has a 100% owned subsidiary, headquartered in London, with
an employee strength of 10 to target the European markets. Ø The company has set up a rice mill in the UK with a capacity of 8
MTPH to qualify as a supplier to large chain stores that control 80% of the total Basmati retail in the UK.
Middle East Operations Ø SOL has a 25% stake in Rich Rice Raisers Factory L.L.C, which
operates from Dubai. This Joint Venture caters to the huge Middle East market.
Ø All sales are through direct distribution.
Sales & Distribution
Plans to generate huge volumes from the mainstream market Independent Food division for sales and marketing Set up a rice mill in UK to qualify as a supplier to large chain stores Presence in the largest Basmati export market

Page 14 of 14
Research Report: Satnam Overseas Limited.
0
1000
2000
3000
4000
5000
6000
FY'02 FY'03 FY'04 FY'05
Rev
enue
s in
Rs
mn
0%
2%
4%
6%
8%
10%
12%
Prof
itabi
lity
Revenue Operating Margins
Ø Revenues of the company dipped to Rs. 5,066.1mn in FY’05 mainly
due to reduced sales from low value added Commodity and Private Labeling activities.
o Branded sales increased by 33% to Rs. 2,476.7mn in FY’05 from Rs. 1,861.5mn in FY’04.
o Strong Branded Basmati Exports growth of 161% in sales from Rs. 285.0mn in FY’04 to Rs. 742.7mn in FY’05, due to addition of 5 new countries in the export portfolio.
Ø The EBIDTA margin increased from 6.1% in FY’04 to 7.5% in FY’05
due to increased proportion of sales from high margin branded Basmati and food products.
Ø Net Profit increased by 19.3% to Rs. 154.8mn in FY’05 as compared
to Rs. 129.8mn in FY’04 due to increase in operating profit margins and better working capital management.
050
100150200250300350400
FY'02 FY'03 FY'04 FY'05
Rev
enue
s in
Rs
mn
0%
2%
4%
6%
8%
10%
12%
14%
Pro
fitab
ility
PBIT ROCE
Source: Company, Four-S Research
Ø ROCE increased in the last three years from 8.3% in FY’02 to 9.1%
in FY’05 due to increase in operating profit margins and reduction in interest costs.
Ø The Return on Equity increased from 9.6% in FY’02 to 14.6% in
FY’05.
Drop in revenues due to reduced sales from low value adding Commodity & Private Labeling activities Strong Branded Basmati export growth of 161% YOY EBIDTA margin increased from 6.1% to 7.5% EPS increased to Rs. 7.90 from Rs. 6.62
Financial Performance – Annual
Source: Company, Four-S Research

Page 15 of 15
Research Report: Satnam Overseas Limited.
Capitalisation
Particulars FY’03 FY’04 FY’05Total Debt / Tangible Net Worth (Debt/Equity) 2.89 2.46 2.51 Interest Coverage 1.38 2.27 2.69 Source: Company, Four-S Research
Ø Debt equity of the company declined over the last two years due to increasing reserves of the company as a result of rising profitability and proportionately lesser increase in debt.
Ø The Interest Coverage of the company has increased from 1.38 X in
FY’03 to 2.69 X in FY’05 due to increase in operating margins and lower financial charges.
Liquidity Particulars FY’03 FY’04 FY’05
Current Ratio 20.48 13.14 7.76 Days Receivables (as days of sales) 39.12 25.88 39.37 Days Inventory (as days of cost of sales) 195.07 160.13 208.01 Cash from operations (Rs. mn) (76.66) 530.95 20.39
Source: Company, Four-S Research
Ø Receivable days increased in FY’05 as compared to the previous year due to increased exports during the year.
Ø Inventory Days increased with the increase in branded sales as the
company always sells aged rice under its brands to maintain the quality.
Ø Cash from operations has decreased from Rs. 530.9mn to Rs.
20.4mn due to the increase in Inventory Days & Debtor Days.

Page 16 of 16
Research Report: Satnam Overseas Limited.
Focus on branded sales will lead to sustained long term growth Packaged food business to increase margins Low valuation despite strongest brand and shift towards high value added branded business
Valuation Comparison
ü The company has been benchmarked against Indian companies in
similar business like KRBL, REI Agro, and Lakshmi Overseas.
ü Over the past three years, Satnam’s topline has been growing at 13%, lower than its peers, primarily due to the reduced focus on low value added commodity and private labeling activities. Even though in short term it has reflected in lower growth in sales, the strategy to focus on branded sales will lead to sustained long term growth along with improvement in margins.
ü The company’s margins are at present slightly lower than its peers but are expected to improve due to the foray into packaged food segment. The margins have been lower as compared to peers on account of higher startup expenses in new business lines & higher marketing expenses. However, with increase in sales from packaged food business and reduction in commodity and private labeling activities margins are expected to improve in the future. RICE (Rs. Mn) EPS EV/Sales P/E P/BV EV/EBIDTA Lakshmi Overseas 28.45 0.88 13.71 5.46 9.35 Rei Agro 18.31 1.09 10.13 4.33 10.24 KRBL 10.87 0.74 13.48 1.63 8.51 Satnam 8.67 0.85 10.23 1.64 10.74 Average 0.92 11.25 2.95 9.80
BEVERAGES EPS EV/Sales P/E P/BV EV/EBIDTA Williamson Tea Assam 4.96 1.28 33.87 2.64 20.26 Tata Tea 26.54 5.07 30.26 4.55 31.24 Tata Coffee 24.24 2.69 15.02 2.66 15.34 Glaxo 20.46 1.91 21.55 3.76 11.01 Average 3.24 26.02 4.04 20.30
FMCG EPS EV/Sales P/E P/BV EV/EBIDTA Dabur India 5.47 3.46 27.81 13.46 23.50 Ruchi Soya 19.67 0.22 14.44 1.91 7.86 Marico 13.78 1.71 20.32 7.47 18.21 P & G 30.47 2.82 21.04 6.20 15.24 Average 1.32 22.41 7.55 17.83
ü SOL offers good growth opportunities as it trades at a low P/E of 10.23
compared to its peers in the rice and FMCG industry despite the strong brand, widest distribution network and foray into higher growth and value added packaged food business.
Company Revenue YoY 3 yr CAGR
EBIDTA OPM Net Profit
NPM YoY 3 yr CAGR
Lakshmi Overseas
4,077.1 81.1% 25.3% 349.5 8.6% 218.5 5.4% 138.7% 46.8%
Rei Agro 8,450.2 40.2% 29.8% 873.0 10.3% 378.5 4.5% 80.3% 76.7% KRBL 5,027.4 5.8% 7.4% 406.7 8.1% 162.8 3.2% 14.5% -2.2% Satnam 5,066.1 -4.8% 13.0% 379.4 7.5% 154.8 3.1% 19.4% 28.2%
Source: Four-S Research

Page 17 of 17
Research Report: Satnam Overseas Limited.
0
500
1000
1500
2000
AMJ'04 JAS'04 OND'04 JFM'05 AMJ'05
Reve
nues
in R
s m
n
0%2%4%6%8%10%12%14%16%
Prof
itabl
ity
Net Sales Operating Margins
Source: Company, Four-S Research
Ø The industry is seasonal as it is dependent on nature and climatic
conditions. Capacity utilization is the highest from October to March and work goes on for around 20 hours a day.
Ø Net sales increased by 4.3% in AMJ’05 over AMJ’04. While Branded
Sales were up 24.8% YoY at Rs. 514.5mn, the share of low value added commodity and private labeling sales has been reducing as part of the conscious business strategy.
Ø Operating Profit Margin increased to 9.4% in AMJ’05 from 7.1% in
AMJ’04 due to increase in higher margin branded sales which have risen to 49% in AMJ’05 of revenues as compared to 41% in AMJ’04.
Ø Operating Profits too increased from Rs. 71.7mn in AMJ’04 to Rs.
98.7mn in AMJ’05.
EBIDTA
71.781.9
102.2 107.498.7
0
20
40
60
80
100
120
AMJ'04 JAS'04 OND'04 JFM'05 AMJ'05
Rs
mn
Source: Company, Four-S Research
Financial Performance – Quarterly
Cyclical nature of the business leads to higher revenues in the third and fourth quarter 37.7% increase in EBIDTA in Q1’05 on YoY basis

Page 18 of 18
Research Report: Satnam Overseas Limited.
Ø China is the largest producer of rice in the world with 31% market share followed by India with 20% share. Major exporters of rice are Thailand (10.1mn MT), Vietnam (4.1mn MT) and the United States (3.2mn MT).
Ø Export of rice has emerged as a significant foreign exchange earner for India fetching $ 1.48bn in FY’05. During the year, the exports of Basmati Rice from the country were Rs. 27.42bn and that of Non-Basmati rice were Rs. 39bn.
Exports of Basmati & Non Basmati
1,6947,775
38,997
21,660
2,881
27,419
0
10000
20000
30000
40000
50000
1990-91 2000-01 2004-05Non Basmati Rice Basmati Rice
Source: Four-S Research
Ø Till 1994-95, India was exporting mainly Basmati rice, however, with
the removal of export restrictions on non-Basmati rice w.e.f. March 5, 2002, it has been exporting substantial quantities of non-Basmati rice.
Ø The export contracts of Basmati rice, however, have to be registered with Agricultural and Processed Food Products Export Development Authority (APEDA).
Basmati Rice Ø Basmati has a unique positioning in the rice industry with distinct
aroma, super fine grains and large grain elongation. It therefore commands a premium, fetching up to 4-5 times than common rice varieties in both domestic and International markets.
Ø India accounts for about 70% of the total production of 2.3mn MT of Basmati, while the rest is produced in Pakistan. 70% of the annual produce of 1.4-2mn MT is exported.
Ø Approximately 1mn hectares of land are dedicated to Basmati in India with an average productivity of around 1.4 – 2.1MT a hectare against the yield of non-Basmati paddy of 4.5 – 5.0MT a hectare. Ideally, 100kg of paddy should yield 63-65kg of rice.
Ø Traditional Basmati is grown only in the states of Haryana, Punjab and some parts of Uttar Pradesh & Uttranchal. Haryana accounts for around 60% of the area under Basmati rice in India, followed by Uttar Pradesh with 10% and Punjab with 30%.
Industry Overview
India is the second largest producer of Rice in the world with a 20% share of global rice production India has the largest area in the world under rice cultivation Realizations & Margins are much lower in the Non-Basmati segment as compared to Basmati
In Rs mn

Page 19 of 19
Research Report: Satnam Overseas Limited.
Ø The market, valued at $ 100mn, segments the various varieties of
Basmati rice produced in the country into 3 categories with an average growth of 6%. Branded Basmati is however growing at 8-10%.
Ø According to Industry estimates, branded players control 25% of the
domestic market and the rest is in the realm of the unorganized sector.
Ø ‘Kohinoor’ is the leader, with 38% share of the domestic branded market according to a nationwide survey by TNS and E&Y.
Domestic Market Share
38%
19%15%
6%5% 7%
10%
KohinoorLal KillaDaawatIndia GateNature FreshDouble DeerOthers
Source: Industry, TNS India
Ø Domestic consumption of Basmati has been steadily increasing due to changing preferences, increasing affluence and high per capital income. According to APEDA, the share of Basmati consumption to total rice consumption has been increasing rapidly from 0.6% in FY’01 to 1.4% in FY’04.
Rice consumption in India
Domestic Market
Segment Market Share Brands
Premier 5% Kohinoor, Lal Qilla, Doon, Daawat, Kasauti Value 35% Trophy, Real Magic, Mr. Miller, India Gate Popular 60% Hansraj, Ikon, Aarti, Footbaal
Domestic Basmati and Non-Basmati market is expected to grow at 6% and 3% respectively Growth opportunity in switchover to branded Basmati ‘Kohinoor’ enjoys 38% share in the domestic market Changing preferences of consumers depicted by increasing share of Basmati consumption
Non-Basmati BasmatiFY’01 83 0.5 FY’02 90 0.8 FY’03 67 0.9 FY’04 72 1.0
Source: APEDA, Figures in m tonnes

Page 20 of 20
Research Report: Satnam Overseas Limited.
Basmati Rice Exports
708,793 771,491
1,126,125
0
400000
800000
1200000
FY'03 FY'04 FY'05
Source: Four-S Research
Ø In FY’05, India's exports of Basmati rice were 1.13mn tonne as against 0.77mn tonne the previous year. According to estimates, in value terms, the exports rose to Rs. 27.42bn compared to Rs. 19.9bn in FY’04.
Ø Region wise, Middle East is the largest consumer with a demand of around 425,000 MTA while Britain is the largest consumer of Basmati outside the Indian subcontinent. The two big global producers, India and Pakistan, last year exported 270,000 tons to the European Union, about 70% of which was destined for Britain.
Ø Currently, there are only 11 recognized varieties of Basmati rice notified under Section 5 of the Seeds Act which can be exported from India. These varieties are categorized into — Premium Indian Basmati (Traditional) and Indian Basmati (Crossed/Hybrid).
Exports
Qty in MT
Indian exports crossed the 1mn MT mark in 2004-05 Given the huge price gap, the 11 Basmati varieties are split further to ensure greater transparency for consumers in the Basmati export business.

Page 21 of 21
Research Report: Satnam Overseas Limited.
Packaged Food Industry
Global
Ø Global packaged food sales reached over $ 1,254bn in 2003, up by 4.1% from 2002.
Ø In 2002, ready-to-eat meals accounted for about 4% of total retail sales in the US and the UK, but only 0.06% in Mexico, 0.55% in China, and 0% in India. But in the next 5 years, China, Thailand, the Philippines, Indonesia, Vietnam and India are expected to be some of the fastest growing markets for ready-to-eat retail sales.
Ø Asia Pacific, the third largest frozen processed food market in the world, imports 85% of its processed food requirements. Currently, Japan leads the race for imports of processed foods.
India
Ø Packaged food products have been slow in penetrating the high potential Indian market with a 250mn strong middle class, but due to growing urbanization and changing food habits, the demand has been gaining steam of late.
Ø According to a CII-McKinsey Report, the ready-to-eat market in India is expected to grow to $ 220mn by 2010. The market is nascent and at a category induction stage but growing at an estimated 200% CAGR over the next two years with changing lifestyle, breakdown of the joint family system and an increasing number of working women in urban areas.
Ø Consumption of ready-to-eat items by urban Indian has grown 12% in FY’02 compared to 8% in FY’99.
Ø Technological revolutions in processing and packing of food products, coupled with fast growing inland and export markets present a very good potential for investment in this sector.
Ø Major Players in the Indian Ready-to-Eat market are Tasty Bites, ITC Foods, MTR, Currie Classic and Satnam Overseas. All companies use the Retort technology developed by DRDL for packaging the products.
According to a World Bank Study, Read-to-Eat meals are one of the fastest growing sectors in developed countries. $ 220mn ready-to-eat market by 2010 in India Major players in India are MTC, ITC, Tasty Bites, Currie Classic and SOL

Page 22 of 22
Research Report: Satnam Overseas Limited.
Annexure 1 - Profit & Loss Statement
Figures in Rs mn Particulars FY’03 FY’04 FY’05
Net Sales 4,539 5,321.8 5,066.1 Operating Expenses 4,272.7 4,995.8 4,686.7 Raw Material consumed 3,438.5 4,164.8 3,926.3 Administration expenses 73.8 95.2 83.4 Selling Expenses 347.3 383.9 301.3 Staff Cost 51.9 62.1 69.4 Manufacturing Expenses 361.3 289.9 306.3 OPBDIT 266.3 325.9 379.4 Finance Charges 162.7 120.6 119.7 Depreciation 42.4 51.8 57.9 OPBT 61.1 153.5 201.8 Non Operating Income/Other Income 50.2 20.8 13.2 PBT 111.3 174.3 215.0 Provision for current Tax 14.0 40.0 54.5 Deferred tax 2.4 4.5 5.7 PAT 94.9 129.8 154.8
Source: Company

Page 23 of 23
Research Report: Satnam Overseas Limited.
Annexure 2 - Balance Sheet
Annexure 3 – Key Ratios
Particulars Mar 03 Mar 04 Mar 05 I. Sources of Funds 1.Share Holder's Fund 853.2 949.7 1,059.8 (a) Share Capital 196.0 196.0 196.0 (b) Reserves & Surplus 657.2 753.7 863.8 2.Deferred Tax Liability/(Asset) 26.5 31.0 36.7 3.Loan 2,440.2 2,327.0 2,664.7 (a) Secured 2,387.0 2,307.5 2,496.7 (b) Unsecured 53.2 19.5 168.0 TOTAL (1+2+3) 3,319.9 3,307.7 3,761.3 II. Application of Fund 1. Net Fixed Assets 341.2 403.6 447.2 Gross Block 582.9 654.2 756.2 Less Depreciation 243.0 288.8 336.5 Net Block 339.9 365.4 419.7 Add CWIP 1.3 38.2 27.5 2. Investments 65.2 65.2 129.3 3. Net Current Assets (A-B) 2,905.0 2,834.4 3,184.8 A. Current Assets 3,054.2 3,067.9 3,655.6 (a) Inventories 2,315.2 2,222.1 2,708.1 (b) Debtors 493.2 382.5 554.0 (c) Others 245.8 463.3 393.5 B. Current Liabilities 149.2 233.5 470.8 (a) Creditors and other liabilities 71.1 102.9 273.6 (b) Provisions 78.1 130.6 197.2 4. MISCELLANEOUS EXPENSES 8.5 4.5 - TOTAL (1+2+3+4) 3,319.9 3,307.7 3,761.3
Turnover/Activity Ratios FY’03 FY’04 FY’05 Inventory turnover Ratio 1.85 2.25 1.73 A/R turnover Ratio 9.20 13.91 9.14 Average collection period 39.12 25.88 39.37 Fixed assets turnover ratio 13.30 13.19 11.33 Total assets turnover ratio 1.31 1.50 1.20 Capital Turnover 1.38 1.65 1.37 Working Capital Turnover 1.56 1.88 1.59
Liquidity Ratios FY’03 FY’04 FY’05 Current Ratio 20.48 13.14 7.76 Acid Test Ratio 4.95 3.62 2.01 Net working capital ratio 0.89 0.88 0.86 Interval measure 62.26 60.95 72.78 Cash Ratio 0.31 0.25 0.09
Figures in Rs mn
Page 24 of 24
Research Report: Satnam Overseas Limited.
About Four-S Services Four-S Services provides customised business and financial research to organizations across the globe. The company also provides Investor Relations consulting to corporates based on in-depth sectoral and company research. The company has an impressive client profile and a team of analysts covering the key sectors including Finance & Banking, IT & Telecom, Retail, Media & Entertainment, Pharmaceuticals, Infrastructure and Manufacturing amongst others. For further information on the company please visit www.four-s.com
Disclaimer The information contained herein has been obtained from sources believed to be reliable but is not necessarily complete and its accuracy cannot be guaranteed. No representation, warranty, guarantee or undertaking, express or implied, is made as to the fairness, accuracy or completeness of any information, projections or opinions contained in this document or upon which any such projections or opinions have been based. Four-S Services Pvt. Ltd. will not accept any liability, whatsoever, with respect to the use of this document or its contents. This document has been distributed for information purposes only and does not constitute or form part of any offer or solicitation of any offer to buy or sell any securities. This document shall not form the basis of and should not be relied upon in connection with any contract or commitment whatsoever. This document is not to be reported or copied or made available to others. The company may from time to time solicit from, or perform consulting, or other services for, any company mentioned in this document.
For Further details/clarifications please contact: Satyendra Shukla Puneet Jain
[email protected] [email protected] +91 9810246711 +91 9810027640
Four-S Services Pvt. Ltd. 409, Meghdoot, 94, Nehru Place New Delhi – 110019, India
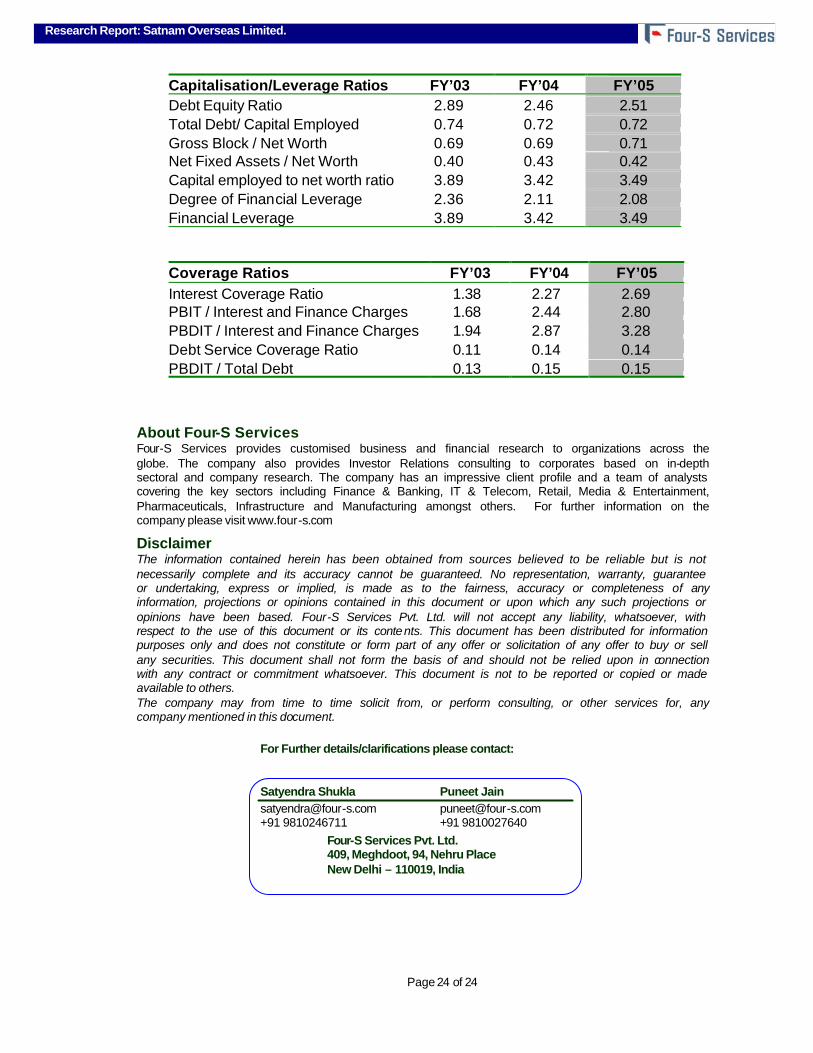
Capitalisation/Leverage Ratios FY’03 FY’04 FY’05 Debt Equity Ratio 2.89 2.46 2.51 Total Debt/ Capital Employed 0.74 0.72 0.72 Gross Block / Net Worth 0.69 0.69 0.71 Net Fixed Assets / Net Worth 0.40 0.43 0.42 Capital employed to net worth ratio 3.89 3.42 3.49 Degree of Financial Leverage 2.36 2.11 2.08 Financial Leverage 3.89 3.42 3.49
Coverage Ratios FY’03 FY’04 FY’05 Interest Coverage Ratio 1.38 2.27 2.69 PBIT / Interest and Finance Charges 1.68 2.44 2.80 PBDIT / Interest and Finance Charges 1.94 2.87 3.28 Debt Service Coverage Ratio 0.11 0.14 0.14 PBDIT / Total Debt 0.13 0.15 0.15