sri r.k.agarwal, hon. chairman, a.p. spinning mills ... · 1 group-b objectors 1. sri r.k.agarwal,...
TRANSCRIPT

1
Group-B Objectors
1. Sri R.K.Agarwal, Hon. Chairman, A.P. Spinning Mills Association 2. Smt. P.Vydehi, Secretary (I/c), FAPCCI 3. Sri Suresh Kumar Singhal, Chairman, M/s All India Induction Furnaces Association, South Central Region
Sl.No Objection/Suggestion EPDCL Reply
1 In the fourth quarter (Q4) of 2012-13, the Petitioners have proposed to collect Fuel Surcharge Adjustment (FSA) amount of Rs. 1,138 crores for the purchase of 20725 MUs and against a quantum of 16872 MUs of sales. This has percolated into a charge of Rs.1.0271 per unit of non-agricultural sales. The following Table 1 summarizes the trend of FSA claimed for FY 2012-13.
Formula Q1 Q2 Q3 Q4 % Change (QoQ)
Q2 Q3 Q4
FSA (Rs. Cr)
A 2161.48 985.97 1068.28 1138.00 -54.4%
8.3% 6.5%
Purchases (MUs)
B 21017 19029 19259 20725 -9.5% 1.2% 7.6%
Total Sales (MUs)
C 12635 15978 16013 16872 26.5% 0.2% 5.4%
Sales (Excl. Agriculture)
D 13352.51 11922.77 11175.55 11076.00 -10.7%
-6.3% -0.9%
FSA per unit (Rs./kWh) (C= A/B)
E = A*10 /D
1.619 0.827 0.956 1.027 -48.9%
15.6% 7.5%
In order to understand the apportionment of FSA between various consumer categories, a brief about purchases
APDISCOMs have claimed FSA for 4th quarter as per the regulation in vogue.

2
and sales of the consumers has been analysed. The summary of the same is given in the Table 2 below.
Formula As approved
in T.O 2012-13
(A)
As filed by
Discoms
(B)
Variation in approved and filed (MUs)
(C=B-A)
Variation as a % of approved
(D=C/A)
Total Purchases (MUs)
A 24059.4 20724.6 -3334.8 -13.9%
Total Sales (MUs) B 20344 16872.3 -3472.2 -17.1%
Non-agriculture
C 14760 11076.2 -3683.9 -25.0%
Agriculture D 5584 5796.1 211.7 +3.8%
% of Agriculture
E = D/A 27.4% 34.4% +7% points
% of Non-agriculture
F = C/A 72.6% 65.6% -7% points
It can observed from the above table that in Q4, 2012-13, there have been considerable deviations of the actuals claimed by the Petitioner than the numbers approved in the Tariff Order 2012-13. For example, agricultural sales’ share in total sales has been 34.4% as compared to 27.4% approved in T.O 2012-13. This implies that a portion of power consumed by non-agricultural consumers has been diverted to meet the needs of agricultural sector. This makes it pertinent that the share of agriculture in FSA claimed by Petitioners has also increased.
However, the Regulation 1 of 2003 provides that agricultural sales would be excluded for the computation of FSA. This has made it inevitable that the share of agricultural FSA would be borne by the non-agricultural consumers,

3
thus increasing their burden still further. The Objector is of the view that it is not prudent for the Hon’ble Commission to pass on the burden of agricultural FSA on to the non-agricultural consumers. In addition to this, some more contentions are being raised by the Objector that need to be considered before any further proceedings. Analyses of the same have been detailed in the subsequent sections
Lastly, the Objector requests the Hon’ble Commission to consider all the listed arguments, carefully scrutinize computation of FSA and help reduce burden on the non-agricultural consumers.
2 Analysis of FSA formula
The Andhra Pradesh Electricity Regulatory Commission (Conduct of Business) Amendment Regulation, 1 of 2003, Clause 45-B defines Fuel Surcharge Adjustment (FSA) as
“...Unless otherwise agreed by the Commission, the amount eligible for recovery towards Fuel Surcharge Adjustment (FSA) for the price and mix variations in the quantity of energy purchased as per the tariff order during a quarter “i” ....” .
As understood from the definition, variable cost and fixed cost form the two main components of FSA that have to be read in conjunction with the Andhra Pradesh Electricity Regulatory Commission (Terms and conditions for determination of tariff for supply of electricity by a generating company to a distribution licensee and purchase of electricity by distribution licensees) Regulation, 2008. Some of the salient features of the FSA formula are as follows:
(1) Automatic pass-through:
The initial FSA formula, which was amended by Regulation 8 of 2000, had provided for a pass through for variations only in variable charges or total tariff on account of variations in cost of fuels from various sources. This was later amended through Regulation 1 of 2003 to include variations in variable cost as well as fixed cost. The Commission was of the view that the formula would provide a cushion to the Licensees against the uncertainties in power availability from sources such as hydro power stations.
(2) Exclusion of Agricultural Sales:
The APDISCOMs have claimed FSA for 4th quarter as per the existing regulation .

4
FSA for a period is calculated based on the actual consumption of various consumer categories covered under different voltage levels. However, sales of agricultural sector, which is heavily subsidised, are completely excluded from sales, while computing FSA per unit. The Commission is of the view that agricultural sales are to be excluded from such computation until they have reached to a satisfactory level of metering. However, this boon for agricultural sector has further burdened the industrial and domestic consumers, who are charged with the additional agricultural FSA. It is also important to understand that since the notification of metering of agricultural sales in the FSA formula, till date, the LT category is still not metered.
(3) Distribution losses:
According to the formula, FSA per unit is calculated based on the actual consumption (sales in MUs), which is net of purchases and distribution losses. Since FSA is a provision to recover changes in the power purchase cost, the total quantum of purchases/units despatched should be included, which includes distribution losses. As a result, the distribution losses as approved by the ERC are being ignored for the purpose, thus increasing the burden further.
(4) Comparison of FSA formula:
The formula used by the APERC to calculate FSA has been compared with the formulas adopted by some other states in India. Following Table 3 gives an overview of the major differences that can be drawn prima facie.
Table 3: Comparison of FSA formula used by different states
Variables Andhra Pradesh
Maharashtra Karnataka Haryana Gujarat Punjab
Variable Cost 1
Considers the per unit change in weighted average variable cost of APGENCO,CGS and IPPs against the variable cost approved in T.O-2012-13
Considers the absolute sum of change in fuel cost due to own generations and power purchased from other sources
Considers the absolute sum of change in variable cost due to own generations, CGS and IPPs
Considers the weighted average cost of power purchase from all the sources
Considers the absolute sum of change in fuel cost due to own generations ,CGS and IPPs
Considers the absolute sum of change in fuel cost due to own generations, CGS and IPPs

5
Fixed Cost Considers fixed charges of the generating stations
— — — Considers the fixed cost of power purchase from all sources
—
Energy Sales
Only non-agriculture sales (excludes agricultural sales)
Metered sales+ estimate of unmetered sales+ distribution losses
Actual metered sales+ estimated unmetered sales
Total sales of all consumer categories
Actual metered sales+ estimated unmetered sales+ excess T&D losses incurred over % T&D loss norm approved by Commission
FAC calculated separately for metered and unmetered sales
Adjustment Factor
— Adjustment due to over/under recovery
Adjustment due to over/under recovery
Adjustment due to over/under recovery
— —
Interest on Working Capital
— Considers interest on working capital
— — — —
Energy Purchased
The units considered are as determined by ERC after reviewing the filled units by Discom
— — — — —
Z changes in cost of rupees
— — — — —
Merit order violation
Considers adjustment due to merit order violation
— — Considers adjustment due to merit order violation
— —

6
The above comparative analysis can be summarized as given in the following Table 4
Variables Comment
Variable Cost The state of AP considers weighted average variable cost, while the other states such as Karnataka, Haryana, Punjab and Gujarat consider the absolute variable costs incurred by the respective Discoms.
Fixed Cost Unlike the other states, AP considers the variations in fixed charges of generating stations for the computation of FSA.
Energy Sales AP considers the energy sales of all consumer categories except agricultural sector while other states take actual metered energy sales and estimated unmetered sales of all consumer categories. Thus making sure that the non-agricultural consumers are not being burdened by additional claims.
T&D Losses The best practice is being followed by Maharashtra wherein the state includes T&D losses to the total sales. This way, it is made sure that the burden of T&D losses is not passed on to the consumers and puts the onus on to the Discoms to reduce their losses in order recover costs.
Z Changes in cost of rupees as allowed by the Commission for a period extending in the past beyond the relevant quarter is considered by AP. Other states do not consider this factor.
In view of the above comparison, the Objector prays to the Hon’ble Commission to reconsider the components of FSA formula and include unmetered sales, T&D losses and exclude fixed costs from the formula, to calculate FSA charges that are fair and are borne equally by all consumer categories.
3 Fixed Cost
The Petitioner in Q4, 2012-13 has claimed for total fixed cost of Rs.2,173 crores against purchases of 20,725 MUs. The summary of the fixed costs by source for the period as filed by the Petitioner is given below in Table 5.
The details of fixed cost and claims of APGENCO is annexed. Further , the claims like Income Tax and incentives will be firmed up at the end of the financial year which falls in the 4th quarter .

7
Station As approved in T.O 2012-13 Actual filed by Discoms in 2012-13
Q-o-Q Change
(%)
% Variation from TO
Q1 Q2 Q3 Q4 Q1 Q2 Q3 Q4 Q4 Q4
APGENCO – Hydel 293 293 293 293 314 338 337 402 19% 37%
APGENCO – Thermal 975 975 975 975 975 975 965 1,047 8% 7%
CGS 474 474 474 474 546 414 502 535 7% 13%
IPPs 346 346 346 346 415 420 365 138 -62% -60%
Non-Conventional Energy - - - - - - - - - -
Other Market Purchases 11 11 11 11 450 101 76 52 -32% 373%
Total Fixed Cost 2,098 2,098 2,098 2,098 2,700 2,248 2,245 2,173 -3% 4%
** Figures rounded off for convenience
It can be observed that fixed costs for APGENCOs have increased compared to the fixed cost approved in T.O 2012-13. In Q4, 2012-13, fixed costs for APGENCOs amounted to Rs.1,449 crores and reflects an increase of 11% over the last quarter. While the hydel power stations accounted for Rs.402 crores (Q-o-Q increase of 19%), thermal power stations incurred the rest of Rs.1,047 crores (Q-o-Q increase of 8%) in Q4 2012-13.
It can also be observed that fixed costs for APGENCO hydel and thermal plants have deviated considerably from approved numbers in T.O 2012-13. Hydel plants registered a variation of over 37% and thermal plants registered a variation of over 7% than the amount of fixed cost approved in T.O 2012-13. The costs incurred in the quarter have been further broken down by month and by generating station in order to understand the deviations incurred. The following Table 6 gives a gist for the months of January, February and March, showing the variations of claimed fixed costs from numbers approved in T.O 2012-13.

8
Table 6: Monthly fixed cost variation of actuals from that of T.O 2012-13 Station Variation of filed numbers from T.O 2012-13
(%) Filed Fixed Cost March
2012 (Rs. Crores)
January February March
APGENCO – Hydel 0.0% 0.0% 111.1% 206.3
APGENCO – Thermal 0.0% 0.0% 22.1% 396.7
KTPS A 0.0% 0.0% 0.0% 10.1
KTPS B 0.0% 0.0% 0.0% 10.1
KTPS C 0.0% 0.0% 0.0% 10.1
KTPS V / D 0.0% 0.0% 23.3% 22.6
Kakatiya Thermal Power Plant Stage I
0.0% 0.0% 23.7% 71.1
KTPS Stage VI 0.0% 0.0% 35.9% 67.3
VTPS I 0.0% 0.0% 43.7% 19.3
VTPS II 0.0% 0.0% 43.7% 19.3
VTPS III 0.0% 0.0% 43.7% 19.3
RTS B 0.0% 0.0% 6.3% 4.6
RTPP I 0.0% 0.0% 0.0% 18.7
RTPP Stage-II 0.0% 0.0% 25.7% 44.5
RTPP Stage-III 0.0% 0.0% 1.4% 27.2
VTPS IV 0.0% 0.0% 20.3% 52.5
The above table clearly indicates that there has been a significant increase in fixed costs in the month of March

9
especially for hydel station and other stations such as KTPS V-stage, Kakatiya, VTPS, etc. as identified.
The Objector likes to raise a few contentions regarding the calculation of fixed charges that are being claimed by Petitioners.
1.1 Lack of transparency:
The Objector believes that the information provided by the Petitioner is incomplete. The publication of just a consolidated number without any supporting facts and figures of the various components makes it very ambiguous to ascertain the authenticity of the fixed cost that are being considered for the calculation of FSA for the quarter.
As we understand from the existing regulations, the determination of fixed costs payable is dependent on the following parameters. According to the Andhra Pradesh Electricity Regulatory Commission (Terms and conditions for determination of tariff for supply of electricity by a generating company to a distribution licensee and purchase of electricity by distribution licensees) Regulation, 2008, Clause 10.5:
“....The annual fixed charges of a thermal generating station or of a hydro power generating station, as the case may be, shall consist of recovery of the following:
(a) Return On Capital Employed (RoCE); (b) Depreciation ; (c) O&M Expenses ; (d) Income-tax as per actuals;....”
The Objector, however, intends to bring to the notice of the Commission, that information regarding the above mentioned parameters is unavailable for us to understand the genuineness of the claims that are being proposed by the Petitioners.
The Objector requests the Hon’ble Commission to provide the required information as stated above and make the system more transparent to help consumers in ascertaining the genuineness of the costs being claimed by the Petitioners
1.1 The APDISCOMs have filed entire information along with a copy of the bill paid during 4th quarter .

10
3.2 3.2 Generation Tariff for Gencos:
In the T.O 2012-13, the Commission has determined and approved fixed costs for APGENCO’s power stations based on the information provided by them. However, these values are yet to be trued up to determine the generation tariff. The Commission states that:
“.....Pending determination of generation tariff for APGENCO’s power stations for FY 2012-13, the fixed cost is determined based on information provided by APGENCO in its application for determination of generation tariff and updates on subsequent information in accordance with the Regulation 1 of 2008.
The fixed cost for APGENCO Thermal and Hydel stations is estimated at Rs.5071.10 Cr., i.e. the same amount as filed by Licensees for FY 2012-13. The fixed cost computed here is subject to corrections to be carried out upon the determination of generation tariff for APGENCO stations.....”
According to the above statement, it is very clear that fixed costs for Gencos have been estimated according to the information provided by them. However no clarity is provided by the Gencos about the methodology adopted to estimate costs. Moreover, the Commission has not yet completed the exercise of truing up the actual values to determine generation tariffs. In the absence of a valid generation tariff or any distinct information, it is not prudent to consider the increase in fixed charges that are being claimed by the Petitioners. The following Table 7 shows the effect of disallowing the excess fixed costs being claimed by the Petitioners.
Table 7: Estimated reduction in Fixed Costs of APGENCOs for Q4, 2012-13
Unit Formula January February March Q4
Fixed Cost Filed – APGENCOs Rs. Crores A 422.59 422.59 603.00 1448.19
Fixed Cost allowed in T.O 2012-14 – APGENCOs
Rs. Crores B 422.59 422.59 422.69 1267.78
Estimated difference in Fixed Cost to be disallowed (FC-1)
Rs. Crores C = A-B 0.0 0.0 180.31 180.31
Estimated Fixed Cost – APGENCO Rs. Crores 422.59 422.59 422.69 1267.78
All the payments are provisional to APGENCO till the final fixed cost is approved by Hon’ble Commission and any increase /decrease will be considered in the next filing.
The fixation of Tariff is based on the regulation and Hon’ble APERC will determine the tariff for APGENCO.
The DISCOMs have recognized claims as per the approval of APERC in the tariff order 2012-13.

11
From the above table it can be deduced that there would be a considerable reduction in the total fixed costs being claimed by the Petitioners. The estimated reduction of Rs. 180.31 crores would result in 8% reduction of the total fixed costs being claimed by the Petitioners.
Therefore, the Objector prays to the Hon’ble Commission that the increase in the fixed costs being claimed by the Petitioner shall be disallowed until true generation tariff for the Gencos has been determined.
1.2 Recovery of fixed costs:
The Generation Regulation 2008, Clause 11.1.1 and Clause 11.2.1 provide norms for full recovery of annual fixed costs of thermal and hydro power stations respectively. The Regulations states that the recovery of such costs is dependent on the availability factor of the generation plants. The attainment of the target availability factors would qualify the power plants to recover full fixed costs, failing which would result in pro-rata recovery based on the achieved availability factor.
The Regulation’s Clause 11.2.1 states as under:
“....There shall be pro rata recovery of annual fixed charges in case the generating station achieves capacity index below the prescribed normative levels. At Zero capacity index, no fixed charges shall be payable to the generating station....”
The following Table 8 summarises the availability norms as defined in the regulation.
Table 8: Availability as defined by Generation Regulation No 1 of 2008 Target Availability
Thermal (Coal) 80%
Thermal (Lignite) 75%
Hydro
- During first year of commissioning
The Annual Fixed Cost is paid as per the provisional approval of APERC.

12
o Purely Run-of-River power station 85%
o Storage type and Run-of-river 80%
- After first year of commissioning
o Purely Run-of-River power station 90%
o Storage type and Run-of-river 85%
However, due to lack of any information on availability factor, plant load factors (PLF) for the APGENCO power plants have been assumed to be the absolute availability factors for the plants. PLFs have been calculated using the actual energy despatched by the stations on the assumption that they have abided by the operating norms set by the Regulation. Calculated PLFs for all the APGENCO thermal power plants are tabulated as below:
Table 9: PLFs for APGENCO Thermal Power Stations, Q4 2012-13 Name of the Power
Plant Capacity January
(Filed) February
(Filed) March (Filed)
VTPS-I 420 MW 81.7% 90.2% 97.5%
VTPS-II 420 MW 81.7% 90.2% 97.5%
VTPS-III 420 MW 81.7% 90.2% 97.5%
VTPS-IV 500 MW 99.6% 94.5% 106.7%
RTPP-I 420 MW 92.9% 87.7% 98.6%
RTPP-II 420 MW 98.2% 91.4% 104.3%
RTPP-III 210 MW 94.5% 90.9% 81.3%
KTPS-Station A 240 MW 87.2% 79.6% 82.6%
KTPS-Station B 240 MW 87.2% 79.6% 82.6%

13
KTPS-Station C 240 MW 87.2% 79.6% 82.6%
KTPS-Station D 500 MW 84.5% 91.7% 99.1%
KTPS-Stage VI 500 MW 95.5% 98.9% 108.2%
RTS-B 62.5 MW 98.2% 95.5% 94.0%
Kakatiya Stage-I 500 MW 91.1% 97.3% 97.7%
From the above table, it can be observed that three plants KTPS – Stations A, B and C have achieved PLFs of less than 80% in the month of February. The Regulation provides that the fixed costs shall be reduced pro-rata based on the availability factor of the generation stations. Therefore, fixed costs that are being claimed by the Petitioner for the identified stations have to be reduced proportionately. This would reflect in a reduction of fixed charges by an amount of Rs.0.15 crores for the month of February. The Objector would like to illustrate the same in Table 10 below:
Table 10: Calculation of actual fixed cost recovery – assuming Availability Factor <80% in February 2013
Name of the Power Plant Units Formula KTPS – Station A
KTPS – Station B
KTPS – Station C
Total Fixed Cost
Fixed Cost filed for full recovery Rs. Crores A 10.1 10.1 10.1 30.3
PLF Norm % B 80% 80% 80%
Actual PLF as calculated % C 79.6% 79.6% 79.6%
Estimated fixed cost recovery Rs. Crores D = (A/B) x C 10.05 10.05 10.05 30.15
Estimated fixed cost to be disallowed (FC-2)
Rs. Crores E= A-D 0.05 0.05 0.05 0.15
Considering the above observations, the Objector prays to the Hon’ble Commission that fixed cost recovery as claimed by the Petitioner is to be scrutinized closely in conjunction with the norms specified and disallow the amount, which the Gencos are not eligible for.

14
3.4 STOA:
The Petitioners in the current quarter have claimed fixed cost of Rs.43.86 crores for STOA. The details of the monthly claims are given in the following Table 11:
Table 11: Fixed Cost for STOA Units Formula January February March Total
STOA (FC-3) Rs. Crores A 16.68 11.31 15.87 43.86
Total Fixed cost filed Rs. Crores B 687.30 638.32 847.41 2,173.03
STOA as a% of Total Fixed cost claims
% C = A/B 2.4% 1.8% 1.9% 2.0%
Revised Fixed cost for STOA Rs. Crores D 0.0 0.0 0.0 0.0
However, in FSA Order passed for Q3, 2012-13 (Pg 29), the Commission has stated that:
“....The Commission is of the view that the STOA charges claimed by DISCOMs are not part of fixed cost as per Tariff Order for FY 2012-13. Hence, the same is not being allowed in determination of FSA....”
In view of the above statement passed, the Objector humbly requests the Hon’ble Commission to completely disallow fixed charges of Rs.43.86 being claimed by the Petitioners under the head of STOA.
Summary
In view of the above discussion and facts, the Objector likes to quantify and summarize the total reduction in fixed costs that would be effective for the months of January, February and March. The same is represented as under:
STOA is the part of the power purchase cost procured from short term sources and the cost incurred on STOA is a part of total cost incurred to deliver the power to the consumer.

15
Table 12: Estimated reduction in Total Fixed Costs claimed by Discoms, Q4 2012-13 Reference Units Formula January February March Total
Total Fixed Cost filed Rs. Crores A 687.30 638.32 847.41 2173.03
Excess fixed cost filed by APGENCOs
Table 7, FC-1 Rs. Crores B 0.0 0.0 180.31 180.31
Estimated fixed cost to be disallowed
Table 10, FC-2
Rs. Crores C 0.0 0.15 0.0 0.15
STOA Table 11, FC-3
Rs. Crores D 16.68 11.31 15.87 43.86
Estimated reduction Rs. Crores E= B+C+D 16.68 11.46 196.28 224.42
Revised Fixed Cost Rs. Crores F = A-E 670.62 627.01 651.23 1948.86
Actual Fixed cost per unit of Purchases
Rs./kWh G 0.99 1.02 1.12 1.05
Estimated Fixed cost per unit of Purchases
Rs./kWh H 0.97 1.00 0.86 0.94
Difference in Fixed Cost per unit
Rs./kWh I = G-H 0.02 0.02 0.26 0.11
Considering the calculations done in the above table, there can be a reduction of Rs. 224.42 crores in the total fixed costs claimed, resulting in a net reduction of Rs.0.11 per unit of purchase.
In consideration of the above observations, the Objector prays to the Hon’ble Commission to scrutinize all the relevant facts and accordingly approve appropriate and proportionate fixed costs of Rs. 1,948.86 crores for Q4 2012-13.
4 Variable Cost
The Petitioner in Q4, 2012-13 has claimed for total variable cost of Rs.5,568.8 crores. The summary of the variable cost incurred by source for the period as filed by the Petitioners is given below in Table 13.
APGENCO
The variable cost is increased due procurement of imported coal, procurement of additional

16
Table 13: Variable Costs by Generation Station (in Rs. Crores)
Station As approved in Tariff Order 2012-13 Actual filed by Discoms in 2012-13
Q-o-Q Change
(%)
% Variation from TO
Q1 Q2 Q3 Q4 Q1 Q2 Q3 Q4 Q4 Q4
APGENCO – Thermal 1730.6 1595.5 1705.7 1737.1 2204.9 2168.9 2177.9 2400.7 10% 38%
CGS 1248.8 1132.3 1317.3 1374.5 1278.0 994.0 1191.4 1402.3 18% 2%
IPPs 427.5 430.4 408.7 430.7 1119.4 683.8 566.3 785.2 39% 82%
Non-Conventional Energy 92.0 85.0 98.8 158.2 124.9 93.2 90.3 138.4 53% -13%
Other Market Purchases - - - - 706.2 896.9 977.4 842.2
Total Variable Cost 3499 3243 3531 3701 5433 4837 5003 5569 11% 50%
** Figures rounded off for convenience
Variable cost, one of the main components for computation of FSA, majorly includes fuel cost and related transportation costs. Variable cost is majorly dependent on aspects such as cost of fuel, transit losses, handling charges and operating parameters of the plant. The Andhra Pradesh Electricity Regulatory Commission (Terms and conditions for determination of tariff for supply of electricity by a generating company to a distribution licensee and purchase of electricity by distribution licensees) Regulation, 2008, Clause 9.1 defines Variable cost and operating norms as:
“.....(ii) Variable Costs
(a) Landed cost of fuel including transit and handling charges, in case of thermal stations
(b) Royalty on coal and water rates, if any
(c) Others (to specify)
(iii) Norms of operation
coal by paying premium price and normal inflationary effect on the coal .Further APGENCO station like RTPP is located far off from the coal mines and the huge amount of transportation is incurred.
IPP :
The variance in cost of gas is due to use of RLNG and increase in foreign exchange rate over period even domestic gas price is reimbursed to IPPs based on the dollar rate converted into rupee rate .
Further, the details of calculation of variable cost, depicting weighted average cost of coal, cost of secondary fuel, SHR & GCV etc. is filed along the FSA proposals.

17
(a) Target Availability for recovery of full capacity (Fixed) charges
(b) Target Plant Load Factor (PLF) for incentive
(c) Gross Station Heat Rate – (i) during stabilisation period; (ii) subsequent period
(d) Secondary fuel oil consumption
(e) Auxiliary Energy Consumption...”
The Regulation, in Clause 11, states various plant operating norms for different types of fuel, which have been in the below Table 14.
Table 14: Norms of Operation for Thermal Power plants Clause Operating
Parameters Type of Station Norms of Operation
11.1.1 Target Availability Factor
Coal 80%
Lignite 75%
11.1.2 Auxiliary Energy Consumption
Coal With cooling tower Without cooling tower
(i) 200/210/250 MW 9.0% 8.5%
(ii) 500 MW series
Steam driven boiler feed pumps 7.5% 7.0%
Electrically driven boiler feed pumps
9.0% 8.5%
Gas Turbine/Combined Cycle
(i) Combined cycle 3.0%
(ii) Open cycle 1.0%

18
Lignite-fired 0.5 percentage point more than the auxiliary energy consumption norms of coal-based generating stations
11.1.3 Gross Station Heat Rate (SHR) (After Stabilization Period)
Coal
(i) 200/210/250 MW 2500 kcal / kWh
(ii) 500 MW series 2450 kcal / kWh
Lignite-fired SHR for coal-based generating stations shall be corrected, using multiplying factors
(i) For lignite having 50% moisture Multiplying factor of 1.10
(ii) For lignite having 40% moisture Multiplying factor of 1.07
(iii)For lignite having 30% moisture Multiplying factor of 1.04
Gas turbine/combined cycle Advanced Class Machines
E/EA/EC/E2 Class Machines
- Open cycle 2685 kCal/kWh 2830 kCal/kWh
- Combined cycle 1850 kCal/kWh 1950 kCal/kWh
Small gas turbine With Natural Gas With Liquid Fuel
- Open cycle 3125 kCal/kWh 1.02x3125 kCal/kWh
- Combined cycle 2030 kCal/kWh 1.02x2030 kCal/kWh
11.1.4 Secondary fuel oil consumption
Coal 2.0 ml/kWh
Lignite 3.0 ml/kWh
11.1.5 Transit Losses Coal

19
Pit head generating stations 0.3%
Non-pit head generating stations 0.8%
The above mentioned plant operating parameters are very crucial for understandng the authenticity of the variable costs that are being claimed by the Petitioners. However, lack of adequate information such as actual Station heat rate (SHR), cost of secondary fuels, transit losses, etc which determine the efficiency of the plants are unavailable. In addition, the Objector likes to bring forward the following points of concern:
1.3 Lack of transparency
1.3.1 Operating Parameters
(a) Station Heat Rate (SHR):
SHR is one of the main parameters in determining the efficiency of thermal power stations. Efficiency of thermal power stations is a function of station heat rate and it is inversely proportional to SHR. It is also helpful in determining the actual quantities of coal that has been used in the power plants. However, this information is not made available by the Petitioners, thereby making it difficult for the Objector to determine if the generating stations are confirming to the norms set by the Regulation as mentioned above.
(b) Transit losses:
According to the proposals submitted to the Commission, the Petitioner has provided information about coal consumption, which includes quantum of coal used, mix of imported and domestic coal and price per metric ton for import as well as domestic coal. However, the Objector is unable to gauge, whether the given quantities of coal include transit losses or not. The Objector is of the view that transit losses over and above the approved norms will result in increased cost burden as there would be an increased quantum of coal procurement to accommodate losses and in turn increase in the transportation cost.
1.3.2 Disproportionate increase in cost
In Q4 2012-13, it has been observed that most of the APGENCO power stations have incurred incremental variable costs than that in the previous quarters and also against the cost incurred by Central Generation Stations

20
(CGS). A comparison of variable costs incurred by APGENCO and CGS has been summarised in the below Table 15. The table also shows a comparison of increase in variable cost in APGENCO and CGS stations of comparable unit sizes.
Table 15: Variable cost of APGENCO stations vs. CGS, Q4 2012-13 State Owned Generation Stations
(in Rs./kWh)
Variable Cost (Approved in T.O
2012-13)
Variable Cost (filed)
Actual VC as a % of Variable Cost approved
in T.O 2012-13
Range
Weighted Average APGENCO – Thermal 1.90 2.63 38% 1.1% to 52.1%
Weighted Average CGS – Thermal 2.05 2.16 2% -1.1% to 15.9%
In the above table, it can be observed that the variation in variable costs of APGENCO when compared to that of CGS is very significant. While, the maximum variation for CGS is 16%, APGENCO’s plants have shown a variance as high as 52%. In order to further understand these variances, monthly increase in quantum of purchase has been compared in the following table.
Table 16: % Change in Power Despatch and Variable Cost (Rs. Crores) as filed by DISCOMs by month State Owned Generation Stations MoM % change in Variable Cost MoM % change in Power Despatch (MUs)
January February March Q4 January February March Q4
KTPS (A) 14.5% -17.4% 12.7% 22.0% 22.9% -14.8% 11.2% 34.6%
KTPS (B) 14.5% -17.4% 12.7% 22.0% 22.9% -14.8% 11.2% 34.6%
KTPS (C) 14.5% -17.4% 12.7% 22.0% 22.9% -14.8% 11.2% 34.6%
KTPS V / D -3.2% 1.9% 19.5% 10.0% 0.0% 1.3% 15.8% 8.2%
Kakatiya Thermal Power Plant Stage I -8.1% -3.8% 4.3% -3.5% -1.4% -0.3% 7.6% 6.5%
KTPS Stage VI -11.1% -10.8% 48.0% -4.1% -10.4% -3.3% 17.2% 1.9%

21
VTPS (I) 15.4% 6.2% 15.9% 26.8% -0.3% 3.1% 15.8% 9.9%
VTPS (II) 15.4% 6.2% 15.9% 26.8% -0.3% 3.1% 15.8% 9.9%
VTPS (III) 15.4% 6.2% 15.9% 26.8% -0.3% 3.1% 15.8% 9.9%
RTS B 6.6% -7.2% 6.5% 47.3% 0.7% -9.3% 5.5% 35.6%
RTPP (I) -4.5% -12.9% 26.5% 1.0% -1.2% -11.9% 20.5% 8.5%
RTPP (II) 73.8% -14.1% 28.5% 15.1% 79.8% -13.1% 22.3% 25.2%
RTPP (III) -7.5% -11.2% 0.6% 2.2% -4.3% -10.2% -4.2% 10.0%
VTPS IV 28.6% -12.5% 31.2% 3.0% 13.8% -11.4% 21.0% 5.8%
Total APGENCO 9.8% -6.7% 21.2% 10.2% 9.7% -5.2% 17.5% 11.3%
In the above table, it can be observed that there is a considerable difference in variable costs vis-a-vis power despatched from stations such as VTPS stations – I, II and III. It can be observed that in January, despite of a reduction in the quantum of power despatched from these stations, there has been an increase in their variable costs, reasons of which could be procurement of expensive fuel, increase in quantum of fuel consumed, etc. In order to validate this, an analysis of the coal consumptions of the generating stations has also been done based on the norms approved by the Commission. Information on imported as well as domestic coal consumption has been provided by the Petitioner in the Filing.
Variable cost incurred by each APGENCO plant has been estimated based on the information given by the Petitioners and assuming that the GENCOs have fulfilled the operating parameters such as SHR, etc as per norms of the Regulation. The following tables 17 shows the variations of actual variable cost from

22
Table 17: Estimation of Total Variable Cost of APGENCO plants
Station Filed Variable cost per Unit (Rs./kWh)
Estimated Variable cost per Unit (Rs./kWh) *
Difference between Estimated and Actual
(Rs./kWh)
Estimated Excess Variable Cost (Rs. Crores)
Jan Feb Mar Jan Feb Mar Jan Feb Mar Jan Feb Mar
VTPS 2.88 2.97 2.97 2.63 2.68 2.70 0.26 0.29 0.27 17.41 20.15 21.95
VTPS IV
3.06 3.02 3.28 2.76 2.78 3.12 0.30 0.24 0.16 9.78 6.99 5.60
RTPP 3.12 3.09 3.24 2.98 2.91 2.92 0.14 0.18 0.32 9.10 10.45 21.89
KTPS 1.83 1.78 1.80 1.51 1.47 1.49 0.33 0.31 0.32 13.51 10.98 12.35
KTPS V
1.67 1.46 1.29 1.28 1.35 1.42 0.39 0.12 10.87 3.33
KTPS VI
2.58 2.38 3.01 2.32 2.19 2.95 0.26 0.19 0.06 8.30 5.92 2.04
RTS B 2.43 2.49 2.51 2.13 2.17 2.20 0.31 0.32 0.31 1.24 1.17 1.22
KTPP 2.40 2.31 2.24 2.39 2.31 2.24
Excess Variable Cost (Rs. Crores) (VC1) 70.21 58.99 65.05
Note: * Calculated as per standard operating norms of APERC regulations
The below table gives a gist of the total consumption of APGENCO plants. Table 18: Imported Coal consumption of APGENCO
23
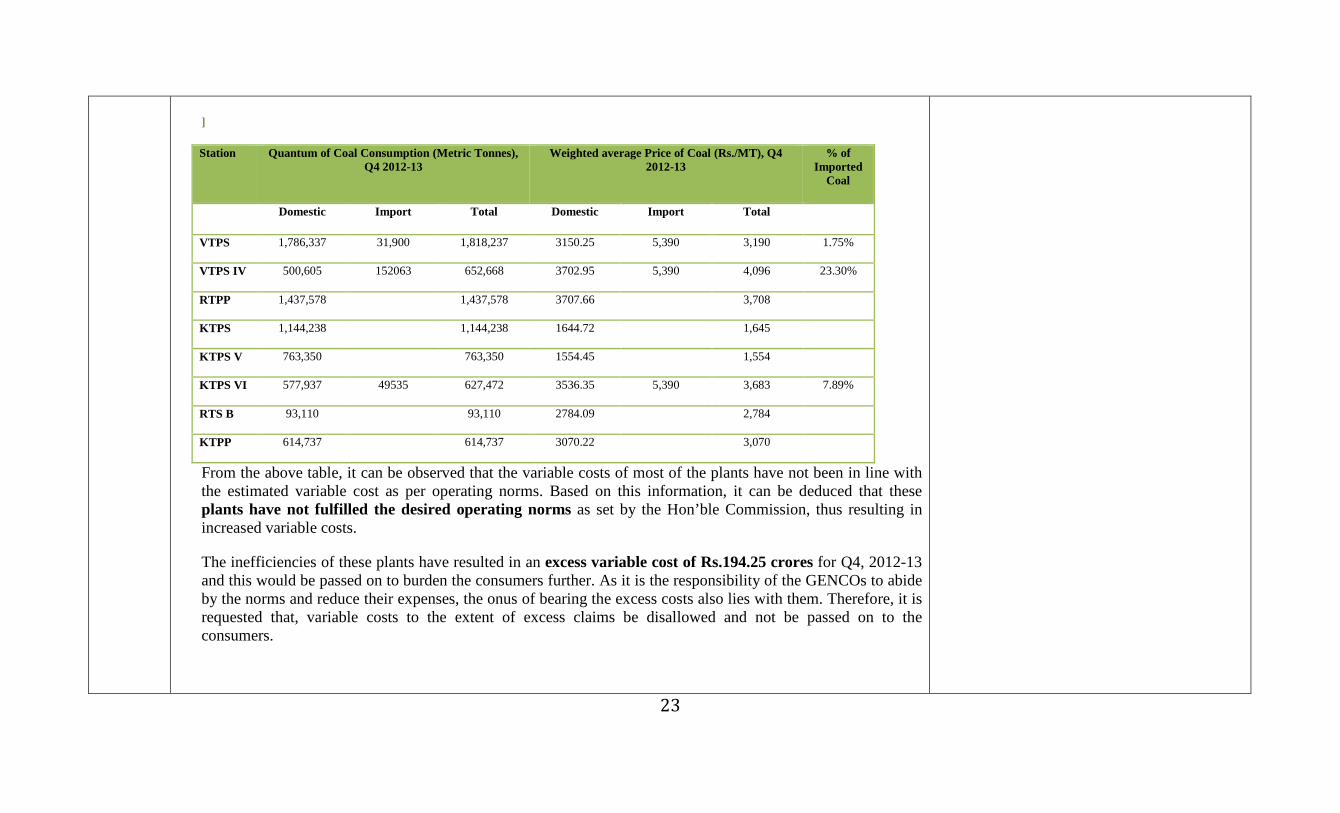
] Station Quantum of Coal Consumption (Metric Tonnes),
Q4 2012-13 Weighted average Price of Coal (Rs./MT), Q4
2012-13 % of
Imported Coal
Domestic Import Total Domestic Import Total
VTPS 1,786,337 31,900 1,818,237 3150.25 5,390 3,190 1.75%
VTPS IV 500,605 152063 652,668 3702.95 5,390 4,096 23.30%
RTPP 1,437,578 1,437,578 3707.66 3,708
KTPS 1,144,238 1,144,238 1644.72 1,645
KTPS V 763,350 763,350 1554.45 1,554
KTPS VI 577,937 49535 627,472 3536.35 5,390 3,683 7.89%
RTS B 93,110 93,110 2784.09 2,784
KTPP 614,737 614,737 3070.22 3,070
From the above table, it can be observed that the variable costs of most of the plants have not been in line with the estimated variable cost as per operating norms. Based on this information, it can be deduced that these plants have not fulfilled the desired operating norms as set by the Hon’ble Commission, thus resulting in increased variable costs.
The inefficiencies of these plants have resulted in an excess variable cost of Rs.194.25 crores for Q4, 2012-13 and this would be passed on to burden the consumers further. As it is the responsibility of the GENCOs to abide by the norms and reduce their expenses, the onus of bearing the excess costs also lies with them. Therefore, it is requested that, variable costs to the extent of excess claims be disallowed and not be passed on to the consumers.

24
4.2
UI Charges
In Q4, 2012-13, the Petitioner has claimed for UI charges of Rs. 15.95 crores (VC-2) against purchases of 46.9 MUs from NTPC and SRPC. However the Merit Order given in the T.O 2012-13 does not provide for any expenses to be claimed as UI charges for any purchases. It is also to be noted that the Hon’ble Commission has disallowed such cost in FSA order released for Q3 2012-13.
Therefore, the Objector prays to the Hon’ble Commission, that UI charges of Rs.15.95 crores and purchases of 46.9 MUs be disallowed for the quarter.
Summary
In view of the above discussion and facts, the Objector likes to quantify and summarize the total reduction in variable costs that would be effective for the months of January, February and March. The same is represented as under:
Table 19: Estimated reduction in Total Variable Costs claimed by Discoms, Q4 2012-13 Reference Units Formula January February March Total
Total Variable Cost filed Rs. Crores A 1811.7 1653.1 2104.0 5568.8
Excess Variable cost claimed due to plant inefficiencies
Table 17, VC-1
Rs. Crores B 70.21 58.99 65.05 194.25
UI Charges VC-2 Rs. Crores C 6.33 4.32 5.30 15.95
Additional power purchased due to more system losses
Table 25, VC-3
Rs. Crores D 76.03 291.02 367.05
Estimated reduction Rs. Crores E= B+C+D 152.57 63.31 361.36 577.25
Revised Variable Cost Rs. Crores F = A-E 1659.15 1589.78 1742.61 4991.54
Actual Variable cost per unit of Purchases
Rs./kWh G 2.62 2.64 2.79 2.69
The UI cost is filed in FSA of the 4th quarter as this power procured for meeting the total demand.

25
Estimated Variable cost per unit of Purchases
Rs./kWh H 2.40 2.53 2.31 2.41
Difference in Variable Cost per unit
Rs./kWh I = G-H 0.22 0.11 0.48 0.28
In view of the above discussions, the Objector prays to the Hon’ble Commission to scrutinize the operating efficiencies of the plants and provide such information to the consumers to minimize their ambiguity. And also that the Hon’ble Commission disallow the excess variable cost being claimed by the Petitioners as it is not prudent to burden the consumers for GENCO’s inefficiencies. The Hon’ble Commission may also compel GENCOs to meet with the standards set by the Commission and reduce their inefficiencies.
As per the above calculations, the Objector prays to the Hon’ble Commission that a excess variable cost of Rs.588.73 crores be disallowed, which would in turn result in a reduction of Rs.0.28 per unit of purchase.
5 Purchases from IPPs and Other sources
The Petitioner during Q4, 2012-13 has purchased 2206.8 MUs from IPPs against a variable cost of Rs.794.95.2 crores. The summary of monthly purchases and variations thereon are tabulated in the below Table 22.
Table 20: Power purchased from IPPs for Q4 2012-13 Consumer Category Formula Actuals filed by Discoms % Change (M-o-M)
January February March Q4 February March Q4/Q3
Purchases of IPPs (MUs) A1 632.8 550.7 1005.5 2189.0 -13.0% 82.6% 13.8%
Purchases of Other Sources (MUs)
A2 13.0 4.4 0.4 17.8
Total Purchases (MUs) A = A1+A2 645.80 555.10 1005.90 2206.80
As a % of Total Purchases 9.4% 8.87% 13.14%

26
Variable Cost (Rs. Crores) B 208.98 197.45 388.4 794.95 -3.3% 99.0% 38.7%
As a % of Total Variable Cost 11.5% 11.9% 18.5%
Variable Cost per Unit (Rs./kWh)
C = Bx10/A 3.24 3.56 3.86 3.60 9.9% 8.6% 21.8%
The above table shows that there has been a significant increase in the quantum of power procured from IPPs and that the corresponding variable cost has also increased. Average variable cost per unit of purchases has also increased from Rs.3.24 per unit in January to Rs.3.86 per unit March. Also, it has to be noted that in the month of February, though there has been a considerable reduction in the power purchased from IPPs, a variable cost of Rs.3.56/per unit was incurred registering an increase of over 11% in the same month.
When variable cost per unit for all the IPPs listed in the petition were calculated, it was observed by the Objector that there were considerable variations for some of the IPPs such as Vemagiri, Tata Power and Konaseema power stations. The following is summary of the same:
Table 21: Calculation of Variable Cost per unit for identified IPPs IPP Formula Variable Cost as filed (Rs. Crores) Actual Variable Cost/Unit as filed (Rs./Unit)
January February March Q4 January February March Q4
Konaseema A 5.4 2.2 12.5 20.1 2.04 2.02 9.99 4.02
Tata Power B 22.4 20.8 56.0 99.2 5.25 5.50 5.62 5.51
Vemagiri C 6.0 2.8 55.1 63.9 2.03 2.05 10.64 6.74
GMR Energy Trading Ltd
D 7.28 2.45 0.12 9.85 5.60 5.58 3.10 5.54
Total E=A+B+C+D 41.08 28.25 123.72 193.05
Total VC filed F 1811.7 1653.1 2104.0 5568.8 3.19 3.54 3.86 3.59
% of total VC G = E/F 2.27% 1.71% 5.88% 3.47%

27
It is observed in the above table that the Petitioner has procured power from IPPs such as Konaseema, Tata Power and Vemagiri at a relative higher cost ranging between Rs.5.6 to 10.64 per unit. According to the T.O 2012-13, the Commission has already allowed the Petitioner to purchase of 2,295 MUs from IPPs against a ceiling price of Rs.5.50/unit. However, it is very evident from the above table that the Petitioner has procured power at a price that is much higher than the ceiling price.
Despite procuring power from expensive resources, the Petitioners are still not in position to avoid power cuts and are still imposing R&C measures on the non-agricultural consumers. Hence, the quantum of power procured and the corresponding variable cost has to be disallowed proportionately for the month March. The following Table 24 gives a summary of the same.
Table 22: Illustration of expensive power procurement from IPPs
IPP Formula
Variable cost per unit (Rs./kWh)
(1)
Actual Power Purchase (MUs)
(2)
Total Variable Cost (Rs. Crores)
March March
Konaseema A 9.99 12.5 12.48
Tata Power B 5.62 99.7 56.03
Vemagiri C 10.64 51.8 55.12
GMR Energy Trading Ltd D 5.60 17.39 9.73
Total of IPPs and Other Sources
E = A+B+C+D 181.4 133.4
Total F 7540.73 2104
% of power purchased for >Rs.5.50 per unit
G = E/F 2.4% 6.3%

28
Therefore, the Objector prays to the Hon’ble Commission that blatant defying of the ceiling price, which is already high, needs to be scrutinized by the Commission. The Petitioner also seeks exclusion of apportioned variable cost for above mentioned IPPs for the sake of the computation of FSA for the quarter.
APDISCOMs are generating power by use of RLNG and there by the cost is increased , the procurement cost of RLNG is around $26 per Mmbtu .
6 System Losses
The Petitioner in Q4, 2012-13, has incurred losses of 3,852.32 MUs, which forms 18.6% of total purchases. A monthly summary of T&D losses is given as follows:
Table 23: Distribution Losses, Q4 2012-13 Consumer Category Formula Approved by T.O 2012-13 Actuals claimed by Discoms
January February March Q4 January February March Q4
Total Purchases (MUs)
A 7542.81 7695.30 8821.33 24059.44 6912.08 6271.83 7540.73 20724.63
Total Sales (MUs) B 6379.08 6520.60 7444.77 20344.45 5701.96 5315.58 5854.77 16872.31
Distribution losses (MUs)
C = A-B 1163.73 1174.70 1376.56 3714.99 1210.12 956.25 1685.95 3852.32
Distribution losses (%)
D = C x 100/A
15.4% 15.3% 15.6% 15.4% 17.5% 15.2% 22.4% 18.6%
As observed above, the Petitioners have incurred losses of 18.6% for Q4 2012-13, while the Commission in T.O 2012-13, has approved losses of 15.5% for the year 2012-13. The Petitioners have been unable to meet the loss trajectory as set by the Commission. Therefore the Objector requests the Hon’ble Commission to disallow the excess losses incurred by the Discoms and gross them up to sales to ensure that the Petitioners would bear the cost of losses and take up the responsibility of curtailing them with much more diligence.
Below is the calculation of the losses that can be grossed up to sales.

29
Table 24: Estimated reduction in Distribution Losses, Q4 2012-13 Consumer Category Formula Distribution Losses
January February March Q4
Total Purchases (MUs) A 6912.08 6271.83 7540.73 20724.63
Approved % of Distribution Losses (%) B 15.4% 15.3% 15.6% 15.4%
Estimated Distribution Losses (MUs) C = A x B 1066.42 957.40 1176.72 3200.07
Revised Sales (MUs) D = A-C 5845.66 5314.42 6364.00 17524.57
The Discoms are thus claiming for excess losses of 652.25 MUs for the quarter, over and above the T.O 2012-13.
Table 25: Estimated savings from controlled distribution losses, Q4 2012-13 Consumer Category Power Purchase (MUs) Variable Cost (Rs. Crores)
January February March Q4 January February March Q4
Konaseema 12.49 12.49 12.48 12.48
TATA Power 29.06 99.72 180.12 15.26 56.02 99.18
Vemagiri 51.82 51.82 55.12 55.12
Sarada 17.64 17.64 9.66 9.66
Aravali 101.65 133.47 235.12 53.50 66.83 120.33
Reliance 77.73 210.28 38.86 105.14
GMR Power Trading Ltd 12.99 4.40 17.39 7.27 2.45 9.72
Lanco (Kondapalli) 111.96 111.96 49.57 49.57
Total Variable Cost(VC3) 143.70 509.23 652.93 76.03 291.02 367.05

30
As can be seen from the above table, a variable cost of Rs.376.05 cr (per unit cost of Rs. 5.62) has been spent to purchase 652.93 MUs of power, which is essentially the additional loss claimed by the Discoms over and above the approved losses as per T.O 2012-13. Such additional purchase could have been avoided if the Commission specified loss levels were maintained.
In view of the above discussions, the Objector prays to the Hon’ble Commission that the excess distribution losses of 652.93 MUs and the corresponding purchase cost of Rs.367.05 crores that have been incurred by Petitioners shall be disallowed and shall not be passed on to the consumers.
DISCOMs have procured power from different sources and from outside SR periphery, therefore transmission losses will be on high from certain sources.
7 Agricultural Sales
The Petitioner has claimed total sales of 16,872 MU during Q4, 2012-13. The summary of monthly sales and variations thereon are tabulated in the below Table 18.
Table 26: Actual Sales mix for Q4 2012-13 vs. Approved in T.O 2012-1 Consumer Category Approved in T.O 2012-13 Actual filed by Discoms in 2012-13
Jan Feb Mar Q4 Jan Feb Mar Q4
Domestic 19.1% 18.9% 22.6% 20.3% 20.8% 21.5% 21.7% 21.3%
Industrial 53.5% 54.8% 48.9% 52.2% 43.9% 48.1% 41.4% 44.3%
% change for Industrial
-9.6% -6.7% -7.5% -7.9%
Agriculture 27.4% 26.2% 28.5% 27.4% 35.3% 30.4% 37.0% 34.4%
% change for Agriculture
+7.9% +4.2% +8.5% +7.0%
Total Sales (MUs) 6379.1 6520.6 7444.8 20344.5 5702.0 5315.6 5854.8 16872

31
From the above table, it can be observed that the Petitioners has claimed a change in the sales mix, as has been approved in T.O 2012-13. The share of agricultural consumption has increased considerably in Q4 when compared to that in T.O 2012-13, while share of industrial consumption has dipped significantly. This very clearly shows that the Petitioners have diverted most of the power procured to agricultural sector by compromising on industrial sector.
The Objector with regard to agricultural sales likes to bring to the notice of the Hon’ble Commission the following points of contention.
7.1 Diversion of expensive power
The following Table 19 gives details of the power procured from various sources and variations on a monthly basis for Q4, 2012-13.
Table 27: Purchases by Generation station, Q4 2012-13 Consumer Category Actual filed by Discoms M-o-M % Change in Purchases
January February March Q4 January February March Q4
APGENCO – Hydel 275.8 273.8 392.9 942.5 62.4% -0.7% 43.5% 5.6%
APGENCO – Thermal 3017.6 2848.5 3275.2 9141.3 6.6% -5.6% 15.0% 11.9%
CGS 2299.6 1981.7 2193.0 6474.3 6.1% -13.8% 10.7% 6.4%
IPP 632.8 550.7 1005.5 2189.0 1.3% -13.0% 82.6% 13.8%
NCE 117.8 124.5 104.0 346.3 -1.9% 5.6% -16.5% 29.9%
Market Purchase 568.3 492.7 570.1 1631.2 -13.6% -13.3% 15.7% -15.2%
Total Purchases 6912.1 6271.8 7540.7 20724.6 5.2% -9.3% 20.2% 7.6%
The above tables – 18 and 19, when read together, show that there have been corresponding variations in sales against variations in purchases. However, there has been a sudden rise in purchases from IPPs in the month of

32
March and have registered the highest growth of almost 14% in the quarter. The Objector draws an inference that additional power bought from IPPs at a relatively higher cost is not meeting the requirements of the industrial consumers, who relatively pay a higher tariff than other categories. As this relatively expensive power is not supporting the industrial segment, it is not prudent to burden them with the additional cost incurred to procure such power.
Therefore, the Objector prays to the Hon’ble Commission, that such diversion of relatively expensive to agricultural sector should be controlled and not compromise on meeting the needs of industrial sector.
7.2 Inclusion of agricultural sales in the formula:
According to the provisions of Regulation 1 of 2003, agricultural sector is exempted from the burden of FSA charges, until the Commission is satisfied with the metering of agricultural consumption is complete. The following table shows the estimation of agricultural FSA that would further burden non-agricultural consumers.
Table 28: Estimated Agricultural FSA as per Discom filings, Q4 2012-13 Parameter Units Formula January February March Q4
Estimated FSA Rs. Crores A 348.61 199.66 589.42 1137.69
Sales MUs B 5701.96 5315.58 5854.77 16872.31
Agriculture sales MUs C 2015.57 1616.82 2163.71 5796.10
FSA/Unit Rs./Unit D = Ax10/B 0.6114 0.3756 1.0067 0.6743
Estimated Agricultural FSA
Rs. Crores E = CxD/10 123.23 60.73 217.83 390.83
Agricultural FSA as % of total FSA
% F = E/A 35.3% 30.4% 37.0% 34.4%
As per the above calculations, agricultural FSA for the quarter would amount to Rs.377.05 crores, which accounts for over 34% of the total FSA claimed. This would in turn be passed on to the non-agricultural consumers, increasing their burden by almost one-third of their actual FSA charge.
Hon’ble APERC in the past FSA approval has allowed only to the extent of actual agriculture consumption or APERC approved quantity whichever less. The concern of the objectors is already addressed by Hon’ble APERC.

33
However, agricultural sales are excluded from the purview for the computation of FSA/kWh (sale unit). Though the Hon’ble Commission includes metered HT agriculture sales, LT sales that are unmetered are still not included. Also, there exists no methodology to ascertain unmetered agriculture sales and be included in the formula. However, the Commission in T.O 2012-13, restricts agriculture sales to actual sales or sales approved by the Commission, whichever is lower. This would at least ensure that, excess consumption on account of agriculture, if any, over and above the quantum specified in the relevant months of the Tariff Order, is not loaded to the admissible FSA.
Accordingly, the revised sales that would be considered for computation of FSA per unit will be as under:
Table 29: Revised Sales Estimate (MUs), Q4 2012-13 Parameter Formula January February March Q4
Actual Sales A 5701.96 5315.58 5854.77 16872.31
Actual Agriculture Sales
B 2015.57 1616.82 2163.71 5796.10
Agriculture Sales approved by in T.O 2012-13
C 1749.20 1710.66 2124.55 5584.41
Revised Agriculture sales eligible for FSA
D = least of B and C 1749.20 1616.82 2124.55 5490.57
Revised Sales eligible for FSA
E = A-B+D 5435.59 5315.58 5815.61 16566.78
Based on the methodology adopted by the Hon’ble Commission in determining the agricultural sales, the revised agricultural FSA numbers have been extrapolated as below:

34
Table 30: Revised Estimate of Agricultural FSA, Q4 2012-13
Parameter Units Formula January February March Q4
Estimated FSA Rs. Crores A 348.61 199.66 589.42 1137.69
Revised Sales MUs B 5435.59 5315.58 5815.61 16566.78
Revised Agriculture sales
MUs C 1749.20 1616.82 2124.55 5490.57
Revised FSA/Unit Rs./Unit D = Ax10/B 0.6248 0.3757 0.9319 0.6607
Revised Estimated Agricultural FSA
Rs. Crores E = CxD/10 109.30 60.74 197.99 362.78
Revised Agricultural FSA as % of total FSA
% F = E/A 31.4% 30.4% 33.6% 31.9%
IN view of the above contentions, the Objector prays to the Hon’ble Commission to reconsider power purchase procedure and include unmetered agriculture sales for the computation of FSA charges per unit. Failing which, the burden of agricultural FSA shall be borne either by the agricultural consumers or by the government in the form of subsidies. Also, the Commission shall insist the Discoms to follow strict time lines to set meters to all unmetered agricultural consumers.
8 Penalties
The Objector prays the Hon’ble Commission to adjust the penalties of approximately Rs.300 crores, collected from industrial consumer during the R&C period, to the total FSA claimed.
Since the exact amount of penalty claimed is unavailable, the Objector prays the Hon’ble Commission to direct the Petitioners to disclose the details
Hon, APERC is requested to approve FSA for the 4th quarter based on the existing regulation only. The adjustment of penalties is not envisaged in the regulation.

35
Prayer to Honourable Commission
The Objector with averments made above prays that the Hon’ble Commission may please consider the objections made on the APDISCOMs FSA Proposal for 4th Quarter of FY 2012-13 Petition and consider the following submissions:
(a) To include agricultural sales, which include metered as well as unmetered sales, in the denominator of the formula of the Regulation 1 of 2003.
(b) To insist the Discoms to complete the process of installation of meters for the agricultural sector at the earliest and make a prudent decision of including agricultural sales for the computation of FSA charged per unit to avoid passing of the burden inappropriately on to the non-agricultural consumers.
(c) The Objector requests the Commission not to consider the increase in fixed costs of APGENCOs due to the existence of ambiguity in the methodology adopted to ascertain them and absence of trued-up generation tariff. The disallowance of such amount would decrease fixed cost by Rs.180.31 crores for the quarter.
(d) To closely monitor the operations of APGENCO plants and make available their operating statistics. And insist that any deviations from regulatory norms would result in reduction in fixed cost recovery. Under this head, an amount of Rs.0.15 crores can be disallowed from fixed costs for the quarter.
(e) To disallow fixed costs claimed by the Petitioner for short term purchases under STOA. An amount of Rs.43.86 crores would be reduced from fixed costs.
(f) The sum of the points (c), (d) and (e), sum to a total of Rs.224.42 crores, resulting in decrease of Rs.0.11 per unit of purchase.
Reference Units Formula January February March Total
Total Fixed Cost claimed Rs. Crores A 687.30 638.32 847.41 2173.03
Excess fixed cost claimed by APGENCOs
Table 7, FC-1 Rs. Crores B 0.0 0.0 180.31 180.31
Estimated fixed cost to be disallowed
Table 10, FC-2
Rs. Crores C 0.0 0.15 0.0 0.15

36
STOA Table 11, FC-3
Rs. Crores D 16.68 11.31 15.87 43.86
Estimated reduction Rs. Crores E= B+C+D 16.68 11.46 196.28 224.42
Revised Fixed Cost Rs. Crores F = A-E 670.62 627.01 651.23 1948.86
Actual Fixed cost per unit of Purchases
Rs./kWh G 0.99 1.02 1.12 1.05
Estimated Fixed cost per unit of Purchases
Rs./kWh H 0.97 1.00 0.86 0.94
Difference in Fixed Cost per unit
Rs./kWh I = G-H 0.02 0.02 0.26 0.11
(g) To advocate transparency regarding information on plant operating parameters such as availability factor, fuel consumption, station heat rate, transit losses, etc. And insist that the Discoms should make such information available at least by the time or at the time of filing petitions to claim FSA.
(h) To insist on improving the operating efficiencies of APGENCOs to bring them on par with that of CGS stations of comparable capacities, thereby reducing their variable costs.
(i) Considering the APERC operating regulations of thermal power stations, the excess variable cost has been calculated to be Rs.194.25 cr. The Objector seeks the Commission to do a prudence check and disallow it accordingly.
(j) To disallow UI charges of Rs.15.95 crores and purchases of 46.9 MUs for the quarter.
(k) To disallow excess distribution losses of 652.93 MUs and the corresponding amount of Rs.367.05 crores that could have been avoided by the Petitioners to substitute for the losses incurred during the quarter.
(l) The reductions as mentioned in the above points (i), (j) and (k) add up to an amount of Rs.577.25 crores, thus resulting in a reduction of Rs.0.28 per unit of purchase. Therefore, the Hon’ble Commission is requested to disallow the same.

37
Reference Units Formula January February March Total
Total Variable Cost filed Rs. Crores A 1811.7 1653.1 2104.0 5568.8
Excess Variable cost claimed due to plant inefficiencies
Table 17, VC-1
Rs. Crores B 70.21 58.99 65.05 194.25
UI Charges VC-2 Rs. Crores C 6.33 4.32 5.30 15.95
Additional power purchased due to more system losses
Table 25, VC-3
Rs. Crores D 76.03 291.02 367.05
Estimated reduction Rs. Crores E= B+C+D 152.57 63.31 361.36 577.25
Revised Variable Cost Rs. Crores F = A-E 1659.15 1589.78 1742.61 4991.54
Actual Variable cost per unit of Purchases
Rs./kWh G 2.62 2.64 2.79 2.69
Estimated Variable cost per unit of Purchases
Rs./kWh H 2.40 2.53 2.31 2.41
Difference in Variable Cost per unit
Rs./kWh I = G-H 0.22 0.11 0.48 0.28
(m) To conduct a prudence check on the diversion of expensive power to agricultural sector and avoid passing it on to non-agricultural consumers.
(n)
Consumer Category Approved in T.O 2012-13 Actual claimed by Discoms in 2012-13
Jan Feb Mar Q4 Jan Feb Mar Q4
Domestic 19.1% 18.9% 22.6% 20.3% 20.8% 21.5% 21.7% 21.3%
Industrial 53.5% 54.8% 48.9% 52.2% 43.9% 48.1% 41.4% 44.3%

38
% change for Industrial
-9.6% -6.7% -7.5% -7.9%
Agriculture 27.4% 26.2% 28.5% 27.4% 35.3% 30.4% 37.0% 34.4%
% change for Agriculture
+7.9% +4.2% +8.5% +7.0%
Total Sales (MUs) 6379.1 6520.6 7444.8 20344.5 5702.0 5315.6 5854.8 16872
The below table shows an illustration of the costly power that has been purchased from IPPs.
IPP Formula
Variable cost per unit (Rs./kWh)
(1)
Actual Power Purchase (MUs)
(2)
Total Variable Cost (Rs. Crores)
March March
Konaseema A 9.99 12.5 12.48
Tata Power B 5.62 99.7 56.03
Vemagiri C 10.64 51.8 55.12
GMR Energy Trading Ltd D 5.60 17.39 9.73
Total of IPPs and Other Sources
E = A+B+C+D 181.4 133.4
Total F 7540.73 2104
% of power purchased for >Rs.5.50 per unit
G = E/F 2.4% 6.3%
% of Power purchased from IPP
82.6%

39
(o) To disallow excess distribution losses that resulted in an increased power purchase quantum for the quarter, thus increasing the total variable cost being burdened on the consumers
Consumer Category Formula Approved by T.O 2012-13 Actuals claimed by Discoms
January February March Q4 January February March Q4
Total Purchases (MUs)
A 7542.81 7695.30 8821.33 24059.44 6912.08 6271.83 7540.73 20724.63
Total Sales (MUs) B 6379.08 6520.60 7444.77 20344.45 5701.96 5315.58 5854.77 16872.31
Distribution losses (MUs)
C = A-B 1163.73 1174.70 1376.56 3714.99 1210.12 956.25 1685.95 3852.32
Distribution losses (%)
D = C x 100/A
15.4% 15.3% 15.6% 15.4% 17.5% 15.2% 22.4% 18.6%
(p) To adjust the estimated penalties (Rs.300 crores approx.) collected from industrial consumers against the increase in the total cost in the quarter.
REVISED FSA CALCULATIONS
FSA Calclation as Filed Jan Feb March Q4 VC/ unit as per Filing Rs./kwh A 2.621 2.636 2.790 2.687 VC/ unit as per TO 2012-13 Rs./kwh B 2.089 2.204 2.269 2.189 Pi Rs./kwh C = A-B 0.532 0.432 0.521 0.498 Ei Units D 6912079433 6271828523 7540725017 20724632973 Pi x Ei Rs. Cr E=C x D 367.85 270.91 392.69 1031.45 FC as per Filing Rs. Cr F 687.30 638.32 847.41 2173.03 FC as per TO 2012-13 Rs. Cr G 709.57 709.57 709.57 2128.72 Fci Rs. Cr H=F-G -22.27 -71.25 137.84 44.32 Z Rs. Cr I 3.03 0.00 58.89 61.92 FSA Rs. Cr J=E+H+I 348.61 199.66 589.42 1137.69 Sales for FSA Calculation Mus K 3686.39 3698.76 3691.06 11076.21

40
FSA per Unit Rs./kwh L=I x 10/K 0.9457 0.5398 1.5969 1.0271
FSA Calclation as per Revised estimates Jan Feb March Q4 VC/ unit as per Filing Rs./kwh A 2.459 2.539 2.483 2.493 VC/ unit as per TO 2012-13 Rs./kwh B 2.089 2.204 2.269 2.188 Pi Rs./kwh C = A-B 0.371 0.336 0.214 0.305 Ei Units D 6746018457 6260545046 7018215632 20024779135 Pi x Ei Rs. Cr E=C x D 249.97 210.08 149.90 609.95 FC as per Filing Rs. Cr F 670.63 626.86 651.13 1948.61 FC as per TO 2012-13 Rs. Cr G 709.57 709.57 709.57 2128.72 Fci Rs. Cr H=F-G -38.95 -82.72 -58.44 -180.11 Z Rs. Cr I 3.03 0.00 58.89 61.92 FSA Rs. Cr J=E+H+I 214.06 127.37 150.35 491.77 Sales for FSA Calculation Mus K 3686.39 3698.76 3691.06 11076.21
FSA per Unit Rs./kwh L=I x 10/K 0.5807 0.3444 0.4073 0.4440

APGENCO Fixed Cost As approved in T.O 2012-13 Fixed Cost As filed by licenciesQ1 Q2 Q3 Q4 Total Q1 Q2 Q3 Q4 Total Diff Variance %
Hydel FC 293 293 293 293 1172 293 293 293 293 1172 0Thermal & Hydel Income Tax 30.31 30.31 30.31 30.31 121.24 21.3 44.8 44.1 108.6 218.719 97.479 80.40168
323 323 323 323 1293.24 314 338 337 402 1390.719 97.479 7.53758
APGENCO Fixed Cost As approved in T.O 2012-13 Fixed Cost As filed by licenciesQ1 Q2 Q3 Q4 Total Q1 Q2 Q3 Q4 Total Diff Variance %
Thermal FC 975 975 975 975 3900 975 975 975 1047 3972 72975 975 975 975 3900 975 975 975 0 2925 -975 -25
3.2 APDISCOMS considered the Fixed charges approved in the T.O 12-13 onlyAmount towards Fixed Charges claimed by the DISCOMs as follows(Other than Incentive & I.T)
Particulars Jan-13 Feb-13 Mar-13FC paid to APGENCO 422.59 422.59 422.59 1267.77
1 More over, Hon'ble APERC provided separetly for incentive and income tax of Rs.69.96 Crs and 51.28 Crs respectively, the Objector not considered the same and leading to huge variation.the clarification is given in the above table.
2 Further it is out of point to mention here that the Hon'ble Commission in I.A No: 4 Of 2012 in O.P No:15 of 2009 Dt:28.09.12 stated that Adv.IT is to be reimbursed by the DISCOMs on proof of Payment& Incentive on annual basis.
APGENCO also claimed the Fixed charges as per the T.O only.Therefore the question of excess claim does not arise.
3.3 Truing up of Fixed cost : As the DISCOMS are following the regulation 1 of 2008.As per Clause 11.2.1.Recovery of Fixed charges for the F.Y 2011-12 of Rs.185 Crs in respect of APGENCO already effected in the previous Qtr FSA. Now the DISCOMs are in the process of calculation of recovery of FC F.Y 2012-13.After approval the same will be passed on to consumers if there is any recovery.
Rs.in Crores
ANNEXURE-I