sri lanka : banking sector - john keells stock brokers [ jksb
TRANSCRIPT

1
Equities Sector Update
Sri Lanka : Banking Sector
A J
KSB
Res
earc
h P
ubli
cati
on
John Keells Stock Brokers (Pvt) LtdCompany No. PV 89130, Glennie Street,Colombo 2,Sri Lanka.
Tel: 9411 2421 101-9 (Gen.),9411 2326 003,9411 2439 047/8
Fax: 9411 2326 863,9411 2342 068
Yolan [email protected]
October 2007
LOW BANKING PENETRATION
Sri Lanka’s financial services sector is dominated by licensed commercialbanks (LCB) with a 48% share of assets while banking penetration in thecountry remains significantly low in comparison to regional nations despitea relatively high per capita GDP. The LCB segment is dominated by statebanks Peoples Bank and Bank of Ceylon accounting for 42% of LCBassets, while the four largest local private banks account for a share of39%. Operational inefficiencies in state and local banks have forced highercost to income ratios, while high effective tax rates and a low variance inrisk free rates on gov. securities and the AWPLR have lead to wide interestspreads contributing to the lower level of banking penetration in the country.
ASSET GROWTH AND ASSET QUALITYCredit to the private sector has grown by a CAGR of 21.1% since 2001,while average net advances in LCB’s have grown at a CAGR of 18.26% inthe same period, led by growth in consumer finance, leasing and pawningsub segments. Asset quality has also improved considerably over the last 5years with gross non performing assets declining from 15.3% in 2001 to5.54% in 2006 with provision cover also improving consistently over thesame period. Deposits have grown by a CAGR of 17% in the last fiveyears. High interest rates currently prevalent are expected to continue inthe short term, and decline modestly by approximately 100-150 basis pointsby year end 2008. Earnings however could be significantly affected byprovisions on rising non performing assets, should interest rates rise furtheror remain at current levels for over a 12mth – 18mth period.
NET INTEREST MARGINSNet interest margins have remained stable despite improvements in cost toincome ratios and a declining gross NPA ratio. In addition the re-pricing ofassets ahead of deposits in a rising interest rate environment has resultedin higher margins over a period of time. Central Bank statistics indicate arise in ROA from 0.62% in 2001 to 1.32% in 2006 among LCB’s.
REGULATORY ENVIRONMENTA Central Bank directive issued in January this year has restricted ownershipin banks to 15% of their voting rights. Capital requirements have alsoincreased with new risk weightings assigned to assets effectively increasingtotal capital adequacy requirements from 10% to 11%, while the adoptionof the Basel II framework from January 2008 would make regulatorycapital more sensitive to the risk exposure of the bank. This along withincreased provisioning requirements, a high effective tax rate and guidelineson distribution of profits has made the task of generating returns to attractfresh capital that is necessary to fuel growth, a much harder challenge.
EARNINGSWe expect earnings growth of 33% and 25% in FY07 and FY08 respectively,among the six listed banks covered in this report, stemming from healthynet interest margins, sound loan growth, and a steady decline in cost toincome ratios. The sector trades at a price/earnings multiple of 8.47xcarrying a 12.6% discount to the market.
Indexed ASPI / BFI
-
100
200
300
400
500
600
700
02-J
an-0
102
-May
-01
02-S
ep-0
102
-Jan
-02
02-M
ay-0
202
-Sep
-02
02-J
an-0
302
-May
-03
02-S
ep-0
302
-Jan
-04
02-M
ay-0
402
-Sep
-04
02-J
an-0
502
-May
-05
02-S
ep-0
502
-Jan
-06
02-M
ay-0
602
-Sep
-06
02-J
an-0
702
-May
-07
ASPI BFI
2007E PRICE P/E EPS GTH DVD YLD ROE ROAA
COMB 135 8.7 41% 4.4% 18% 1.55%
HNB 103 9.0 19% 4.9% 17% 1.21%
SAMP 120 5.3 46% 2.1% 18% 1.31%
NDB 162 9.3 40% 3.1% 12% 1.98%
DFCC 129 8.9 19% 3.9% 11% 2.32%
NTB 35 9.2 47% 2.9% 16% 0.92%
Source : JKSB Estimates

2
FINANCIAL SECTOR
The Financial Sector in Sri Lanka is dominated by Licensed CommercialBanks (LCB’s) which account for 48% of the assets of the country’sfinancial services sector. The country has 23 LCB’s of which 11 arelocal banks while 12 are foreign. The LCB segment is dominated bythe two large public banks, Bank of Ceylon and Peoples Bank whichtogether hold a 42% market share of LCB assets. The two state banksalong with the 4 largest local banks account for as much as 81% ofLCB assets.
Given the dominance of LCB’s in the financial sector, other alternativesources of finance to private enterprises are significantly smaller. Nearlytwo thirds of assets under licensed specialized banks arise from theNational Savings Bank which by design invests much of its funds intogovernment securities. In addition the nation’s provident funds whichaccount for 18% of the financial sector assets invests only a marginalportion of their funds outside of government securities. Thuscompetition to LCB’s from alternative sources of funds amount toapproximately 25% of the nation’s financial services sector assets.
The financial sector remains significantly under developed with regardto diversification and management of risk, with derivative instrumentsan active corporate debt market and securitization that feature stronglyin more developed financial sectors being largely absent in Sri Lanka atpresent. The sector has however advanced significantly in the provisionof services relating to provision of credit, mobilisation of savings forinvestment and the facilitation of trade and payments.
Low Banking Penetration in Sri Lanka
Sri Lanka exhibits a relatively low banking penetration, measured by aratio of Broad Money to GDP in comparison to regional standardsand neighbours India and Pakistan despite a relatively higher per capitaGDP. Sri Lanka also ranks lower to most regional nations apart fornations such as Thailand and India, in terms of the degree ofsophistication of the financial intermediary sector denoted by thecurrency to M1 ratio, which is representative of the currency incirculation against demand deposits. The higher the ratio the lower thedeemed level of sophistication in the country’s financial system. M2(M1 + Time and Savings Deposits) to GDP ratio, often used as ameasure of the depth of the financial sector or level of financialintermediation in the county, ranks Sri Lanka below most major regionalcountries. Some of the more developed nations increasingly exhibitsome level of disintermediation with funds being diverted away fromdeposits to debt instruments and equities. Given the significantly lowbanking penetration despite a relatively high per capita GDP and lowprivate sector credit to GDP, we surmise that Sri Lanka’s economy isunder banked.
Financial System in Sri Lanka (Assets)
Central Bank13%
Licensed Commercial Banks48%Licensed
Specialised Banks10%
Specialised Financial institutions (Primary dealers, S. leasing Companies, Co-orperative Rural Banks)4%
Non Bank Deposits Taking Financial Institutions4%
Providents Funds (EPF, ETF and Others)18%
Insurance Companys3%
Source : Central Bank Publications
Source : Central Bank Publications & Bank Annual Reports
LCB's Advances by Sector - 2002 - 2006
-
5.0
10.0
15.0
20.0
25.0
30.0
35.0
40.0
Com
mer
cial
Fina
ncia
l
Agr
icul
tura
l
Indu
stria
l
Tour
ism
Hou
sing
Con
sum
ptio
n
Serv
ices
Oth
er
%
2002 2003 2004 2005 2006
Source : Central Bank Publications
Market Share - 2006 (Assets)
SAMP, 6%
NDB, 4%
SEYB, 8%
NTB, 3%
HNB, 12%
COMB, 13%Others, 12%
Peoples Bank, 20%
Bank of Ceylon, 22%
Australia 13% 14% 87% 70% 687% 497% 36,553 China 22% 24% 162% 139% 755% 568% 2,001 Hong Kong 43% 47% 281% 236% 650% 501% 27,466 India 54% 61% 70% 63% 130% 104% 797 Indonesia 43% 44% 41% 47% 95% 106% 1,640 Malaysia 24% 27% 128% 133% 526% 493% 5,718 Pakistan 32% 44% 47% 44% 146% 100% 830 Philippines 41% 47% 55% 58% 135% 125% 1,345 Singapore 29% 34% 125% 114% 427% 331% 29,917 South Korea 27% 31% 70% 76% 257% 241% 18,392 Thailand 71% 76% 104% 113% 147% 150% 3,136 SRI LANKA 52.0% 54.0% 35.45% 32.26% 68% 60% 1,355 Data Source : International Financial Statistics - IMF 2007
Currency/M1 2006
Currency/M1 2002
M2/GDP 2006
M2/GDP 2002
Overall Financial Penetration 2006
(Currency/M1)/M2/GDP
Overall Financial Penetration 2002
(Currency/M1)/M2/GDP
Per Capita GDP 2006 (Nominal)
3
ADVANCES AND DEPOSITS
Asset Mix
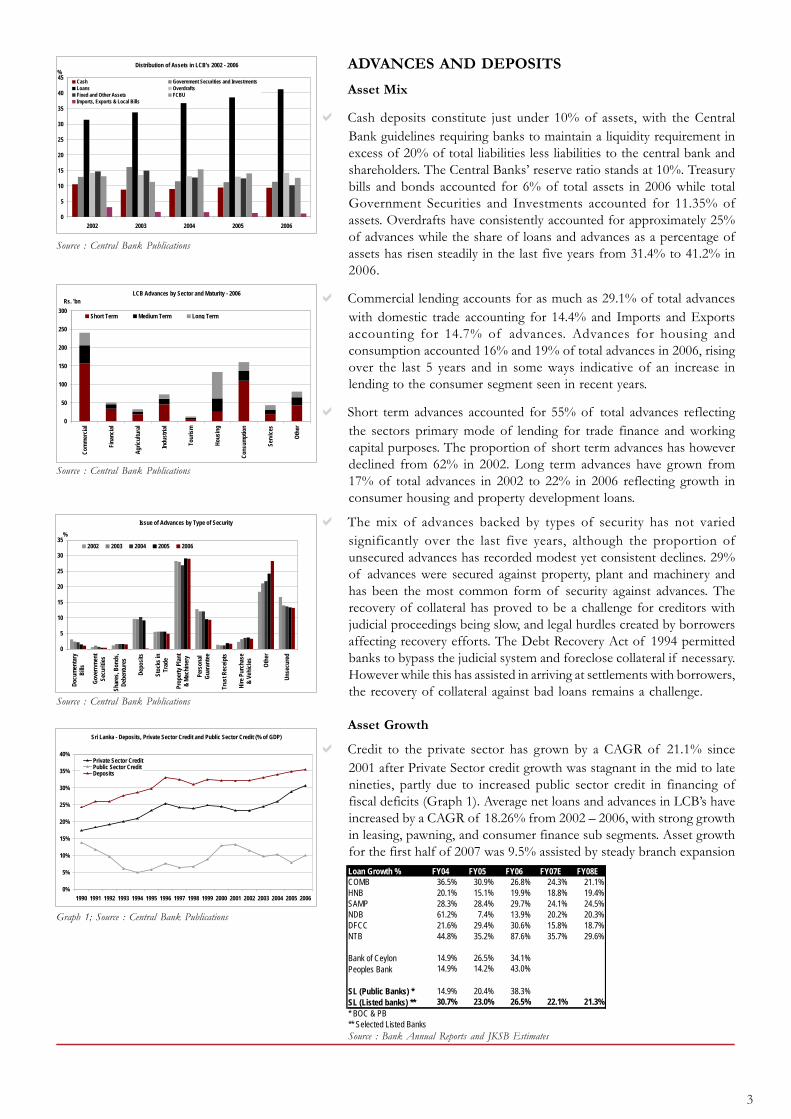
Cash deposits constitute just under 10% of assets, with the CentralBank guidelines requiring banks to maintain a liquidity requirement inexcess of 20% of total liabilities less liabilities to the central bank andshareholders. The Central Banks’ reserve ratio stands at 10%. Treasurybills and bonds accounted for 6% of total assets in 2006 while totalGovernment Securities and Investments accounted for 11.35% ofassets. Overdrafts have consistently accounted for approximately 25%of advances while the share of loans and advances as a percentage ofassets has risen steadily in the last five years from 31.4% to 41.2% in2006.
Commercial lending accounts for as much as 29.1% of total advanceswith domestic trade accounting for 14.4% and Imports and Exportsaccounting for 14.7% of advances. Advances for housing andconsumption accounted 16% and 19% of total advances in 2006, risingover the last 5 years and in some ways indicative of an increase inlending to the consumer segment seen in recent years.
Short term advances accounted for 55% of total advances reflectingthe sectors primary mode of lending for trade finance and workingcapital purposes. The proportion of short term advances has howeverdeclined from 62% in 2002. Long term advances have grown from17% of total advances in 2002 to 22% in 2006 reflecting growth inconsumer housing and property development loans.
The mix of advances backed by types of security has not variedsignificantly over the last five years, although the proportion ofunsecured advances has recorded modest yet consistent declines. 29%of advances were secured against property, plant and machinery andhas been the most common form of security against advances. Therecovery of collateral has proved to be a challenge for creditors withjudicial proceedings being slow, and legal hurdles created by borrowersaffecting recovery efforts. The Debt Recovery Act of 1994 permittedbanks to bypass the judicial system and foreclose collateral if necessary.However while this has assisted in arriving at settlements with borrowers,the recovery of collateral against bad loans remains a challenge.
Asset Growth
Credit to the private sector has grown by a CAGR of 21.1% since2001 after Private Sector credit growth was stagnant in the mid to latenineties, partly due to increased public sector credit in financing offiscal deficits (Graph 1). Average net loans and advances in LCB’s haveincreased by a CAGR of 18.26% from 2002 – 2006, with strong growthin leasing, pawning, and consumer finance sub segments. Asset growthfor the first half of 2007 was 9.5% assisted by steady branch expansion
Distribution of Assets in LCB's 2002 - 2006
0
5
10
15
20
25
30
35
40
45
2002 2003 2004 2005 2006
%
Cash Government Securities and InvestmentsLoans OverdraftsFixed and Other Assets FCBUImports, Exports & Local Bills
LCB Advances by Sector and Maturity - 2006
0
50
100
150
200
250
300
Com
mer
cial
Fina
ncia
l
Agr
icul
tura
l
Indu
stria
l
Tour
ism
Hou
sing
Con
sum
ptio
n
Serv
ices
Oth
erRs. 'bn
Short Term Medium Term Long Term
Issue of Advances by Type of Security
0
5
10
15
20
25
30
35
Doc
umen
tary
Bill
s
Gov
ernm
ent
Secu
ritie
s
Shar
es, B
onds
,D
eben
ture
s
Dep
osits
Stoc
ks in
Trad
e
Prop
erty
Pla
nt&
Mac
hine
ry
Pers
onal
Gua
rant
ee
Trus
t Rec
eipt
s
Hire
Pur
chas
e&
Veh
icle
s
Oth
er
Uns
ecur
ed
%
2002 2003 2004 2005 2006
Loan Growth % FY04 FY05 FY06 FY07E FY08ECOMB 36.5% 30.9% 26.8% 24.3% 21.1%HNB 20.1% 15.1% 19.9% 18.8% 19.4%SAMP 28.3% 28.4% 29.7% 24.1% 24.5%NDB 61.2% 7.4% 13.9% 20.2% 20.3%DFCC 21.6% 29.4% 30.6% 15.8% 18.7%NTB 44.8% 35.2% 87.6% 35.7% 29.6%
Bank of Ceylon 14.9% 26.5% 34.1%Peoples Bank 14.9% 14.2% 43.0%
SL (Public Banks) * 14.9% 20.4% 38.3%SL (Listed banks) ** 30.7% 23.0% 26.5% 22.1% 21.3%* BOC & PB** Selected Listed BanksSource : Bank Annual Reports and JKSB Estimates
Source : Central Bank Publications
Source : Central Bank Publications
Source : Central Bank Publications
Sri Lanka - Deposits, Private Sector Credit and Public Sector Credit (% of GDP)
0%
5%
10%
15%
20%
25%
30%
35%
40%
1990 1991 1992 1993 1994 1995 1996 1997 1998 1999 2000 2001 2002 2003 2004 2005 2006
Private Sector CreditPublic Sector CreditDeposits
Graph 1; Source : Central Bank Publications

4
Leases outstanding among listed banks have significantly outpaced loangrowth, growing at a CAGR of 29.8% from 2002 to 2006. Leasesaccounted for just 9% of the loan book of listed banks, and is expectedto continue to be a key driver of growth in the lending portfolio ofbanks.
The number of credit cards issued has also grown significantly in thelast 5 years with total cards issued growing at a CAGR of 25.99%while total outstanding credit from credit cards has grown at a CAGRof 32.73% in the same period. Further non interest income in banksare being boosted by increased use of value added services (Table 3)as well as fees and commission income from trade finance activitiesand the steady depreciation of the SLR leading to substantial earningsfrom foreign exchange income via FCBUs. Non interest income nowaccounts for approximately a third of operating income.
Loan growth has been particularly strong over the last three years andwe expect growth in advances to slow down to an average of 22.1%this year and 21.3% for FY08. A tightening of monetary expansion bythe central bank to restrict growth in private sector credit in a bid tocurtail rising inflation has led to a sharp rise in interest rates this year.Thus plans for aggressive loan book growth have been somewhatrestricted given the general slow down in economic activity, with banksexercising greater prudence in expanding its loan book in a high interestrate environment. Interest rates are not expected to decline in the shortterm this year, but we expect interest rates to decline modestly byapproximately 100 to 150 basis points by year end 2008.
Deposits and Liabilities
Time and savings deposits account for 61.5% of total capital andliabilities in banks, with 76% of time and savings deposits arising fromthe commercial banking sector while the National Savings Bank accountsfor 17% of time and savings deposits. Non residents, primarilyrepresenting Sri Lankans employed abroad accounted for 23.3% oftime and savings deposits in 2006, down from 26.3% in 2004. Residentsin the country account for 76.1% of time and saving deposits whileaccounting for 78.6% of demand deposits. The GOSL accounted for19.4% of demand deposits in 2006.
Total deposits in LCB’s recorded a growth of 18.9% in 2006, whilegrowing at a CAGR of 17% from 2002 – 2006, despite treasury billrates continuing to earn a better yield than yields on bank fixed andsavings deposits. We estimate deposit growth of the above selectedlisted banks to record an average of 19% this year and 20% in FY08.
YOY % Growth in Assets and Liabilities of LCBs'
-20%
-10%
0%
10%
20%
30%
40%
50%
60%
70%
80%
90%
100%
1999 2000 2001 2002 2003 2004 2005 2006*
AssetsNet Loans and AdvancesDepositsBorrowings
Source : Central Bank Publications
Table 3; Source : Central Bank Publications
2003 2004 2005 2006*
Internet Banking Transactions '000 188 439 874 1,162 * Annualised
Source : Bank Annual Reports and JKSB Estimates
Deposit Growth 2005 2006 2007E 2008ECOMB 29% 24% 22% 23%HNB 8% 15% 11% 13%SAMP 27% 27% 21% 22%NDB 26% 52% 20% 23%DFCC 38% 134% 35% 30%NTB 37% 44% 20% 22%SL (Listed banks) ** 21% 26% 19% 20%** Selected Listed Banks
Distribution of Capital and Liabilities in LCB's - 2002 - 2006
-
10
20
30
40
50
60
70
DemandDeposits
Time andSavingsDeposits
Domestic Inter-Bank
Borrowing
ForeignBorrowing
Other Liabilities Capital &Reserves
%
2002 2003 20042005 2006
YOY Deposit and Bank Borrowings Growth / AWDR % T Bill
-40%
-20%
0%
20%
40%
60%
80%
100%
1999 2000 2001 2002 2003 2004 2005 2006
0
2
4
6
8
10
12
14
16
18
20%
DepositsBorrowingsAWDR1yr T Bill
Source : Central Bank Publications
Source : Central Bank Publications
YOY Credit and Deposit Growth
-30%
-20%
-10%
0%
10%
20%
30%
40%
50%
60%
70%
1991 1992 1993 1994 1995 1996 1997 1998 1999 2000 2001 2002 2003 2004 2005 2006
Private Sector Credit Public Sector CreditDeposits
Source : Central Bank Publications

5
Asset Quality
Non performing advances in commercial banks have declinedsignificantly over the last five years from a gross NPA ratio of 15.30%in 2001 to 5.54% in 2006, despite strong growth in advances.
Improved resources in terms of expertise and information systemswith regard to risk assessment and credit monitoring coupled with moreeffective internal systems and loan approval procedures has contributedsignificantly to the improvement in asset quality over the last 5 years,as depicted with a decline in the NPA Ratio. The decline in the NPAratio was also assisted by the decline in interest rates witnessed between2001 and 2003. Further banks have also exercised greater prudence inprovisioning for bad loans with provision cover also improvingappreciably since 2001 (Graph 2). Public sector banks as well as listedbanks recorded consistent in improvement in asset quality as well as anincrease in their loan loss reserves (Table 4 & 5).
The high interest rates this year have resulted in a sharp rise in nonperforming loans in the first half of FY07. NPL’s increased by 9.12%last year among the 6 selected listed banks listed in Table 6, while 1Hresults for FY07 indicate a 14.87% increase in NPL’s in the first sixmonths for the same group of listed banks. NPLs ratios have howeverremained healthy given continued strong loan growth, while bankrecovery efforts should mitigate the adverse growth in NPL’s in thesecond half of this year. However 1H growth in NPL’s indicate thatthe consistent improvement seen in asset quality over the past fewyears may reverse should the present high interest rate environmentpersist over the next 12mths. Most banks exhibiting improved provisioncover will be cushioned by the rise in NPL’s, but earnings may beadversely affected if rates remain high over a 12 - 18 mth period.
NPL & Provision Cover / AWPLR
-
2
4
6
8
10
12
14
16
18
20
1998 1999 2000 2001 2002 2003 2004 2005 2006
%
-
10
20
30
40
50
60
70
80%
Gross Non-performing Advances RatioNet Non-performing Advances RatioProvision Coverage Ratio (RHS)AWPLR (RHS)
YOY Assets and NPA Growth
-40%
-30%
-20%
-10%
0%
10%
20%
30%
40%
50%
60%
70%
1999 2000 2001 2002 2003 2004 2005 2006*
Net Loans and AdvancesGross Non-performing Advances Net Non-performing AdvancesProvision for Bad and Doubtful Advances
Graph 2; Source : Central Bank Publications
Source : Central Bank Publications
NPL Coverage FY04 FY05 FY06 FY07E FY08ECOMB 50.0% 53.9% 60.4% 59.6% 62.2%HNB 48.8% 63.5% 65.6% 62.5% 62.4%SAMP 64.4% 82.4% 82.3% 88.3% 92.3%NDB 86.5% 125.6% 188.2% 156.8% 123.2%DFCC 32.0% 47.0% 37.5% 39.6% 43.6%NTB 48.6% 56.4% 58.3% 60.0% 62.0%
Bank of Ceylon 70.3% 82.2% 72.2%Peoples Bank 87.4% 87.2% 92.3%
SL (Public Banks) * 79.8% 85.1% 82.9%SL (Listed banks) ** 53.5% 67.7% 69.0% 67.2% 67.7%* BOC & PB** Selected Listed Banks
Table 5; Source : Bank Annual Reports and JKSB Estimates
Table 4; Source : Bank Annual Reports and JKSB Estimates
NPL Ratio FY04 FY05 FY06 FY07E FY08ECOMB 4.53% 3.43% 2.79% 2.97% 3.11%HNB 10.30% 8.21% 7.46% 6.93% 6.38%SAMP 8.64% 6.19% 5.52% 5.16% 4.85%NDB 7.08% 4.32% 2.22% 1.98% 1.90%DFCC 8.89% 4.95% 4.90% 5.00% 5.00%NTB 6.44% 6.12% 5.37% 5.26% 5.32%
Bank of Ceylon 11.68% 7.61% 6.49%Peoples Bank 14.53% 11.78% 7.65%
SL (Public Banks) * 13.11% 9.59% 7.06%SL (Listed banks) ** 7.69% 5.57% 4.80% 4.62% 4.47%* BOC & PB** Selected Listed Banks
YOY Change in NPL's FY04 FY05 FY06 FY07E FY08ECOMB -4.44% -0.89% 3.14% 32.19% 27.03%HNB -15.80% -8.21% 8.87% 10.43% 9.88%SAMP -2.90% -7.98% 15.71% 15.87% 17.07%NDB -9.97% -34.55% -41.46% 7.36% 15.20%DFCC -5.18% -27.86% 29.04% 18.24% 18.65%NTB 52.18% 28.41% 64.68% 32.84% 31.06%SL (Listed banks) ** -9.01% -11.01% 9.12% 17.51% 17.33%
Table 6; Source : Bank Annual Reports and JKSB Estimates

6
INTEREST SPREADS AND OPERATING COSTS
Sri Lanka has consistently exhibited high interest spreads and is oftenseen as a fundamental reason for the nation’s relatively low credit tothe private sector as a % of GDP and a consequently low level ofbanking penetration. Net interest margins among banks in Sri Lankaare some of the highest in the region, comparing favourably only toPakistan and Indonesia in 2006.
Cost / Income Ratio
The two large state banks Bank of Ceylon and Peoples Bank whichaccount for 42% of commercial banking assets have consistentlyreported high cost to income ratios due to operational inefficiencies.The large market shares held by the two state banks therefore permitthe local private banks to enjoy even higher margins than the statebanks despite themselves ranking lower than banks in most regionalnations. Sri Lanka also exhibits a fairly volatile interest rate environment,and when rates change assets are predictably re-priced ahead of depositsthus contributing to higher net interest margins over a period of time.
Cost / Income ratios of local banks excluding VAT compare morefavorably to regional countries with banks such as COMB and the twopredominantly development banks NDB and DFCC also exhibit asound cost to income ratio (excl. VAT). Cost to Income ratios excludingVAT in banks such as COMB compares well even with the bankingsector in more developed nations indicating that curtailing of operatingcosts among banks in Sri Lanka is possible if a banks’ operating modelis managed effectively
Cost / Income FY04 FY05 FY06COMB 56.5% 54.6% 50.4%HNB 70.8% 63.3% 67.7%SAMP 74% 71% 64%NDB 63.5% 63.3% 56.0%DFCC 43.4% 44.2% 45.1%NTB 79.7% 76.8% 71.5%
Bank of Ceylon 67.8% 80.3% 79.1%Peoples Bank 73.1% 71.6% 72.8%
SL (Public Banks) * 70.4% 75.7% 75.8%SL (Listed banks) ** 63.7% 60.8% 59.2%SL 67.2% 67.9% 67.4%* BOC & PB** Selected Listed Banks
Source : Bank Annual Reports and JKSB Estimates
Interest Rates
0
2
4
6
8
10
12
14
16
18
20
22
24
1997 1998 1999 2000 2001 2002 2003 2004 2005 2006 2007
%
AWPLRAWDRT Bill RateSPREAD
Source : Central Bank Publications
FY06Australia 2.3China 2.6Hong Kong 1.9India 3.1Indonesia 6.3Malaysia 2.4Pakistan 5.6Philippines 3.9Singapore 2.1South Korea 3.1Taiwan 2.0Thailand 3.4SL (Public Banks) * 4.0SL (Listed banks) ** 4.3* BOC & PB** Selected Listed Banks
NIM FY06Australia 47.34China 44.89Hong Kong 34.83India 57.29Indonesia 53.14Malaysia 42.75Pakistan 32.25Philippines 60.55Singapore 42.87South Korea 44.19Taiwan 45.24Thailand 55.19SL (Public Banks) * 75.8SL (Listed banks) ** 59.2* BOC & PB** Selected Listed Banks
Cost / income
Source : Bank Annual Reports; Deutsche Bank Global Markets Reserach, Asia Pac (ExJapan) Bank, Sept. 17th 2007
Cost / income (Excl. VAT) FY04 FY05 FY06 FY07E FY08ECOMB 50.5% 47.4% 41.9% 40.5% 40.2%HNB 66.7% 61.4% 59.9% 60.4% 59.0%SAMP 68.1% 65.0% 55.3% 54.8% 54.4%NDB 58.4% 58.0% 44.2% 47.1% 47.6%DFCC 36.3% 36.0% 34.9% 36.0% 37.1%NTB 76.4% 72.5% 71.5% 69.8% 67.1%
Bank of Ceylon 62.2% 74.0% 69.9%Peoples Bank 65.8% 64.8% 63.8%
SL (Public Banks) * 63.9% 69.2% 66.7%SL (Listed banks) ** 58.4% 55.6% 50.9% 51.0% 50.4%* BOC & PB** Selected Listed Banks
Source : Bank Annual Reports and JKSB Estimates

7
Implications of high Cost/Income ratio
Local banks have steadily improved the cost / income ratios over thepast few years. However despite these improvements, lower NPL’sand consequently lower provision expense, have not resulted in anarrowing of spreads but rather an increase in returns for the bankwith net interest margins remaining stagnant. (Table 7). The retentionof higher margins has helped banks to generate sufficient earnings tofund future growth or attract investors to infuse new capital to fundgrowth. However wider spreads act as a constraint to increase bankingpenetration to under banked segments such as the SME and consumersegments.
The VAT on financial services of 20% charged to banks significantlycontributes to a higher cost structure. Regulations including new riskweightings and the adoption of Basel II regulations from January 2008and the requirement to build up general provisions to 1% of performingloans have made growing retained earnings and raising of fresh capitala challenge for the banks. Most local private banks which are listedhave successfully raised Tier 1 Capital through rights issues in the recentpast. However increasing constraints on earnings brought about byincreased provisioning requirements and the high effective tax ratescoupled with guidelines on distribution of profits, makes the task ofgenerating sufficient returns to attract investors to persist in infusingfresh capital, much harder.
Risk free government securities have also closely tracked the averageprime lending rate which has also been a key contributor in facilitatingbanks to maintain high rates and high spreads. The end result howeverof wide spreads is the stifling of growth of private sector credit,particularly to SME’s while acting as a constraint to deepen the level ofbanking penetration in the country.
Further as mentioned earlier in this report, with the commercial bankingsector being the dominant segment in the nations financial sector,alternatives sources of funds for private enterprises are smaller. Therebyprivate enterprises have to endure higher funding costs while bankscontinue to grow lending portfolios at a steady pace while retaininghigh margins. In this context while taxes on the sector are unlikely to belowered in the short and medium term, it becomes increasingly necessaryfor state banks to lower their operating cost structure and take the leadin facilitating the narrowing of spreads in the sector, with competitivepressures inevitably forcing the smaller local private banks to follow.This is essential for growth in credit to the private sector and a greaterlevel of banking penetration in the SME and consumer segments.
Personnel Cost/Av. Assets FY04 FY05 FY06 FY07E FY08ECOMB 1.4% 1.3% 1.3% 1.2% 1.2%HNB 1.5% 1.5% 1.5% 1.6% 1.8%SAMP 1.4% 1.4% 1.3% 1.3% 1.4%NDB 1.7% 1.8% 1.3% 1.4% 1.5%DFCC 1.1% 1.1% 1.0% 1.0% 1.0%NTB 1.3% 1.6% 1.7% 1.5% 1.5%SL (Listed banks) ** 1.4% 1.4% 1.4% 1.4% 1.4%
Source : Bank Annual Reports and JKSB Estimates
Licensed Comemrcial Banks : NIM, NPL, Cost/Income & ROE
(15)(10)(5)
-5
101520253035404550556065707580
1998 1999 2000 2001 2002 2003 2004 2005 2006
%
Interest Margin(h)Gross Non-performing Advances RatioReturn on Equity (ROE)Cost to Income Ratio
Table 7; Source : Central Bank Publications
AWPLR and 3mth T Bill Rate
5
7
9
11
13
15
17
19
21
23
1997 1998 1999 2000 2001 2002 2003 2004 2005 2006 2007
%
AWPLR3mth T Bill Rate
Source : Central Bank Publications

8
CHANGES IN THE REGULATORY ENVIRONMENT
Ownership
The maximum ownership of the issued capital carrying voting rightsof banks has been limited to 15% following a directive issued by theCentral Bank in January 2007. This limit will apply to the acquisition orholding of shares by all categories of shareholders individually or in agroup, whether acquired directly or indirectly through a nominee orthrough parties acting in concert. In the case of Licensed CommercialBanks acquisition of voting rights in excess of 10% requires priorapproval of the Monetary Board with the consent of the Minister ofFinance. Shareholders carrying voting rights in excess of 15% havebeen requested to dispose / reduce their respective shareholding to15% during a period not exceeding 5 years from April 2007, as specifiedby the Monetary Board on a case by case basis. While specific dateshave not been disclosed shareholders of certain banks have been issuedwith a shorter period of time in which to reduce their holding to themaximum limit of 15%. DFCC Bank reported to the CSE that theMonetary Board had requested the Bank to reduce its’ stake in COMBfrom its’ present 28.99% to 15% by October 2008. It is understoodthat DFCC Bank will be requesting an extension, given that the stakein COMB was acquired from Standard Chartered Bank at the requestof the Central Bank.
Capital Adequacy
Tier 1 and Total Capital Adequacy Ratios have been maintained at 5%and 10% of risk weighted assets, respectively. However new riskweightings assigned to different classes of assets have effectivelyincreased the total capital requirement to approximately 11% of riskweighted assets.
Provisioning Requirements
The Central Bank has required all banks to make a mandatory generalprovision of 0.1% per quarter for 10 consecutive quarters totaling a1% general provision on all performing loans and overdue NPL’s inarrears for 3 to 6 month commencing from December 2007. Mostbanks, particularly the larger banks have proactively begun providingfor the short fall in this requirement well ahead of the stipulated timeframe given by the Central Bank.
Mandatory Code of Corporate Governance in Licensed Banks
The Central bank released an exposure draft of the above for publiccomment, with the intention of articulating a corporate governancecode intended to make the Board of Directors of banks responsibleand accountable for management affairs of banks inclusive of riskmanagement. The draft has also prescribed principle based rules onresponsibilities of directors, chairman and CEO and criteria for fitnessand propriety of directors, management of related party transactionsand conflicts of interest and functions of board appointed committeesto supervise the executive management.
Requirements on maximum amount of accommodation grantedby Banks
The central bank issued revisions to prudential requirements on singleborrower limits of licensed banks in order to mitigate the banks’ credit

9
concentration risk arising from advances and other facilities granted tolarge clients. While the maximum limits remain the same as specifiedunder the Banking Act, the accommodations that are subject to fallwithin limits of the maximum amount specified now includes any loan,overdraft or advance inclusive of finance lease, hire purchase, andreverse agreements against debt securities, investments in debenturesand other debt instruments and any commitment to grant any loan oroverdraft or advance or other facility, including a commitment to accepta contingent liability. These are subject to certain types of securitiesthat are excluded from the computation of accommodations for thepurpose of calculating the maximum limits. These for example interalia include advances granted against cash, gold government securitiesetc.
Implementation of Basel II
Banks have been geared toward compliance with Basel II from 2008onwards under the guidance of the Central Bank’s Bank SupervisionDepartment. The new capital accord to be adopted seeks to effectivelycombine a risk sensitive capital requirement with risk mitigationpractices, by seeking a balance between internal risk systems andsupervisory prudence. The accord is reinforced via a minimum capitalrequirement, a supervisory review process and market discipline. TheBasel II framework permits a preferential risk weighting of 75% forclaims against the regulatory retail portfolio however the Basel IIframework also introduces a capital charge for operational risk. Mostbank have geared themselves with the process and disclosurerequirements of the Basel II framework. With regard to the minimumcapital requirement, it is clear that while banks have been given flexibilityin terms of selecting a measurement option, regulatory capital hasbeen made more sensitive to the risk exposure of the bank.

10
SECTOR COMPARISON
The Banking Finance and Insurance index has grown in line with the ASPIsince the CSE’s resurgence in late 2001 and the sustained appreciationwitnessed through the years of the cease fire agreement. The ASPI hasgrown at a CAGR of 29.2% while the BFI has marginally underperformedthe ASPI, growing at a CAGR of 28.2% in the same period.
SAMP appears the most undervalued of the six banks covered in thisreport. Attractive valuations with a P/E multiple of 5.3x FY07 earnings,with impressive earnings growth and sound fundamentals in terms ofasset quality, good provision cover and a healthy ROE. However thebank does have a higher cost to income ratio as well as a lower equity toassets ratio in comparison to some of its established peers such as COMB.
COMB has consistently demonstrated superior fundamentals with regardto earnings and asset growth, a low cost to income ratio and a healthy NPLratio. The banks’ growth prospects in Sri Lanka and in Bangladesh arereflected in its higher valuations particularly after its improved capitalposition following a rights issue earlier this year. HNB has commanded ahigher valuation in the market this year stemming from its substantialimprovement in asset quality over the last 3 years which has contributedto improved profitability from lower provision expense.
Aggressive growth over the last 3 years has seen NTB also commanding apremium to the sector reflecting its prospects of strong earnings growth inthe short to medium term. We believe the bank will be successful in infusingfresh capital within the next 12 months which it requires in order to maintainits current growth momentum.
NDB and DFCC are banks in transition from core operators in the projectfinance segment, to increasing exposure in commercial banking. NDB andDFCC have a superior capital position in comparison to the othercommercial banks in the market which would provide a strong base for itsgrowing retail and corporate lending portfolios. NDB offers a diversifiedportfolio of financial services providing significant opportunities of crossselling of services within the group. Much of DFCC’s growth would liewith its commercial banking subsidiary DFCC Vardhana, which mayculminate in a merger over the next few years. In addition DFCC’s associatestake in COMB which has been a significant contributor to earnings in thepast is likely to be pruned down over the next few years due to new central
bank guidelines on ownership.
Tabled overleaf are key indicators of a selected pool of listed banks coveredin this report
Indexed Selected Listed Banks (Adjusted for Bonus and Rights)
50
100
150
200
250
300
350
02/0
1/20
03
02/0
4/20
03
02/0
7/20
03
02/1
0/20
03
02/0
1/20
04
02/0
4/20
04
02/0
7/20
04
02/1
0/20
04
02/0
1/20
05
02/0
4/20
05
02/0
7/20
05
02/1
0/20
05
02/0
1/20
06
02/0
4/20
06
02/0
7/20
06
02/1
0/20
06
02/0
1/20
07
02/0
4/20
07
02/0
7/20
07
COMB HNB SAMP NTB
NDB DFCC

11
Sour
ce :
Ban
k A
nnua
l R
epor
ts an
d JK
SB E
stim
ates
Valu
atio
nsFY
04FY
05FY
06FY
07E
FY08
EFY
04FY
05FY
06FY
07E
FY08
EFY
04FY
05FY
06FY
07E
FY08
EFY
04FY
05FY
06FY
07E
FY08
EC
OM
B2.
4
2.
1
2.
1
1.
6
1.
3
22
.515
.812
.48.
76.
821
%42
%28
%41
%29
%4.
4%4.
4%4.
4%4.
4%4.
4%H
NB
2.7
2.2
1.9
1.5
1.2
32.0
13.6
10.8
9.0
7.2
-50%
134%
26%
19%
26%
3.4%
3.9%
4.9%
4.9%
4.9%
SAM
P1.
9
1.
4
1.
2
1.
0
0.
8
12
.09.
77.
75.
34.
2-7
%25
%25
%46
%25
%1.
7%1.
7%2.
1%2.
1%2.
1%N
DB
1.6
1.5
1.4
1.1
1.0
18.9
12.8
13.1
9.3
7.8
-37%
47%
-2%
40%
20%
3.6%
3.7%
2.5%
3.1%
3.1%
DFC
C1.
7
1.
4
1.
3
1.
0
0.
9
12
.49.
910
.68.
97.
7-1
%25
%-6
%19
%15
%4.
3%4.
7%3.
9%3.
9%3.
9%N
TB3.
3
3.
0
1.
5
1.
5
1.
2
96
.835
.313
.69.
26.
7-8
2%17
4%15
9%47
%39
%1.
4%1.
4%2.
9%2.
9%2.
9%SL
(Lis
ted
bank
s) **
2.1
1.8
1.6
1.3
1.1
20.0
13.2
11.2
8.5
6.8
-19%
51%
18%
33%
25%
2.6%
2.8%
2.6%
2.8%
2.8%
PBV
PER
EPS
GR
OW
THD
VD Y
LD
Prof
itabi
lity
FY04
FY05
FY06
FY07
EFY
08E
FY04
FY05
FY06
FY07
EFY
08E
FY04
FY05
FY06
FY07
EFY
08E
FY04
FY05
FY06
FY07
EFY
08E
CO
MB
11%
13%
17%
18%
19%
12%
14%
17%
21%
21%
1.17
%1.
32%
1.34
%1.
55%
1.64
%3.
7%3.
6%3.
7%3.
8%3.
9%H
NB
8%16
%17
%17
%17
%9%
18%
19%
19%
19%
0.50
%1.
05%
1.17
%1.
21%
1.35
%3.
6%4.
4%4.
8%5.
1%5.
2%SA
MP
16%
14%
15%
18%
19%
17%
17%
17%
20%
21%
1.11
%1.
14%
1.12
%1.
31%
1.37
%4.
5%4.
6%4.
5%5.
1%4.
8%N
DB
8%12
%10
%12
%12
%9%
12%
10%
13%
13%
1.37
%1.
68%
1.56
%1.
98%
1.98
%4.
4%4.
7%4.
9%5.
0%5.
0%D
FCC
13%
14%
13%
11%
11%
14%
16%
13%
13%
12%
3.28
%3.
32%
2.43
%2.
32%
2.24
%5.
5%5.
2%4.
7%4.
6%4.
5%N
TB3%
9%11
%16
%18
%3%
9%15
%16
%20
%0.
22%
0.53
%0.
89%
0.92
%1.
07%
2.9%
4.1%
3.9%
3.9%
4.0%
SL (L
iste
d ba
nks)
**11
%14
%14
%15
%16
%11
%15
%15
%17
%17
%1.
11%
1.41
%1.
37%
1.50
%1.
58%
4.0%
4.3%
4.3%
4.5%
4.5%
RO
AE
RO
AA
NIM
RO
E
Effic
ienc
yN
on In
t. In
c./O
p In
c.FY
04FY
05FY
06FY
07E
FY08
EFY
04FY
05FY
06FY
07E
FY08
EFY
04FY
05FY
06FY
07E
FY08
EFY
04FY
05FY
06FY
07E
FY08
EC
OM
B36
%33
%36
%36
%37
%57
%55
%50
%51
%50
%3.
3%3.
0%2.
9%2.
9%3.
0%51
%47
%42
%41
%40
%H
NB
36%
35%
31%
33%
34%
71%
63%
68%
68%
67%
3.8%
3.8%
4.4%
4.7%
5.0%
67%
61%
60%
60%
59%
SAM
P38
%32
%37
%37
%37
%74
%71
%64
%64
%64
%5.
0%4.
7%4.
5%4.
7%5.
0%68
%65
%55
%55
%54
%N
DB
39%
43%
54%
24%
24%
63%
63%
56%
56%
57%
4.6%
4.9%
3.4%
3.7%
3.7%
58%
58%
44%
47%
47%
DFC
C39
%33
%29
%29
%29
%43
%44
%45
%46
%48
%3.
4%3.
1%2.
9%2.
8%2.
8%36
%36
%35
%36
%37
%N
TB47
%40
%35
%39
%40
%80
%77
%71
%70
%67
%4.
4%5.
2%5.
2%4.
5%4.
6%76
%73
%66
%64
%62
%SL
(Lis
ted
bank
s) **
37%
35%
36%
33%
34%
64%
61%
59%
60%
59%
3.9%
3.8%
3.7%
3.8%
4.0%
58%
56%
51%
51%
50%
Fee
Inco
me
/ Ope
ratin
g In
com
eC
ost /
Inco
me
Cos
t / In
com
e (E
xcl.
VAT)
Cos
t / A
vera
ge A
sset
s
Bal
ance
She
etFY
04FY
05FY
06FY
07E
FY08
EFY
04FY
05FY
06FY
07E
FY08
EFY
04FY
05FY
06FY
07E
FY08
EFY
04FY
05FY
06FY
07E
FY08
EC
OM
B37
%31
%27
%24
%21
%26
%27
%24
%22
%22
%77
%78
%76
%76
%77
%9.
9%8.
9%7.
1%7.
7%7.
8%H
NB
20%
15%
20%
19%
19%
15%
8%18
%13
%14
%77
%78
%76
%76
%75
%5.
5%6.
4%6.
2%6.
7%7.
3%SA
MP
28%
28%
30%
24%
25%
15%
25%
30%
19%
19%
77%
79%
76%
77%
79%
6.1%
6.9%
6.1%
6.2%
6.4%
ND
B61
%7%
14%
20%
20%
34%
10%
0%21
%19
%31
%28
%39
%48
%48
%14
.2%
13.6
%16
.3%
15.2
%14
.6%
DFC
C22
%29
%31
%16
%19
%21
%25
%31
%21
%18
%19
%20
%34
%39
%43
%22
.4%
20.6
%17
.0%
19.5
%18
.6%
NTB
45%
35%
88%
36%
30%
16%
17%
87%
18%
20%
51%
60%
46%
47%
48%
6.2%
5.8%
6.0%
5.3%
5.4%
SL (L
iste
d ba
nks)
**30
.7%
23.0
%26
.5%
22.1
%21
.3%
20.5
%18
.0%
24.1
%18
.4%
18.6
%67
.8%
67.7
%67
.1%
68.8
%69
.4%
9.4%
9.3%
8.5%
8.9%
9.0%
Loan
Gro
wth
%A
sset
Gro
wth
%D
epos
its /
Liab
ilitie
s %
Equi
ty /
Ass
ets
%
Ass
et Q
ualit
yFY
04FY
05FY
06FY
07E
FY08
EFY
04FY
05FY
06FY
07E
FY08
EFY
04FY
05FY
06FY
07E
FY08
EC
OM
B4.
5%3.
4%2.
8%3.
0%3.
1%50
%54
%60
%60
%62
%-4
.4%
-0.9
%3.
1%32
.2%
27.0
%H
NB
10.3
%8.
2%7.
5%6.
9%6.
4%49
%63
%66
%63
%62
%-1
5.8%
-8.2
%8.
9%10
.4%
9.9%
SAM
P8.
6%6.
2%5.
5%5.
2%4.
8%64
%82
%82
%88
%92
%-2
.9%
-8.0
%15
.7%
15.9
%17
.1%
ND
B7.
1%4.
3%2.
2%2.
0%1.
9%86
%12
6%18
8%15
7%12
3%-1
0.0%
-34.
5%-4
1.5%
7.4%
15.2
%D
FCC
8.9%
5.0%
4.9%
5.0%
5.0%
32%
47%
37%
40%
44%
-5.2
%-2
7.9%
29.0
%18
.2%
18.7
%N
TB6.
4%6.
1%5.
4%5.
3%5.
3%49
%56
%58
%60
%62
%52
.2%
28.4
%64
.7%
32.8
%31
.1%
SL (L
iste
d ba
nks)
**7.
7%5.
6%4.
8%4.
6%4.
5%53
%68
%69
%67
%68
%-9
.0%
-11.
0%9.
1%17
.5%
17.3
%
NPL
ratio
N
PL C
over
age
% C
hang
e N
PL's

12
REGIONAL COMPARATIVES
Source : Deutsche Bank Global Markets Reserach, Asia Pac (Ex Japan) Bank, Sept. 17th 2007; Bank Annual Reports and JKSB Estimates
ValuationsFY06 FY07E FY08E FY06 FY07E FY08E FY06 FY07E FY08E FY06 FY07E FY08E
Australia 3.0 2.5 2.3 17.3 15.0 13.5 13.9 14.0 9.9 4.0 4.5 5.0China 4.3 3.6 3.2 35.0 24.0 18.5 10.5 32.4 27.3 1.1 1.9 2.4Hong Kong 2.7 2.5 2.4 16.9 14.9 14.8 7.9 2.8 -0.7 3.9 4.2 4.4India 3.8 3.3 2.3 25.7 22.3 17.9 -10.4 6.9 16.1 0.9 1.0 1.1Indonesia 3.1 2.7 2.4 19.7 16.0 12.6 19.3 19.5 26.8 1.9 2.3 2.9Malaysia 2.9 2.6 2.5 19.4 17.1 14.1 22.3 9.0 17.6 3.2 3.7 4.9Pakistan 3.4 2.8 2.4 13.6 11.6 10.6 38.2 16.0 9.1 1.9 2.3 2.7Philippines 2.4 2.0 1.9 20.4 15.4 13.3 13.2 9.5 16.0 2.4 3.0 3.2Singapore 1.9 1.6 1.5 13.4 13.2 12.0 79.2 2.3 10.2 3.2 3.9 3.8South Korea 1.6 1.4 1.3 9.8 7.7 8.1 26.5 25.7 -5.0 1.2 3.4 3.4Taiwan 1.7 1.6 1.5 69.1 16.0 13.8 -73.1 326.3 16.4 2.7 4.1 4.6Thailand 1.8 1.6 1.4 19.2 17.5 10.4 -40.7 -7.0 49.9 2.3 2.1 2.7SRI LANKACOMB 2.1 1.6 1.3 12.4 8.7 6.8 27.7 41.5 29.1 4.4 4.4 4.4HNB 1.9 1.5 1.2 10.8 9.0 7.2 26.5 19.2 26.4 4.9 4.9 4.9SAMP 1.2 1.0 0.8 7.7 5.3 4.2 25.5 45.6 25.0 2.1 2.1 2.1NDB 1.4 1.1 1.0 13.1 9.3 7.8 -2.1 40.2 19.9 2.5 3.1 3.1DFCC 1.3 1.0 0.9 10.6 8.9 7.7 -6.1 19.3 15.4 3.9 3.9 3.9NTB 1.5 1.5 1.2 13.6 9.2 6.7 159.2 47.4 38.7 2.9 2.9 2.9SL (Listed banks) ** 1.6 1.3 1.1 11.2 8.5 6.8 17.8 32.5 25.1 2.6 2.8 2.8
DVD YLDPBV PER EPS GTH
ProfitabilityFY06 FY07E FY08E FY06 FY07E FY08E FY06 FY07E FY08E FY06 FY07E FY08E
Australia 16.7 17.9 17.5 16.7 17.9 17.5 1.0 1.0 1.0 2.3 2.1 2.1China 14.6 16.5 18.4 14.6 16.5 18.4 0.7 0.9 1.1 2.6 2.8 2.8Hong Kong 17.1 17.4 16.4 17.1 17.4 16.4 1.5 1.5 1.4 1.9 2.0 1.9India 16.9 16.0 15.0 16.9 16.0 15.0 1.0 1.0 1.0 3.1 3.2 3.2Indonesia 17.0 17.9 20.0 17.0 17.9 20.0 1.6 1.9 2.2 6.3 6.5 7.0Malaysia 15.4 16.1 18.3 15.4 16.1 18.3 1.1 1.1 1.2 2.4 2.4 2.3Pakistan 28.2 26.7 24.1 28.2 26.7 24.1 2.8 2.9 2.8 5.6 5.7 5.5Philippines 12.8 14.3 14.6 12.8 14.3 14.6 1.2 1.3 1.4 3.9 4.0 4.0Singapore 15.2 13.4 12.8 15.2 13.4 12.8 1.4 1.2 1.2 2.1 2.2 2.2South Korea 17.7 19.2 16.2 17.7 19.2 16.2 1.1 1.2 1.1 3.1 3.1 3.0Taiwan 2.5 10.2 11.2 2.5 10.2 11.2 0.2 0.8 0.8 2.0 1.8 1.8Thailand 9.7 9.6 14.4 9.7 9.6 14.4 0.8 0.9 1.4 3.4 3.3 3.5SRI LANKA 0.0 0.0 0.0COMB 17.0 18.3 19.1 17.0 20.8 21.1 1.3 1.5 1.6 3.7 3.8 3.9HNB 17.3 17.1 17.5 18.6 18.7 19.3 1.2 1.2 1.3 4.8 5.1 5.2SAMP 15.4 18.5 18.7 16.6 20.3 20.7 1.1 1.3 1.4 4.5 5.1 4.8NDB 9.6 11.9 12.4 10.5 12.6 13.3 1.6 2.0 2.0 4.9 5.0 5.0DFCC 12.6 10.8 11.1 13.1 12.6 11.8 2.4 2.3 2.2 4.7 4.6 4.5NTB 11.3 16.1 18.2 15.0 16.3 20.0 0.9 0.9 1.1 3.9 3.9 4.0SL (Listed banks) ** 14.5 15.3 16.0 15.3 17.0 17.4 1.4 1.5 1.6 4.3 4.5 4.5
NIMROE ROAE ROAA
Capital & EfficiencyFY06 FY07E FY08E FY06 FY07E FY08E FY06 FY07E FY08E FY06 FY07E FY08E
Australia 21.2 21.1 21.4 47.3 45.6 43.4 1.63 1.58 1.49 47.3 45.6 43.4China 8.6 10.7 11.5 44.9 41.3 41.1 1.24 1.29 1.29 44.9 41.3 41.1Hong Kong 18.8 20.9 20.6 34.8 34.7 34.6 0.92 0.92 0.9 34.8 34.7 34.6India 20.0 21.4 22.4 57.3 55.0 53.1 2.3 2.21 2.12 57.3 55.0 53.1Indonesia 11.1 11.5 11.6 53.1 51.1 48.0 3.65 3.61 3.73 53.1 51.1 48.0Malaysia 15.5 17.0 17.5 42.8 43.1 42.7 1.66 1.61 1.6 42.8 43.1 42.7Pakistan 12.9 13.3 14.7 32.3 31.7 31.6 2.35 2.35 2.29 32.3 31.7 31.6Philippines 11.8 15.1 14.6 60.6 62.0 60.3 3.38 3.61 3.29 60.6 62.0 60.3Singapore 21.7 21.6 20.9 42.9 40.9 40.4 1.21 1.22 1.18 42.9 40.9 40.4South Korea 20.9 22.9 18.7 44.2 42.8 44.9 1.63 1.62 1.56 44.2 42.8 44.9Taiwan 17.4 23.4 24.1 45.2 45.8 43.4 1.03 1.03 0.98 45.2 45.8 43.4Thailand 19.2 20.7 21.5 55.2 55.5 52.1 2.5 2.5 2.47 55.2 55.5 52.1SRI LANKACOMB 35.9 35.5 36.7 50.4 50.5 50.2 2.9 2.9 3.0 41.9 40.5 40.2HNB 31.5 32.7 34.2 67.7 68.4 67.0 4.4 4.7 5.0 59.9 60.4 59.0SAMP 36.6 36.8 37.0 64.5 64.0 63.6 4.5 4.7 5.0 55.3 54.8 54.4NDB 53.7 23.6 23.7 56.0 56.4 56.8 3.4 3.7 3.7 44.2 46.9 47.3DFCC 29.5 29.1 28.8 45.1 46.5 47.6 2.9 2.8 2.8 34.9 36.0 37.1NTB 35.3 38.6 39.6 71.5 69.8 67.1 5.2 4.5 4.6 66.5 64.3 61.6SL (Listed banks) ** 35.7 33.4 34.3 59.2 59.6 59.0 3.7 3.8 4.0 50.5 50.6 50.0
Cost / incomeFee Inc / Op Income Cost / income Cost / Average Assets
Cost / Income Excl. VAT

13
Source : Deutsche Bank Global Markets Reserach, Asia Pac (Ex Japan) Bank, Sept. 17th 2007; Bank Annual Reports and JKSB Estimates
Balance SheetFY06 FY07E FY08E FY06 FY07E FY08E FY06 FY07E FY08E FY06 FY07E FY08E
Australia 13.0 14.0 11.9 15.1 15.7 12.2 10.3 12.7 12.7 54.6 52.8 52.4China 14.5 14.5 13.2 17.4 15.8 12.4 14.9 17.3 14.7 88.7 85.5 83.7Hong Kong 9.7 13.3 10.6 16.7 13.4 9.2 13.6 14.1 11.3 85.4 83.6 83.6India 34.6 30.8 25.6 20.9 23.3 22.2 28.7 29.9 28.2 80.6 80.6 81.5Indonesia 13.7 23.7 18.3 13.0 5.0 7.6 15.9 17.7 18.4 87.0 87.3 87.6Malaysia 16.9 9.4 10.3 23.8 9.3 8.2 17.5 15.9 9.8 87.0 87.6 87.9Pakistan 15.5 14.4 15.7 14.5 13.4 13.1 23.2 19.6 19.6 53.6 83.8 84.1Philippines 10.9 30.4 17.2 18.0 26.1 7.1 17.4 25.1 19.2 84.0 85.0 85.4Singapore 9.9 17.7 15.0 11.3 17.3 12.2 12.8 17.6 17.3 77.4 71.6 70.3South Korea 18.1 14.3 8.3 15.6 15.2 7.3 13.7 16.1 11.2 63.3 59.1 59.8Taiwan 2.3 6.3 7.6 3.9 4.8 6.6 10.6 7.0 10.1 52.6 53.1 53.2Thailand 4.0 8.7 11.2 7.3 4.5 7.1 3.8 4.8 8.5 88.8 88.1 88.7SRI LANKACOMB 26.8 24.5 21.1 24.4 21.8 21.8 32.7 22.7 21.8 75.7 76.1 76.8HNB 19.9 18.8 19.4 18.3 12.9 13.9 29.5 18.9 19.0 76.2 75.6 75.2SAMP 29.7 24.1 24.5 30.1 19.2 19.4 44.6 21.2 24.3 75.8 77.2 78.7NDB 13.9 20.2 20.3 0.4 21.1 19.2 13.5 24.4 17.8 38.5 47.6 47.5DFCC 30.6 15.8 18.7 30.6 20.8 18.3 76.8 19.4 18.3 34.2 39.5 42.8NTB 87.6 35.7 29.6 87.4 17.6 19.9 83.1 18.7 19.9 46.2 46.7 47.6SL (Listed banks) ** 26.5 22.1 21.3 24.1 18.4 18.6 38.4 21.1 20.6 67.1 68.8 69.4
Loan Growth % Asset Growth % RWA Growth % Deposits / Liabilities %
Balance SheetFY06 FY07E FY08E FY04 FY05 FY08E
Australia 134.0 136.6 137.2 69.0 68.0 67.8China 61.6 63.3 65.1 51.4 50.8 51.2Hong Kong 56.3 57.3 57.6 43.7 43.7 44.2India 75.2 79.4 81.8 56.5 60.0 61.6Indonesia 58.4 69.2 76.4 45.6 53.6 59.0Malaysia 73.3 72.8 73.8 59.2 59.2 60.4Pakistan 78.2 79.5 81.7 58.3 58.8 60.2Philippines 51.5 52.4 57.1 38.9 40.3 44.0Singapore 69.4 75.5 78.7 48.4 48.6 49.8South Korea 122.1 219.5 129.5 72.1 71.5 72.2Taiwan 81.9 82.0 82.3 40.1 40.5 40.7Thailand 86.6 91.8 95.1 70.3 73.2 76.0SRI LANKACOMB 95.5 97.6 96.4 67.1 68.6 68.2HNB 86.4 92.1 97.7 61.7 64.9 68.1SAMP 90.6 92.9 94.8 64.3 66.9 69.8NDB 198.4 199.6 195.9 64.6 64.2 64.7DFCC 254.2 218.0 199.0 71.6 68.7 68.9NTB 117.7 133.2 141.3 51.1 58.9 63.6SL (Listed banks) ** 104.9 107.9 109.3 64.3 66.3 67.9
Loan /Deposits % Loan /Assets %
Asset QualityFY06 FY07E FY08E FY06 FY07E FY08E FY06 FY07E FY08E
Australia 0.5 0.5 0.6 135.8 123.1 118.0 6.0 22.2 21.5China 3.3 2.8 2.4 84.2 98.1 106.6 -5.7 -3.5 -0.9Hong Kong 0.7 0.6 0.5 62.8 71.9 79.0 -27.7 -9.4 0.6India 3.0 2.4 2.2 60.5 54.9 51.7 -17.8 4.3 15.9Indonesia 7.8 6.1 5.3 85.8 106.9 123.1 -16.9 -3.4 3.3Malaysia 6.8 5.9 5.4 59.9 66.9 65.3 0.8 -5.2 0.2Pakistan 7.5 6.8 6.3 89.2 91.2 91.5 3.4 3.8 7.0Philippines 7.2 6.8 5.9 73.9 80.8 81.6 -14.7 22.7 1.9Singapore 2.9 2.5 2.7 93.3 86.0 75.8 -20.3 3.1 22.2South Korea 1.0 0.9 1.0 156.1 159.9 136.4 -24.7 7.9 18.9Taiwan 1.7 1.8 1.8 87.8 66.5 65.5 6.1 13.0 6.7Thailand 8.4 6.5 5.6 65.3 78.5 80.0 -8.1 -15.7 -4.1SRI LANKACOMB 2.8 3.0 3.1 60.4 59.6 62.2 3.1 32.2 27.0HNB 7.5 6.9 6.4 65.6 62.5 62.4 8.9 10.4 9.9SAMP 5.5 5.2 4.8 82.3 88.3 92.3 15.7 15.9 17.1NDB 2.2 2.0 1.9 188.2 156.8 123.2 -41.5 7.4 15.2DFCC 4.9 5.0 5.0 37.5 39.6 43.6 29.0 18.2 18.7NTB 5.4 5.3 5.3 58.3 60.0 62.0 64.7 32.8 31.1SL (Listed banks) ** 4.8 4.6 4.5 69.0 67.2 67.7 9.1 17.5 17.3
NPL ratio NPL Coverage % Change NPL's
This document is published by John Keells Stockbrokers (Pvt.) Limited for the exclusive use of their clients. All information has been compiled from availabledocumentation and JKSB’s own research material. Whilst all reasonable care has been taken to ensure the accuracy of the contents of this issue, neither JKSB norits employees can accept responsibility for any decisions made by investors based on information contained herein.

14
Rs. 135.00 BUY
Sri Lanka Equities Corporate Update
Commercial Bank of Ceylon PLC (COMB)
A J
KSB
Res
earc
h P
ubli
cati
on
COMB PRICE - VOLUME GRAPH
40
60
80
100
120
140
160
180
01-A
pr-
03
20-
Ju
n-0
329
-Au
g-0
31
3-N
ov-
03
29-
Jan
-04
20-A
pr-
04
13-
Ju
l-0
427
-Sep
-04
17-
De
c-0
415
-Mar
-05
07-
Ju
n-0
524
-Au
g-0
50
7-N
ov-
05
24-
Jan
-06
27-A
pr-
06
17-
Ju
l-0
623
-Oc
t-0
60
8-Ja
n-0
723
-Mar
-07
25-
Ju
n-0
704
-Sep
-07
Price
0
1,000,000
2,000,000
3,000,000
4,000,000
5,000,000
6,000,000
7,000,000
8,000,000Volume
VolumePrice
Commercial Bank became the largest local private bank in the country lastyear, with a market share of 13% of LCB assets. The bank has traditionallygrown from being a predominantly corporate lender, to now establishing itself as a national bank with approximately 48% of its lending portfolioassets arising from the growing SME and consumer segments. In additionCOMB has also successfully established a presence in Bangladesh with 9branches, and is expected to be a key driver of growth for the bank in themedium to long term. The operations in Bangladesh accounted for 7.4%of group assets and 14.16% of group PAT excluding exceptional items.
COMB is expected to record slower yet healthy loan growth of 24.3% inFY07 and 21.1% in FY08 given the high interest rate environment, whiledeposit growth is expected at 23% in FY07 and FY08. The high marginSME and consumer segments continue to be key driver of loan growth,with leasing and pawning businesses also performing well. Net interestmargins have widened this year on account of the rising interest rateswhich have customarily resulted in advances being re-priced ahead ofdeposits. In addition the bank continues to benefit from a surplus of retaildeposits over its retail lending which it mobilizes to its corporate lendingportfolio.
The steady depreciation of the SLR this year is expected to augment foreignexchange income while regular trade finance activities is expected to boostfee and commission based income which accounts for 50% of non interestincome. We expect non interest income to grow by 24% in FY07.
The bank is expected to register modest declines in its cost to income ratioover the next two years which at present ranks as the best amongst localbanks. The bank continues to benefit from the rationalisation of internalprocesses, as well as expenses being curtailed by the increased adoption oftechnology in the provision of the bank’s services.
Absolute NPL’s increased by 3.1% last year and has increased at a greaterpace in 1H07, although healthy loan growth has meant that the NPL Ratioremained steady. We prudently expect the gross NPL ratio to expandmarginally to 2.97% in FY07 and 3.11% in FY08 given the likelihood oflower recoveries and a rise in NPLs due to the present macro environment.Provision cover is however expected to be maintained at 60% in FY07increasing to 62.2% in accordance with guidelines issued by the centralbank.
A successfully concluded rights issue raising Rs. 5.74bn for the bank, hasboosted the Tier 1 and Total CAR to 10.51% and 14.08% in the 1H FY07from 7.62% and 11.58% recorded at year end FY06. The scrip issuestemmed the decline in capital adequacy witnessed in the bank with COMBs’
2004 7,397 1,727 1,495 6.01 21.04 22.48 2.38 4.4% 6.00 2005 8,769 2,360 2,128 8.55 42.32 15.79 2.11 4.4% 6.00 2006 11,473 2,951 2,718 10.92 27.73 12.37 2.10 4.4% 6.00
2007E 14,376 3,961 3,845 15.44 41.47 8.74 1.60 4.4% 6.00 2008E 18,133 4,970 4,965 19.94 29.13 6.77 1.29 4.4% 6.00
DPS Rs.
EPS Growth
PER (x) Rs.
Dividend Yield %
P/BVFinancial
Year (Dec)Net Income
(Rs.mn)NPAT
(Rs.mn)EPS (Rs.)
PAT, MI & Pref Divid
COMBReuters CodeBloomberg CodeShare Price LKRIssued Share Capital (Shares)*Voting*Non Voting12 mth High/Low (Rs.) - VotingAverage Daily Volume (Voting Shares)Market Capitalisation (Voting) Rs. mnPrice Performance (%) - VotingASPI 1.30 (8.70) 6.63COMB - (5.26) 28.13* Adjusted for bonus and rights issues
31,430
COMB.SL135.00
COMB.CM
160.70 / 104.6986,292
232,817,073 16,120,797
John Keells Stock Brokers (Pvt) LtdCompany No. PV 89130, Glennie Street,Colombo 2,Sri Lanka.
Tel: 9411 2421 101-9 (Gen.),9411 2326 003,9411 2439 047/8
Fax: 9411 2326 863,9411 2342 068
Yolan [email protected]
October 2007

15
COMB 2004 2005 2006 2007E 2008EPrice / Book Value 2.4 2.1 2.1 1.6 1.3 EPS 6.0 8.5 10.9 15.4 19.9 PER 22.5 15.8 12.4 8.7 6.8 EPS Growth 21.0% 42.3% 27.7% 41.5% 29.1%DVD YLD 4.4% 4.4% 4.4% 4.4% 4.4%ROE 10.6% 13.3% 17.0% 18.3% 19.1%ROAE 11.5% 14.2% 17.0% 20.8% 21.1%ROAA 1.2% 1.3% 1.3% 1.5% 1.6%NIM 3.7% 3.6% 3.7% 3.8% 3.9%Fee Income / Operating Income 36% 33% 36% 36% 37%Cost / Income 56.5% 54.6% 50.4% 50.5% 50.2%Cost / Income (Excl VAT) 50.5% 47.4% 41.9% 40.5% 40.2%Cost / Average Assets 3.28% 2.97% 2.86% 2.92% 3.01%Tier 1 10.78% 9.68% 7.62%Loan Growth 36.5% 30.9% 26.8% 24.5% 21.1%Asset Growth 25.7% 27.0% 24.4% 21.8% 21.8%RWA Growth 37% 29% 33% 23% 22%Loan/ Deposits 91.9% 93.1% 95.5% 97.6% 96.4%Loan / Assets 63.9% 65.9% 67.1% 68.6% 68.2%Deposits / Liabilities 77.2% 77.6% 75.7% 76.1% 76.8%Equity / Assets 9.9% 8.9% 7.1% 7.7% 7.8%NPL Ratio 4.53% 3.43% 2.79% 2.96% 3.11%NPL Coverage 50.0% 53.9% 60.4% 59.6% 62.2%% Change in NPLS -4.4% -0.9% 3.1% 32.2% 27.0%Personnel Cost / Average Assets 1.4% 1.3% 1.3% 1.2% 1.2%
capital position failing to keep pace with its
aggressive loan book growth over the last 5 years.
COMB’s has consistently exhibited strongfundamentals over the years and is very likely tobe successful in navigating what is at present achallenging environment. Earnings growth forecastsof 41.4% and 29.13% for FY07 and FY08excluding exception items correspond to a PERof 8.7x at 6.8x at a market price of Rs. 135/-.The counter currently trades at a 9.8% discountto the market. Given the continued consolidationof its market position in Sri Lanka and its strongmedium to long term prospects in the region, it isour view that COMB ought to be trading at asignificant premium to the market. We recommendBUY.
This document is published by John Keells Stockbrokers (Pvt.) Limited for the exclusive use of their clients. All information has been compiled from availabledocumentation and JKSB’s own research material. Whilst all reasonable care has been taken to ensure the accuracy of the contents of this issue, neither JKSB norits employees can accept responsibility for any decisions made by investors based on information contained herein.
Income Statement 2002 2003 2004 2005 2006 2007E 2008EFor the Year Ended 31st December Rs. 'mn Rs. 'mn Rs. 'mn Rs. 'mn Rs. 'mn Rs. 'mn Rs. 'mnIncome 8,900 9,749 12,437 16,226 23,418 30,412 41,682
Net Interest Income 3,021 3,751 4,738 5,837 7,357 9,271 11,483 Foreign exchange profit 464 397 874 587 1,439 1,700 2,050 Fee and commisison income 824 1,051 1,377 1,760 2,011 2,525 3,450 Other Income 232 671 409 586 665 880 1,150 Net Income 4,465 5,870 7,397 8,769 11,473 14,376 18,133 Less Operating ExpensesPersonnel Costs 1,121 1,398 1,820 2,144 2,566 3,070 3,650 Premises and Equipment expenses 684 833 1,019 1,146 1,384 1,610 1,850 Provision for staff retirement benefits 196 311 326 236 - - - Loan losses and Provisions 413 623 699 415 655 909 1,214 Other Overhead expenses 375 708 1,015 1,258 1,829 2,580 3,600 Total Expenses (2,790) (3,874) (4,879) (5,199) (6,435) (8,169) (10,314) Profit from Operations 1,675 1,996 2,518 3,570 5,038 6,207 7,819 Add: Share of PBT of Assoc. 28 43 76 100 62 183 197 Profit before Tax 1,704 2,039 2,594 3,670 5,101 6,389 8,016 Less: Provision for Taxation 391 572 867 1,311 2,150 2,428 3,046 Profit after taxation 1,313 1,467 1,727 2,360 2,951 3,961 4,970 Less: Minority Interest 2 2 2 2 3 4 5 Net profit for the year 1,311 1,465 1,725 2,358 2,948 3,957 4,965 Cum. Red. Pref. Shares 13% 117.78 117.78 117.78 117.78 117.78 Cum. Red. Pref. Shares 11.25% 112.50 112.50 112.50 112.50 112.50 NPAT, MI & Pref. Dividend 1,193 1,235 1,495 2,128 2,718 3,845 4,965
117.78 230.28
Balance Sheet 2002 2003 2004 2005 2006 2007E 2008EAs at 31st December Rs. 'mn Rs. 'mn Rs. 'mn Rs. 'mn Rs. 'mn Rs. 'mn Rs. 'mnASSETSCash and short-term funds 1,837 9,002 12,136 18,657 13,731 23,817 23,709 Balances with Central Banks 3,244 5,233 6,320 9,045 12,574 17,550 20,851 Government Treasury Bills and Bonds 16,778 20,748 6,647 19,160 12,222 14,666 17,599 Commercial paper 1,080 547 560 408 423 620 885 Sec. purchased under re-sale agreements 1,449 3,971 2,087 808 4,593 5,600 6,752 Dealing Securities 200 - 110 182 145 298 360 Investment securities 705 2,606 2,940 3,691 1,795 3,941 4,798 Treasury Bonds Maturing after one year 148 - 14,379 1,714 20,025 9,287 18,777 Bills of Exchange 2,552 2,495 2,799 2,790 3,288 3,740 4,255 Loans and Advances 47,350 60,585 82,605 108,917 137,720 170,773 205,781 Lease rec. within one year 698 1,277 2,004 2,676 3,007 4,233 5,570 Lease rec. from one to five years 1,197 2,050 3,243 4,295 6,415 8,468 11,177
77,238 108,513 135,828 172,345 215,938 262,992 320,515
Investment in Assoc. 141 171 243 283 41 63 76 Interest and Fees receivables 295 390 1,143 1,199 1,639 1,956 2,365 Other Assets 1,958 1,872 1,445 2,944 3,006 3,644 4,356 Property, Plant and Equipment 1,753 1,877 3,134 3,365 3,438 4,200 5,100 TOTAL ASSETS 81,385 112,823 141,792 180,135 224,061 272,854 332,412 Financed By : - - - - - - - Deposits form customers 54,480 75,097 98,622 127,491 157,532 191,745 235,328 Dividends Payable 121 190 232 230 113 113 113 Borrowings 4,200 5,406 9,090 13,453 18,944 24,248 31,038 Sec. sold under repurchase agreements 9,922 12,951 12,261 11,386 14,317 15,892 17,640 Other Liabilties 3,912 4,596 3,491 6,070 8,402 8,654 8,914 Tax Payable 64 231 484 773 1,420 2,150 2,428 Deferred Taxation 253 259 251 239 625 1,062 1,487 Debentures 500 2,244 3,244 4,553 6,680 7,950 9,460
73,453 100,973 127,676 164,168 208,033 251,814 306,407 Minority Interest 13 13 12 13 11 12 12 SHAREHOLDERS FUNDSShare Capital 1,324 2,603 2,603 3,327 2,428 3,489 2,489 Statutory Reserve Fund 1,009 1,009 1,010 1,422 1,429 1,422 1,422 Reserves 5,586 8,224 10,491 11,205 12,159 16,116 22,081 Shareholders Funds 7,919 11,836 14,105 15,954 16,016 21,027 25,992
81,385 112,822 141,792 180,135 224,061 272,854 332,412

16
Rs. 103.00 BUY
Sri Lanka Equities Corporate Update
Hatton National Bank PLC (HNB)
A J
KSB
Res
earc
h P
ubli
cati
on
HNB PRICE - VOLUME GRAPH
0
20
40
60
80
100
120
02-J
an-0
325
-Feb
-03
24-A
pr-0
318
-Jun
-03
05-A
ug-0
324
-Sep
-03
13-N
ov-0
309
-Jan
-04
09-M
ar-0
406
-May
-04
25-J
un-0
413
-Aug
-04
04-O
ct-0
425
-Nov
-04
19-J
an-0
517
-Mar
-05
13-M
ay-0
507
-Jul
-05
31-A
ug-0
520
-Oct
-05
14-D
ec-0
509
-Feb
-06
03-A
pr-0
601
-Jun
-06
31-J
ul-0
613
-Oct
-06
06-D
ec-0
629
-Jan
-07
22-M
ar-0
724
-May
-07
19-J
ul-0
713
-Sep
-07
0
500,000
1,000,000
1,500,000
2,000,000
2,500,000
3,000,000
3,500,000
4,000,000VolumePrice
HNB is the second largest private local bank in the country with the largestdomestic branch network amongst private banks with 152 banking centresacross the island. The banks subsidiaries include Insurance and Stock brokingfirms while also functioning as a Primary Dealer for Government Securities.Contributions from these entities are relatively small. HNB has witnessedhealthy earnings growth over the last two years largely due to improvedasset quality resulting in lower provision expense coupled with healthy loangrowth.
The banks corporate lending portfolio accounts for approximately 65%of its loan book, although much of the recent growth in its loan book hasarisen from high margin consumer loans relating to leases, pawning andhousing loans. This together with the prevailing high interest rates has meantthat the bank has enjoyed healthy net interest margins while recordingsound loan growth. We expect loan growth of 18.8% and 19.4% in FY07and FY08 respectively.
Steep gains from foreign exchange income along with steady growth infees and commission income should see non interest income grow by 26.8%and 27.5% in FY07 and FY08 respectively. Non interest income hasconsistently contributed a third of total income in recent years and isexpected to increase marginally in the next two years.
HNBs’ cost to income ratio continues to remain high although the cost toincome ratio excluding VAT has declined marginally over last year. Arestructuring of the bank’s pension scheme as well as the roll out of a coreIT network in the next 12mths is expected to have a favourable impact onoperating expenses in the medium term.
The management of credit risk in the bank has been significantlystrengthened by the implementation of an integrated system across itsnetwork of banking centres over the last few years. In addition greaterexpertise brought into credit risk management has resulted in improvedassessment and monitoring and is reflected in significant improvements inthe quality of its lending portfolio. The Banks NPL ratio has improvedsignificantly from 10.3% in FY04 to 6.9% in FY07E, while provision coverhas also improved from 48.8% in FY04 to 62.5% in FY07E. Creditconcentration is however a concern with 5 of the largest clients representingover a tenth of the banks loan book.
Deposits accounted for 76.2% of liabilities in FY06, being the primarysource of funding. Deposits are expected to grow by 11.5% and 12.5% inFY07 and FY08 respectively. The banks cost of funds has increased withan increase in borrowings to fund loan growth as well as a shift in thebanks’ deposit mix, with more demand and savings deposits being shiftedto high yield time deposits.
2004 8,141 756 3.21 (49.63) 32.11 2.71 3% 3.50 2005 10,228 1,770 7.52 134.33 13.70 2.15 4% 4.00 2006 12,425 2,239 9.51 26.47 10.83 1.87 5% 5.00
2007E 15,181 2,670 11.33 19.23 9.09 1.55 5% 5.00 2008E 18,506 3,373 14.32 26.36 7.19 1.25 5% 5.00
EPS Growth %
PER (x) Rs.
Dividend Yield %
Financial Year (Dec)
Net Income (Rs.mn)
PAT (Rs.mn)
EPS (Rs.)
P/BV DPS Rs.
HNBReuters CodeBloomberg CodeShare Price LKR
*Voting*Non Voting12 mth High/Low (Rs.) - VotingAverage Daily Volume (Shares)- VotingMarket Capitalisation (Voting) Rs. mn 19,501
Price Performance (%)1 mth 6 mth 12 mth
ASPI 1.37 (8.70) 6.63HNB 1.98 2.74 74.58* Adjusted for bonus and rights issues
107.50 / 58.0038,497
Issued Share Capital (Shares)189,329,400
46,200,000
HNB.CMHNB.SL103.00
John Keells Stock Brokers (Pvt) LtdCompany No. PV 89130, Glennie Street,Colombo 2,Sri Lanka.
Tel: 9411 2421 101-9 (Gen.),9411 2326 003,9411 2439 047/8
Fax: 9411 2326 863,9411 2342 068
Yolan [email protected]
October 2007

17
HNB 2004 2005 2006 2007E 2008EPrice / Book Value 2.7 2.2 1.9 1.5 1.2 EPS 3.2 7.5 9.5 11.3 14.3 PER 32.0 13.6 10.8 9.0 7.2 EPS Growth -49.6% 134.3% 26.5% 19.2% 26.4%DVD YLD 3.4% 3.9% 4.9% 4.9% 4.9%ROE 8.5% 15.8% 17.3% 17.1% 17.5%ROAE 9.4% 17.6% 18.6% 18.7% 19.3%ROAA 0.5% 1.1% 1.2% 1.2% 1.3%NIM 3.6% 4.4% 4.8% 5.1% 5.2%Fee Income / Operating Income 36% 35% 31% 33% 34%Cost / Income 70.8% 63.3% 67.7% 68.4% 67.0%Cost / Income (Excl VAT) 66.7% 61.4% 59.9% 60.4% 59.0%Cost / Average Assets 3.81% 3.85% 4.40% 4.71% 4.96%Tier 1 9.83% 10.87% 10.23%Loan Growth 20.1% 15.1% 19.9% 18.8% 19.4%Asset Growth 14.8% 8.2% 18.3% 12.9% 13.9%RWA Growth - 11% 30% 19% 19%Loan/ Deposits 78.3% 83.2% 86.4% 92.1% 97.7%Loan / Assets 57.3% 60.9% 61.7% 64.9% 68.1%Deposist / Liabilities 77.5% 78.3% 76.2% 75.6% 75.2%Equity / Assets 5.5% 6.4% 6.2% 6.7% 7.3%NPL Ratio 10.3% 8.2% 7.5% 6.9% 6.4%NPL Coverage 48.8% 63.5% 65.6% 62.5% 62.4%% Change in NPLS -16% -8% 9% 10% 10%Personnel Cost / Average Assets 1.5% 1.5% 1.5% 1.6% 1.8%
Income Statement 2004 2005 2006E 2007E 2008EFor the Year Ended 31st December Rs. 'mn Rs. 'mn Rs. 'mn Rs. 'mn Rs. 'mn
Income 14,503 18,298 23,233 28,760 33,726 Net Interest Income 5,218 6,671 8,513 10,222 12,184 Foreign exchange profit 663 646 793 1,125 1,524 Fee and commisison income 1,574 1,639 1,861 2,264 2,823 Other Income 686 1,272 1,258 1,570 1,975 Net Income 8,141 10,228 12,425 15,181 18,506 Less Operating Expenses 2,923 3,557 3,912 Personnel Costs 2,285 2,535 2,895 3,525 4,415 Premises and Equipment expenses 1,409 1,665 1,752 2,145 2,595 Provision for staff retirement benefits 1,941 1,843 3,344 4,100 4,950 Loan losses and Provisions 235 328 401 400 375 Other Overhead expenses 1,566 1,759 932 1,123 1,462 Total Expenses (7,332) (8,237) (9,344) (11,512) (13,866) Profit from Operations 809 1,991 3,082 3,669 4,640 Add: Share of PBT of Assoc. 23 17 14 17 17 Profit before Tax 832 2,008 3,095 3,686 4,657 Less: Provision for Taxation (15) 214 820 1,014 1,281 Profit after taxation 847 1,795 2,276 2,672 3,377 Less: Minority Interest 92 24 37 3 3 Net profit for the year 756 1,770 2,239 2,670 3,373
Balance Sheet 2004 2005 2006E 2007E 2008EAs at 31st December Rs. 'mn Rs. 'mn Rs. 'mn Rs. 'mn Rs. 'mnASSETSCash and short-term funds 20,113 21,194 23,344 26,054 26,405 Balances with Central Banks 9,120 8,566 12,017 8,566 8,566 Government Treasury Bills and Bonds 5,650 2,001 2,452 7,845 8,630 Commercial paper 682 434 291 434 434 Sec. purchased under re-sale agreements 5,650 3,881 4,393 4,613 4,982 Dealing Securities 417 320 975 1,411 1,811
Investment securities 18,761 18,817 22,660 17,525 18,121 Bills of Exchange 2,077 2,027 1,911 1,949 1,988 Loans and Advances 83,701 95,676 114,277 135,418 161,148 Lease receivable within one year 2,564 3,112 3,796 4,745 5,931 Lease receiveable from one to five years 4,274 5,752 7,756 9,696 12,119 Investment in Assoc. 169 171 165 165 165 Other Assets 5,527 5,145 5,112 6,142 6,918 Property, Plant and Equipment 7,959 7,892 7,571 9,194 8,998 TOTAL ASSETS 161,761 174,987 206,979 233,756 266,217 Financed By :Deposits form customers 118,342 128,131 147,788 164,754 185,425 Dividends Payable 108 50 - - - Borrowings 15,303 16,044 24,924 30,407 36,489 Non Life Ins. reserves & Long Term Ins. Funds 344 568 827 869 912 Other Liabilties 12,457 12,509 12,168 13,263 14,457 Tax Payable (158) 37 774 1,006 1,308 Deferred Taxation 353 316 318 327 339 Debentures 5,983 5,977 7,083 7,367 7,809
152,733 163,632 193,883 217,993 246,738 Minority Interest 125 149 180 149 149 SHAREHOLDERS FUNDSOrdinary Shares - Voting 770 947 947 1,893 1,893 Ordinary Shares - Non Voting 231 231 231 462 462 Share Capital 1,001 1,178 1,178 2,355 2,355 Statutory Reserve Fund 570 625 670 625 625 Reserves 7,332 9,404 11,068 12,634 16,350 Shareholders Funds 8,903 11,206 12,916 15,614 19,330
161,761 174,987 206,979 233,756 266,217
The banks’ Tier 1 and Total CAR stood at 8.90%and 10.42% respectively as at the 1H of FY07.Rs. 2bn raised via a debenture issue in 3Q of FY07should help boost Tier 2 capital to approximately12% by the end of the 3Q.
The bank has witnessed sound growth along withimproved asset quality and provision cover as wellas enhanced profitability. Earnings growth of19.23% and 26.36% in FY07 and FY08respectively correspond to a P/E multiple of 9.09xand 7.19x. Given the banks’ strong fundamentalswe believe the counter presents further upside inthe medium to long term. We recommend BUY
This document is published by John Keells Stockbrokers (Pvt.) Limited for the exclusive use of their clients. All information has been compiled from availabledocumentation and JKSB’s own research material. Whilst all reasonable care has been taken to ensure the accuracy of the contents of this issue, neither JKSB norits employees can accept responsibility for any decisions made by investors based on information contained herein.

18
Rs. 120.00 BUY
Sri Lanka Equities Corporate Update
Sampath Bank PLC (SAMP)
A J
KSB
Res
earc
h P
ubli
cati
on
SAMP PRICE - VOLUME GRAPH
-
10
20
30
40
50
60
70
80
90
100
110
120
130
140
02-
Jan
-03
27-M
ar-0
32
3-J
un
-03
02-S
ep-0
31
9-N
ov
-03
13-
Feb
-04
20-
Ma
y-0
412
-Au
g-0
40
5-N
ov
-04
03-
Feb
-05
29-A
pr-
052
6-J
ul-
05
14-O
ct-
050
5-J
an-0
630
-Mar
-06
26-
Ju
n-0
610
-Oc
t-06
27-
Dec
-06
21-M
ar-0
72
5-J
un
-07
07-S
ep-0
7
Rs.
-
500,000
1,000,000
1,500,000
2,000,000
2,500,000
3,000,000
3,500,000
4,000,000
4,500,000Volume
Volume
Price
SAMPReuters CodeBloomberg CodeShare Price LKR
Voting12 mth High/Low (Rs.)Market Capitalisation (Rs.mn)Average Daily Volume (Shares)Market Capitalisation (Voting) Rs. mn 8,267 Price Performance (%)
1 mth 6 mth 12 mthASPI 1.37 (8.70) 6.63SAMP 2.78 9.09 27.66* Adjusted for bonus and rights issues
132.00 / 91.00
18,126
Issued Share Capital (Shares)68,887,628
8,267
SAMP.CMSAMP.SL
120.00
SAMP is the fourth largest private bank in the country with a 6% share ofLCB assets and a branch network of 109 centres across the island. SAMPhas a 100% stake in both Sampath Surakum Ltd, a Primary Dealer inGovernment Securities, and Sampath Leasing and Factoring Ltd. In additionthe bank has a 51% stake in S.C Securities (Pvt) Ltd, a mid sized sharebroking company. The bank also has a 30.8% stake in Lankabangla FinanceLtd, a small merchant bank in Bangladesh that is also engaged in leasing,stock broking and credit cards.
In addition the bank has a 24.06% stake in Union Bank, acquired at therequest of the Central Bank and is presently under a restructuring programinitiated by SAMP. Union bank still remains largely undercapitalised, whilea SPV has also been established to take over its bad loans with SAMPissuing a guarantee to Union Bank Colombo of approximately Rs. 1.6bnon behalf of the SPV which in turn has invested in a deep discount bondissued by SAMP. The guarantee is exercisable in 2023 while SAMP has theright to set off the maturity proceeds of the bond against its obligation ifany under the guarantee. As such SAMP would not be affected by thisarrangement. Union Bank of Colombo reported earnings of Rs. 51mn inFY06, with plans underway for further capital infusions.
The bank has consistently reflected sound asset quality, while recordingsteady loan growth in line with the sector. Growth in its loan book is expectedto slow down from 29.7% witnessed last year to 24.1% in FY07 and24.5% in FY08. Much of the recent growth in advances has arisen frompersonal retail loans, leasing and housing loans, in line with the trend seenin the sector. Net Interest Margins which have remained fairly consistentin the past three years is expected to rise in FY07, assisted by a favourablerate variance with the sharp rise in interest rates this year.
SAMP has consistently pioneered the adoption of technology into bankingservices among local banks since its inception in 1987. These value addedservices along with other non interest income revenue streams such asforeign exchange income is expected see non interest income increase by33.7% in FY07 and 27.4% in FY08.
The banks’ cost to income ratio has declined steadily and comparesfavourably with the sector, and is expected to continue to decline withfurther streamlining of routine back end procedures, and increasedautomation of processes.
Sound provision cover consistently exhibited by the bank is expected tofurther strengthen to 88.3% and 92.3% in FY07 and FY08, with the newprovisioning guidelines of the Central Bank. The gross NPL ratio which
2005 1,943 1,419 1,348 10.93 4.72 11.81 1.66 4.3% 5.50 2006 3,614 1,755 1,688 13.51 23.66 9.55 1.44 4.7% 6.00 2007 4,224 1,692 1,585 13.03 (3.57) 9.90 1.34 3.9% 5.00
2008E 4,860 2,002 1,892 15.41 18.28 8.37 0.96 3.9% 5.00 2009E 5,646 2,299 2,184 17.70 14.85 7.29 0.85 3.9% 5.00
Financial Year (Mar)
Net Income
NPAT (Rs.mn)
PAT, MI & Pref Divid
EPS (Rs.)
EPS Growth
PER (x) Rs.
P/BVDividend Yield %
DPS Rs.
John Keells Stock Brokers (Pvt) LtdCompany No. PV 89130, Glennie Street,Colombo 2,Sri Lanka.
Tel: 9411 2421 101-9 (Gen.),9411 2326 003,9411 2439 047/8
Fax: 9411 2326 863,9411 2342 068
Yolan [email protected]
October 2007

19
SAMP 2004 2005 2006 2007E 2008EPrice / Book Value 1.9 1.4 1.2 1.0 0.8 EPS 10.0 12.4 15.6 22.7 28.3 PER 12.0 9.7 7.7 5.3 4.2 EPS Growth -6.5% 24.5% 25.5% 45.6% 25.0%DVD YLD 1.7% 1.7% 2.1% 2.1% 2.1%ROE 16.2% 14.3% 15.4% 18.5% 18.7%ROAE 17.4% 16.7% 16.6% 20.3% 20.7%ROAA 1.1% 1.1% 1.1% 1.3% 1.4%NIM 4.5% 4.6% 4.5% 5.1% 4.8%Fee Income / Operating Income 38% 32% 37% 37% 37%Cost / Income 74.1% 71.2% 64.5% 64.0% 63.6%Cost / Income (Excl VAT) 68.1% 65.0% 55.3% 54.8% 54.4%Cost / Average Assets 5.0% 4.7% 4.5% 4.7% 5.0%Tier 1 9.14% 10.14% 8.38%Loan Growth 28.3% 28.4% 29.7% 24.1% 24.5%Asset Growth 15.3% 25.4% 30.1% 19.2% 19.4%RWA Growth 25% 30% 45% 21% 24%Loan/ Deposits 87.3% 88.5% 90.6% 92.9% 94.8%Loan / Assets 63.0% 64.5% 64.3% 66.9% 69.8%Deposist / Liabilities 77.4% 78.7% 75.8% 77.2% 78.7%Equity / Assets 6.1% 6.9% 6.1% 6.2% 6.4%NPL Ratio 8.64% 6.19% 5.52% 5.16% 4.85%NPL Coverage 64.4% 82.4% 82.3% 88.3% 92.3%% Change in NPLS -2.9% -8.0% 15.7% 15.9% 17.1%Personnel Cost / Average Assets 1.4% 1.4% 1.3% 1.3% 1.4%
Income Statement 2004 2005E 2006 2007E 2008E
For the Year Ended 31st December Rs. 'mn Rs. 'mn Rs. 'mn Rs. 'mn Rs. 'mnIncome 7,560 9,135 12,934 18,079 22,116 Net Interest Income 2,616 3,372 4,202 5,573 7,042 Foreign exchange profit 617 192 646 846 1,100 Fee and commisison income 630 829 1,107 1,505 1,925 Other Income 348 538 677 898 1,112
4,212 4,932 6,632 8,822 11,179 N.S.L - - - - - Net Income 4,212 4,932 6,632 8,822 11,179 Less Operating ExpensesPersonnel Costs 857 1,037 1,286 1,600 1,950 Premises and Equipment expenses 851 907 1,101 1,410 1,800 Provision for staff retirement benefits 130 120 144 175 205 Loan losses and Provisions 561 622 493 792 909 Other Overhead expenses 722 824 1,252 1,670 2,250 Total Expenses (3,120) (3,511) (4,276) (5,647) (7,114) Profit from Operations 1,091 1,421 2,357 3,175 4,065 Add: Share of PBT of Assoc. 12 18 38 13 13 Profit before Tax 1,096 1,432 2,395 3,188 4,078 Less: Provision for Taxation 350 503 1,261 1,579 2,014 Profit after taxation 747 929 1,134 1,609 2,064 Less: Minority Interest 60 74 62 48 113 Net profit for the year 686 854 1,072 1,561 1,951
Balance Sheet 2004 2005E 2006 2007E 2008EAs at 31st December Rs. 'mn Rs. 'mn Rs. 'mn Rs. 'mn Rs. 'mnASSETSCash and short-term funds 4,810 5,848 8,820 9,695 11,565 Balances with Central Banks 4,472 5,671 6,719 7,015 7,265 Government Treasury Bills and Bonds 303 229 12,172 13,633 15,269 Securities purchased under re-sale agre 11 356 301 689 845 Dealing Securities 4,468 4,671 4,165 3,921 4,025 Investment securities 8,325 9,612 2,888 3,123 3,450 Bills of Exchange 2,210 2,557 2,390 2,772 3,216 Loans and Advances 39,827 50,092 63,446 77,404 94,433 Lease receivable within one year 629 1,559 2,368 3,434 4,979 Lease receiveable from one to five years 1,320 2,253 5,025 7,286 10,565
66,374 82,847 108,294 128,972 155,612
Goodwil on consolidation & pre paid taxInvestment in Assoc. 54 407 445 413 413 Interest and Fees receivables 888 1,291 1,442 2,236 953 Other Assets 533 760 995 1,042 1,547 Property, Plant and Equipment 1,939 2,194 2,695 3,114 3,531 TOTAL ASSETS 69,808 87,511 113,884 135,790 162,069 Financed By :Deposits form customers 50,405 63,786 80,787 97,870 119,374 Dividends Payable 16 44 18 61 138 Borrowings 4,906 4,184 10,248 11,888 13,790 Sec. sold under repurchase agreements 3,915 6,335 7,004 7,354 7,722 Other Liabilties 3,251 3,743 4,656 4,889 5,133 Tax Payable 230 235 733 1,261 1,579 Deferred Taxation 167 210 384 403 423 Debentures 2,196 2,491 2,734 3,090 3,491
65,087 81,028 106,565 126,815 151,650 Minority Interest 473 488 373 520 12
Share Capital 517 689 689 689 689 Statutory Reserve Fund 243 286 338 286 286 Reserves 3,488 5,020 5,920 7,481 9,431 Shareholders Funds 4,248 5,995 6,947 8,456 10,407
69,808 87,511 113,884 135,790 162,069
has declined over the last three years followingimproved recoveries and better asset quality in itslending portfolio is expected to continue to declinefurther as the bank exercises greater prudence inissuing of advances.
Retail customer deposits account for 76% of thebanks liabilities, with branch expansion assisting ingrowing its base of low cost savings deposits.Deposit growth is expected at 21.1% and 22.0%in FY07 and FY08, while borrowings are expectedto increase by 16% in the same period.
The banks Tier 1 and Total CAR stood at 8.08%and 10.63% respectively at the 1H of FY07,comfortably above statutory limits. Howeversustained loan book growth as seen over the lastfive years has not been matched by growth in itscapital position.
A forecast earnings growth of 45.6% and 25.0%in FY07 and FY08 provides a forecast PER of5.3x and 4.24x at a market price of Rs. 120/-.The counter currently trades at a 45.3% discountto the market and a 24.7% discount to the sectorin our opinion is unwarranted, and presentssignificant upside potential. We recommend BUY.
This document is published by John Keells Stockbrokers (Pvt.) Limited for the exclusive use of their clients. All information has been compiled from availabledocumentation and JKSB’s own research material. Whilst all reasonable care has been taken to ensure the accuracy of the contents of this issue, neither JKSB norits employees can accept responsibility for any decisions made by investors based on information contained herein.

20
Rs. 35.00 BUY
Sri Lanka Equities Corporate Update
Nations Trust Bank PLC (NTB)
A J
KSB
Res
earc
h P
ubli
cati
on
NTB PRICE - VOLUME GRAPH
-
5
10
15
20
25
30
35
40
45
50
02-J
an-0
328
-Feb
-03
29-A
pr-0
324
-Jun
-03
14-A
ug-0
306
-Oct
-03
28-N
ov-0
326
-Jan
-04
22-M
ar-0
421
-May
-04
14-J
ul-0
403
-Sep
-04
26-O
ct-0
420
-Dec
-04
16-F
eb-0
518
-Apr
-05
15-J
un-0
511
-Aug
-05
04-O
ct-0
530
-Nov
-05
26-J
an-0
622
-Mar
-06
23-M
ay-0
613
-Jul
-06
25-S
ep-0
617
-Nov
-06
16-J
an-0
714
-Mar
-07
18-M
ay-0
711
-Jul
-07
04-S
ep-0
7
Rs.
0
500,000
1,000,000
1,500,000
2,000,000
2,500,000
3,000,000
3,500,000
4,000,000
4,500,000
5,000,000Volume
VolumePrice
Nations Trust Bank (NTB) that commenced operations in 1999 followingthe acquisition of the Overseas Trust Bank branch in Colombo has grownby selective acquisition and is presently backed by two key promoters,John Keells Holdings PLC and Central Finance Co. PLC who currentlyhold 29.9% and 20% of the banks equity.
NTB has recorded considerable earnings and asset growth over the lastfours years, boosted by the acquisition of Mercantile Leasing Limited(MLL) in January 2006, and is now a far more financially stable institutionand is poised for more expansive growth in the short to medium term.The merger enabled NTB to inherit a leasing portfolio of approximatelyRs. 3.2bn, while also enabling NTB to mobilise deposits, giving its leasingbusiness access to low cost funds thus improving margins and enhancingcompetitiveness. The merger was also a boost to the banks capital adequacyand has enhanced the single borrower limit while giving the bank a morediversified income stream.
The bank has a fully owned subsidiary Waldock Mackenzie engaged infixed income securities trading, while also having an exclusive alliance forthe issue and servicing of American Express Credit Cards, both of whichhave been key contributors to earnings for the bank.
The bank has recorded strong loan growth over the last three yearsaugmented last year by the consolidation of MLLs’ balance sheet. Thebank also possesses a loan book of sound asset quality with its corporatelending portfolio dominated by large stable corporates. However much ofthe banks contribution to loan growth has arisen from personal loans,housing loans and credit card advances. Its consumer finance segment isestimated to account for over a third of its loan book, while being thelargest contributor to loan growth.
We estimate healthy loan growth of 35.7% in FY07 and 29.6% in FY08although coming off what is still a relatively low base. Net interest marginshave been stable for the bank with retail deposits expected to grow at19.9% and 22.1% in FY07 and FY08 respectively. Deposits account for46.2% of liabilities, much lower than other nationwide banks which reportdeposits to liability ratio in excess of 75%. New innovative savings plansand products are expected to increase the composition of deposits in itsfund base while selective branch expansion outside of the Western Provincemay also assist in growing its deposits in the medium term.
Contributions from foreign exchange income as well as fees and commissionincome arising from its credit card business and trade finance activities
NTBReuters CodeBloomberg CodeShare Price LKR
Voting (Post merger)
12 mth High/Low (Rs.)Average Daily Volume (Shares)Market Capitalisation (Voting) Rs. mn 4,403 Price Performance (%)ASPI 1.37 (8.70) 6.63
NTB 2.78 1.45 35.92
NTB.CMNTB.SL
35.00
36.75 / 25.75136,974
Issued Share Capital (Shares)125,786,004
2004 1,123 45 0.36 (81.96) 96.83 9.25 1.43% 0.50 2005 1,581 125 0.99 174.29 35.30 7.38 1.43% 0.50 2006 2,643 323 2.57 159.25 13.62 2.80 2.86% 1.00
2007E 3,353 476 3.79 47.35 9.24 2.62 2.86% 1.00 2008E 4,217 661 5.25 38.70 6.66 1.88 2.86% 1.00
DPS Rs.EPS
Growth %
PER (x) Rs.
Dividend Yield %
Financial Year (Dec)
Net Income (Rs.mn)
EPS (Rs.)
PAT (Rs.mn)
P/BV
John Keells Stock Brokers (Pvt) LtdCompany No. PV 89130, Glennie Street,Colombo 2,Sri Lanka.
Tel: 9411 2421 101-9 (Gen.),9411 2326 003,9411 2439 047/8
Fax: 9411 2326 863,9411 2342 068
Yolan [email protected]
October 2007

21
NTB 2004 2005 2006 2007E 2008EPrice / Book Value 3.3 3.0 1.5 1.5 1.2 EPS 0.4 1.0 2.6 3.8 5.3 PER 96.8 35.3 13.6 9.2 6.7 EPS Growth -82.0% 174.3% 159.2% 47.4% 38.7%DVD YLD 1.4% 1.4% 2.9% 2.9% 2.9%ROE 3.4% 8.5% 11.3% 16.1% 18.2%ROAE 3.4% 8.9% 15.0% 16.3% 20.0%ROAA 0.2% 0.5% 0.9% 0.9% 1.1%NIM 2.9% 4.1% 3.9% 3.9% 4.0%Fee Income / Operating Income 47% 40% 35% 39% 40%Cost / Income 79.7% 76.8% 71.5% 69.8% 67.1%Cost / Income (Excl VAT) 76.4% 72.5% 66.5% 64.3% 61.6%Cost / Average Assets 4.42% 5.15% 5.17% 4.52% 4.60%Tier 1 10.44% 8.74% 7.86%Loan Growth 44.8% 35.2% 87.6% 35.7% 29.6%Asset Growth 15.7% 17.0% 87.4% 17.6% 19.9%RWA Growth 60% 31% 83% 19% 20%Loan/ Deposits 91.8% 90.6% 117.7% 133.2% 141.3%Loan / Assets 44.1% 51.0% 51.1% 58.9% 63.6%Deposits / Liabilities 51.2% 59.8% 46.2% 46.7% 47.6%Equity / Assets 6.2% 5.8% 6.0% 5.3% 5.4%NPL Ratio 6.44% 6.12% 5.37% 5.26% 5.32%NPL Coverage 48.6% 56.4% 58.3% 60.0% 62.0%% Change in NPLS 52.2% 28.4% 64.7% 32.8% 31.1%Personnel Cost / Average Assets 1.3% 1.6% 1.7% 1.5% 1.5%
accounted for 35% of total operating income lastyear and is expected to increase further over thenext two years. This would be also fueled by newvalue added services being promoted under the‘Nations’ brand, offering a more diversified poolof banking solutions to its corporate and retailclients.
Scale benefits have begun to reflect in a decliningCost to Income ratio for the bank, but still re-mains high compared to its peers. Provision coverin the bank has been improving steadily over thelast three years while the banks gross NPL ratiohas also registered consistent declines in recentyears.
The bank exhibits a high Loan/Deposit ratio, how-ever this includes low cost borrowings from multi-lateral agencies as well as borrowings it inheritedfrom the merger with MLL and a debenture issuewith DFCC.
Tier 1 and total CAR stood at 6.9% and 10.71%as at the 1H of FY07. The bank may consider arights issue within the next 12 months as an optiontoward raising its capital adequacy if it is to main-tain current growth. Sustained high interest ratescould lead to a significant increase in its cost offunds given the banks modest deposit base and assuch a fresh infusion of capital would significantlystrengthen the banks balance sheet in what is pres-ently a challenging environment.
Forecast earnings growth of 47.4% in FY07 and38.7% in FY08 correspond to a PER of 9.24xand 6.67x. NTB in our opinion is poised for sig-nificant growth in the short and medium term,and given these prospects we believe NTB shouldcontinue to trade at a significant premium to bothsector and market. We recommend BUY.
This document is published by John Keells Stockbrokers (Pvt.) Limited for the exclusive use of their clients. All information has been compiled from availabledocumentation and JKSB’s own research material. Whilst all reasonable care has been taken to ensure the accuracy of the contents of this issue, neither JKSB norits employees can accept responsibility for any decisions made by investors based on information contained herein.
Income Statement 2004 2005 2006 2007E 2008EFor the Year Ended 31st December Rs. 'mn Rs. 'mn Rs. 'mn Rs. 'mn Rs. 'mn
Income 2,242 3,086 5,922 8,399 9,561 Interest Income 1,709 2,448 4,991 7,106 7,891 Less: Interest Expense 1,119 1,504 3,280 5,046 5,344 Net Interest Income 590 944 1,711 2,060 2,547 Foreign exchange profit 143 124 192 290 370 Fee and commisison income 139 199 275 373 485 Other Income 251 314 464 630 815 Net Income 1,123 1,581 2,643 3,353 4,217 Less Operating ExpensesPersonnel Costs 265 366 625 760 930 Premises, Equipment & est. expenses 208 279 386 495 595 Provision for staff retirement benefits 5 15 18 26 31 Provision in Bad and Doubtful debts 114 169 215 279 369 Other Overhead expenses & VAT 417 554 860 1,060 1,275 Total Expenses (1,009) (1,384) (2,104) (2,620) (3,200) Profit from Operations 115 197 538 733 1,017 Profit before Tax 115 197 538 733 1,017 Less: Provision for Taxation 69 73 215 257 356 Net profit for the year 45 125 323 476 661
Balance Sheet 2004 2005 2006 2007E 2008EAs at 31st December Rs. 'mn Rs. 'mn Rs. 'mn Rs. 'mn Rs. 'mnAssetsCash and short-term funds 1,977 1,633 4,780 4,790 4,475 Balances with Central Banks 609 955 1,315 1,172 1,407 Government Treasury Bills and Bonds 5,771 5,341 10,323 10,839 11,381 Dealing Securities 2,103 2,640 2,672 2,805 2,945 Investment securities 629 621 1,629 1,150 1,325 Bills of Exchange 381 336 291 481 577 Loans and Advances 9,138 12,299 18,839 25,405 32,450 Lease receivable within one year 18 80 1,774 2,420 3,309 Lease receiveable from one to five years 53 249 3,416 4,698 6,424
20,679 24,155 45,040 53,761 64,293 Goodwill 68 59 451 75 72 Other Assets 594 785 998 1,044 1,502 Property, Plant and Equipment 381 414 1,133 1,132 1,317 Total Assets 21,722 25,413 47,622 56,011 67,184 Financed By :LiabilitiesDeposits from customers 10,441 14,314 20,670 24,783 30,266 Borrowings 8,118 7,275 19,375 23,250 27,900 Due to banks 457 198 1,076 1,292 1,563 Other Liabilities 919 1,388 2,212 2,322 2,439 Deferred Liabilties 97 100 194 165 156 Subordinated Loans 351 673 673 673 673 Debentures 0 0 560 560 560
20,383 23,949 44,760 53,045 63,557 Shareholders FundsShare Capital 850 850 1,258 1,258 1,258 Statutory Reserve Fund 13 17 29 29 29 Reserves 476 597 1,575 1,679 2,340 Shareholders Funds 1,339 1,463 2,862 2,966 3,627 Liabilities & shareholders' funds 21,722 25,413 47,622 56,011 67,184

22
Rs. 162.00 LONG TERM - BUY
Sri Lanka Equities Corporate Update
National Development Bank (NDB)
A J
KSB
Res
earc
h P
ubli
cati
on
NDB PRICE - VOLUME GRAPH
30
60
90
120
150
180
210
240
02-J
an-0
304
-Mar
-03
06-M
ay-0
303
-Jul
-03
28-A
ug-0
327
-Oct
-03
23-D
ec-0
326
-Feb
-04
27-A
pr-0
428
-Jun
-04
23-A
ug-0
419
-Oct
-04
22-D
ec-0
428
-Feb
-05
12-M
ay-0
515
-Jul
-05
16-S
ep-0
522
-Nov
-05
23-J
an-0
622
-Mar
-06
30-M
ay-0
628
-Jul
-06
16-O
ct-0
613
-Dec
-06
14-F
eb-0
727
-Apr
-07
05-J
ul-0
711
-Sep
-07
Rs.
0
1,000,000
2,000,000
3,000,000
4,000,000
5,000,000
6,000,000
7,000,000
8,000,000
9,000,000
Volume
Volume
Price
NDBReuters CodeBloomberg CodeShare Price LKRIssued Share Capital (Shares)Voting12 mth High/Low (Rs.)Average Daily Volume (Shares)Market Capitalisation (Voting) Rs. Price Performance (%)
1 mth 6 mth 12 mthASPI 1.37 (8.70) 6.63NDB 0.15 (0.16) (2.99)* Adjusted for bonus and rights issues
86,29213,261
81,855,385 221.75 / 158.00
162.00 NDB.SL
NDB.CM
NDB, the former development bank (National Development Bank of SriLanka) engaged primarily in project finance was formed following the amerger with its subsidiary NDB Bank Ltd as a result of a decline inconcessionary credit lines from multilateral agencies.
The merger enabled the bank to engage in commercial banking operations,thus diversifying into alternative revenue streams while competing withother banks for project lending. The bank now operates as a LicensedCommercial Bank. The bank also divested its controlling stake in EagleInsurance Company in early 2006, but still has an effective holding of32.42% in the entity.
The bank has a diversified portfolio of financial services with a prominentpresence in Project and Corporate lending, Consumer and SME finance,Investment Banking, Stock Broking and Insurance.
NDB expanded its branch network to 33 centres fueling growth in itsconsumer lending portfolio, which still accounts for just around 20% ofits loan book. Loan growth in 2006 was modest at 13.9% due to prudentlending. Loan growth is expected to increase to 20.2% in FY07 and FY08more in line with the sector average, with growth stemming from bothconsumer and corporate lending. Net Interest margin are expected toincrease marginally with the bank benefiting from the rising interest rateenvironment, given the re-pricing of advances ahead of deposits as wellas a favourable volume variance witnessed in the first half of this year.
Deposits accounted for just 38.5% of liabilities in FY06, but grew by51.7% in FY06, with funds from credit lines accounting for approximatelya quarter of the banks funds. Deposits are however expected to growsteadily with the deposit to liability ratio expected to improve in the currentyear and beyond.
The bank has recorded significant improvement in its asset quality overthe last three years. The bank NPL ratio ranks as the best among its peers,improving appreciably over the last three years while the banks’ provisioncover stood at a very comfortable 188% of NPLs in FY06. The assetquality of the banks corporate lending portfolio is also considered to verysound despite some degree of credit concentration among clients.
The banks Tier 1 and Total CAR are very strong at 21.33% and 21.42%as at 1H of FY07, well above the minimum statutory requirements.
Earnings growth excluding capital gains from divestment of certain unquotedentities this year amount to 40.17% from flat earnings growth witnessed in
2004 3,688 805 703 8.59 (37.41) 18.86 1.58 3.70% 6.00 2005 4,754 1,273 1,036 12.66 47.37 12.80 1.50 3.70% 6.00
* 2006 3,963 1,191 1,014 12.39 (2.13) 13.08 1.25 3.70% 6.00 2007E 4,672 1,582 1,421 17.36 40.17 9.33 1.11 3.70% 6.00 2008E 5,666 1,897 1,704 20.81 19.86 7.78 0.97 3.70% 6.00
* Excluding Exceptional Item - Capital gain of Rs. 1.02bn
DPS Rs.
EPS Growth %
PER (x) Rs.
Dividend Yield %
P/BVFinancial
Year (Dec)Net Income
(Rs.mn)PAT
(Rs.mn)EPS (Rs.)
PAT& MI (Rs.mn)
John Keells Stock Brokers (Pvt) LtdCompany No. PV 89130, Glennie Street,Colombo 2,Sri Lanka.
Tel: 9411 2421 101-9 (Gen.),9411 2326 003,9411 2439 047/8
Fax: 9411 2326 863,9411 2342 068
Yolan [email protected]
October 2007

23
NDB 2004 2005 2006 2007E 2008EPrice / Book Value 1.6 1.5 1.4 1.1 1.0 EPS 8.6 12.7 12.4 17.4 20.8 PER 18.9 12.8 13.1 9.3 7.8 EPS Growth -37.4% 47.4% -2.1% 40.2% 19.9%DVD YLD 3.6% 3.7% 2.5% 3.1% 3.1%ROE 8.4% 11.8% 9.6% 11.9% 12.4%ROAE 8.6% 12.1% 10.5% 12.6% 13.3%ROAA 1.4% 1.7% 1.6% 2.0% 2.0%NIM 4.42% 4.65% 4.89% 5.02% 5.02%Fee Income / Operating Income 39% 43% 54% 24% 24%Cost / Income 63.5% 63.3% 56.0% 56.4% 56.8%Cost / Income (Excl VAT) 58.4% 58.0% 44.2% 46.9% 47.3%Cost / Average Assets 4.55% 4.86% 3.42% 3.67% 3.73%Tier 1 17.11 18.83 22.1Loan Growth 61.2% 7.4% 13.9% 20.2% 20.3%Asset Growth 34.4% 9.7% 0.4% 21.1% 19.2%RWA Growth 65% 5.5% 13.5% 24.4% 17.8%Loan/ Deposits 309.7% 264.2% 198.4% 199.6% 195.9%Loan / Assets 58.2% 57.0% 64.6% 64.2% 64.7%Deposist / Liabilities 31.5% 28.2% 38.5% 47.6% 47.5%Equity / Assets 14.2% 13.6% 16.3% 15.2% 14.6%NPL Ratio 7.08% 4.32% 2.22% 1.98% 1.90%NPL Coverage 86.5% 125.6% 188.2% 156.8% 123.2%% Change in NPLS -10.0% -34.5% -41.5% 7.4% 15.2%Personnel Cost / Average Assets 1.7% 1.8% 1.3% 1.3% 1.3%
Income Statement 2004 2005 2006 2007E 2008EFor the Year Ended 31st December Rs. 'mn Rs. 'mn Rs. 'mn Rs. 'mn Rs. 'mn
Income 5,919 7,116 8,203 9,137 9,767 Interest Income 4,448 5,035 6,076 8,035 8,423 Less: Interest Expense 2,201 2,342 3,223 4,465 4,101 Net Interest Income 2,246 2,693 2,853 3,571 4,322 Income Operatiing Leases 42 26 7 4 3 Depreciation - Operating Leases (29) (20) (6) (2) (1) Other Income 1,429 2,055 2,126 1,100 1,342 Net Income 3,688 4,754 4,979 4,672 5,666 Less Operating ExpensesPersonnel Costs 879 1,088 817 920 1,150 Amortisation of Goodwill 76 42 - - - Provision for staff retirement benefits 37 44 13 40 51 VAT on Financial Services 187 251 466 514 623 Loan losses and Provisions 279 153 13 15 26 Other Overhead expenses 1,161 1,412 923 1,163 1,396 Total Expenses 2,619 3,162 2,233 2,651 - Profit from Operations 1,068 1,593 2,747 2,021 2,419 Add: Share of PBT of Assoc. 31 22 214 240 290 Profit before Tax 1,100 1,614 2,961 2,261 2,709 Less: Provision for Taxation 294 342 754 678 813 Profit after taxation 805 1,273 2,207 1,582 1,897 Less: Minority Interest 102 237 176 161 193 Net profit for the year 703 1,036 2,030 1,421 1,704
Balance Sheet 2004 2005 2006 2007E 2008EAs at 31st December Rs. 'mn Rs. 'mn Rs. 'mn Rs. 'mn Rs. 'mnASSETSCash and short-term funds 3,407 2,917 6,042 8,200 10,100 Government Securities 10,694 11,268 5,933 7,416 9,270 Investment and Dealing Securities 5,634 4,879 6,237 6,871 8,383 Bills of Exchange 943 971 1,592 1,831 2,105 Loans and Advances 31,815 35,167 38,948 46,738 56,085 Lease Rentals Receivable 536 731 1,449 1,913 2,525 Goodwill 1,535 873 - - - Investment in Assoc. 225 241 1,179 1,116 1,116 Other Assets 2,538 3,129 1,696 2,465 1,778 Property, Plant and Equipment 1,658 1,607 1,892 2,120 2,422 TOTAL ASSETS 58,985 64,715 64,968 78,670 93,785 Financed By :Deposits form customers 11,085 13,954 21,161 25,292 30,988 Non Life Insurance Reserve 486 859 - - - Long Term Insurance Fund 7,985 9,238 - - - Dividends Payable 7 8 108 181 181 Borrowings 26,881 27,799 29,204 36,504 43,805 Other Liabilties 3,070 3,067 2,624 3,214 3,628 TOTAL LIABILITIES 49,515 54,925 53,097 65,191 78,603 Minority Interest 1,093 974 1,314 1,490 1,490 SHAREHOLDERS FUNDSStated Capital 538 546 1,033 1,033 1,033 Statutory Reserve Fund 546 546 819 819 819 Share Premium Reserve 92 214 - - - Revaluation Reserve 86 - - - - Reserves 7,115 7,509 8,715 10,136 11,840 Shareholders Funds 8,377 8,815 10,567 11,988 13,691 TOTAL LIABILITIES & CAPITAL 58,985 64,715 64,977 78,670 93,785
FY06, while growth forecast for FY08 stand at19.86%. This corresponds to a P/E multiple of9.33x and 7.78x at a market price of Rs. 162/-.NDB is a bank emerging from a transition tocommercial banking operations and presents stronggrowth prospects in the medium to long termenhanced by significant opportunities from crossselling of financial services within the group.
This document is published by John Keells Stockbrokers (Pvt.) Limited for the exclusive use of their clients. All information has been compiled from availabledocumentation and JKSB’s own research material. Whilst all reasonable care has been taken to ensure the accuracy of the contents of this issue, neither JKSB norits employees can accept responsibility for any decisions made by investors based on information contained herein.

24
Rs. 129.00 LONG TERM - BUY
Sri Lanka Equities Corporate Update
DFCC Bank PLC (DFCC)
A J
KSB
Res
earc
h P
ubli
cati
on
DFCC PRICE - VOLUME GRAPH
-
20
40
60
80
100
120
140
160
180
02-J
an-0
305
-Mar
-03
06-M
ay-0
301
-Jul
-03
22-A
ug-0
317
-Oct
-03
15-D
ec-0
313
-Feb
-04
08-A
pr-0
411
-Jun
-04
04-A
ug-0
404
-Oct
-04
09-D
ec-0
415
-Feb
-05
29-A
pr-0
511
-Jul
-05
14-S
ep-0
517
-Nov
-05
02-F
eb-0
610
-Apr
-06
16-J
un-0
604
-Sep
-06
06-N
ov-0
605
-Jan
-07
08-M
ar-0
722
-May
-07
16-J
ul-0
711
-Sep
-07
Rs.
0
1,000,000
2,000,000
3,000,000
4,000,000
5,000,000
6,000,000
7,000,000Volume
VolumePrice
DFCCReuters CodeBloomberg CodeShare Price LKRIssued Share Capital (Shares)Voting12 mth High/Low (Rs.)Average Daily Volume (Shares)Market Capitalisation (Voting) Rs. mnPrice Performance (%)
1 mth 6 mth 12 mthASPI 1.37 (8.70) 6.63DFCC 0.08 (11.13) 5.88* Adjusted for bonus and rights issues
98,79616,756
129,888,333 154.18 / 99.28
129.00
DFCC.CMDFCC.SL
DFCC is a Development Finance Institution and is regulated as a LicensedSpecialised Bank. The bank however has acquired a subsidiary, DFCCVardhana which engages in commercial banking operations. The bank isalso engaged in venture capital financing, stock broking and consultancyservices and the leasing of land and building for industrial purposes viasubsidiary holdings. In addition the bank provides investment bankingservices via a joint venture with HNB established earlier this year.Contribution to earnings from these businesses apart from DFCC Vardhanais still relatively small. DFCC also has a 28.99% associate stake inCommercial Bank of Ceylon, the largest local private bank in the country.
Recent guidelines pertaining to ownership restrictions in banks in the countryhas meant that DFCC is required to reduce its holding in its associateCOMB as well as its subsidiary DFCC Vardhana. The Monetary Boardhas asked DFCC to reduce its holding in COMB to 15% by October2008, while DFCC has time till 2012 to reduce its holding in DFCCVardhana. It is understood that DFCC would be requesting an extensionto the timeframe allocated to the disposal of COMB, given the fact thatthe stake in COMB was acquired at the request of the Central Bank.COMB contributed 21% to DFCC’s earnings for the year ended March2007. The required reduction in its holding of DFCC Vardhana in April2012 is likely to result in a merger between the two Banks. Our earningsforecast have assumed that DFCC’s stake in COMB remains intact overthe next two years. A reduction in DFCC’s holding in COMB to 15%would result in a capital gain of approximately Rs. 2.4bn at current marketprice.
Loan growth of 30.6% in FY06 was marginally above the sector average.The groups lending portfolio continues to be dominated by project loansand corporate loans although asset growth in DFCC Vardhana has beenhealthy. Loan growth at DFCC is expected to be conservative at 15.8%and 18.7% over the next two years given current high interest rates.
Deposits accounted for 34.2% of funding in 2006, with borrowings andfunds directed through the government being the primary source of funds.Customer deposits raised via its subsidiary DFCC Vardhana are expectedto grow at 35% in FY08 and 30% in FY09 off a low base. Net Interestmargins are expected to remain stable while non interest income is expectedto continue to account for approximately 30% of total operating income.
The bank has reported stable NPL ratios while NPL coverage remains lowat just 37.5% in 2006. However the bank adopts prudent provisioningpolicies like most other large private banks, providing for bad loans in fullwithin 12mths as against central bank guidelines of 18mths while classifyingNPLs after 2mths of overdue payments against central bank guidelines
2005 1,943 1,419 1,348 10.93 4.72 11.81 1.66 4.3% 5.50 2006 3,614 1,755 1,688 13.51 23.66 9.55 1.44 4.7% 6.00 2007 4,224 1,692 1,585 13.03 (3.57) 9.90 1.34 3.9% 5.00
2008E 4,860 2,002 1,892 15.41 18.28 8.37 0.96 3.9% 5.00 2009E 5,646 2,299 2,184 17.70 14.85 7.29 0.85 3.9% 5.00
Financial Year (Mar)
Net Income
NPAT (Rs.mn)
PAT, MI & Pref Divid
EPS (Rs.)
EPS Growth
PER (x) Rs.
P/BVDividend Yield %
DPS Rs.
John Keells Stock Brokers (Pvt) LtdCompany No. PV 89130, Glennie Street,Colombo 2,Sri Lanka.
Tel: 9411 2421 101-9 (Gen.),9411 2326 003,9411 2439 047/8
Fax: 9411 2326 863,9411 2342 068
Yolan [email protected]
October 2007

25
DFCC 2004 2005 2006 2007E 2008EPrice / Book Value 1.7 1.4 1.3 1.0 0.9 EPS 10.4 13.0 12.2 14.6 16.8 PER 12.4 9.9 10.6 8.9 7.7 EPS Growth -0.5% 25.2% -6.1% 19.3% 15.4%DVD YLD 4.3% 4.7% 3.9% 3.9% 3.9%ROE 13.3% 14.5% 12.6% 10.8% 11.1%ROAE 14.3% 15.5% 13.1% 12.6% 11.8%ROAA 3.3% 3.3% 2.4% 2.3% 2.3%NIM 5.5% 5.2% 4.7% 4.6% 4.5%Fee Income / Operating Income 38.8% 32.6% 29.5% 29.1% 28.8%Cost / Income 43.4% 44.2% 45.1% 46.5% 47.6%Cost / Income (Excl VAT) 36.3% 36.0% 34.9% 36.0% 37.1%Cost / Average Assets 3.4% 3.1% 2.9% 2.8% 2.8%Tier 1 26.8% 22.9% 17.8%Loan Growth 21.6% 29.4% 30.6% 15.8% 18.7%Asset Growth 21.2% 25.3% 30.6% 19.2% 18.4%RWA Growth 20.7% 19.5% 76.8% 17.9% 18.4%Loan/ Deposits 487.3% 456.1% 254.2% 218.0% 199.0%Loan / Assets 69.4% 71.6% 71.6% 69.6% 69.7%Deposist / Liabilities 18.6% 20.0% 34.2% 40.1% 43.5%Equity / Assets 22.4% 20.6% 17.0% 19.8% 18.8%NPL Ratio 8.9% 5.0% 4.9% 5.0% 5.0%NPL Coverage 32.0% 47.0% 37.5% 39.6% 43.6%% Change in NPLS -5.2% -27.9% 29.0% 18.2% 18.7%Personnel Cost / Average Assets 1.1% 1.1% 1.0% 1.0% 1.0%
Income Statement 2005 2006 2007 2008E 2009EFor the Year Ended 31st March Rs. 'mn Rs. 'mn Rs. 'mn Rs. 'mn Rs. 'mnIncome 5,167 6,255 8,267 10,243 11,950 Interest Income 3,936 5,076 7,021 8,831 10,326 Interest Expense 1,993 2,641 4,042 5,383 6,304 Net Interest Income 1,943 2,435 2,979 3,448 4,022 Other Income 1,231 1,179 1,245 1,412 1,624 Operating Income 3,174 3,614 4,224 4,860 5,646 Personnel Costs 460 559 673 810 980 Provision of staff retirement benefits 80 90 94 98 103 Premises, equipment & est. expenses 325 330 387 460 550 Other overhead Expenses 220 237 306 380 460 VAT on Financial Services 228 296 429 510 595 Provision forBad and Doubtful Debts 246 177 83 240 375 Operating Expenses 1,690 1,862 2,001 2,498 3,063 Operating Profit before income tax 1,550 1,839 2,238 2,362 2,583 Associate Co. Profit before tax 550 882 959 1,150 1,380 Profit before tax 2,100 2,720 3,198 3,512 3,963 Income tax expense 680 965 1,505 1,510 1,665 Minority Interest 71 67 107 110 115 Profit after tax 1,348 1,688 1,585 1,892 2,184
Balance Sheet 2005 2006 2007 2008E 2009EAs at 31st March Rs. 'mn Rs. 'mn Rs. 'mn Rs. 'mn Rs. 'mnASSETSCash and Short Term Funds 1,021 1,469 5,971 9,985 12,342 Balances with Central Bank 283 694 768 845 929 Treasury bills and other securities 2,564 4,521 3,826 4,742 5,882 Securities purchased under resale agreements 1,460 797 591 650 715 Placements with other banks 276 866 996 275 303 Dealing Securities - 14 26 26 26 Bills of exchange discounted 77 70 459 512 564 Loans 27,072 35,091 44,901 51,740 60,967 Finance Leases 4,166 5,362 7,546 9,017 11,167 Interest Receivable 284 338 587 1,133 1,333 Investment Securities 2,234 1,808 1,758 1,846 1,938 Investment in associate companies 3,251 3,749 4,116 4,626 5,238 Other Assets 1,507 984 1,481 2,929 3,176
Investment property 144 143 132 130 135
Goodwill on consolidation 204 147 147 147 147 Property and equipment 607 513 574 630 700 Total Assets 45,150 56,566 73,878 89,231 105,562
LiabilitiesDeposits from customers 6,427 8,885 20,817 28,103 36,533 Borrowings 24,416 30,931 33,182 36,501 41,976 Debentures 1,500 2,000 2,000 2,000 2,000 Interest Accrued 693 720 1,013 1,164 1,322 Other Liabilities 1,488 1,848 1,770 1,443 1,527 Subordinated Debentures - - 2,000 2,000 2,000 Total Liabilities 34,523 44,384 60,781 71,211 85,358
EquityShare Capital 574 576 866 1,298 1,298 Reserve Fund 305 481 549 549 549 Sinking fund reserve 2,247 2,832 3,373 3,373 3,373 Share Premium 918 936 659 3,239 3,239 Revenue Reserves 4,898 5,172 5,254 5,253 5,253 Other Reserves - Associate - (110) 133 133 133 Retained Earnings 1,166 1,762 1,708 3,600 5,784 Shareholders equity 10,108 11,649 12,542 17,444 19,628 Minority Interest 515 531 555 576 576 Total equity and Liabilities 45,150 56,566 73,878 89,231 105,562
of 3 mths. The provision cover is howeverexpected to improve following central bankguidelines on a mandatory general provision.
The banks cost to income ratio is relatively low asis the case with most Development FinanceInstitutions although this may rise with an increasein personnel and premises expenses fueled by thebranch expansion of DFCC Vardhana, expectedto grow at 6 – 7 new branches each year over thenext two years.
The banks Tier 1 and Total CAR is healthy at21.3% and 18.5% respectively, comfortably aboveminimum statutory requirements
Forecast earnings growth of 18.3% and 14.9% inFY08 and FY09 correspond to a P/E multiple of8.9x and 7.7x earning at a market price of Rs.129.00. The bank is in the process of evolvingfrom a DFI towards greater exposure intocommercial banking operations. The banks soundcapital position sound management capabilityshould see the bank derive greater value in themedium to long term as exposure to commercialbanking operations increase.
This document is published by John Keells Stockbrokers (Pvt.) Limited for the exclusive use of their clients. All information has been compiled from availabledocumentation and JKSB’s own research material. Whilst all reasonable care has been taken to ensure the accuracy of the contents of this issue, neither JKSB norits employees can accept responsibility for any decisions made by investors based on information contained herein.