sqrt pk - sci.ccny.cuny.edugunner/pages-lab/papers/bj02-rox-sup.pdf8/14/02 georgescu, alexov, and...
TRANSCRIPT
8/14/02 Georgescu, A
lexov, and Gunner Supplem
entary Material Pg 1
Com
bining Conform
ational Flexibility and C
ontinuum E
lectrostatics for Calculating pK
a 's in Proteins
R.E
. Georgescu, E
.G. A
lexov, and M.R
. Gunner
Supplementary m
aterial: Biophysical Journal O
ct. 2002
SM I-X
: Experim
ental and calculated pKa 's for residues w
ith measured p
Ka 's. R
esidue name is underlined if it has electrostatic interactions w
ith
another residue of more than –3 ∆
pK units (–4.08 kcal/m
ol). If the residue name is in bold the ionized form
has lost more than 3 ∆
pK units of
reaction field energy (∆∆
Grxn >
4.08 kcal/mol). O
nly the initial heavy atom conform
er in the starred protein data file is used to determine if a
residue is in either category.
Expt: E
xperimental p
Ka 's: ±: R
eported error of experimental m
easurements; n: reported H
ill coefficient value (underlined, if the n values
were explicitly reported otherw
ise n was estim
ated from the shape of published titration curves).
The colum
ns headed by protein data file name contains the calculated p
Ka 's. E
rr: Difference betw
een calculated and experimental value.
Absolute errors greater than 1 pH
unit in bold while those greater than 2 pH
units are also underlined. #: SCC
E: Single C
onformation C
ontinuum
Electrostatics. A
ll other calculations obtained with M
CC
E. *:R
epresentative calculation for this protein. §: Calculations using N
MR
structures.
All other coordinates obtained by x-ray crystallography. For the N
MR
structures the pK
a is the average value for the ensemble of structures;
RM
SV: R
oot-mean-square-variation of pK
a 's calculated for a given residue (J) in the group of n structures is sqrt( 1npK
av-
pKJ
() 2
J=1 nÂ
) . All
calculations carried out with 0.15 M
ionic strength and eprot =4 except for ¶ w
here eprot =8 and || w
here eprot =20. R
MS: root-m
ean-square error of
computed p
Ka 's for a given protein data file is sqrt( 1N
pKexp -
pKcalc
() 2
i=1 NÂ) w
here N is the num
ber of residues with know
n pK
a 's; Conf:
Num
ber of conformers in the calculation. Several proteins have ions that influence residue pK
a 's. +: Ion included; –: no ion.
8/14/02 Georgescu, A
lexov, and Gunner Supplem
entary Material Pg 2
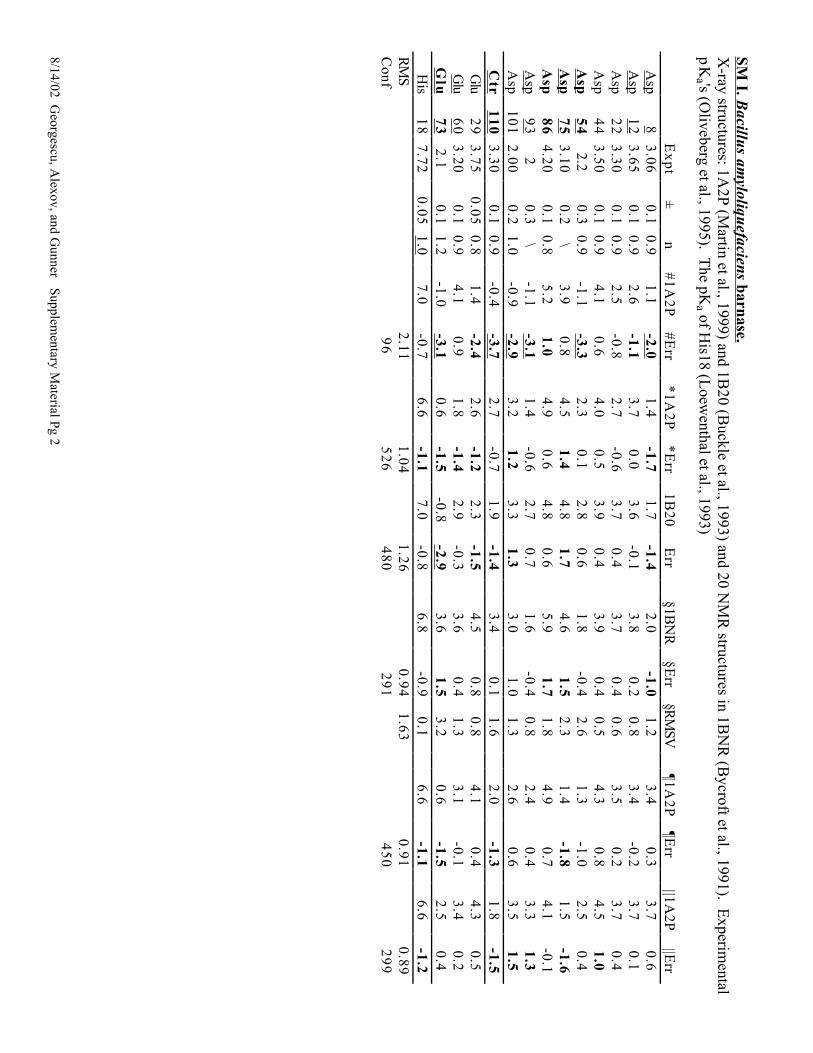
SM I. B
acillus amyloliquefaciens barnase.
X-ray structures: 1A
2P (Martin et al., 1999) and 1B
20 (Buckle et al., 1993) and 20 N
MR
structures in 1BN
R (B
ycroft et al., 1991). Experim
entalp
Ka 's (O
liveberg et al., 1995). The pK
a of His18 (L
oewenthal et al., 1993)
Ex
pt
±n
#1A2P
#Err
*1A2P
*Err
1B20
Err
§1BN
R§E
rr§R
MSV
¶1A2P
¶Err
||1A2P
||Err
Asp
83.06
0.10.9
1.1-2.0
1.4-1.7
1.7-1.4
2.0-1.0
1.23.4
0.33.7
0.6A
sp1
23.65
0.10.9
2.6-1.1
3.70.0
3.6-0.1
3.80.2
0.83.4
-0.23.7
0.1A
sp2
23.30
0.10.9
2.5-0.8
2.7-0.6
3.70.4
3.70.4
0.63.5
0.23.7
0.4A
sp4
43.50
0.10.9
4.10.6
4.00.5
3.90.4
3.90.4
0.54.3
0.84.5
1.0A
sp5
4 2.2
0.30.9
-1.1-3.3
2.30.1
2.80.6
1.8-0.4
2.61.3
-1.02.5
0.4A
sp7
53.10
0.2\
3.90.8
4.51.4
4.81.7
4.61.5
2.31.4
-1.81.5
-1.6A
sp8
64.20
0.10.8
5.21.0
4.90.6
4.80.6
5.91.7
1.84.9
0.74.1
-0.1A
sp9
3 2
0.3\
-1.1-3.1
1.4-0.6
2.70.7
1.6-0.4
0.82.4
0.43.3
1.3A
sp1
01
2.000.2
1.0-0.9
-2.93.2
1.23.3
1.33.0
1.01.3
2.60.6
3.51.5
Ctr
1103.30
0.10.9
-0.4-3.7
2.7-0.7
1.9-1.4
3.40.1
1.62.0
-1.31.8
-1.5G
lu2
93.75
0.050.8
1.4-2.4
2.6-1.2
2.3-1.5
4.50.8
0.84.1
0.44.3
0.5G
lu6
03.20
0.10.9
4.10.9
1.8-1.4
2.9-0.3
3.60.4
1.33.1
-0.13.4
0.2G
lu7
32.1
0.11.2
-1.0-3.1
0.6-1.5
-0.8-2.9
3.61.5
3.20.6
-1.52.5
0.4H
is1
87.72
0.051.0
7.0-0.7
6.6-1.1
7.0-0.8
6.8-0.9
0.16.6
-1.16.6
-1.2R
MS
2.111.04
1.260.94
1.630.91
0.89C
onf9
65
26
48
02
91
45
02
99
8/14/02 Georgescu, A
lexov, and Gunner Supplem
entary Material Pg 3
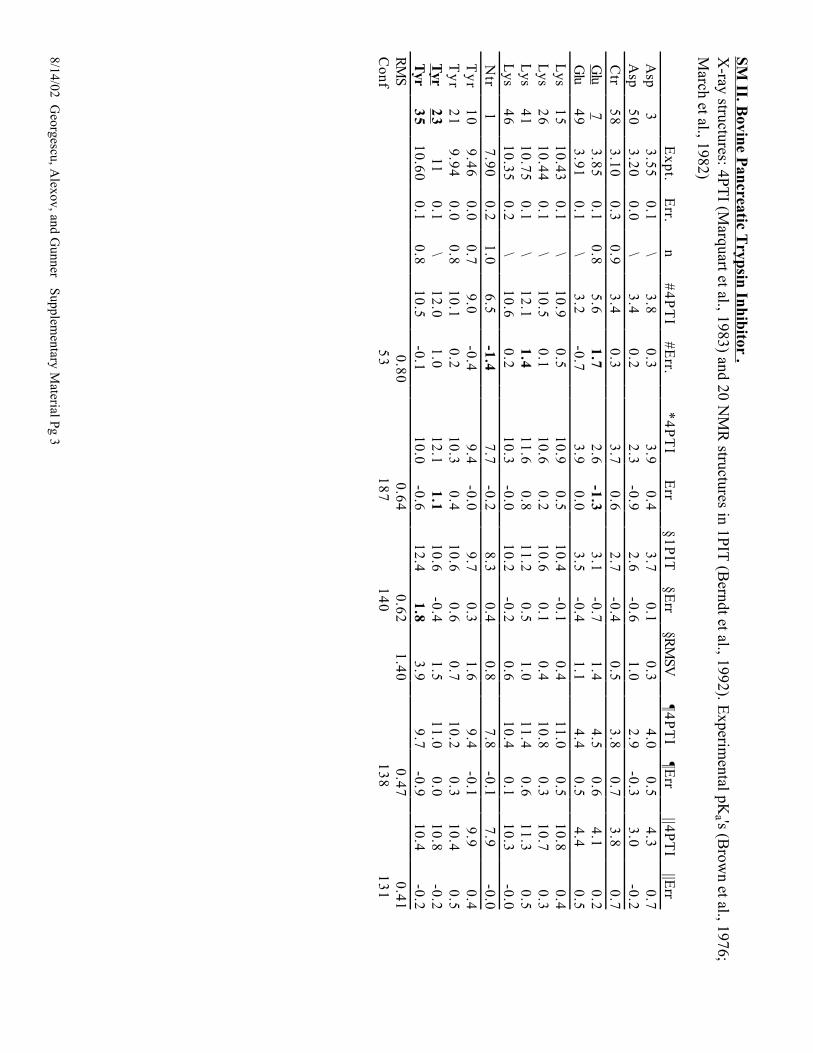
SM II. B
ovine Pancreatic T
rypsin Inhibitor . X
-ray structures: 4PTI (M
arquart et al., 1983) and 20 NM
R structures in 1PIT
(Berndt et al., 1992). E
xperimental pK
a 's (Brow
n et al., 1976;M
arch et al., 1982)
Expt.
Err.
n#
4P
TI
#Err.
*4
PT
IE
rr§1P
IT§E
rr§R
MSV
¶4P
TI
¶Err
||4PT
I||E
rrA
sp3
3.550.1
\3.8
0.33.9
0.43.7
0.10.3
4.00.5
4.30.7
Asp
50
3.200.0
\3.4
0.22.3
-0.92.6
-0.61.0
2.9-0.3
3.0-0.2
Ctr
58
3.100.3
0.93.4
0.33.7
0.62.7
-0.40.5
3.80.7
3.80.7
Glu
73.85
0.10.8
5.61.7
2.6-1.3
3.1-0.7
1.44.5
0.64.1
0.2G
lu4
93.91
0.1\
3.2-0.7
3.90.0
3.5-0.4
1.14.4
0.54.4
0.5L
ys1
510.43
0.1\
10.90.5
10.90.5
10.4-0.1
0.411.0
0.510.8
0.4L
ys2
610.44
0.1\
10.50.1
10.60.2
10.60.1
0.410.8
0.310.7
0.3L
ys4
110.75
0.1\
12.11.4
11.60.8
11.20.5
1.011.4
0.611.3
0.5L
ys4
610.35
0.2\
10.60.2
10.3-0.0
10.2-0.2
0.610.4
0.110.3
-0.0N
tr1
7.900.2
1.06.5
-1.47.7
-0.28.3
0.40.8
7.8-0.1
7.9-0.0
Ty
r1
09.46
0.00.7
9.0-0.4
9.4-0.0
9.70.3
1.69.4
-0.19.9
0.4T
yr
21
9.940.0
0.810.1
0.210.3
0.410.6
0.60.7
10.20.3
10.40.5
Tyr
23
110.1
\12.0
1.012.1
1.110.6
-0.41.5
11.00.0
10.8-0.2
Tyr
35
10.600.1
0.810.5
-0.110.0
-0.612.4
1.83.9
9.7-0.9
10.4-0.2
RM
S0.80
0.640.62
1.400.47
0.41C
onf5
31
87
14
01
38
13
1

8/14/02 Georgescu, A
lexov, and Gunner Supplem
entary Material Pg 4
SM-III. Intestinal B
ovine Calcium
-Binding P
rotein (CabD
).X
-ray structure: 3ICB
(Szebenyi and Moffat, 1986) and the 24 N
MR
structures in 1CD
N (A
kke et al., 1995) have calcium bound (holo-enzym
e).T
he 33 NM
R structures in 1C
LB
(Skelton et al., 1995) do not (apo-form). E
xperimental pK
a 's (Kesvatera et al., 1996; 1999). T
he reported errorof experim
ental pKa values is less than 0.08.
pKa
pKa
n3IC
BE
rr*3IC
BE
rr§1C
DN
§Err
§RM
SV§1C
LB
§Err
§RM
SV¶3IC
B¶E
rr||3IC
B||E
rrC
a+
2+
–+
++
–+
+A
sp4
73.00
0.72.9
-0.10.7
Ctr
75
3.201.1
4.61.4
1.8G
lu4
3.800.8
3.5-0.3
0.7G
lu5
3.400.8
3.1-0.3
1.2G
lu1
14.70
0.74.9
0.20.8
Glu
17
3.620.6
4.10.5
2.9G
lu2
64.10
0.92.7
-1.41.8
Glu
48
4.600.6
4.4-0.2
0.9G
lu6
43.80
0.84.3
0.50.7
Lys
110.60
10.600.7
11.00.4
10.80.2
11.30.7
1.39.7
-0.92.2
11.50.9
11.81.2
Lys
711.35
11.390.9
10.9-0.4
10.7-0.7
11.50.2
1.010.9
-0.51.0
11.40.1
11.80.5
Lys
12
10.8211.06
0.710.9
0.110.8
-0.011.2
0.30.5
10.9-0.1
0.511.3
0.411.8
0.9L
ys1
610.09
10.070.7
11.11.0
10.60.5
10.10.0
2.211.2
1.12.2
11.00.9
11.51.4
Lys
25
11.8111.69
0.913.3
1.413.4
1.512.2
0.40.9
11.5-0.1
0.712.7
0.912.7
0.9L
ys2
910.97
11.370.8
9.5-1.5
10.4-0.5
10.5-0.4
1.310.2
-1.21.6
11.00.0
11.30.3
Lys
41
10.8910.93
0.810.9
0.010.9
0.010.8
-0.10.9
10.6-0.3
0.910.9
0.011.0
0.1L
ys5
511.38
12.120.9
10.2-1.2
11.60.2
12.41.0
1.111.7
-0.40.8
11.3-0.0
12.20.9
Lys
71
10.7210.73
0.810.1
-0.69.9
-0.811.1
0.40.7
10.2-0.5
1.310.4
-0.310.7
0.0L
ys7
210.96
11.330.8
10.8-0.2
10.5-0.5
11.20.2
0.910.7
-0.71.3
10.9-0.0
11.30.3
RM
S0.87
0.660.47
1.170.71
1.270.38
0.59C
onf7
22
73
33
62
37
17
51
46
8/14/02 Georgescu, A
lexov, and Gunner Supplem
entary Material Pg 5
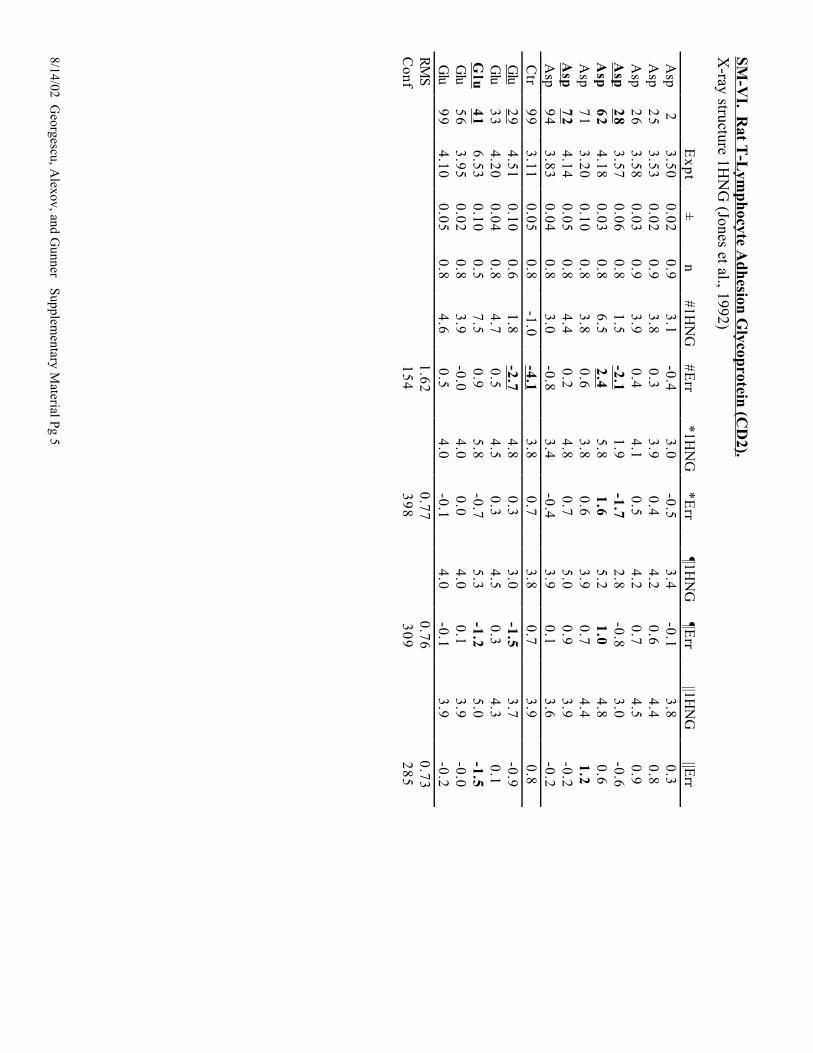
SM-V
I. Rat T
-Lym
phocyte Adhesion G
lycoprotein (CD
2).X
-ray structure 1HN
G (Jones et al., 1992)
Ex
pt
±n
#1HN
G#E
rr*1H
NG
*Err
¶1HN
G¶E
rr||1H
NG
||Err
Asp
23.50
0.020.9
3.1-0.4
3.0-0.5
3.4-0.1
3.80.3
Asp
25
3.530.02
0.93.8
0.33.9
0.44.2
0.64.4
0.8A
sp2
63.58
0.030.9
3.90.4
4.10.5
4.20.7
4.50.9
Asp
28
3.570.06
0.81.5
-2.11.9
-1.72.8
-0.83.0
-0.6A
sp6
24.18
0.030.8
6.52.4
5.81.6
5.21.0
4.80.6
Asp
71
3.200.10
0.83.8
0.63.8
0.63.9
0.74.4
1.2A
sp7
24.14
0.050.8
4.40.2
4.80.7
5.00.9
3.9-0.2
Asp
94
3.830.04
0.83.0
-0.83.4
-0.43.9
0.13.6
-0.2C
tr9
93.11
0.050.8
-1.0-4.1
3.80.7
3.80.7
3.90.8
Glu
29
4.510.10
0.61.8
-2.74.8
0.33.0
-1.53.7
-0.9G
lu3
34.20
0.040.8
4.70.5
4.50.3
4.50.3
4.30.1
Glu
41
6.530.10
0.57.5
0.95.8
-0.75.3
-1.25.0
-1.5G
lu5
63.95
0.020.8
3.9-0.0
4.00.0
4.00.1
3.9-0.0
Glu
99
4.100.05
0.84.6
0.54.0
-0.14.0
-0.13.9
-0.2R
MS
1.620.77
0.760.73
Conf
15
43
98
30
92
85

8/14/02 Georgescu, A
lexov, and Gunner Supplem
entary Material Pg 6
SM-V
. Hen E
gg-White L
ysozyme (H
EW
L).
X-ray structures: 1B
0D (V
aney et al., 1996); 2LZ
T (R
amanadham
et al., 1981), 1HE
L (W
ilson et al., 1992). NM
R structure 1E
8L (Schw
albe etal., 2001). E
xperimental data (K
uramitsu and H
amaguchi, 1980; B
artik et al., 1994). SCC
E colum
ns show only errors of calculated p
Ka 's for
2LZ
T and 1B
0D.
Ex
pt
±n
#2
LZ
Terr
#1BO
Derr.
*1BO
DE
rr2
LZ
TE
rr2H
EL
Err
§1E8L
§Err
§RM
SV¶2L
ZT
¶Err
||2LZ
T||E
rr
Asp
18
2.660.1
0.8-0.1
0.33.0
0.42.8
0.22.2
-0.53.6
0.90.5
3.61.0
3.50.8
Asp
48
1.600.4
\-0.7
2.10.6
-1.01.7
0.1-0.2
-1.83.2
1.60.2
2.61.0
4.12.5
Asp
52
3.680.1
0.8-3.4
-4.13.9
0.23.0
-0.74.6
0.93.8
0.12.5
4.50.9
3.5-0.2
Asp
66
0.900.5
\1.9
1.91.5
0.62.6
1.71.8
0.92.7
1.80.8
1.40.5
1.91.0
Asp
87
2.070.2
\0.7
3.11.0
-1.11.2
-0.91.2
-0.91.7
-0.30.3
2.70.6
3.51.5
Asp
10
14.08
0.1\
-4.70.5
3.8-0.3
5.11.0
4.30.2
4.10.0
0.24.2
0.14.1
0.1A
sp1
19
3.200.1
\-0.1
-0.34.1
0.92.4
-0.83.8
0.63.3
0.10.4
4.41.2
3.70.5
Ctr
12
92.75
0.1\
-3.80.8
2.4-0.4
2.6-0.1
3.00.2
2.5-0.3
0.62.5
-0.23.0
0.2G
lu7
2.850.3
\1.0
2.43.5
0.62.2
-0.62.2
-0.63.3
0.50.2
3.10.2
3.50.7
Glu
35
6.200.1
\0.8
1.36.2
0.06.2
-0.06.6
0.46.8
0.66.8
5.7-0.5
4.8-1.4
His
15
5.360.1
\-1.5
-1.86.5
1.16.4
1.06.8
1.55.8
0.50.3
5.70.3
5.50.1
Lys
110.80
0.1\
0.8-1.7
10.3-0.5
9.8-1.0
10.2-0.6
10.3-0.5
1.012.1
1.310.3
-0.5L
ys1
310.50
0.1\
3.8-0.9
11.20.7
10.80.3
10.70.2
10.90.4
0.411.2
0.711.2
0.7L
ys3
310.40
0.1\
1.91.3
9.8-0.6
8.9-1.5
9.5-0.9
9.1-1.3
1.410.3
-0.110.2
-0.2L
ys9
610.80
0.1\
0.7-1.4
11.30.5
11.91.1
11.81.0
10.80.0
0.812.2
1.411.5
0.7L
ys9
710.30
0.1\
1.0-0.6
10.50.2
11.10.8
10.80.5
10.60.3
0.710.8
0.511.4
1.1L
ys1
16
10.200.1
\0.2
1.510.0
-0.29.5
-0.79.4
-0.89.8
-0.40.7
10.50.3
10.40.2
Ty
r2
010.30
0.1\
-1.81.3
9.7-0.6
11.10.8
9.6-0.7
9.7-0.6
1.09.5
-0.810.4
0.1T
yr
23
9.800.1
\-0.8
0.59.3
-0.59.3
-0.59.7
-0.19.3
-0.50.7
9.6-0.2
9.90.1
RM
S2.05
1.740.63
0.860.81
0.731.77
0.740.90
Conf
10
44
51
46
64
43
25
33
31
28
8
8/14/02 Georgescu, A
lexov, and Gunner Supplem
entary Material Pg 7
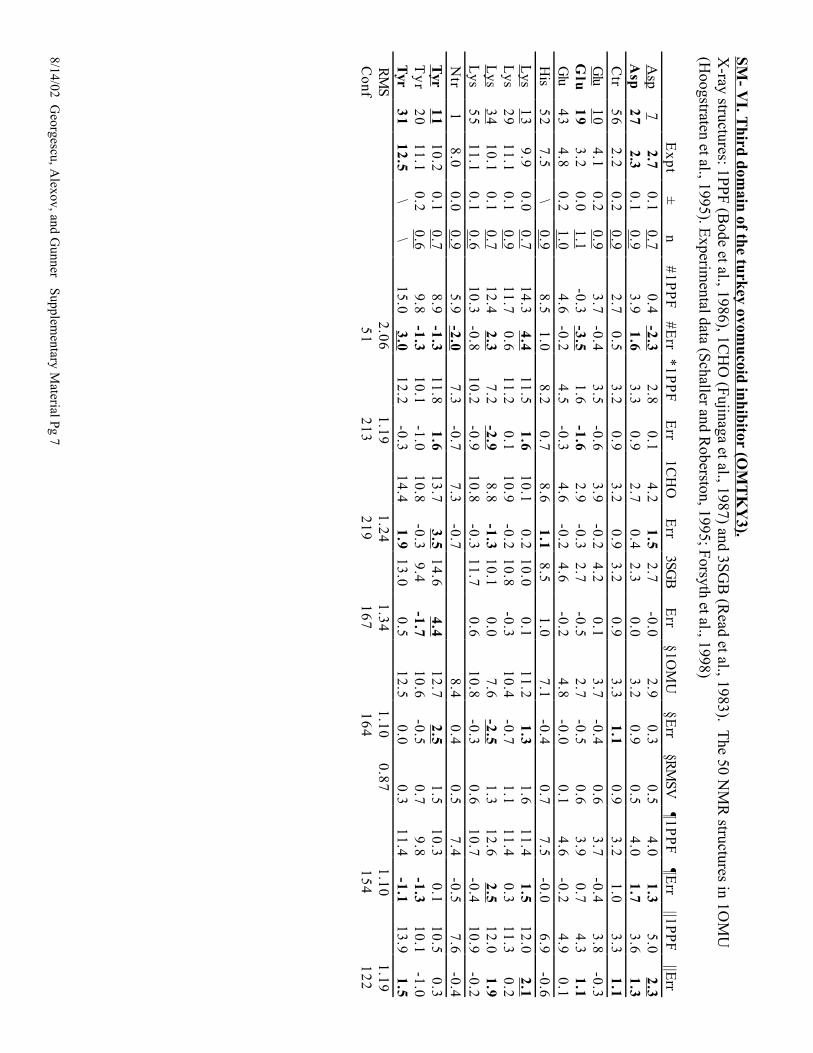
SM- V
I. Third dom
ain of the turkey ovomucoid inhibitor (O
MT
KY
3).X
-ray structures: 1PPF (Bode et al., 1986), 1C
HO
(Fujinaga et al., 1987) and 3SGB
(Read et al., 1983). T
he 50 NM
R structures in 1O
MU
(Hoogstraten et al., 1995). E
xperimental data (Schaller and R
oberston, 1995; Forsyth et al., 1998)
Ex
pt
±n
#1PP
F#E
rr*1P
PF
Err
1CH
OE
rr3SG
BE
rr§1O
MU
§Err
§RM
SV¶1P
PF
¶Err
||1PP
F||E
rrA
sp7
2.70.1
0.70.4
-2.32.8
0.14.2
1.52.7
-0.02.9
0.30.5
4.01.3
5.02.3
Asp
27
2.30.1
0.93.9
1.63.3
0.92.7
0.42.3
0.03.2
0.90.5
4.01.7
3.61.3
Ctr
56
2.20.2
0.92.7
0.53.2
0.93.2
0.93.2
0.93.3
1.10.9
3.21.0
3.31.1
Glu
10
4.10.2
0.93.7
-0.43.5
-0.63.9
-0.24.2
0.13.7
-0.40.6
3.7-0.4
3.8-0.3
Glu
19
3.20.0
1.1-0.3
-3.51.6
-1.62.9
-0.32.7
-0.52.7
-0.50.6
3.90.7
4.31.1
Glu
43
4.80.2
1.04.6
-0.24.5
-0.34.6
-0.24.6
-0.24.8
-0.00.1
4.6-0.2
4.90.1
His
52
7.5\
0.98.5
1.08.2
0.78.6
1.18.5
1.07.1
-0.40.7
7.5-0.0
6.9-0.6
Lys
13
9.90.0
0.714.3
4.411.5
1.610.1
0.210.0
0.111.2
1.31.6
11.41.5
12.02.1
Lys
29
11.10.1
0.911.7
0.611.2
0.110.9
-0.210.8
-0.310.4
-0.71.1
11.40.3
11.30.2
Lys
34
10.10.1
0.712.4
2.37.2
-2.98.8
-1.310.1
0.07.6
-2.51.3
12.62.5
12.01.9
Lys
55
11.10.1
0.610.3
-0.810.2
-0.910.8
-0.311.7
0.610.8
-0.30.6
10.7-0.4
10.9-0.2
Ntr
18.0
0.00.9
5.9-2.0
7.3-0.7
7.3-0.7
8.40.4
0.57.4
-0.57.6
-0.4T
yr1
110.2
0.10.7
8.9-1.3
11.81.6
13.73.5
14.64.4
12.72.5
1.510.3
0.110.5
0.3T
yr
20
11.10.2
0.69.8
-1.310.1
-1.010.8
-0.39.4
-1.710.6
-0.50.7
9.8-1.3
10.1-1.0
Tyr
31
12.5\
\15.0
3.012.2
-0.314.4
1.913.0
0.512.5
0.00.3
11.4-1.1
13.91.5
RM
S2.06
1.191.24
1.341.10
0.871.10
1.19C
onf5
12
13
21
91
67
16
41
54
12
2

8/14/02 Georgescu, A
lexov, and Gunner Supplem
entary Material Pg 8
SM-V
II. B1 im
munoglobulin-binding dom
ain of streptococcal protein G.
X-ray structures 1PG
A (G
allagher et al., 1994), 60 NM
R structures in 1G
BL
(Gronenborn et al., 1991). E
xperimental pK
a 's (Khare et al., 1997).
Estim
ated n-values are all in the range 0.9 - 1.
Ex
pt
±#1P
GA
#Err
*1PG
A*E
rr§1G
BL
§Err
§RM
SV1P
GA
Err
||1PGA
||Err
Asp
22
2.90.1
0.5-2.4
2.2-0.7
2.6-0.3
1.03.1
0.23.7
0.8A
sp3
63.8
0.15.3
1.55.0
1.24.7
0.90.7
5.21.4
5.01.2
Asp
40
4.00.2
4.50.5
4.10.1
5.41.4
0.94.7
0.75.0
1.0A
sp4
63.6
0.11.6
-2.03.1
-0.53.7
0.10.3
4.20.6
4.40.8
Asp
47
3.40.3
0.3-3.2
2.3-1.1
4.41.0
0.23.0
-0.43.2
-0.2C
tr5
64.0
0.13.0
-1.03.3
-0.74.3
0.30.9
3.5-0.5
3.7-0.4
Glu
56
4.00.1
3.9-0.1
5.31.3
6.82.8
0.84.9
0.94.7
0.7G
lu1
54.4
0.11.7
-2.73.8
-0.64.3
-0.10.6
3.8-0.6
4.1-0.3
Glu
19
3.70.2
2.7-1.0
3.5-0.2
4.20.5
0.23.9
0.24.0
0.3G
lu2
74.5
0.1-0.5
-5.03.8
-0.74.5
0.00.2
3.9-0.6
3.3-1.2
Glu
42
4.40.1
5.00.6
5.10.7
5.00.6
0.55.0
0.65.2
0.8L
ys1
011.0
\11.9
0.911.4
0.411.1
0.10.4
11.20.2
11.50.5
Lys
13
11.0\
11.0-0.0
10.8-0.2
10.8-0.2
0.611.0
-0.011.5
0.5L
ys2
810.9
\13.4
2.511.7
0.810.2
-0.70.7
11.80.9
12.01.1
Tyr
33
11.0\
10.7-0.3
10.8-0.2
10.3-0.7
0.210.5
-0.510.9
-0.1R
MS
2.130.67
0.650.60
0.630.75
Conf
55
24
02
02
14
31
07

8/14/02 Georgescu, A
lexov, and Gunner Supplem
entary Material Pg 9
SM-V
III Ribonuclease A
(RN
ase A).
X-ray structures 3R
N3 (H
owlin et al., 1989), 7R
SA (W
lodawer et al., 1988) and the 32 N
MR
structures in 2A
AS (Santoro et al., 1993).
Experim
ental values (Antosiew
icz et al., 1996). His p
Ka values
averages experim
ental data
(Ruterjans
and W
itzel, 1969;
Matthew
s and
Westm
oreland, 1973; Walters and A
llerhand, 1980). Only the pK
a 's of His 12 and 19 are effected by added PO
4 . +: w
ith PO4 . E
xperimental values
from (M
eadows et al., 1969; C
ohen et al., 1973).C
alculations had PO4 dynam
ically equilibrated with the protein during M
onte Carlo sam
pling. –: no PO4 .
Ex
pt
±#3R
N3
#Err.
*3RN
3*E
rr.7R
SAE
rr.§2A
AS
§Err
§RM
SV¶3R
N3
¶Err.
3RN
3E
rr.P
O4
++
+–
++
Asp
14
20.2
-1.0-3.0
0.6-1.4
0.6-1.4
4.92.9
5.51.3
-0.72.8
0.8A
sp3
83.1
0.23.0
-0.13.0
-0.11.7
-1.43.1
0.00.4
3.60.5
3.80.7
Asp
53
3.90.2
3.4-0.5
3.7-0.2
3.4-0.5
4.00.1
1.24.3
0.44.3
0.4A
sp8
33.5
0.26.3
2.83.8
0.33.2
-0.32.7
-0.81.2
3.60.1
3.1-0.4
Asp
1213.1
0.2-1.0
-4.13.2
0.10.5
-2.62.2
-0.91.4
2.7-0.4
3.0-0.1
Ctr
12
42.4
0.2-0.0
-2.41.3
-1.10.9
-1.51.6
-0.81.0
1.7-0.7
2.2-0.2
Glu
22.8
0.2-0.6
-3.41.3
-1.55.6
2.82.4
-0.41.5
2.80.0
3.20.4
Glu
94
0.25.8
1.85.4
1.45.5
1.55.1
1.11.2
5.01.0
4.60.6
Glu
49
4.70.2
5.71.0
5.50.8
5.71.0
7.52.8
2.95.3
0.65.0
0.3G
lu8
64.1
0.24.4
0.34.2
0.15.7
1.64.6
0.50.9
4.80.7
4.50.4
Glu
11
13.5
0.24.4
0.93.9
0.44.3
0.84.8
1.31.6
4.10.6
4.20.7
His
12-5.8
0.05-1.0
-6.84.2
-1.64.2
-1.64.7
-1.12.0
12+7
6.7-0.3
6.7-0.3
6.9-0.1
His
48
6.30.1
3.1-3.2
8.82.5
7.51.2
4.7-1.6
4.48.0
1.76.7
0.4H
is1
05
6.60.15
6.1-0.5
5.9-0.7
6.1-0.5
6.2-0.4
0.46.4
-0.26.3
-0.3H
is119-
6.10.1
6.70.6
5.4-0.7
6.10.0
5.4-0.7
1.2119+
7.16.0
-1.16.7
-0.46.7
-0.3N
tr1
7.60.15
6.0-1.6
7.4-0.2
8.71.1
8.00.4
0.77.5
-0.17.5
-0.1R
MS
2.690.98
1.441.28
2.210.66
0.44C
onf1
23
40
64
22
35
63
50
28
5

8/14/02 Georgescu, A
lexov, and Gunner Supplem
entary Material Pg 10
SM IX
. Ribonuclease H
i (RN
ase H).
X-ray structure: 2R
N2 (K
atayanagi et al., 1992), 1RN
H (Y
ang et al., 1990), and 1RD
D (K
atayanagi et al., 1993) and 8 NM
R structures in 1R
CH
(Yam
azaki et al., 1997). The experim
ental pK
a 's (in presence or absence of Mg
+2) are from
(Oda et al., 1993; O
da et al., 1994). Experim
entalvalues that differ by m
ore than 0.2 pH units are bold; N
o pKa 's w
ith Mg
+2 are reported for H
is. The reported errors assum
e that these pK
a 's areindependent of added ion. The pK
a 's of Asp 10 are not included in the R
MS calculations. 1R
NH
does not contain coordinates for residues 1-3 and153 through the C
-terminal 155.
Ex
pt
Ex
pt
±#2R
N2
#Err.
*2RN
2*E
rr.1R
NH
Err
1RD
DE
rr.§1rch
§Err
§RM
SV¶2R
N2
¶Err.
||2RN
2||E
rr.M
g+
2–
+–
––
+–
––
Asp
10
6.14.2
10.94.8
10.44.3
15.49.3
8.74.5
14
7.93.1
8.72.6
6.40.3
Asp
70
2.63.4
0.62.4
-0.22.3
-0.33.2
0.62.4
-1.04.0
1.41.1
3.61.0
3.91.3
Asp
94
3.23.3
111.9
8.73.8
0.63.4
0.21.4
-1.93.6
0.40.6
3.60.4
3.70.5
Asp
102 2.0
2.0\
-1.0-3.0
2.0-0.0
1.4-0.6
1.6-0.4
2.30.3
0.51.8
-0.2-0.5
-2.5A
sp1
08
3.23.5
0.91.7
-1.52.0
-1.22.0
-1.24.8
1.34.4
1.21.0
3.1-0.1
3.0-0.2
Asp
13
44.1
4.20.8
1.0-3.1
2.2-1.9
4.40.3
3.8-0.4
4.20.1
0.52.7
-1.43.3
-0.8A
sp148
2.0 2.0
\6.9
4.91.1
-0.93.9
1.9-1.0
-3.04.4
2.33.6
-0.5-2.5
1.3-0.7
Ctr
15
53.4
3.50.8
3.70.3
2.7-0.7
2.2-1.3
2.4-1.0
1.73.7
0.33.4
0.0G
lu6
4.54.5
0.94.1
-0.46.3
1.84.3
-0.25.7
1.25.4
0.91.1
5.10.6
3.9-0.6
Glu
32
3.63.6
0.731.3
-2.32.1
-1.51.6
-2.01.5
-2.13.3
-0.30.5
2.5-1.1
3.5-0.1
Glu
48
4.44.4
0.755.3
0.95.5
1.16.4
2.05.2
0.85.1
0.72.9
5.61.2
4.70.3
Glu
57
3.23.4
11.7
-1.52.5
-0.82.0
-1.22.6
-0.84.5
1.31.5
3.0-0.2
3.30.1
Glu
61
3.94.0
0.91.7
-2.22.9
-1.03.5
-0.40.5
-3.53.5
-0.40.7
3.3-0.6
3.2-0.7
Glu
64
4.44.5
0.94.6
0.24.3
-0.12.9
-1.54.8
0.35.3
0.91.7
4.4-0.0
4.3-0.1
Glu
1194.1
4.30.75
-0.4-4.5
3.1-1.0
4.40.3
5.81.5
5.31.2
1.43.3
-0.83.9
-0.2G
lu129
3.64.0
0.70.0
-3.62.8
-0.82.9
-0.72.5
-1.52.2
-1.41.7
3.2-0.4
3.0-0.6
Glu
13
14.3
4.40.85
5.10.8
5.00.7
3.4-0.9
5.51.1
5.31.0
1.25.0
0.74.8
0.5G
lu1
35
4.34.3
0.94.3
-0.04.3
0.03.5
-0.84.4
0.14.3
-0.00.3
4.60.3
4.60.3
Glu
14
74.2
4.21
4.30.1
4.40.2
4.90.7
4.50.3
4.2-0.0
0.54.7
0.54.7
0.5G
lu1
54
4.44.4
12.6
-1.83.8
-0.66.7
2.34.8
0.40.6
4.0-0.4
4.60.2
His
62
7.00.9
5.7-1.3
6.7-0.3
6.5-0.5
6.4-0.6
6.1-0.9
1.06.6
-0.46.5
-0.5H
is8
35.5
15.4
-0.15.4
-0.14.8
-0.75.8
0.35.4
-0.10.4
5.50.0
5.60.1
His
11
4 5.0
0.94.2
-0.84.5
-0.64.2
-0.85.3
0.32.8
-2.23.1
4.8-0.2
5.70.7
His
12
47.1
0.854.5
-2.64.5
-2.68.7
1.64.9
-2.24.7
-2.42.5
5.2-1.9
5.7-1.4
His
12
77.9
0.98.1
0.27.0
-0.98.7
0.88.8
0.96.5
-1.41.7
7.3-0.6
7.7-0.2
RM
S2.75
1.041.06
1.491.15
1.600.87
0.77C
onf1
33
51
24
56
36
53
96
26
8
8/14/02 Georgescu, A
lexov, and Gunner Supplem
entary Material Pg 11
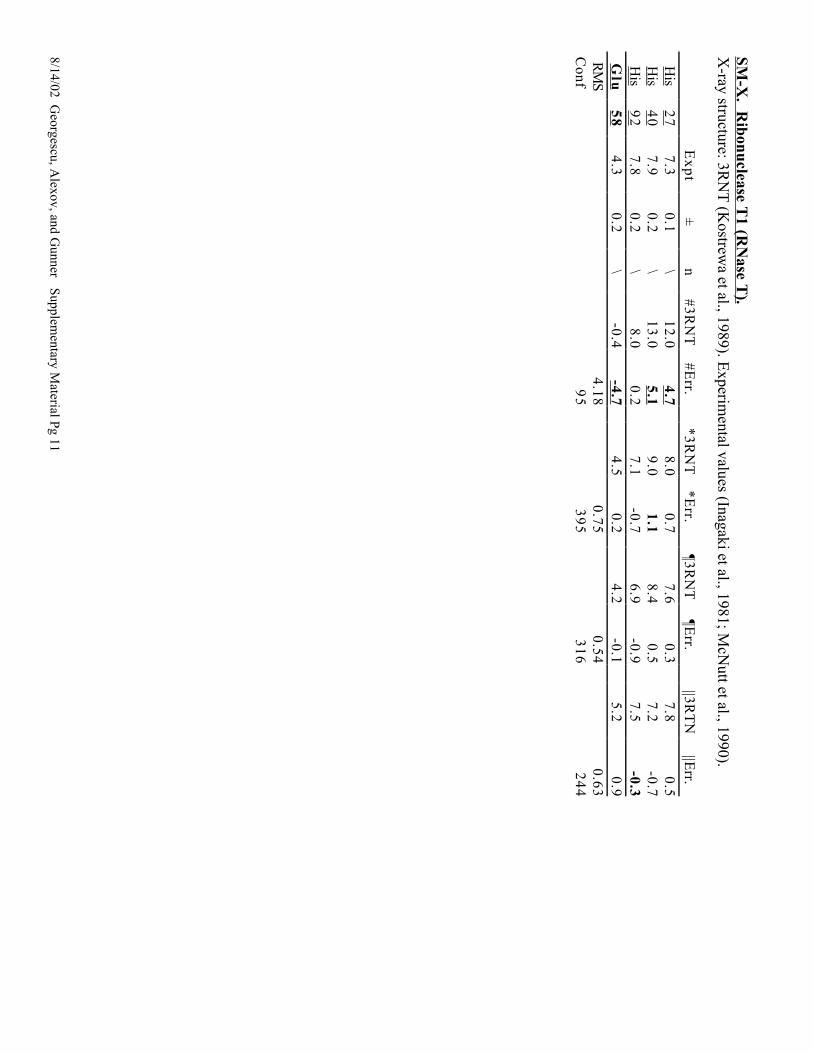
SM-X
. Ribonuclease T
1 (RN
ase T).
X-ray structure: 3R
NT
(Kostrew
a et al., 1989). Experim
ental values (Inagaki et al., 1981; McN
utt et al., 1990).
Ex
pt
±n
#3RN
T#E
rr.*3R
NT
*Err.
¶3RN
T¶E
rr.||3R
TN
||Err.
His
27
7.30.1
\12.0
4.78.0
0.77.6
0.37.8
0.5H
is4
07.9
0.2\
13.05.1
9.01.1
8.40.5
7.2-0.7
His
92
7.80.2
\8.0
0.27.1
-0.76.9
-0.97.5
-0.3G
lu5
84.3
0.2\
-0.4-4.7
4.50.2
4.2-0.1
5.20.9
RM
S4.18
0.750.54
0.63C
onf9
53
95
31
62
44
8/14/02 Georgescu, A
lexov, and Gunner Supplem
entary Material Pg 12
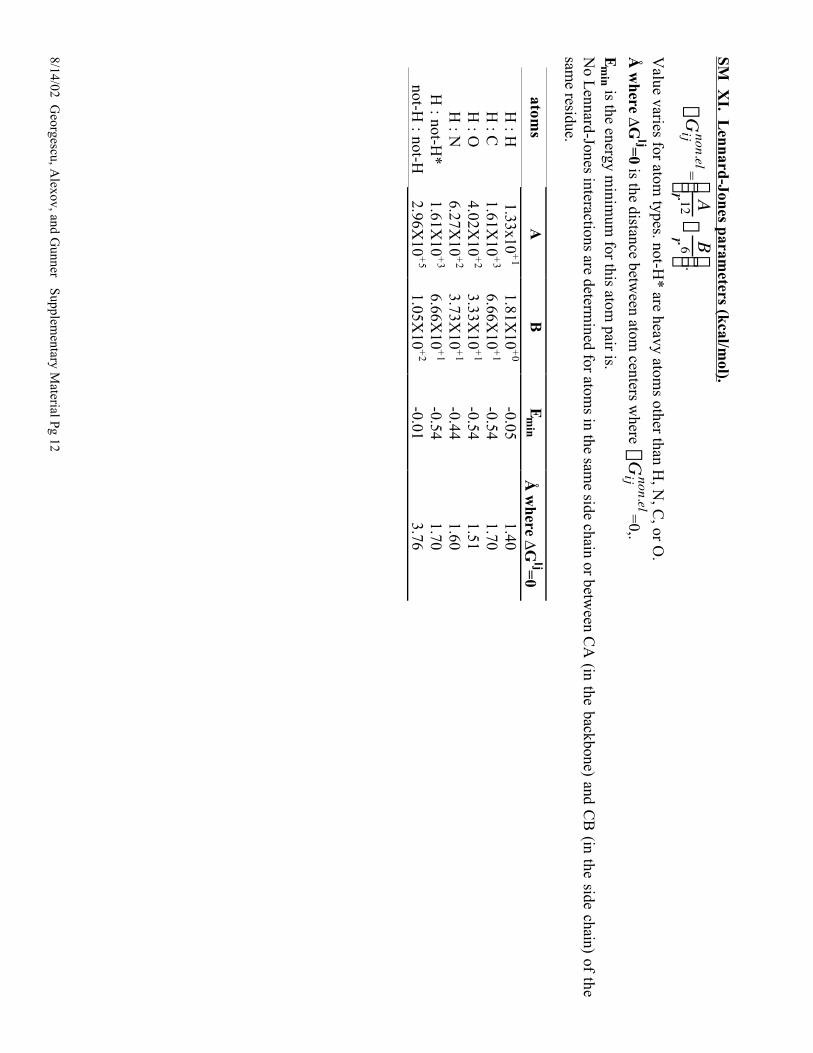
SM X
I. Lennard-Jones param
eters (kcal/mol).
DGij non.el=
Ar 12-
Br6
Ê Ë Á ˆ ¯ ˜ .
Value varies for atom
types. not-H* are heavy atom
s other than H, N
, C, or O
.
Å w
here ∆G
lj=0 is the distance betw
een atom centers w
here DGij non.el=
0,.
Em
in is the energy minim
um for this atom
pair is. N
o Lennard-Jones interactions are determ
ined for atoms in the sam
e side chain or between C
A (in the backbone) and C
B (in the side chain) of the
same residue.
atoms
AB
Em
inÅ
where ∆
Glj=
0H
: H1.33x10
+1
1.81X10
+0
-0.051.40
H : C
1.61X10
+3
6.66X10
+1
-0.541.70
H : O
4.02X10
+2
3.33X10
+1
-0.541.51
H : N
6.27X10
+2
3.73X10
+1
-0.441.60
H : not-H
*1.61X
10+
36.66X
10+
1-0.54
1.70not-H
: not-H2.96X
10+
51.05X
10+
2-0.01
3.76
8/14/02 Georgescu, A
lexov, and Gunner Supplem
entary Material Pg 13
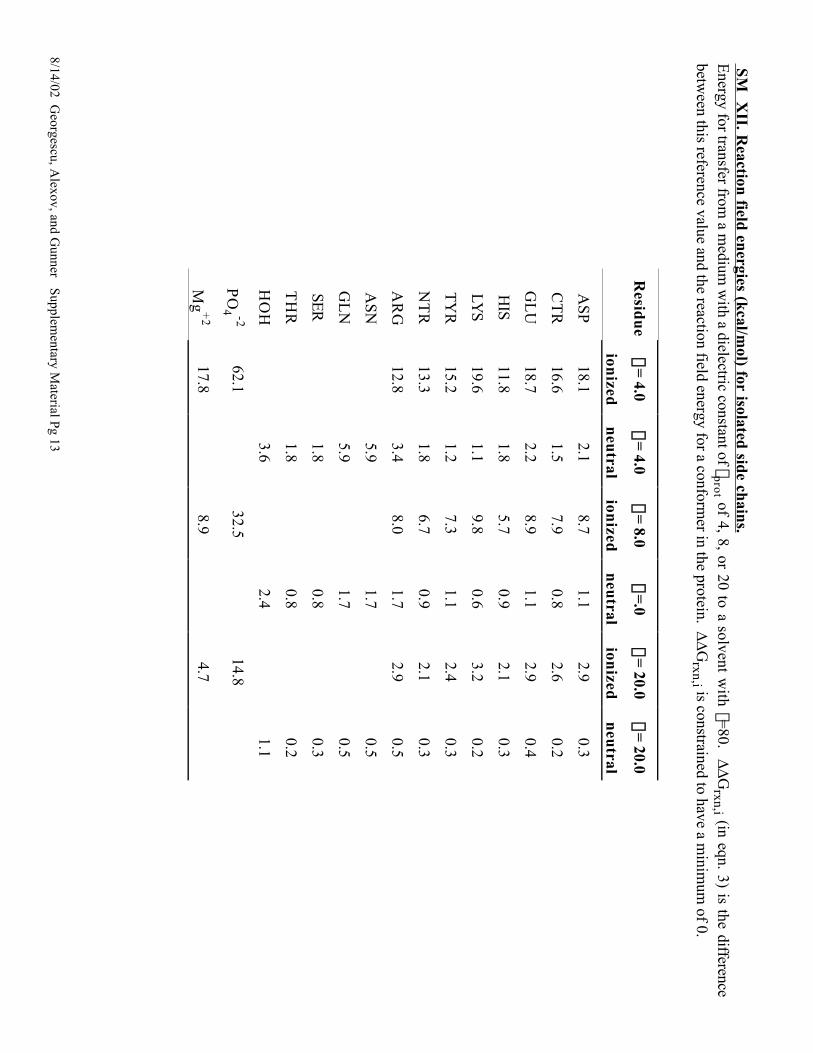
SM X
II. Reaction field energies (kcal/m
ol) for isolated side chains.E
nergy for transfer from a m
edium w
ith a dielectric constant of eprot of 4, 8, or 20 to a solvent w
ith e=80. ∆∆
Grxn,i (in eqn. 3) is the difference
between this reference value and the reaction field energy for a conform
er in the protein. ∆∆
Grxn,i is constrained to have a m
inimum
of 0.
Resid
ue
e = 4.0
ionized
e = 4.0
neu
tral
e = 8.0
ionized
e =.0
neu
tral
e = 20.0
ionized
e = 20.0
neu
tral
ASP
18.12.1
8.71.1
2.90.3
CT
R16.6
1.57.9
0.82.6
0.2
GL
U18.7
2.28.9
1.12.9
0.4
HIS
11.81.8
5.70.9
2.10.3
LYS
19.61.1
9.80.6
3.20.2
TY
R15.2
1.27.3
1.12.4
0.3
NT
R13.3
1.86.7
0.92.1
0.3
AR
G12.8
3.48.0
1.72.9
0.5
ASN
5.91.7
0.5
GL
N5.9
1.70.5
SER
1.80.8
0.3
TH
R1.8
0.80.2
HO
H3.6
2.41.1
PO
4 -262.1
32.514.8
Mg
+2
17.88.9
4.7