sql tuning for developers 101 - new york oracle user...
TRANSCRIPT

Copyright © 2006 Quest Software
NYOUG 2006 PaperMichael R. AultOracle SpecialistQuest Software
SQL Tuning for Developers101

2
Michael R. AultSenior Consultant
- Nuclear Navy 6 years- Nuclear Chemist/Programmer 10 years - Kennedy Western University Graduate- Bachelors Degree Computer Science- Certified in all Oracle Versions Since 6- Oracle DBA, author, 16 years

3
What We Will Discuss
Basic Oracle Tuning Tools
• If you have Oracle you have them• All developers should be aware of them• All developers should be able to use them

4
Why Should Developers Tune?
– DBAs are responsible for tuning…right?– Wrong! Everyone is!– Oracle and third party tools make it easy. (Well,
almost!)

5
Why Everyone?
0
20
40
60
80
100
Design Impl. Prod Maint
CostGain

6
Available Tools
• Explain Plan• Trace, trcasst and TKPROF• DBMS_PROFILER• Events• Statspack and AWR• Database/Grid Control

7
Explain Plan
– Can be used standalone.– Can be enabled at (SQLPLUS) command line. – Most tools provide it.– TKPROF Incorporates it.

8
Explain Plan Command
• EXPLAIN PLAN [SET STATEMENT_ID = 'descriptor']• [INTO table]• FOR SQL statement;• Must also have a PLAN_TABLE:• Can use a central one• Each user can run $ORACLE_HOME/rdbms/admin/utlxplan.sql

9
Explain Plan Example
• SQL> explain plan• 2 set statement_id='EXP PLAN EXAMPLE'• 3 for• 4 select t.owner,t.table_name,t.tablespace_name,• 5 i.index_name,i.tablespace_name• 6 from tkp_example t, tkp_example2 i• 7 where• 8 t.table_name=i.table_name and• 9 t.owner not in ('SYS','SYSTEM')• 10* • Explained.

10
Explain Plan Output
• SQL> column position format 99999999• SQL> column object_name format a12• SQL> column options format a7• SQL> column operation format a15• SQL> select operation, options, object_name, id, parent_id,• 2 position• 3 from plan_table• 4 where statement_id='EXP PLAN EXAMPLE'• 5* order by id

11
Explain Plan Output
• OPERATION OPTIONS OBJECT_NAME ID PARENT_ID POSITION • ---------------- -------- ----------- --- --------- ---------• SELECT STATEMENT 0 • MERGE JOIN 1 0 1 • SORT JOIN 2 1 1 • TABLE ACCESS FULL TKP_EXAMPLE2 3 2 1 • SORT JOIN 4 1 2 • TABLE ACCESS FULL TKP_EXAMPLE 5 4 1 • 6 rows selected
12
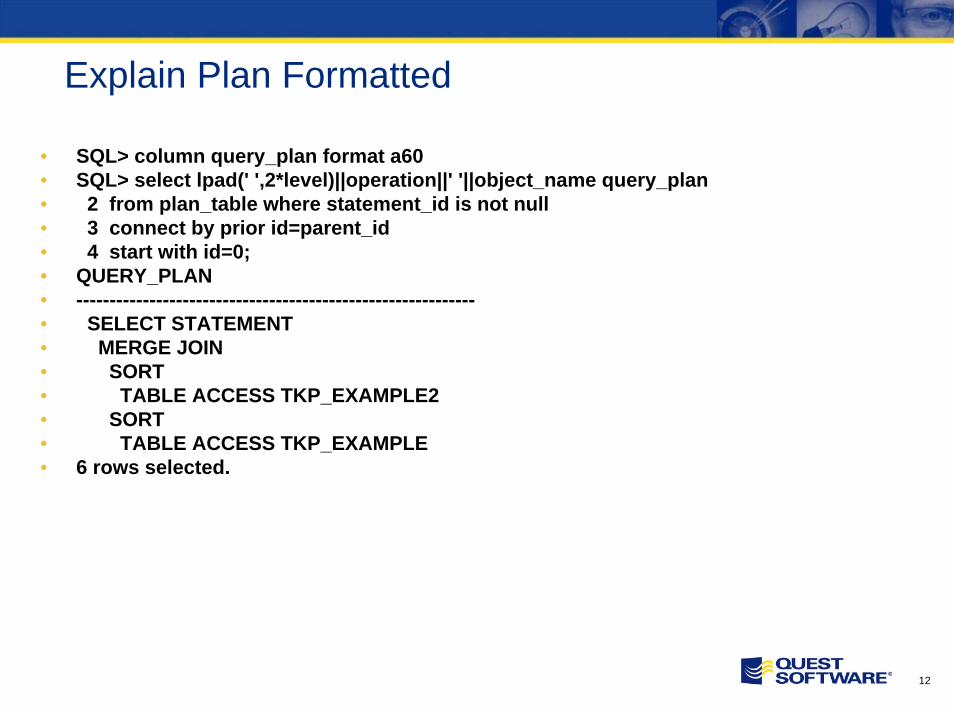
Explain Plan Formatted
• SQL> column query_plan format a60• SQL> select lpad(' ',2*level)||operation||' '||object_name query_plan• 2 from plan_table where statement_id is not null• 3 connect by prior id=parent_id• 4 start with id=0;• QUERY_PLAN • ------------------------------------------------------------• SELECT STATEMENT • MERGE JOIN • SORT • TABLE ACCESS TKP_EXAMPLE2 • SORT • TABLE ACCESS TKP_EXAMPLE • 6 rows selected.
13
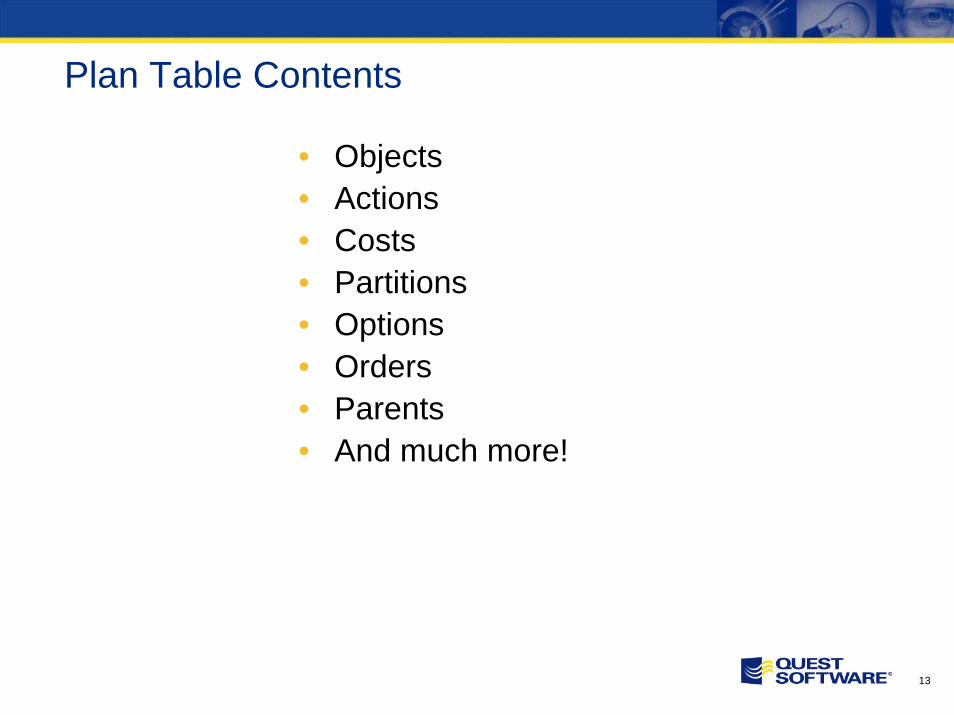
Plan Table Contents
• Objects• Actions• Costs• Partitions• Options• Orders• Parents• And much more!
14
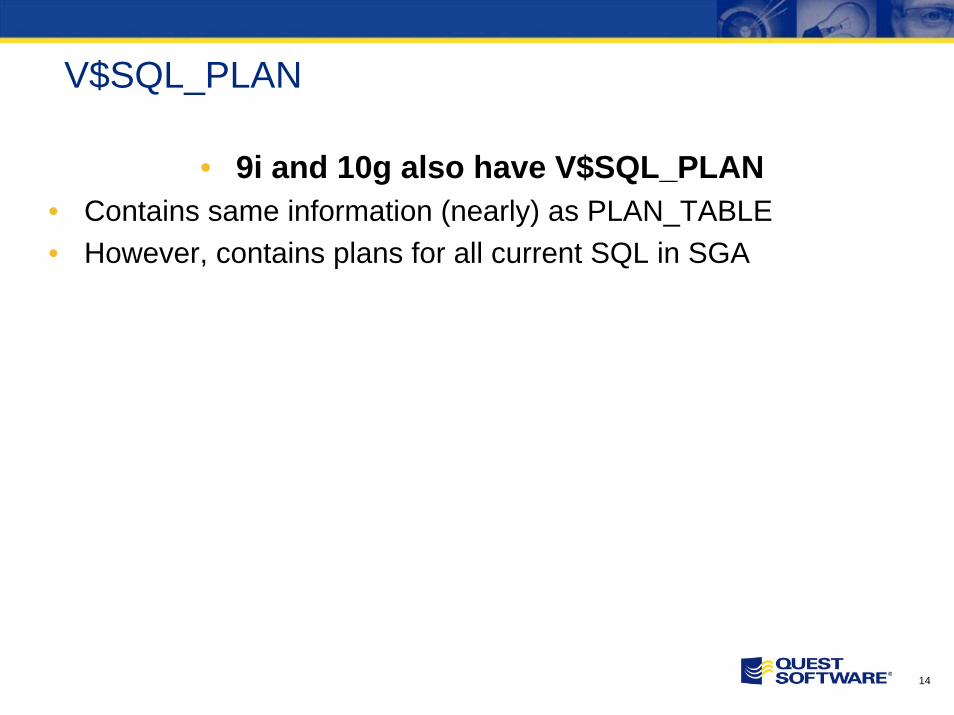
V$SQL_PLAN
• 9i and 10g also have V$SQL_PLAN• Contains same information (nearly) as PLAN_TABLE• However, contains plans for all current SQL in SGA
15
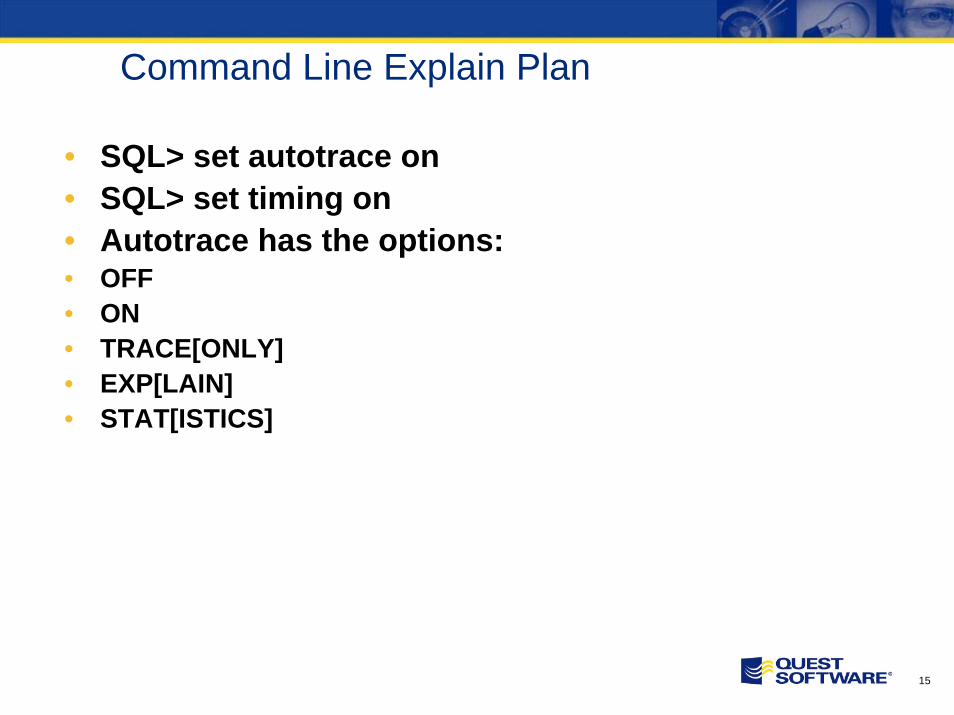
Command Line Explain Plan
• SQL> set autotrace on• SQL> set timing on• Autotrace has the options:• OFF • ON • TRACE[ONLY]• EXP[LAIN]• STAT[ISTICS]

16
DEMO!
• Let’s look at a demonstration!

17
Use of TKPROF to Tune Statements
• Must have run SQL with TRACE enabled• Trace can be enabled at:
– System– Session
• Via:– ALTER SYSTEM|SESSION– Initialization parameters– Special procedures– Event settings
• Example:• ALTER SESSION SET TIMED_STATISTICS=TRUE;• ALTER SESSION SET SQL_TRACE=TRUE;

18
TKPROF and Tracing
• Tracing Forms, Reports• DBMS_SESSION.SET_SQL_TRACE • TIMED_STATISTICS parameter must still be set
manually or via a call using EXECUTE IMMEDIATE on versions prior to Oracle8i
• In Oracle9i:– DBMS_SYSTEM.SET_INT_PARAM_IN_SESSION – Alters the settings of session alterable parameters.

19
TKPROF and Tracing
• Tracing another session• DBMS_SYSTEM.
SET_SQL_TRACE_IN_SESSION • oradebug program• Use system events.

20
Trace Example
• *** SESSION ID:(22.5565) 2005-06-09 13:44:06.977• APPNAME mod='SQL*Plus' mh=3669949024 act=''
ah=4029777240• =====================• PARSING IN CURSOR #1 len=32 dep=0 uid=5 oct=42
lid=5 tim=10854727691 hv=3943786303 ad='1cddf17c'• alter session set sql_trace=true• END OF STMT• EXEC
#1:c=0,e=102,p=0,cr=0,cu=0,mis=0,r=0,dep=0,og=4,tim=10854718587
• =====================• PARSING IN CURSOR #1 len=175 dep=0 uid=5 oct=3
lid=5 tim=10856304813 hv=1541441151 ad='1cede18c'• select a.tablespace_name, b.file_name, a.initial_extent• from• test1 a,• test2 b

21
Trace Example
• where a.tablespace_name=b.tablespace_name• order by a.tablespace_name• END OF STMT• PARSE
#1:c=0,e=2163,p=0,cr=0,cu=0,mis=1,r=0,dep=0,og=4,tim=10856304805• EXEC
#1:c=0,e=85,p=0,cr=0,cu=0,mis=0,r=0,dep=0,og=4,tim=10856310122• FETCH
#1:c=0,e=1039,p=0,cr=6,cu=0,mis=0,r=1,dep=0,og=4,tim=10856311780• FETCH
#1:c=0,e=36,p=0,cr=0,cu=0,mis=0,r=15,dep=0,og=4,tim=10856313026• FETCH
#1:c=0,e=73,p=0,cr=0,cu=0,mis=0,r=4,dep=0,og=4,tim=10856331857• STAT #1 id=1 cnt=20 pid=0 pos=1 obj=0 op='SORT ORDER BY '• STAT #1 id=2 cnt=20 pid=1 pos=1 obj=0 op='HASH JOIN '• STAT #1 id=3 cnt=20 pid=2 pos=1 obj=37981 op='TABLE ACCESS FULL
OBJ#(37981) '• STAT #1 id=4 cnt=20 pid=2 pos=2 obj=37982 op='TABLE ACCESS FULL
OBJ#(37982) '

22
Trace Example
• Good data• Not very readable• This is where TKPROF comes in

23
TKPROF Command
• tkprof tracefile outputfile [explain= ] [table= ][print= ] [insert= ] [sys= ] [sort= ]
• table=schema.tablename Use 'schema.tablename' with 'explain=' option.
• explain=user/password Connect to ORACLE and issue EXPLAIN PLAN.
• print=integer List only the first 'integer' SQL statements.• aggregate=yes|no• insert=filename List SQL statements and data inside INSERT
statements.• sys=no TKPROF does not list SQL statements run as user SYS.• record=filename Record non-recursive statements found in the trace file.• waits=yes|no Record summary for any wait events found in the trace
file.• sort=option Set of zero or more of the sort options.

24
DEMO!
• Let’s look at a demonstration!

25
DBMS_PROFILER
– Like statspack only for PL/SQL– Traces each line executed for timings and number of times
executed– Must be built using PROFLOAD.SQL and support tables
built with PROFTAB.SQL– Must explicitly flush data if it is to be retained– Database and Grid control has interface as do some 3rd
party tools

26
DBMS_PROFILER Contents
– START_PROFILER function– STOP_PROFILER Function– FLUSH_DATA Function– GET_VERSION Procedure– INTERNAL_VERSION_CHECK Procedure

27
DBMS_PROFILER Example
• declare• x integer;• begin• x:=dbms_profiler.start_profiler('Test
Profiler');• dbms_revealnet.just_statistics;• x:=dbms_profiler.flush_data;• x:=dbms_profiler.stop_profiler;• end;• /• NOT A CORRECT USAGE! Calls must be inside PL/SQL
object to be profiled.

28
DBMS_PROFILER Example
• SQL> select runid, run_date, run_total_time, run_comment from plsql_profiler_runs;
•• RUNID RUN_DATE RUN_TOTAL_TIME RUN_COMMENT • --------- --------- -------------- --------------• 1 05-SEP-99 6.802E+11 Test Profiler • 2 05-SEP-99 533133 •• SQL> select runid,unit_number,unit_type,unit_owner,
unit_name, unit_timestamp,• 2 total_time from plsql_profiler_units where
runid=2;•

29
DBMS_PROFILER Example
• RUNID UNIT UNIT_TYPE UN_OWNER UN_NAME UNIT_TIME TOTALTIME
• ----- ---- --------------- ----------- ----------- --------- ---------
• 2 1 ANONYMOUS BLOCK <anonymous> <anonymous> 00-DECEMB 0
• 2 2 PACKAGE BODY SYS DBMS_PROFILER 05-SEP-99 0
•
• 2 rows selected.•
•• SQL> select runid,unit_number, line#,total_occur, total_time,
min_time, max_time• 2 from plsql_profiler_data where runid=2
••

30
DBMS_PROFILER Example
• RUNID UNIT LINE# TOTAL TOTAL MIN_TIME MAX_TIME • OCCUR TIME
• ----- ---- ------ ----- ------- --------- ---------• 2 1 6 1 20117 20117 20117• 2 1 7 1 37566 37566 37566
• 2 2 8 2 125887 4158 121728• 2 2 51 2 7301 2917 4383• 2 2 60 1 19431 19431 19431
• 2 2 65 2 15498 6135 9362• 2 2 68 1 2001 2001 2001• …
•• 17 rows selected.

31
DBMS_PROFILER Example
• SQL> @test_profiler2
• SQL> declare• 2 x integer;
• 3 begin• 4 x:=dbms_profiler.start_profiler('Test Profiler2');
• 5 dbms_revealnet.just_statistics; We have added calls internally
• 6 x:=dbms_profiler.flush_data;• 7 x:=dbms_profiler.stop_profiler;• 8 end;
• 9 /•
• PL/SQL procedure successfully completed.•
• SQL> select runid, run_date, run_total_time, run_comment from plsql_profiler_runs;
•
32
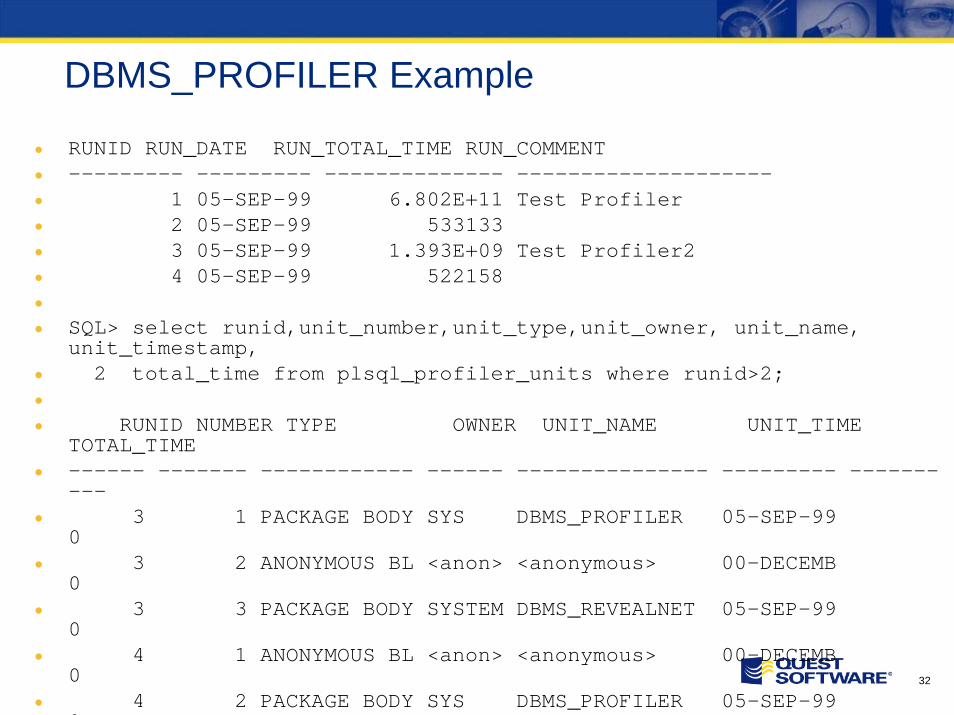
DBMS_PROFILER Example
• RUNID RUN_DATE RUN_TOTAL_TIME RUN_COMMENT • --------- --------- -------------- --------------------• 1 05-SEP-99 6.802E+11 Test Profiler • 2 05-SEP-99 533133 • 3 05-SEP-99 1.393E+09 Test Profiler2 • 4 05-SEP-99 522158 •• SQL> select runid,unit_number,unit_type,unit_owner, unit_name,
unit_timestamp,• 2 total_time from plsql_profiler_units where runid>2;•• RUNID NUMBER TYPE OWNER UNIT_NAME UNIT_TIME
TOTAL_TIME • ------ ------- ------------ ------ --------------- --------- -------
---• 3 1 PACKAGE BODY SYS DBMS_PROFILER 05-SEP-99
0 • 3 2 ANONYMOUS BL <anon> <anonymous> 00-DECEMB
0 • 3 3 PACKAGE BODY SYSTEM DBMS_REVEALNET 05-SEP-99
0 • 4 1 ANONYMOUS BL <anon> <anonymous> 00-DECEMB
0 • 4 2 PACKAGE BODY SYS DBMS_PROFILER 05-SEP-99
0

33
DBMS_PROFILER Example
• SQL> select runid,unit_number, line#,total_occur, total_time, min_time, max_time
• 2 from plsql_profiler_data where runid>2;•• RUNID UNIT LINE# TOTAL_OCCUR TOTAL_TIME MIN_TIME MAX_TIME • ------ ------- --------- ----------- ---------- --------- ---------• 3 1 8 12 109762112 3492 98948661 • 3 2 5 1 5034924 5034924 5034924 • 3 2 6 1 41565 41565 41565 • 3 3 7 1 790506 790506 790506 • 3 3 16 1 25397557 25397557 25397557 • 3 3 773 1 23248826 23248826 23248826 • 3 3 774 1 19196 19196 19196 • 3 3 946 1 833808 833808 833808 • 3 3 949 1 4568 4568 4568 • 3 3 951 15 82645188 160706 80156282 • 4 2 68 1 1941 1941 1941 • 599 rows selected.

34
DBMS_PROFILER Example
• RUNID UNIT LINE# TOTAL TOTAL_TIME MIN_TIME MAX_TIME • OCCUR • ----- ------ ----- ------- ---------- --------- ---------
• 3 3 16 1 25397557 25397557 25397557 • 3 3 650 1 15901801 15901801 15901801 • 3 3 773 1 23248826 23248826 23248826
• 3 3 920 1 870328854 870328854 870328854 • 3 3 941 5 68741980 272176 67312025 • 3 3 951 15 82645188 160706 80156282

35
Finding The problem Line
• SQL>select source from source$ where obj#=3315 and line=920 /• SOURCE • -------------------------------------------------------• SELECT SUM(BYTES)/1048576 INTO stat_val• SQL> select line, source from source$ where obj#=3315 and line
between 918 and 923• LINE SOURCE• ---- --------------------------------------------------• 918 BEGIN• 919 stat_name := 'TOTAL USED MEG';• 920 SELECT SUM(BYTES)/1048576 INTO stat_val• 921 FROM dba_extents;• 922 INSERT INTO dba_temp VALUES(stat_name,stat_val,26);• 923 EXCEPTION•• 6 rows selected.

36
Controlling DBMS_PROFILER
• By pre-instrumenting procedures, functions and other stored objects, recompiles are avoided
• Use a central debugging package to avoid reinventing the wheel

37
Profiler Control
• PROCEDURE profiler_control(• start_stop IN VARCHAR2, run_comm IN VARCHAR2, ret OUT
BOOLEAN) AS• ret_code INTEGER;• BEGIN• ret_code:=• dbms_profiler.internal_version_check;• IF ret_code !=0 THEN• ret:=FALSE;• ELSIF start_stop NOT IN ('START','STOP') THEN• ret:=FALSE;• ELSIF start_stop = 'START' THEN• ret_code:=DBMS_PROFILER.START_PROFILER(• run_comment1=>run_comm);

38
Profiler Control
• IF ret_code=0 THEN• ret:=TRUE;• ELSE• ret:=FALSE;• END IF;• ELSIF start_stop = 'STOP' THEN• ret_code:=DBMS_PROFILER.FLUSH_DATA;• ret_code:=DBMS_PROFILER.STOP_PROFILER;• IF ret_code=0 THEN• ret:=TRUE;• ELSE• ret:=FALSE;• END IF; • END IF;• END profiler_control;

39
Using Profiler Control
• BEGIN • IF RUN_PROFILER THEN• DBA_UTILITIES.PROFILER_CONTROL('START'
,• 'JUST_STATISTICS',b_ret);• END IF;• …• IF RUN_PROFILER THEN • DBA_UTILITIES.PROFILER_CONTROL('STOP',• 'JUST_STATISTICS',b_ret);• END IF;• END;

40
Example
• DECLARE• run_profiler boolean;• BEGIN• dba_utilities.run_profiler:=TRUE;• dba_utilities.running_stats(TRUE);• END;• /

41
DBMS_PROFILER Summary
• The DBMS_PROFILER package contains functions that a DBA or developer should use to examine the line-by-line performance of a procedure, function or other stored object
• By simply embedding calls to the DBMS_PROFILER functions into the source code of the object to be monitored a great deal of valuable information about executions and timings for each line of code in the object are gathered.

42
Using Events
• Allow us to fine tune how Oracle does certain operations.
• To fine tune SQL tracing we can use the 10046 event.

43
Setting an Event
• Means to tell oracle to generate information in form of a trace file in the context of the event specified.
• Trace file is usually located in USER_DUMP_DEST. • The resulting trace file provides detailed information about the event
traced • The general format for an event is:
• EVENT = "<trace class> <event name> <action> <name><trace name><qualifier>"

44
Event Types
• 2 types of events:– session-events – process-events
• Process-events initialized in the parameter file• Session-events initialized with "ALTER SESSION..." or "ALTER
SYSTEM" commands • Oracle server first checks for session events then for process-
events.

45
Event Classes
• There are 4 traceable event classes:• Class 1 "Dump something": These events can not be set in the
init<SID>.ora but must be set using the ALTER SESSION or the DBMS_SYSYTEM.SET_EV() procedure.
• Class 2 -- "Trap on Error" : Causes oracle to generate an errorstack every time the event occurs.
• Class 3 -- "Change execution path" : Change the execution path for some specific Oracle internal code segment. For example, setting event "10269" prevents SMON from doing free space coalescing.
• Class 4 -- "Trace something": Bbtain traces that are used for, e.g., SQL tuning. I.E. "10046" which causes oracle to trace the SQL access path on each SQL-statement.

46
Event Arguments

47
Initialization File Event Settings
• The EVENTS commands in an init<SID>.ora file have generally been placed there at the command of Oracle support
• In an Oracle applications instance you may see several events set (as well as several undocumented initialization parameters).
• These alerts turn on advanced levels of tracing and error detection • The syntax to specify multiple events in the init.ora is:
• EVENT="<event 1>:<event 2>: <event 3>: <event n>"
48
Initialization File Event Settings
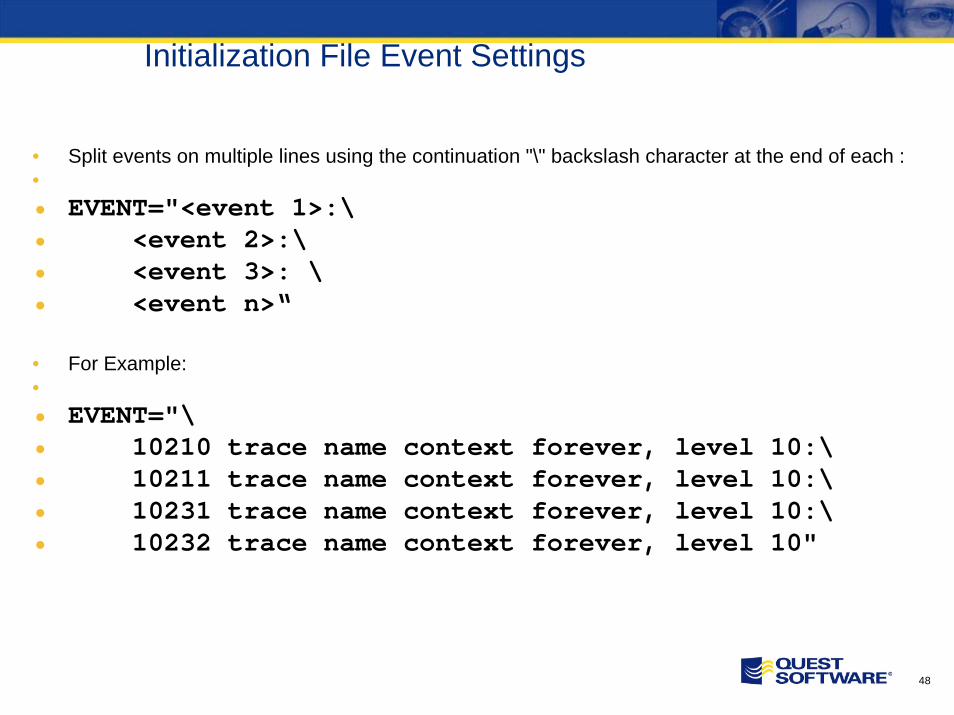
• Split events on multiple lines using the continuation "\" backslash character at the end of each :•• EVENT="<event 1>:\• <event 2>:\• <event 3>: \• <event n>“
• For Example:•• EVENT="\• 10210 trace name context forever, level 10:\• 10211 trace name context forever, level 10:\• 10231 trace name context forever, level 10:\• 10232 trace name context forever, level 10"

49
Initialization File Event Settings
• With almost all EVENT specify them at the session level using the ALTER SESSION command or a call to the DBMS_SYSTEM.SET_EV() procedure
• Will not require an instance bounce for the EVENT to take effect.

50
Alert Log and Events
• The alert.log should show the events that are in effect, for example:
• event = 10210 trace name context forever, level 10:10211 trace name context for ever, level 10:10231 trace name context forever, level 10:10232 trace name context forever, level 10

51
Setting an Event
• To enable the maximum level of SQL performance monitoring (this works in concert with the SQL trace utility):
• event = "10046 trace name context forever, level 12"

52
Events at the Session Level
• ALTER SESSION command or calls to the DBMS_SYSTEM.SET_EV() procedure. Format for the ALTER SESSION command is:
• ALTER SESSION SET EVENTS 'ev_number ev_text level x';
• Where:• Ev_number is the event number• Ev_text is any required text (usually "trace name context forever")• x is the required level setting corresponding to the desire action, file or other
required data.

53
Session Example
• ALTER SESSION SET EVENTS '10046 trace name context forever level NN'
• where NN:• 1 -- same as a regular trace• 4 -- also dump bind variables• 8 -- also dump wait information• 12 -- dump both bind and wait information

54
Demo!
• Let’s look at a demonstration!

55
Seeing What the Optimizer Does
• Event 10053 gives the detail of the various plans considered
• Be very careful with this for large multi-table joins as the report can be quite lengthy!
• The data density, sparse characteristics, index availability, index depth all lead the optimizer to make its decisions
• You can see the running commentary in trace files generated by 10053 event

56
Using 10053 event
1. Connect to Oracle using SQL*Plus as the appropriate user2. Issue the following series of commands:• SQL> ALTER SESSION SET EVENTS '10053 trace
name context forever, level 1'; • Session altered. • SQL> EXPLAIN PLAN FOR --SQL STATEMENT--;
Explained. • SQL> exit

57
Demo!
• Let’s look at a demonstration!

58
What Events Are Set In My Session?
• set serveroutput on size 1000000• declare• event_level number;• begin• for i in 10000..10999 loop• sys.dbms_system.read_ev(i,event_level);• if (event_level > 0) then• dbms_output.put_line('Event
'||to_char(i)||' set at level '||•
to_char(event_level));• end if;• end loop;• end;• /
59
Demo!
• Let’s look at a demonstration!• (Feels like I am back in the 60’s…)

60
Using DBMS_SYSTEM.SET_EV
• DBMS_SYSTEM.SET_EV(• SI Binary_integer,• SE Binary_integer,• EV Binary_integer,• LE Binary_integer,• NM VARCHAR2);
• Where:• SI -- Oracle SID value• SE -- Oracle Serial number• EV -- Oracle event to set• LE -- Event level• NM -- Name

61
Using DBMS_SYSTEM.SET_EV
• For example:• EXECUTE
SYS.DBMS_SYSTEM.SET_EV(sid,serial#,10046,level,'');

62
Demo!
• One more time!

63
The DBMS_SYSTEM.READ_EV Procedure
• The DBMS_SYSTEM.READ_EV has the following syntax:
• DBMS_SYSTEM.READ_EV(• IEVbinary_integer,• OEVbinary_integer);
• Where:
• IEV -- Oracle event (in value)• OEV -- Oracle event setting (out value)
• For example:• EXECUTE sys.dbms_system.read_ev(i,event_level);

64
Are they Supported?
• Oracle support would either say to use or not use DBMS_SYSTEM SET_EV and READ_EV depending on the analyst, day of the week and phase of the moon.
• They are documented in many postings on the Metalink forums.
• In new releases (>9i) the DBMS_SYSTEM package is shipped with the other DBMS packages and is documented in the appropriate manuals.

65
Statspack and AWR
• Statspack was first available in 8.1.7 • New and improved version of the old utlbstat/utlestat scripts • Statspack improved on that by leaving tables in place an allowing
you to collect multiple sets of statistics into them. • You would then use the provided reports to generate a stastspack
report across any two sets of statistics that would give you a delta report on the statistics, details about SQL that was generated and general physical health statistics for the database.

66
AWR
• In 10g we now have AWR. • Defaults to a collection interval every 30 minutes• AWR is like STATSPACK, top SQL is collected every hour,
based on your rolling thresholds for high-use SQL. • AWR collects detailed run-time statistics on the top SQL• This ensures that AWR collects the most resource intensive
SQL. • Reports can be run against the AWR tables that provide the
same type of data a statspack report used to, and, much more. • AWR takes advantage of the ADDM (Adam)

67
Automatic Database Diagnostic Monitor
MMON
Work LoadRepository
Access Advisor SQL TuningAdvisor
OEM
ServerGenerated
Alerts

68
ADDM

69
ADDM

70
ADDM

71
Using 10g Database/Grid Control

72
Using 10g Database/Grid Control

73
Using 10g Database/Grid Control

74
Using 10g Database/Grid Control

75
Using 10g Database/Grid Control

76
Using 10g Database/Grid Control

77
Using 10g Database/Grid Control

78
Using 10g Database/Grid Control

79
Using 10g Database/Grid Control
• As you can see from previous slide, it says the statement is as tuned as it can get.
• Of course, this will be optimally tuned for the environment in which the SQL Advisor was run, so as long as your development environment is the same as the production, you should be ok.
• However, how you get the SQL profile from development to production is not clear.
• On a second SQL statement taking Oracle suggestions resulted in the statement taking twice as long.
• Caveat Emptor!

80
In Conclusion
• This paper has tried to show what Oracle provided tuning tools are available to the developer who needs to tune their code to perform optimally.
• We have discussed Explain Plan, tracing and tkprof, use of events and use of statspack and AWR to assist with the tuning of SQL and PL/SQL.
• It is hoped that developers will utilize some of these tools and techniques for tuning code to help provide better code for their applications.
