sq lecture ten - improving service quality and productivity (ch 14)
TRANSCRIPT
Lecture Ten
Improving Service
Quality and
Productivity (Chapter 14)
Service Quality MKTG 1268
1
JAN 2013 Semester
Overview of Chapter 14
Integrating Service Quality and Productivity Strategies
What is Service Quality?
The GAP Model – A Conceptual Tool to Identify and Correct Service Quality Problems
Measuring and Improving Service Quality
Learning From Customer Feedback
2
Overview of Chapter 14 (cont’d)
Hard Measures of Service Quality
Tools to Analyze and Address Service Quality Problems
Return on Quality
Defining and Measuring Productivity
Improving Service Productivity
3
4
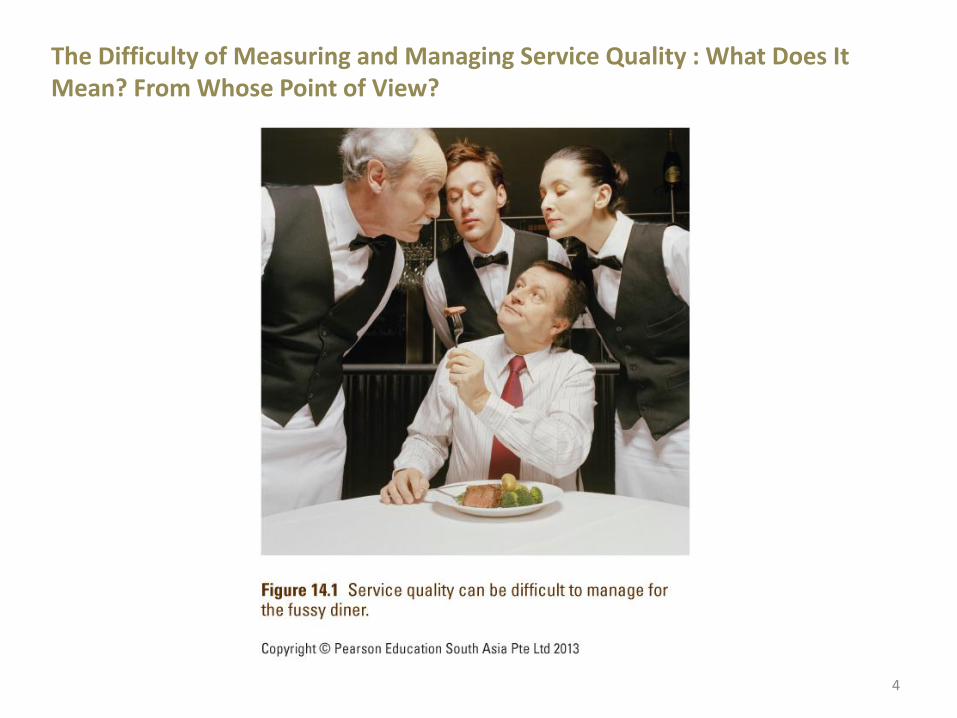
The Difficulty of Measuring and Managing Service Quality : What Does It Mean? From Whose Point of View?
Productivity and quality in a service context
5
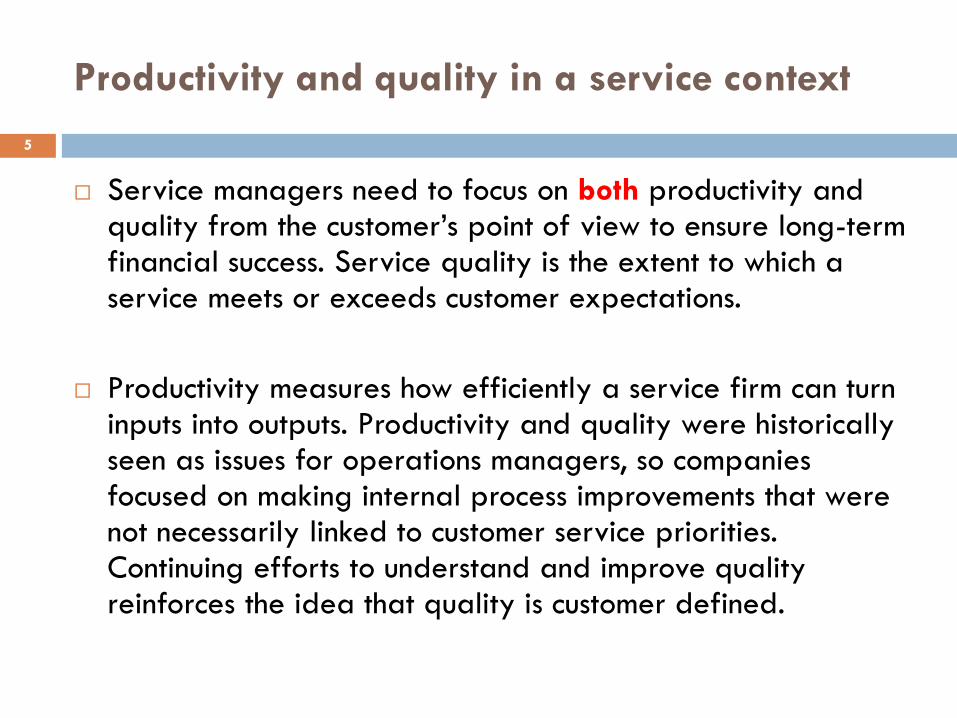
Service managers need to focus on both productivity and quality from the customer’s point of view to ensure long-term financial success. Service quality is the extent to which a service meets or exceeds customer expectations.
Productivity measures how efficiently a service firm can turn inputs into outputs. Productivity and quality were historically seen as issues for operations managers, so companies focused on making internal process improvements that were not necessarily linked to customer service priorities. Continuing efforts to understand and improve quality reinforces the idea that quality is customer defined.
Integrating Service Quality and
Productivity Strategies
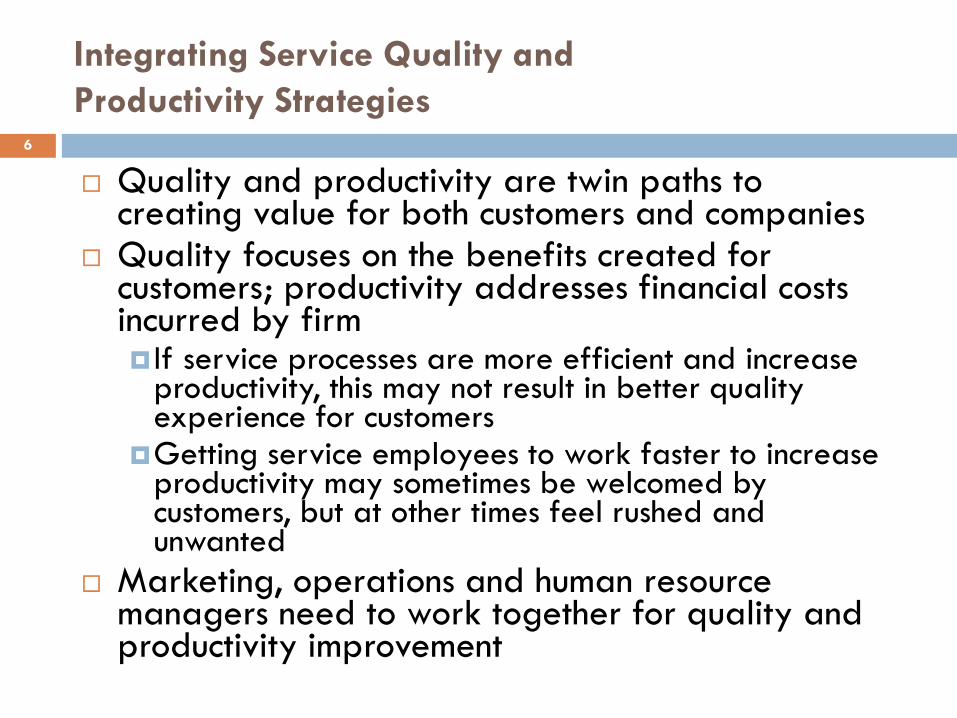
Quality and productivity are twin paths to creating value for both customers and companies
Quality focuses on the benefits created for customers; productivity addresses financial costs incurred by firm If service processes are more efficient and increase
productivity, this may not result in better quality experience for customers
Getting service employees to work faster to increase productivity may sometimes be welcomed by customers, but at other times feel rushed and unwanted
Marketing, operations and human resource managers need to work together for quality and productivity improvement
6
WHAT IS
SERVICE QUALITY?
7

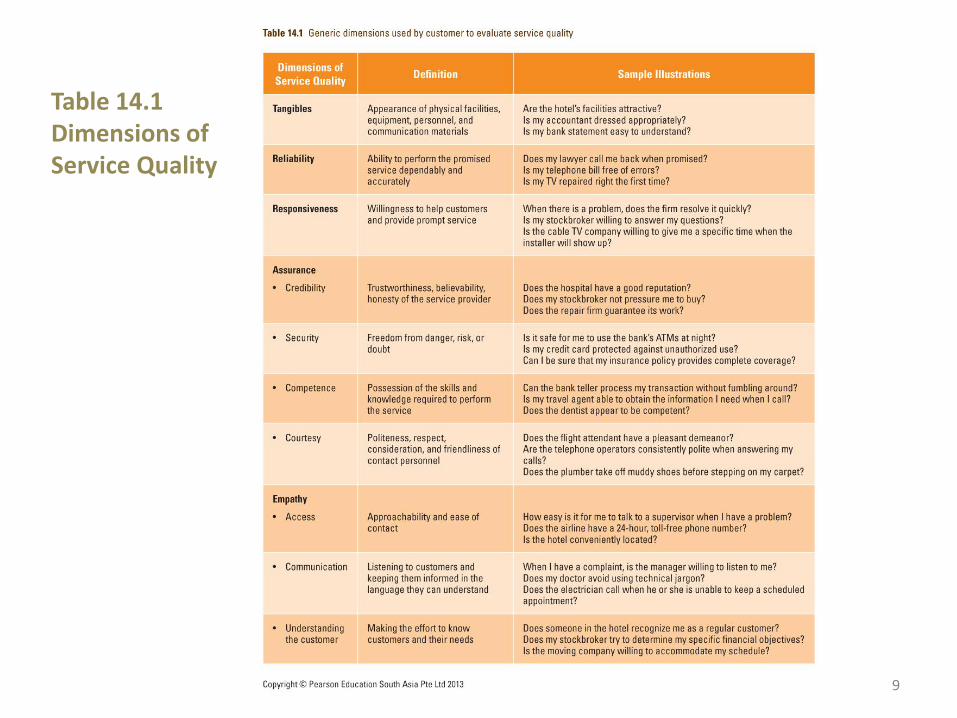
Dimensions of Service Quality
Responsiveness: Promptness; helpfulness
Tangibles: Appearance of physical elements
Reliability: Dependable and accurate performance
Assurance: Competence, courtesy, credibility, security
Empathy: Easy access, good communication,
understanding of customer
8
8
9
Table 14.1 Dimensions of Service Quality
10
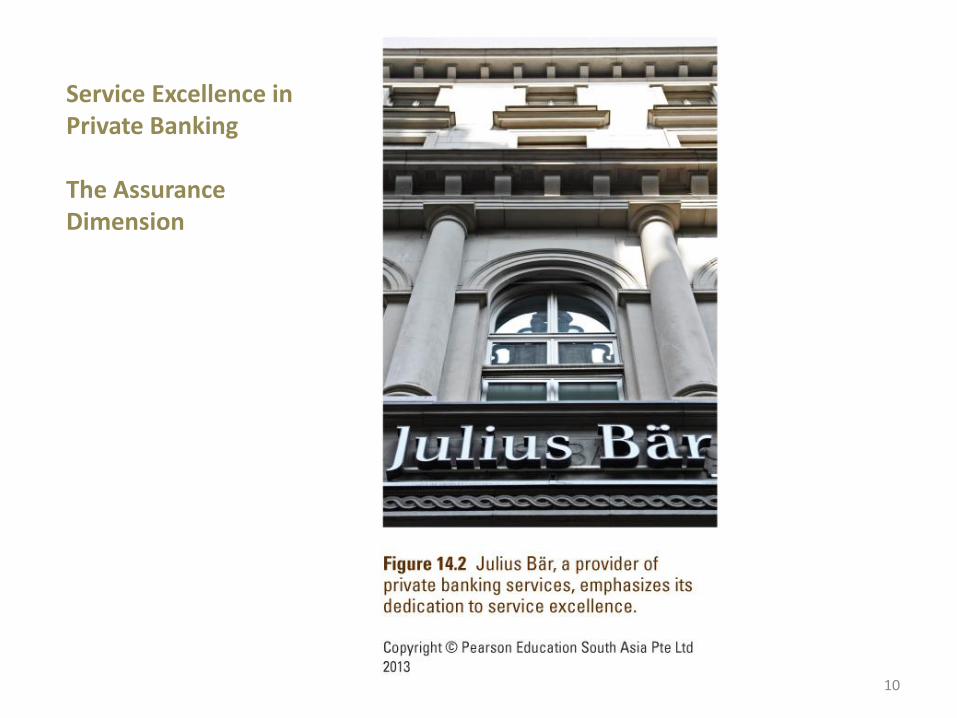
Service Excellence in Private Banking The Assurance Dimension
THE GAP MODEL – A
CONCEPTUAL TOOL TO
IDENTIFY AND CORRECT
SERVICE QUALITY PROBLEMS
11
The GAP Model for identifying and correcting
service quality problems 12
The GAP model (Figure. 14.3) is a diagnostic
tool relates quality standards to customer
expectations.
The GAP model of service quality identifies
gaps where a discrepancy may occur between
the service provider’s performance and the
customer’s expectations
13
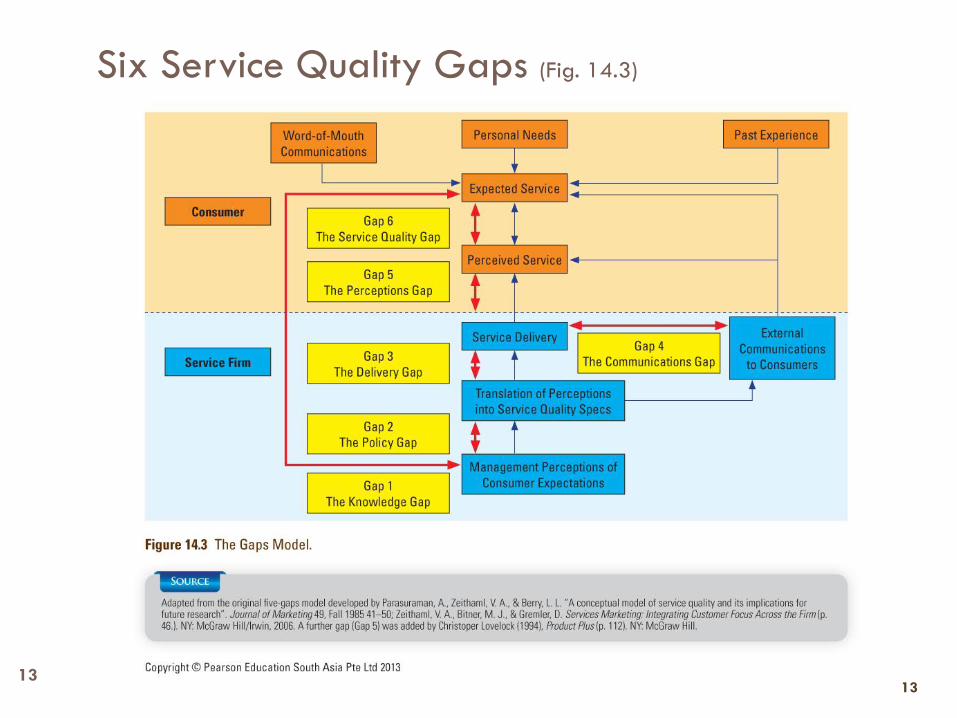
Six Service Quality Gaps (Fig. 14.3)
13
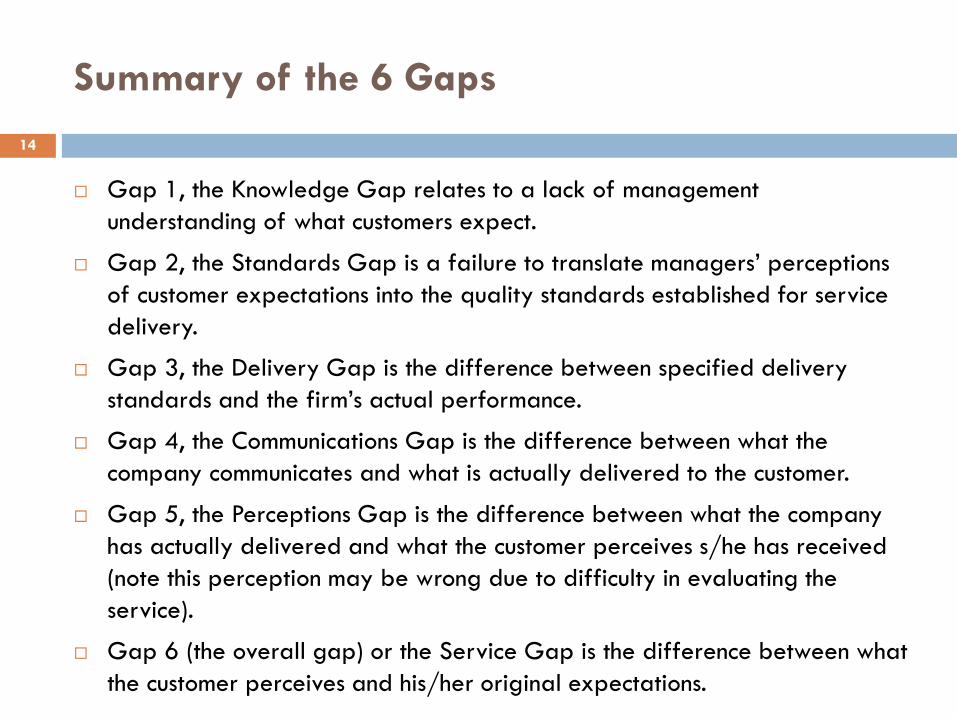
Summary of the 6 Gaps
14
Gap 1, the Knowledge Gap relates to a lack of management
understanding of what customers expect.
Gap 2, the Standards Gap is a failure to translate managers’ perceptions
of customer expectations into the quality standards established for service
delivery.
Gap 3, the Delivery Gap is the difference between specified delivery
standards and the firm’s actual performance.
Gap 4, the Communications Gap is the difference between what the
company communicates and what is actually delivered to the customer.
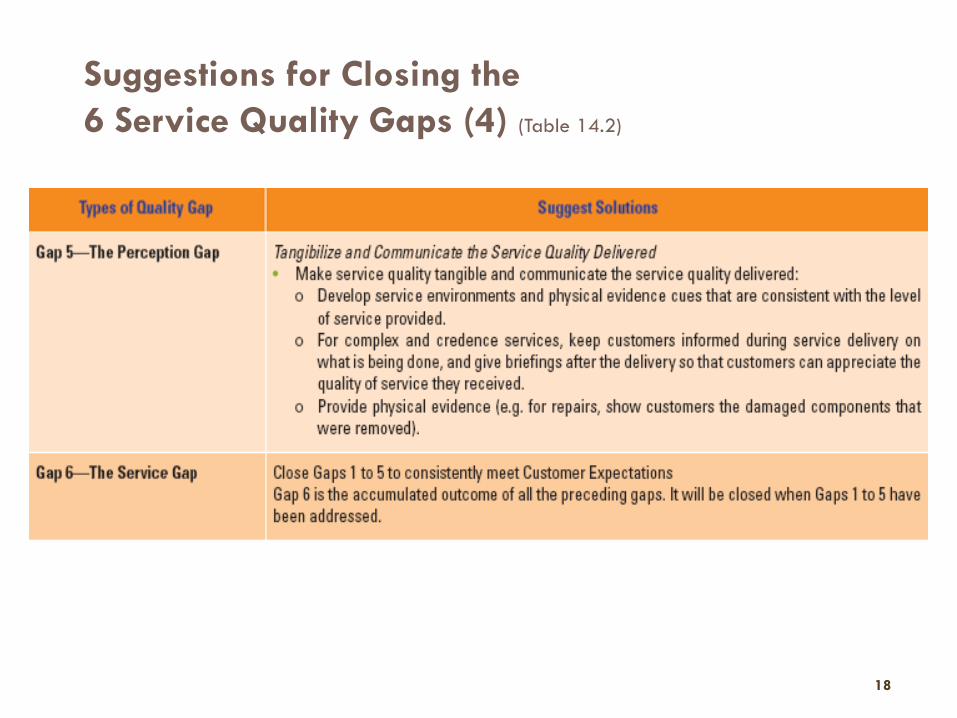
Gap 5, the Perceptions Gap is the difference between what the company
has actually delivered and what the customer perceives s/he has received
(note this perception may be wrong due to difficulty in evaluating the
service).
Gap 6 (the overall gap) or the Service Gap is the difference between what
the customer perceives and his/her original expectations.
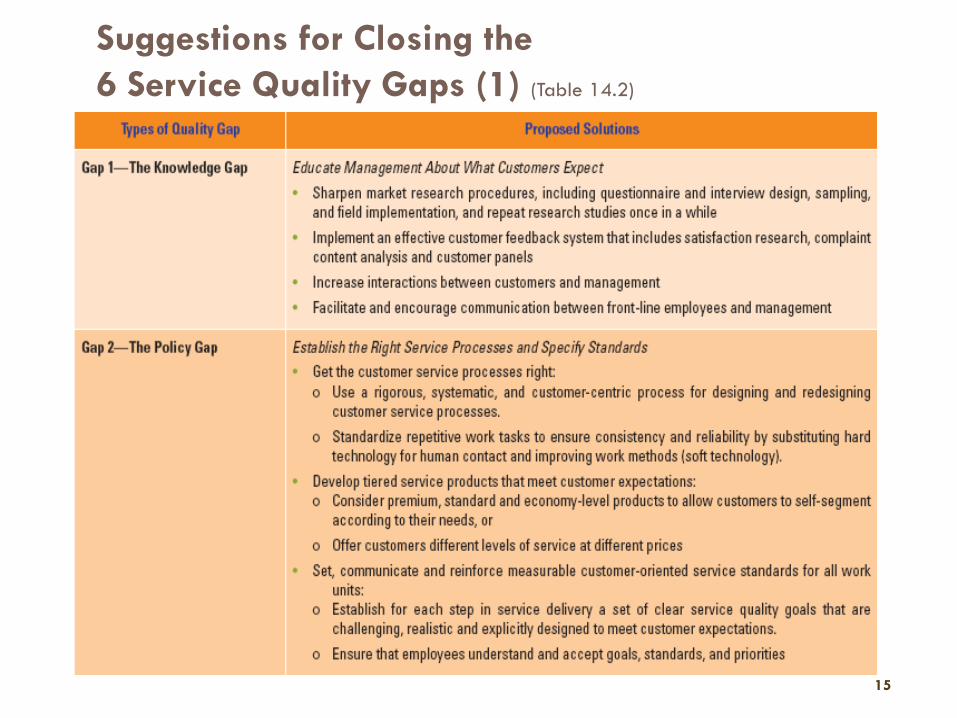
Suggestions for Closing the
6 Service Quality Gaps (1) (Table 14.2)
15
15
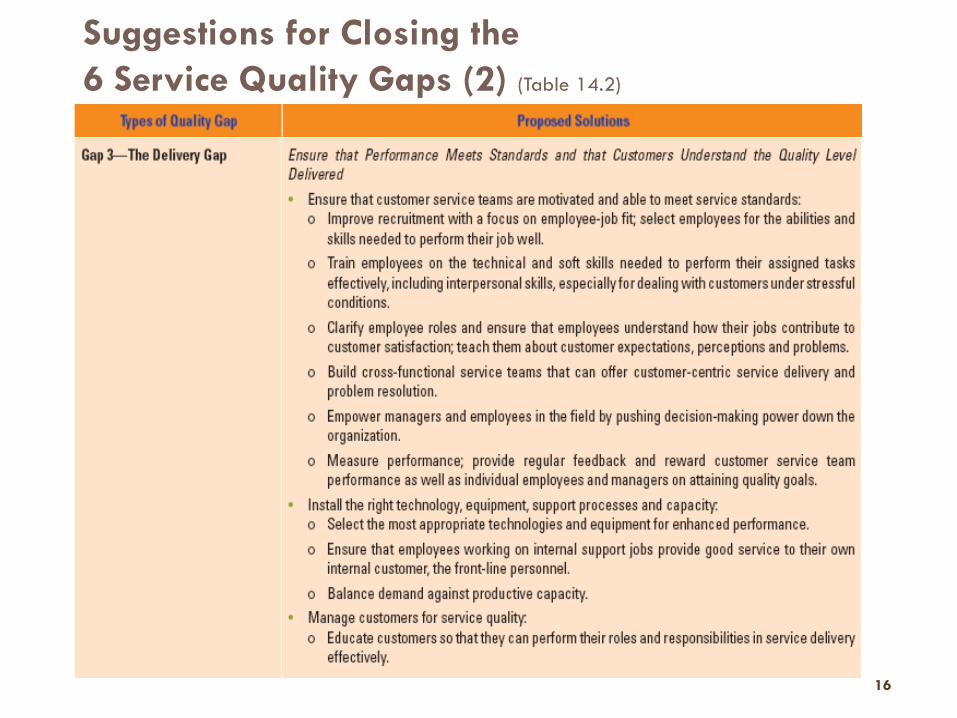
Suggestions for Closing the
6 Service Quality Gaps (2) (Table 14.2)
16
16
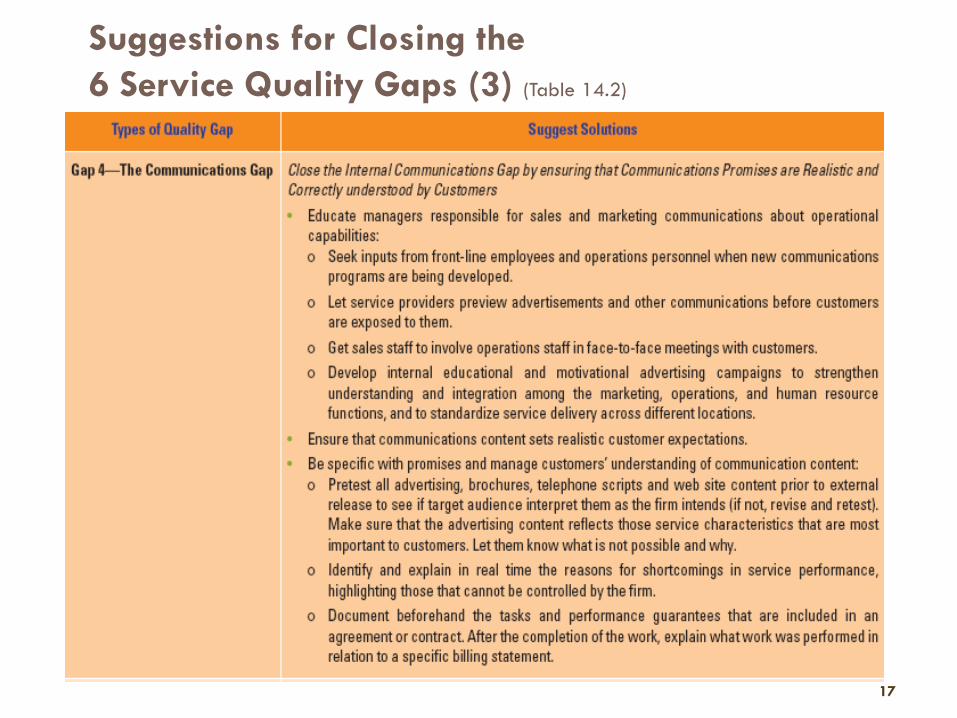
Suggestions for Closing the
6 Service Quality Gaps (3) (Table 14.2)
17
17
Suggestions for Closing the
6 Service Quality Gaps (4) (Table 14.2) 18
18

MEASURING AND
IMPROVING
SERVICE QUALITY
19
Soft and Hard Measures of Service Quality
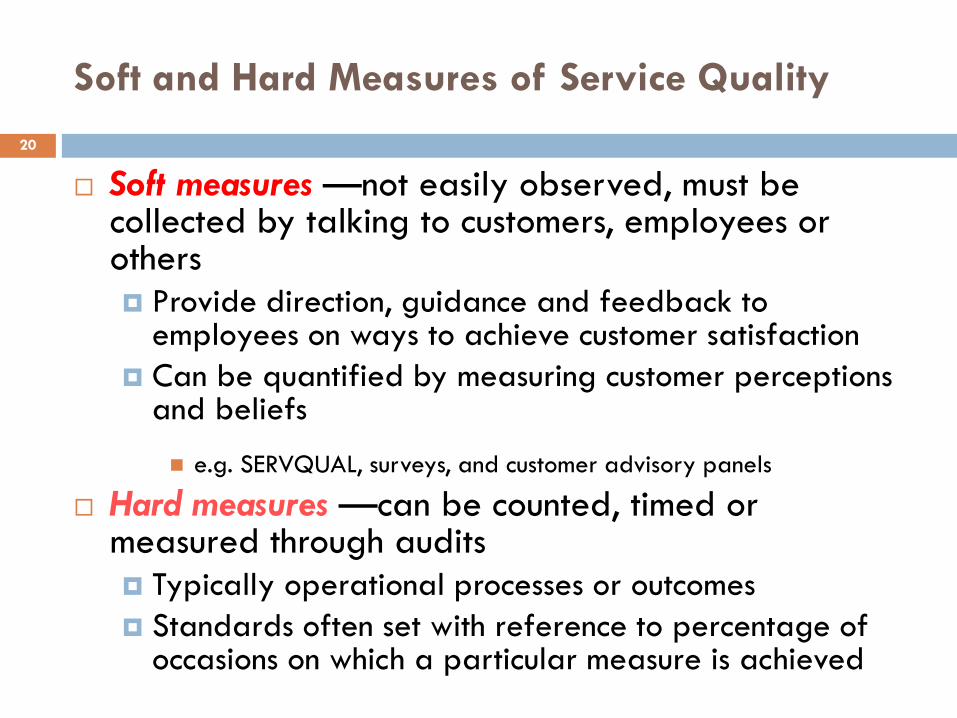
Soft measures —not easily observed, must be collected by talking to customers, employees or others Provide direction, guidance and feedback to
employees on ways to achieve customer satisfaction
Can be quantified by measuring customer perceptions and beliefs
e.g. SERVQUAL, surveys, and customer advisory panels
Hard measures —can be counted, timed or measured through audits Typically operational processes or outcomes
Standards often set with reference to percentage of occasions on which a particular measure is achieved
20
21
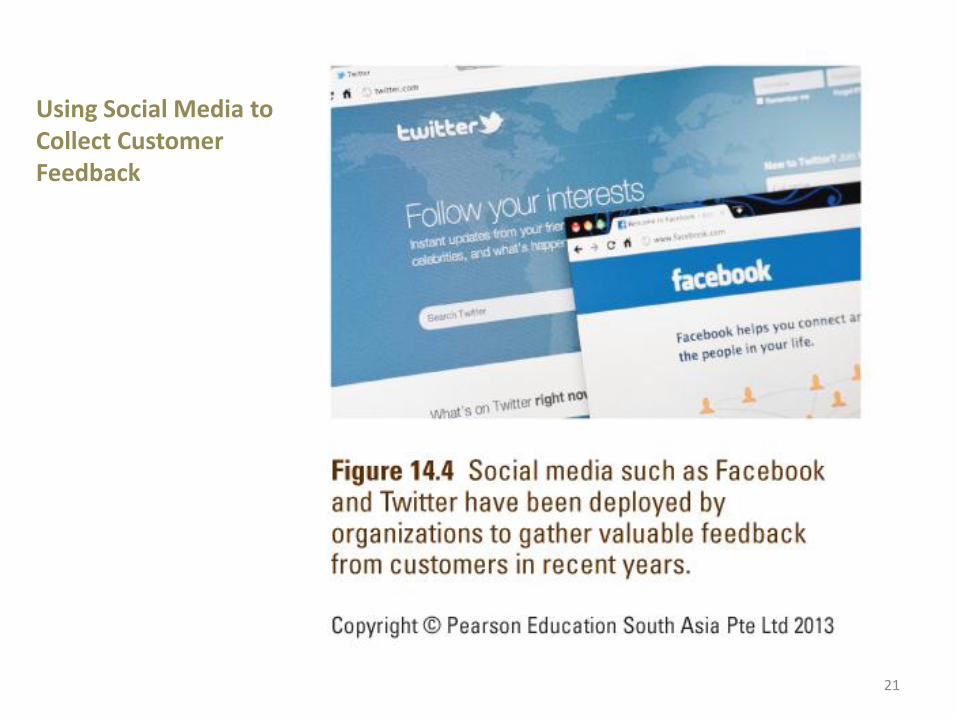
Using Social Media to Collect Customer Feedback
LEARNING FROM
CUSTOMER FEEDBACK
22
It is critical for companies to learn from
customers and change according to
shifting customer needs and perceptions.
An effective customer feedback system
enables a firm to
Assess and benchmark its service
quality and performance
Initiate customer driven learning and
improvements
Create a customer-orientated service
culture.
Key Objectives of Effective Customer Feedback
Systems 23

Key Objectives of Effective Customer Feedback
Systems 24
Together, these allow the
company to understand
where it stands against the
best in the market, how it is
perceived by its customers,
and help improve its service
offering to satisfy (if not
delight) its customers.
Customer Feedback Collection Tools
Total market surveys
Annual surveys
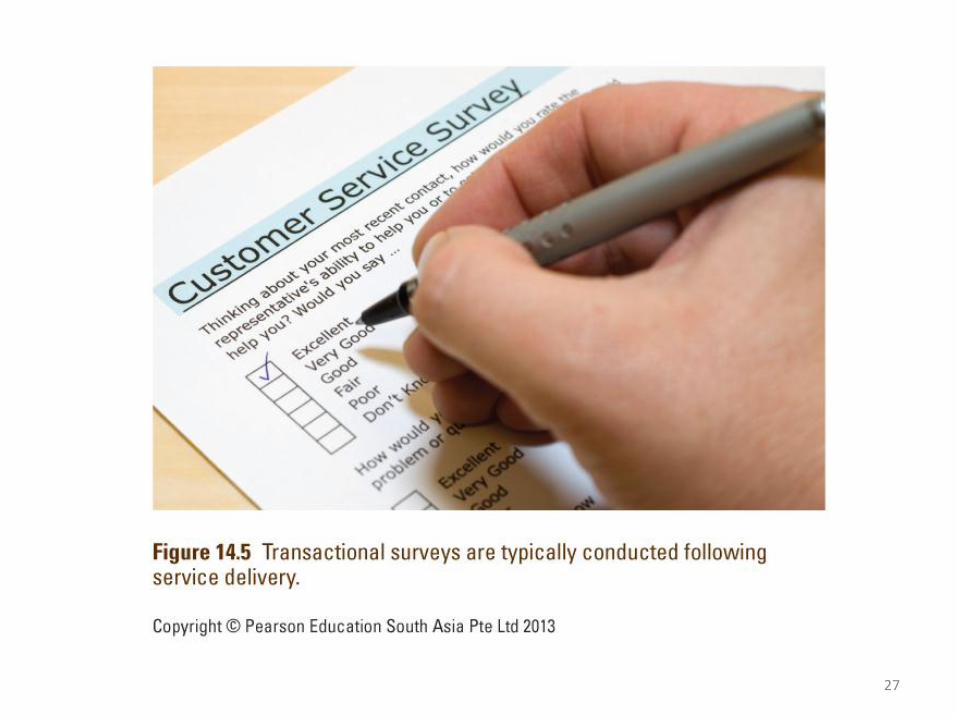
Transactional surveys
Service feedback cards
Mystery shopping
Unsolicited customer feedback
Focus group discussions
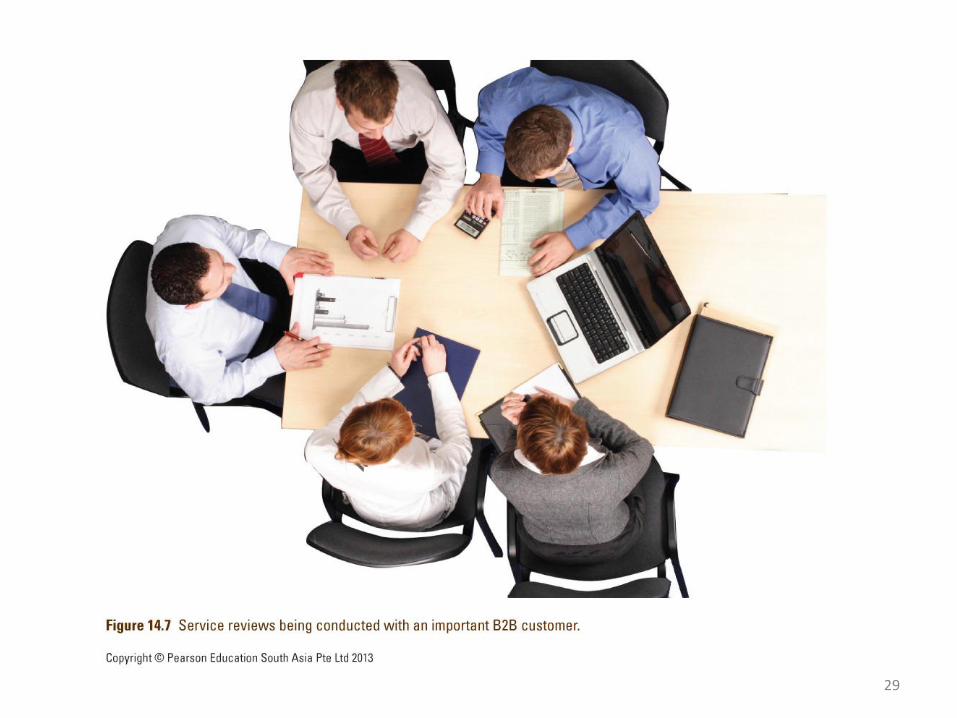
Service reviews
25
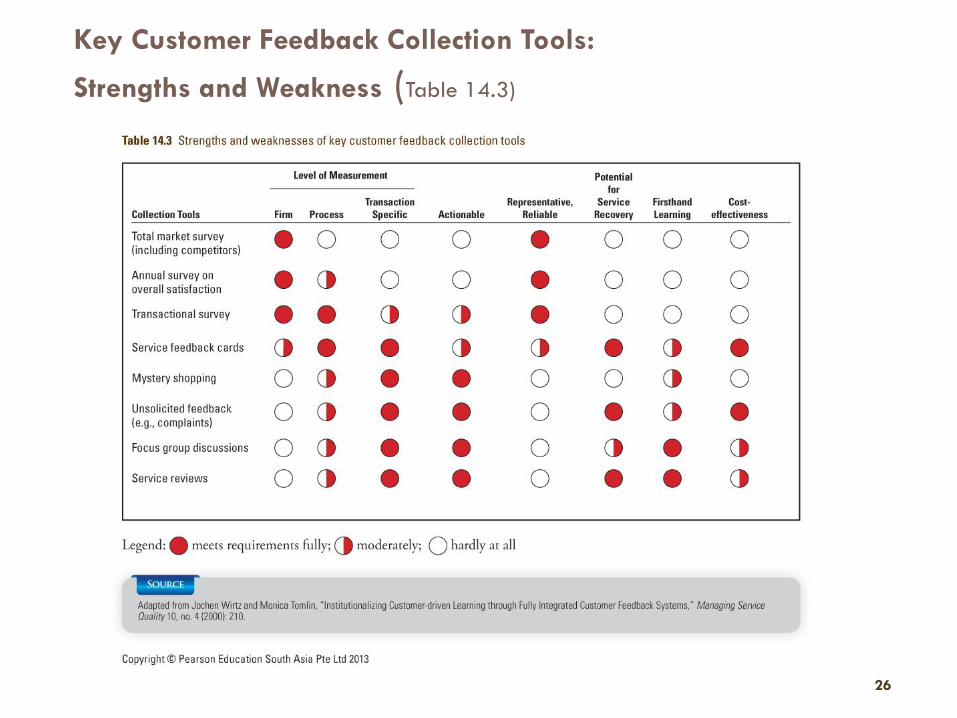
Key Customer Feedback Collection Tools:
Strengths and Weakness (Table 14.3)
26
26
27
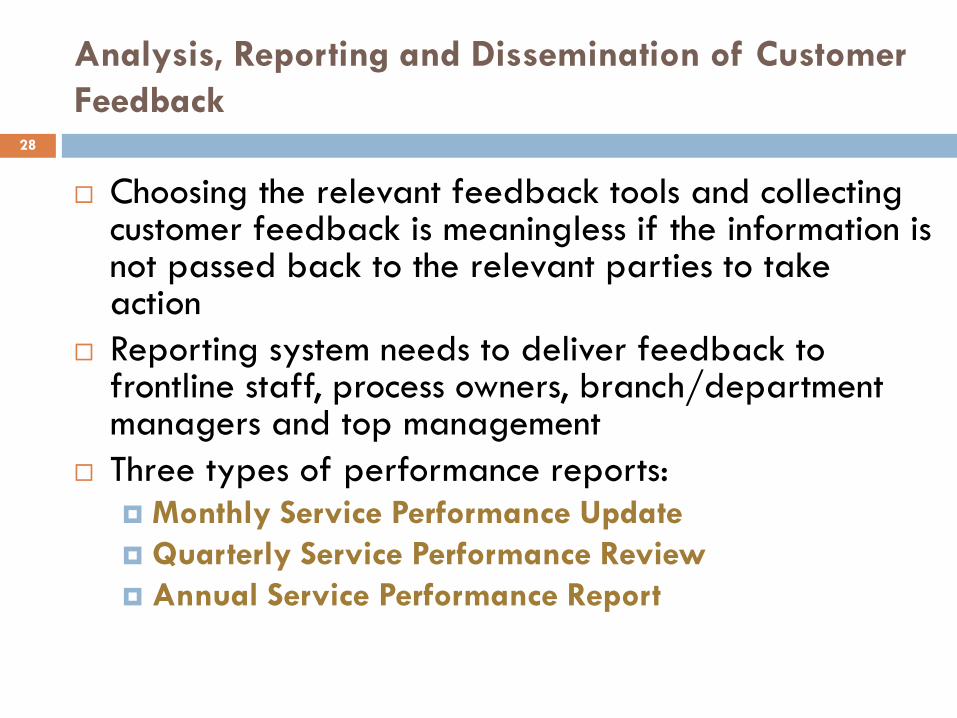
Choosing the relevant feedback tools and collecting customer feedback is meaningless if the information is not passed back to the relevant parties to take action
Reporting system needs to deliver feedback to frontline staff, process owners, branch/department managers and top management
Three types of performance reports: Monthly Service Performance Update
Quarterly Service Performance Review
Annual Service Performance Report
Analysis, Reporting and Dissemination of Customer
Feedback 28
29
Hard Measures of Service Quality
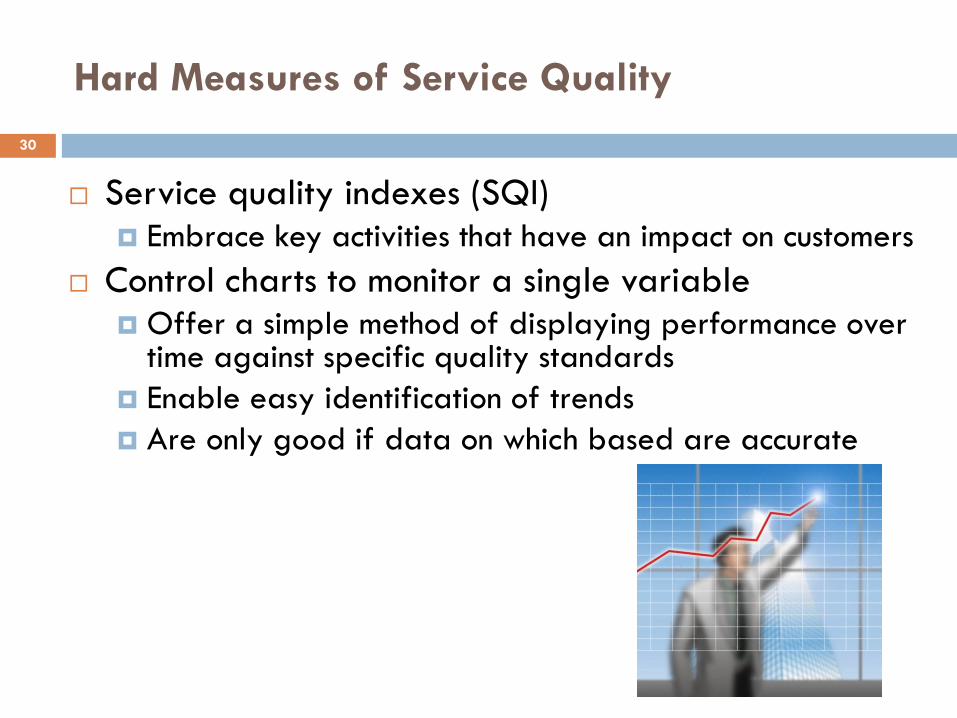
Service quality indexes (SQI) Embrace key activities that have an impact on customers
Control charts to monitor a single variable Offer a simple method of displaying performance over
time against specific quality standards
Enable easy identification of trends
Are only good if data on which based are accurate
30

Control Chart for Departure Delays (Fig. 14.8)
31
31
32
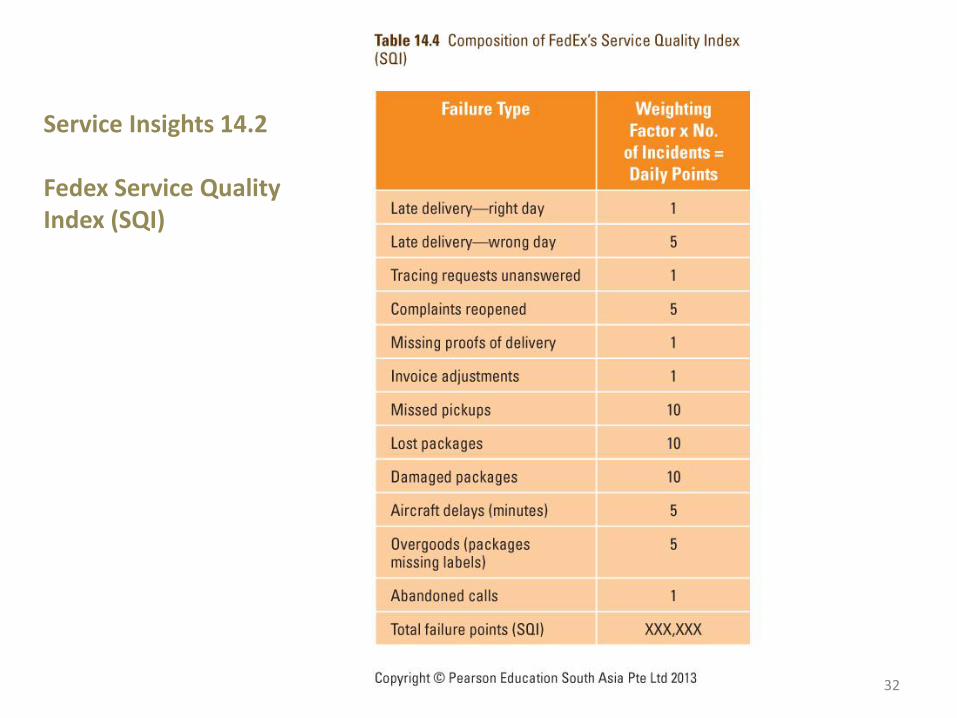
Service Insights 14.2 Fedex Service Quality Index (SQI)
TOOLS TO ANALYZE AND
ADDRESS SERVICE
QUALITY PROBLEMS
33
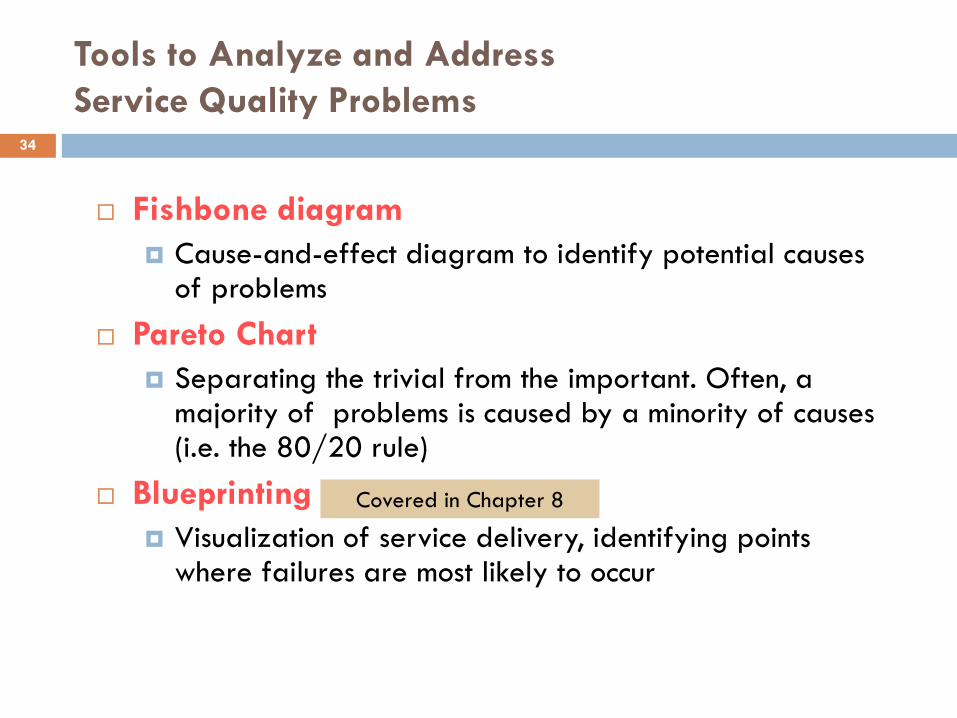
Tools to Analyze and Address
Service Quality Problems
Fishbone diagram
Cause-and-effect diagram to identify potential causes of problems
Pareto Chart
Separating the trivial from the important. Often, a majority of problems is caused by a minority of causes (i.e. the 80/20 rule)
Blueprinting
Visualization of service delivery, identifying points where failures are most likely to occur
34
Covered in Chapter 8
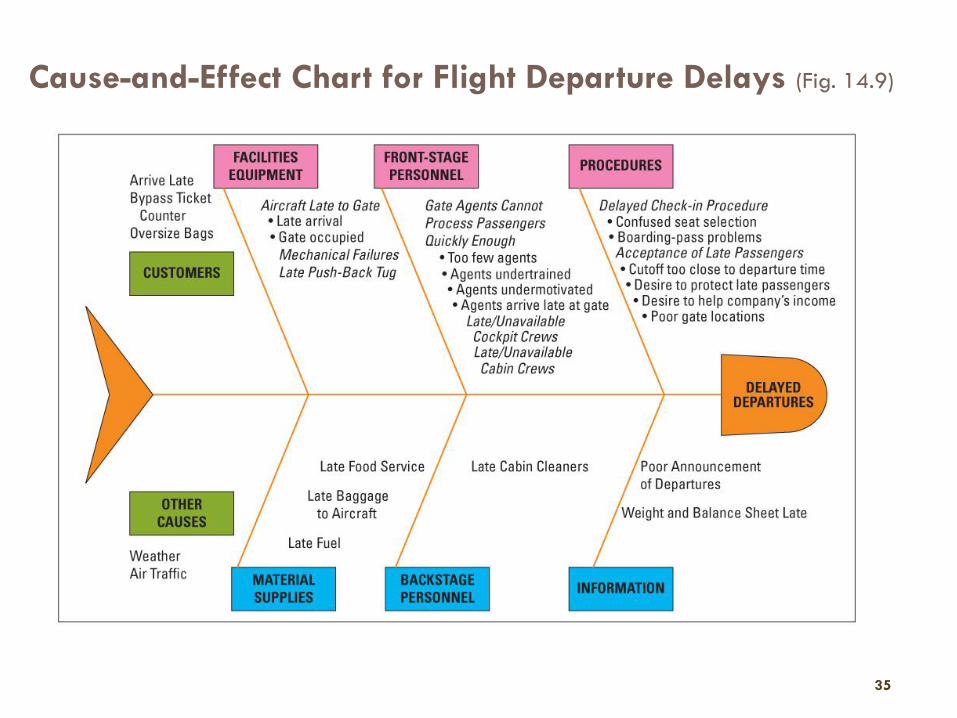
Cause-and-Effect Chart for Flight Departure Delays (Fig. 14.9)
35
35
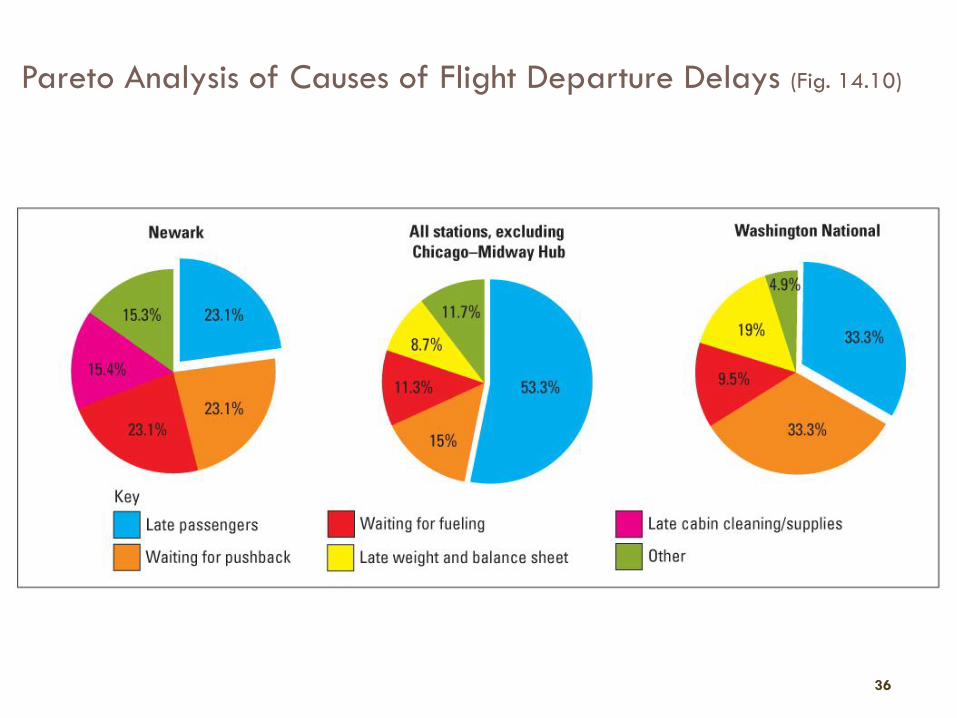
Pareto Analysis of Causes of Flight Departure Delays (Fig. 14.10)
36
36
Return On Quality (ROQ)
37
Assess costs and benefits of quality initiatives
ROQ approach is based on four assumptions:
– Quality is an investment
– Quality efforts must be financially accountable
– It’s possible to spend too much on quality
– Not all quality expenditures are equally valid
Implication: Quality improvement efforts may benefit from being related to productivity improvement programs
38
To see if new quality improvement efforts make
sense, determine costs and then relate to
anticipated customer response
Determine optimal level of reliability
Diminishing returns set in as improvements require
higher investments
Know when improving service reliability becomes
uneconomical
Return On Quality (ROQ)
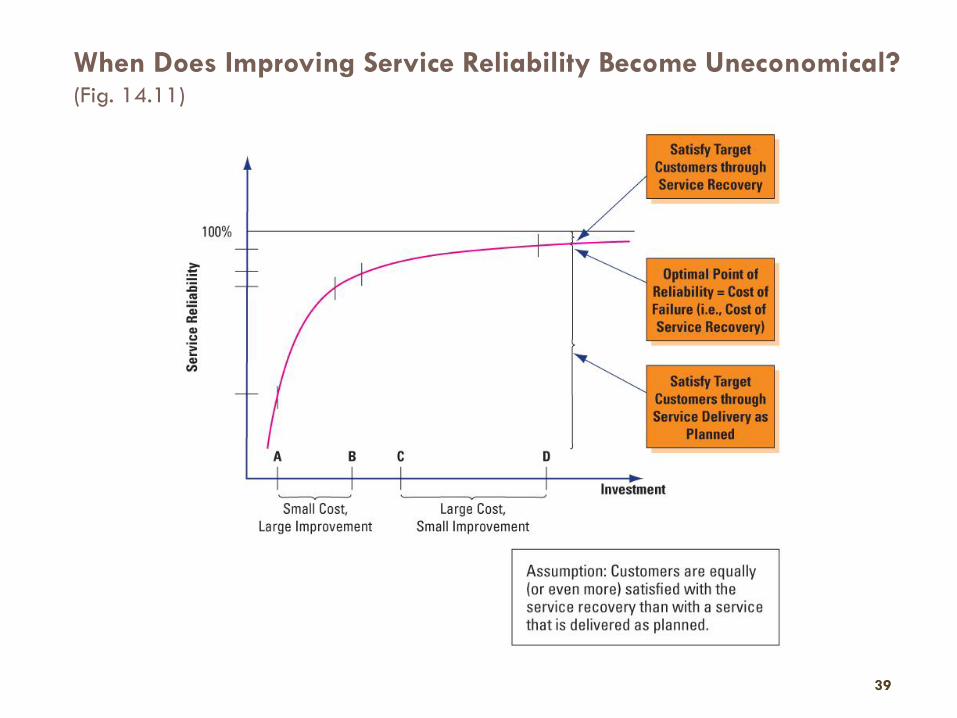
When Does Improving Service Reliability Become Uneconomical? (Fig. 14.11)
39
39
Productivity in a Service Context
Productivity measures amount of output produced relative to the amount of inputs.
Improvement in productivity means an improvement in the ratio of outputs to inputs.
Intangible nature of many service elements makes it hard to measure productivity of service firms, especially for information- based services
Difficult in most services because both input and output are hard to define
Relatively simpler in possession-processing services, as compared to information- and people-processing services
40
Service Efficiency, Productivity and Effectiveness
Efficiency: involves comparison to a standard, usually time-based (e.g., how long employee takes to perform specific task)
Problem: focus on inputs rather than outcomes
May ignore variations in service quality/value
Productivity: involves financial value of outputs to inputs
Consistent delivery of outcomes desired by customers should command higher prices
Effectiveness: degree to which firm meets goals
Cannot divorce productivity from quality and customer satisfaction
41
Discussion Question: Why is productivity a more
difficult issue for service firms? 42
Manufacturing deals with tangible elements created and assembled in an environment designed for productivity and normally excluding customers. Manufacturing procedures are usually simpler to control, and the inputs and outputs more readily measured. It is relatively easy to standardize a manufactured product.
By contrast, most services deal with intangible processes, the output is more likely to be customized, and many operational procedures take place in real time in the presence of customers with diverse needs and expectations. Service factories for people-processing services must be designed with customer satisfaction as well as productivity in mind.
In such a context, it’s more difficult to measure service inputs and outputs, harder to control the performance of employees who may be working without direct supervision, more difficult to define and measure the output of employees who work on multiple tasks rather than specializing on a single activity, and hard to control and measure the performance of customers who are actively involved in the production and delivery process.
Discussion Question: Why is productivity a more
difficult issue for service firms? 43
The services that are perhaps easiest to measure on
productivity are those that
(1) are low contact in nature so that most processes
take place backstage,
(2) engage in what is termed quasi-manufacturing (e.g.,
food service, repair, and maintenance), so that there
are significant physical inputs and outputs, or
(3) where customers are “batched” (i.e., served
simultaneously, as in a bus or a class) and their behavior
tightly controlled (airlines are a good case in point).
Generic Productivity Improvement Strategies
Typical strategies to improve service productivity:
Careful control of costs at every step in process
Efforts to reduce wasteful use of materials or labor
Matching productive capacity to average rather than peak demand levels
Replacing workers by automated machines or self-service technologies
Teaching employees how to work more productively
Broadening variety of tasks that service worker can perform
Installing expert systems that allow paraprofessionals to take on work previously performed by professionals who earn higher salaries
Although improving productivity can be approached incrementally, major gains often require redesigning entire processes
44
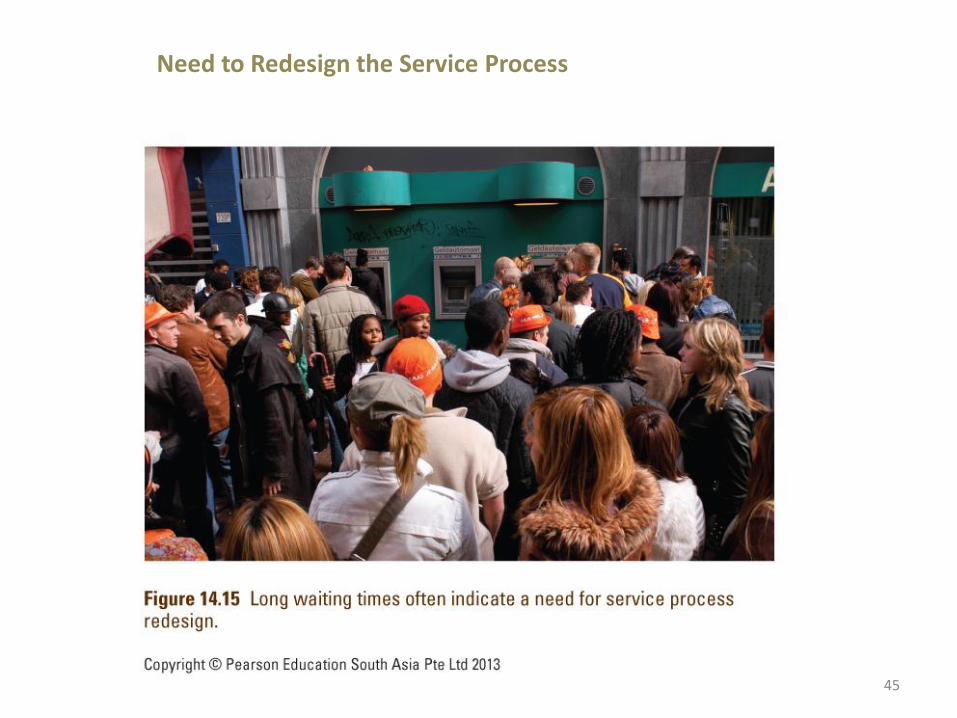
45
Need to Redesign the Service Process
Customer-driven Ways to Improve Productivity
Change timing of customer demand
By shifting demand away from peaks, managers can make better use of firm’s productive assets and provide better service
Involve customers more in production
Get customers to self-serve
Encourage customers to obtain information and buy from firm’s corporate Websites
Ask customers to use third parties
Delegate delivery of supplementary service elements to intermediary organizations
46
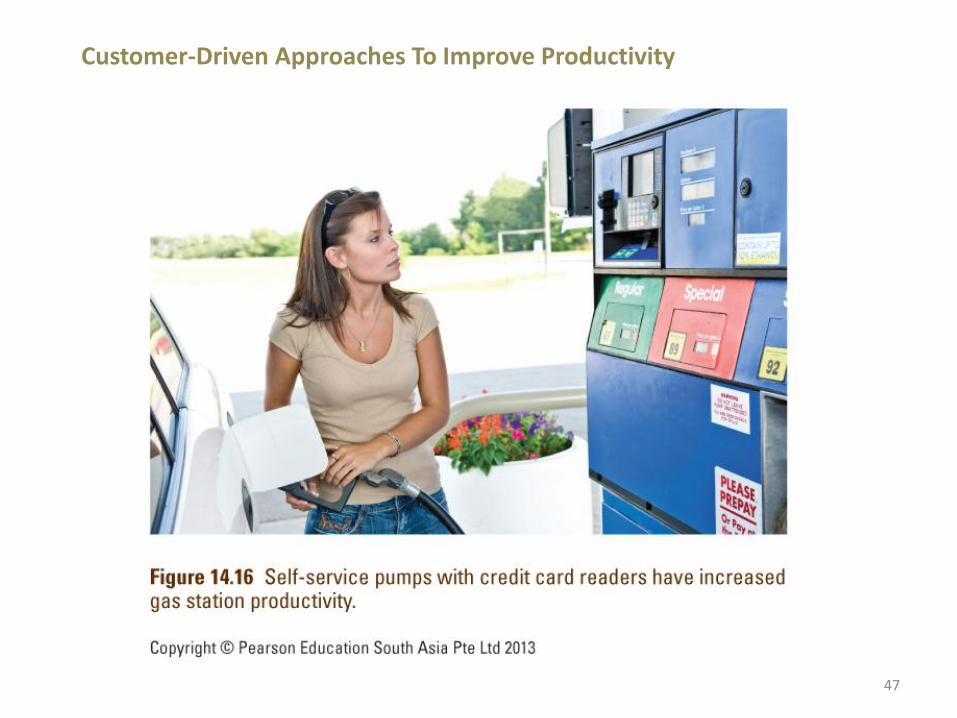
47
Customer-Driven Approaches To Improve Productivity
Backstage and Front-Stage Productivity Changes: Implications for
Customers
Front-stage productivity enhancements are especially visible in high contact services Some improvements only require passive acceptance,
while others require customers to change behavior
Must consider impacts on customers and address customer resistance to changes
Backstage changes may impact customers Keep track of proposed backstage changes, and
prepare customers for them
e.g., new printing peripherals may affect appearance of bank statements
See Service Insights 14.3 : Managing Customers’ Reluctance to Change
48
Backstage and Front-Stage Productivity Changes:
Implications for Customers 49
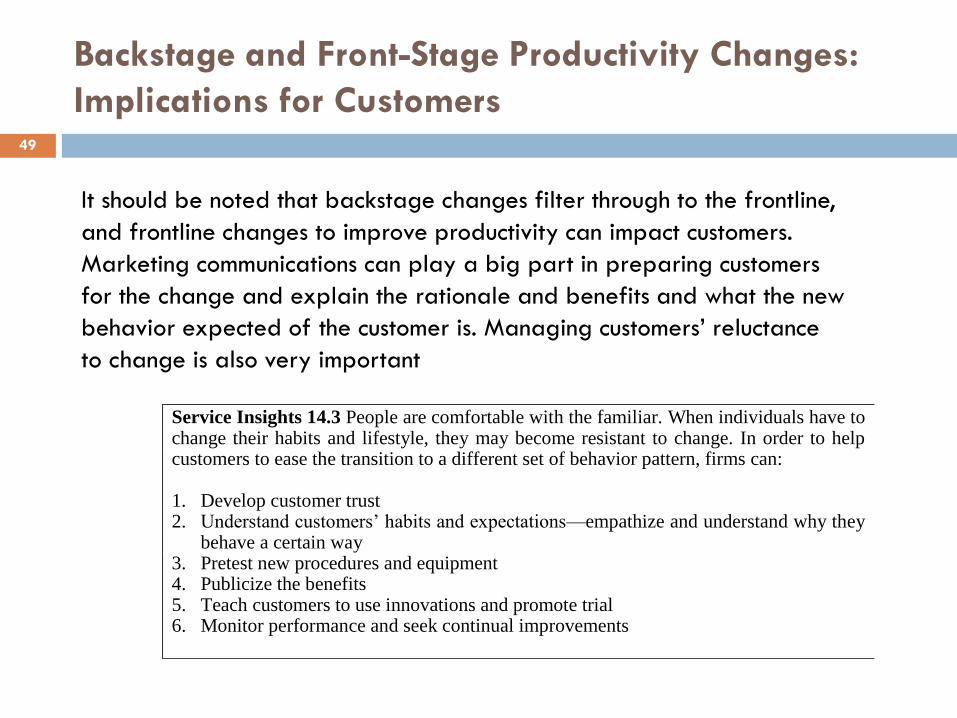
Service Insights 14.3 People are comfortable with the familiar. When individuals have to change their habits and lifestyle, they may become resistant to change. In order to help customers to ease the transition to a different set of behavior pattern, firms can: 1. Develop customer trust 2. Understand customers’ habits and expectations—empathize and understand why they
behave a certain way 3. Pretest new procedures and equipment 4. Publicize the benefits 5. Teach customers to use innovations and promote trial 6. Monitor performance and seek continual improvements
It should be noted that backstage changes filter through to the frontline,
and frontline changes to improve productivity can impact customers.
Marketing communications can play a big part in preparing customers
for the change and explain the rationale and benefits and what the new
behavior expected of the customer is. Managing customers’ reluctance
to change is also very important
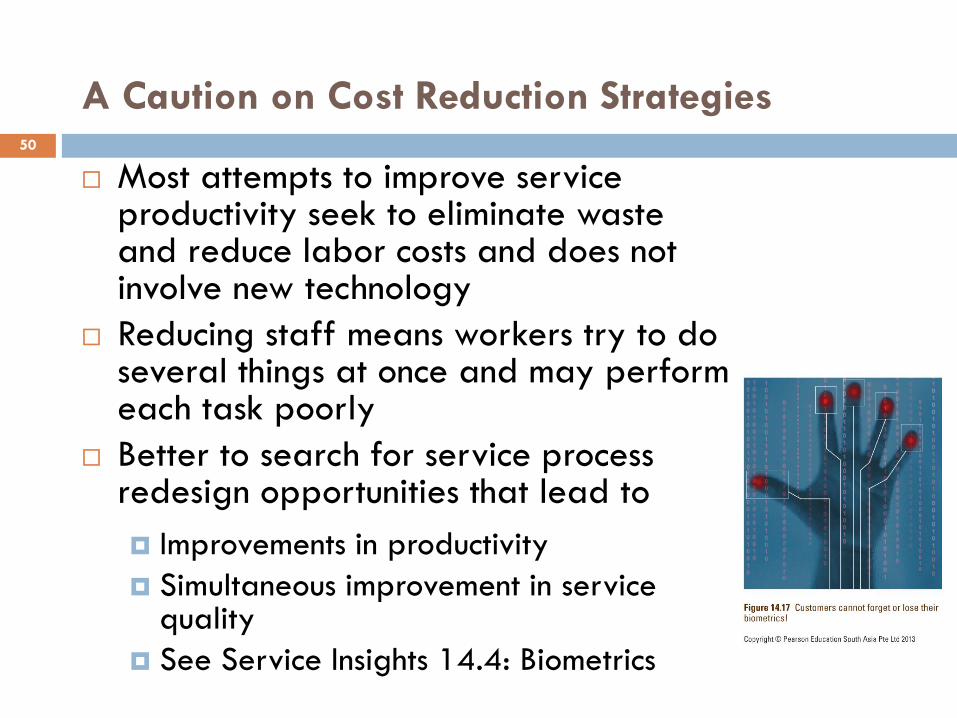
A Caution on Cost Reduction Strategies
Most attempts to improve service productivity seek to eliminate waste and reduce labor costs and does not involve new technology
Reducing staff means workers try to do several things at once and may perform each task poorly
Better to search for service process redesign opportunities that lead to
Improvements in productivity
Simultaneous improvement in service quality
See Service Insights 14.4: Biometrics
50
Summary of Chapter 14: Improving
Service Quality and Productivity (1)
Quality and productivity need to be considered jointly in marketing services
Research consolidated service quality dimensions into five Tangibles
Reliability
Responsiveness
Competence
Courtesy
GAP model is a tool to diagnose problems in service design and delivery. Service gap is the most critical and can only be closed if the other six gaps are closed
51
Summary of Chapter 14: Improving
Service Quality and Productivity (2)
Both soft and hard measures used to measure service quality
We can learn from customer feedback--key objectives:
Assessment and benchmarking of service quality and performance
Customer-driven learning and improvements
Creating a customer-oriented service culture
52
Summary of Chapter 14: Improving
Service Quality and Productivity (3)
A mix of customer feedback collection tools can help to deliver needed information to firms
Total market surveys, annual survey, and transactional surveys
Service feedback cards
Mystery shopping
Unsolicited customer feedback
Focus group discussions and service reviews
Capture unsolicited feedback
Feedback must be analyzed, reported, disseminated and used
53
Summary of Chapter 14: Improving
Service Quality and Productivity (4)
Hard measure of service quality include service index and control charts
Tools used to analyze and address service quality problems
Fishbone diagram
Pareto chart
Blueprinting
Measuring productivity in services is difficult – a -- and there is a need to determine when service reliability becomes uneconomical
Efficiency, productivity and effectiveness need to be distinguished when measuring service quality
54
Summary of Chapter 14: Improving
Service Quality and Productivity (5)
To improve service productivity, there are generic improvement strategies and customer-driven approaches
Customer-driven approaches to improving productivity include Changing timing of customer demand Involving customers more in production Asking customers to use third parties
Backstage and front-stage productivity changes both affect customers
Cost-reduction strategies should be used with caution as this may impact service quality negatively. A better way may be to look for service process redesign opportunities
55
SERVQUAL – See Appendix 14.1 (also see Table14.5 on page 464)
56
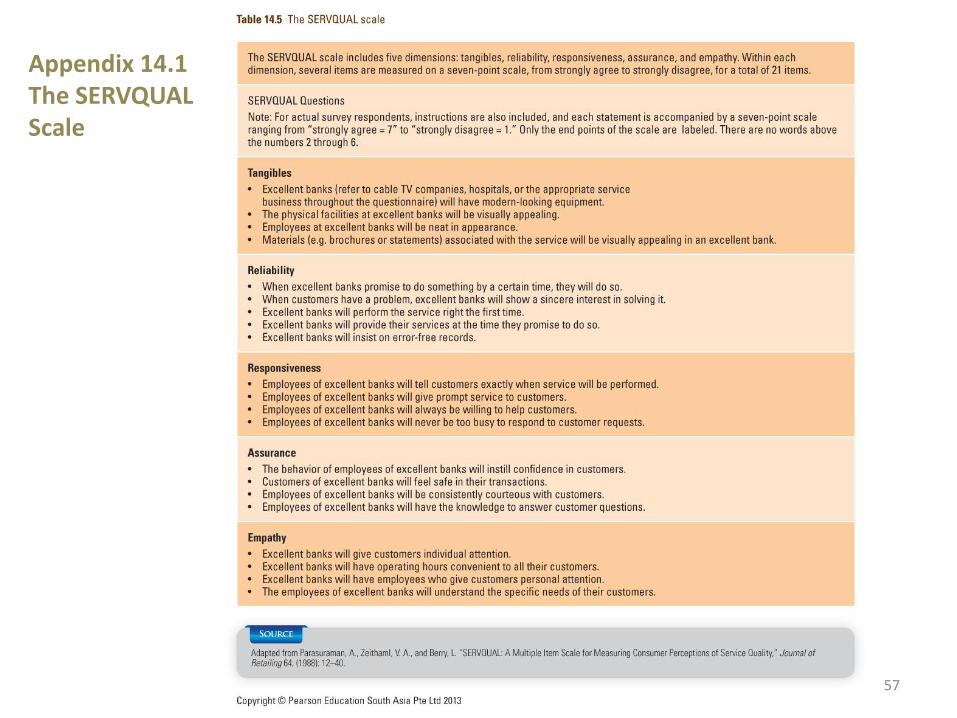
Service-based components: The SERVQUAL Scale
SERVQUAL (Appendix 14.1) is a survey research
instrument based on the premise that customers can
evaluate a firm’s service quality by comparing their
service perceptions with their prior expectations.
In its basic form, the scale contains 21 perception
items and 21 expectation items, reflecting five
dimensions of service quality:
57
Appendix 14.1 The SERVQUAL Scale

Approaches to Productivity and Quality
Improvement and Standardization (Appendix 14.3)
58
TQM and Six Sigma are established quality and productivity initiatives with their respective set of tools and methods for managing and improving service quality and productivity. ome of these tools are also now increasingly used in companies that may not have embraced the entire TQM or Six Sigma concept.
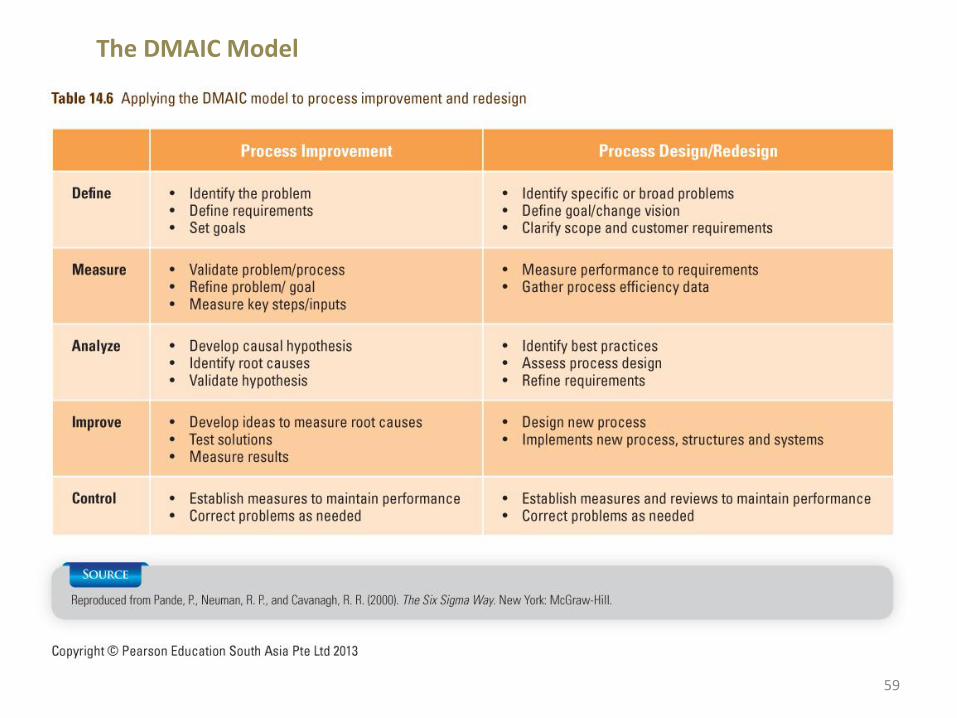
The Fishbone diagram, Pareto Analysis, and control charts are examples of tools that originated from TQM but have found their way to common use among companies interested in improving service quality. The DMAIC model, a Six Sigma improvement model, is also commonly used for analyzing and improving business processes.
59
The DMAIC Model
60
The Malcolm-Baldrige Awards and the ISO 9000 certification
comprises requirements, standards, guidelines, definitions, and
related standards that provide an independent assessment and
certification of whether companies are practicing best practices in
quality management and are a benchmark of quality
achievements.
Companies, in managing and improving quality and productivity,
should consider the approach that is best aligned with the overall
business strategy and adopt a mixture of tools from the above
systemic approaches depending on their own needs and desired
level of sophistication.
For example, TQM tools can be used at any level of sophistication
by any service firm, although the Six Sigma initiative requires
much more commitment and investments.
Approaches to Productivity and Quality
Improvement and Standardization (Appendix 14.3)

Practice Exam Essay Question:
61
List and describe each of the five service
quality (e.g. SERVQUAL) dimensions.
How does/can your lecturer for MKTG1268
Service Quality (i.e. the provider of education
as a form of service), demonstrate each of
these five dimensions
62
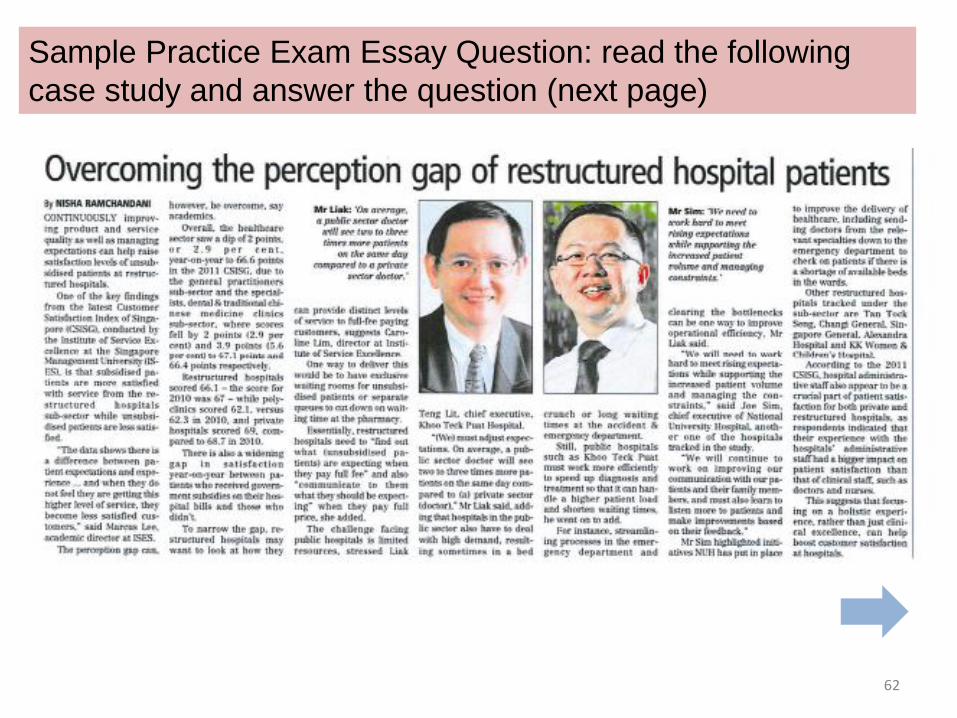
Sample Practice Exam Essay Question: read the following
case study and answer the question (next page)
Question for the exam case study:
63
• Using the GAPs model, identify THREE gaps that explain why there is a difference in the satisfaction levels between subsidized and unsubsidized patients at the restructured hospitals. Suggest FOUR ways restructured hospitals can close the gaps.