spu strategic business plan: baseline forecast
TRANSCRIPT
SPU Strategic Business Plan: Baseline Overview
SPUN Committee April 22, 2014
SPU Customer Review Panel, Noel Miller, Chair
and SPU Director Ray Hoffman
Customer Review Panel Update
• Our work: • “Near final” Baseline document presented at April 11 Panel meeting
• Action Plans review wrapping up
• Reviewing SPU efficiencies recommendations later this month.
• Rate path—ideas and options under discussion • Baseline less Efficiencies less Program Reductions plus Action Plans = Rates
• On track to finish in June
• Today’s Presentation: Overview of the Baseline
What is the Baseline?
• It projects current costs of doing business from 2015-2020, assuming: • Current operating practices
• Current levels of service
• Already approved projects continue
• Firm regulatory requirements
• It includes at least 90% of the costs to ratepayers
• It doesn’t include consideration of efficiencies, reprioritization of activities, or new investments.
Panel Review of Baseline
• We’re reviewing assumptions that go into the Baseline
• We are not deciding what assumptions to use
• We are working to help SPU clearly communicate from a customer perspective why rates continue to increase
• Major cost drivers: • Increasing cost of doing business
• Regulatory requirements
• Planned investments in aging infrastructure
• Declining demand & other cost shifts
Panel review of Baseline
• The Baseline is a thorough assessment of SPU’s cost of doing business in the 2015-2020 period.
• Different assumptions—technical or policy—would lead to different projected rate paths.
• Panel’s goal is for the Baseline to be thoroughly vetted by CBO and Council staff before the Plan is submitted to the Mayor and Council.
• Balancing act: Customers want predictable rates. The Baseline is a mechanism for holding the Utility accountable to deliver on predicted rates.
• If the baseline is too generous, there will be excess revenue on hand. • If it’s too conservative, the Utility may not be able to deliver on service level
promises without rate surcharges.
Panel’s view: SPU Today -- Notable Accomplishments • Very high quality drinking water, sourced from thousands of acres of
City-owned forested--and “carbon positive”-- watersheds
• Service area population has grown 15% in the last 20 years– but we collectively consume less total water than we did in 1959.
• This trend is expected to continue.
• It also affects demand for sewer service, which is tied to water consumption.
• Seattle’s single family residents recycle 71% of their garbage by weight—the highest rate in the nation
• The utility is pioneering new “green” approaches to treating street run-off
Panel’s View: Conservation success...and its implications
• Up-side: We’ve been very successful in promoting conservation and recycling.
• Strong environmental stewardship. • Allows deferral of additional capacity investments. • Declining demand for water per capita, and overall peak day demand lower. • Sewer volumes correspondingly decreasing. • Solid waste tonnage generally declining over last two decades • Drainage: relatively level (charged to each parcel of property in city).
• Down-side: rate pressure. • Costs of SPU’s operation are relatively fixed even as demand declines. This means
rates have to increase to generate the same amount of revenue.
Panel’s View: Some major challenges for SPU • City’s combined sewer systems are regularly overwhelmed by rain events: 37
million gallons of raw sewage spilled into Lake Washington and Puget Sound last year. Regulators require response now.
• Stormwater runoff from streets also pollutes our streets, lakes and the Sound.
• Aging water pipes are on average 67 years old.
• Aging sewer and stormwater pipes are on average 85 years old.
• Some neighborhoods face chronic flooding issues that our systems are not built to handle. At current funding, fixes for many properties over a decade away.
• Human Resources/Employee management systems are inadequate to needs.
• Utility tax rates are much higher than the state average, compounding affordability issues.
• Low income ratepayers need assistance to pay bills.
Description of Baseline Rate Path
• Definition: Rates we would need to charge customers if we were to continue business as usual, plus meet firm regulatory requirements
• From 2015-2020, baseline rates increase, on average, 4.6% per year
• This is significantly higher than the 2.4% general rate of inflation projected for Seattle during that timeframe
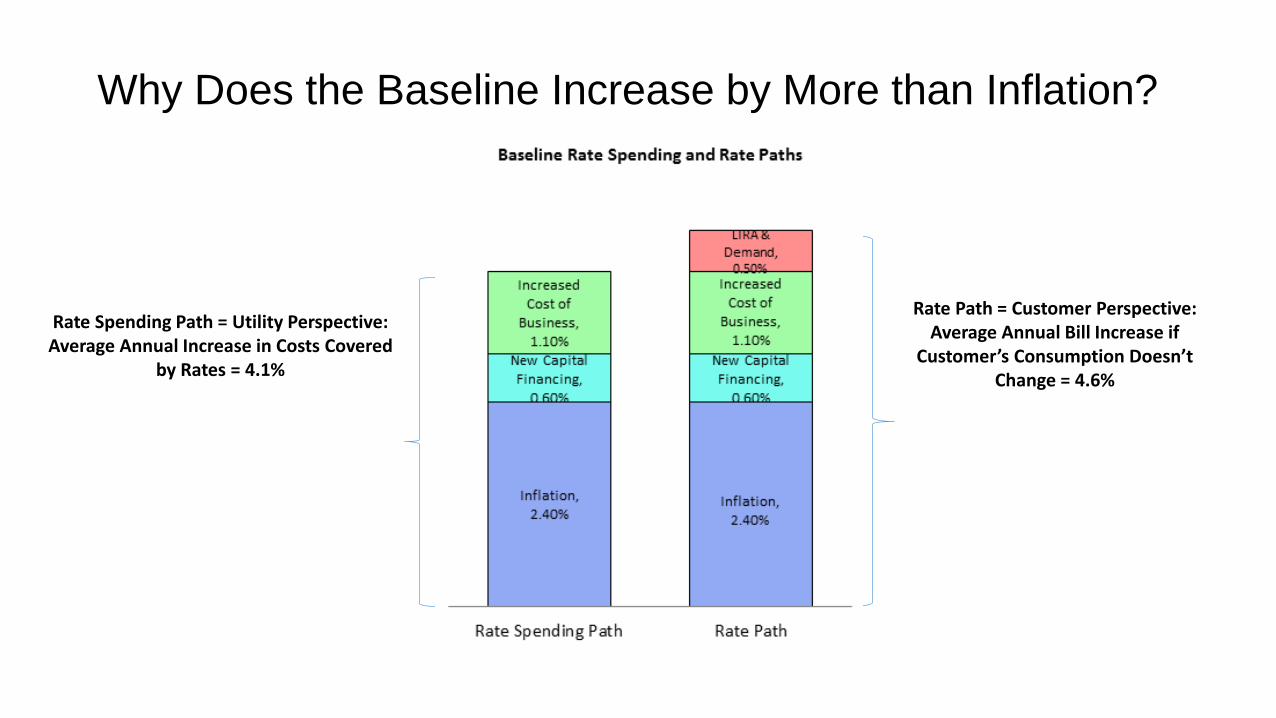
Why Does the Baseline Increase by More than Inflation?
Rate Spending Path = Utility Perspective: Average Annual Increase in Costs Covered
by Rates = 4.1%
Rate Path = Customer Perspective: Average Annual Bill Increase if
Customer’s Consumption Doesn’t Change = 4.6%
What’s Covered in Inflation?
• 31% of SPU’s 2014 spending requirement is for large service contracts, including:
• Payments to contractors for collection of garbage, organics, recycling; and hauling, processing, disposal
• Payments to King County for sewage treatment
• These costs increase by no more than inflation over the six-year period
• SPU’s O&M costs, taxes, and capital financing comprise the remaining 69% of the 2014 spending requirement:
• These costs increase by more than inflation, as described in the following slides
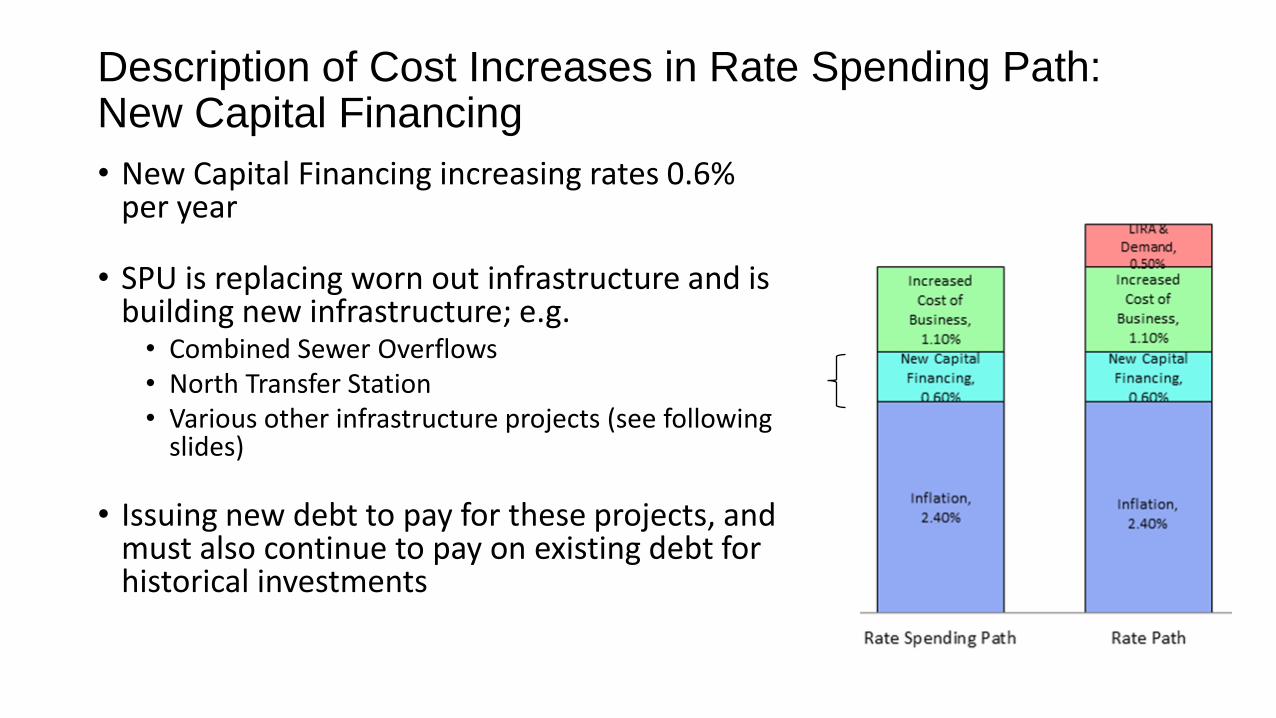
Description of Cost Increases in Rate Spending Path: New Capital Financing
• New Capital Financing increasing rates 0.6% per year
• SPU is replacing worn out infrastructure and is building new infrastructure; e.g.
• Combined Sewer Overflows • North Transfer Station • Various other infrastructure projects (see following
slides)
• Issuing new debt to pay for these projects, and must also continue to pay on existing debt for historical investments
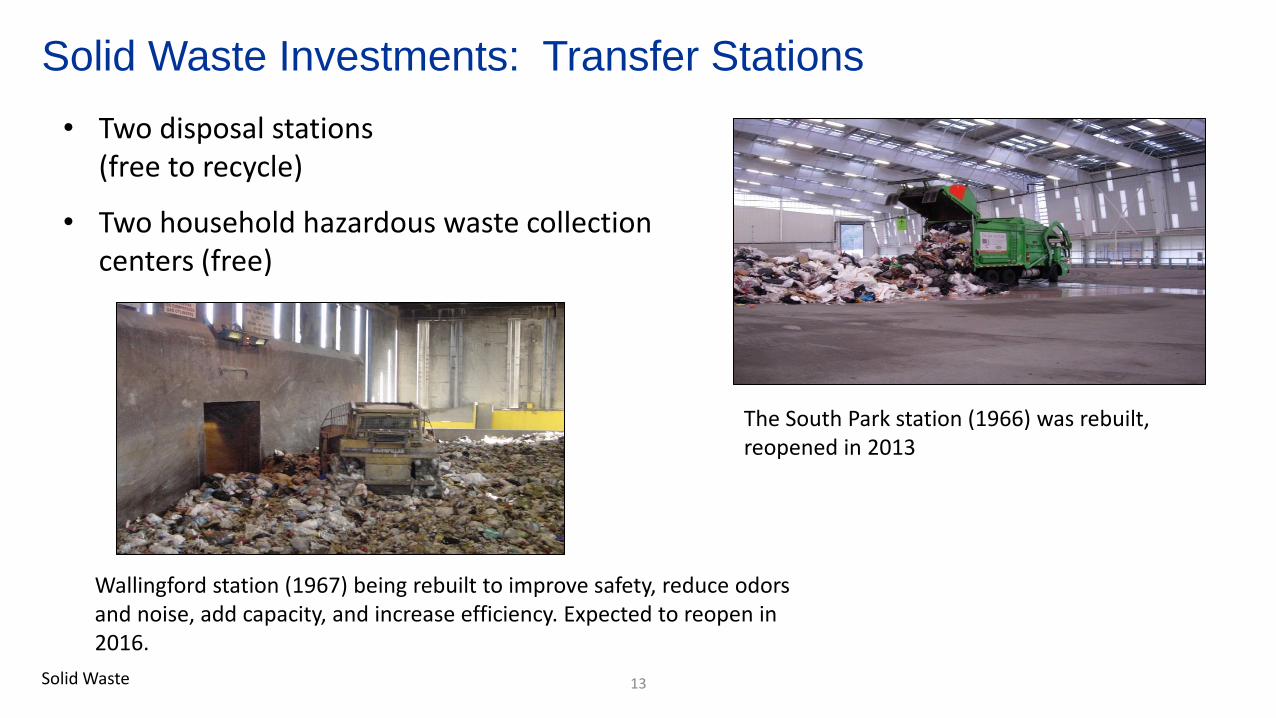
Solid Waste Investments: Transfer Stations
• Two disposal stations (free to recycle)
• Two household hazardous waste collection centers (free)
Wallingford station (1967) being rebuilt to improve safety, reduce odors and noise, add capacity, and increase efficiency. Expected to reopen in 2016.
The South Park station (1966) was rebuilt, reopened in 2013
Solid Waste 13
Drainage & Wastewater
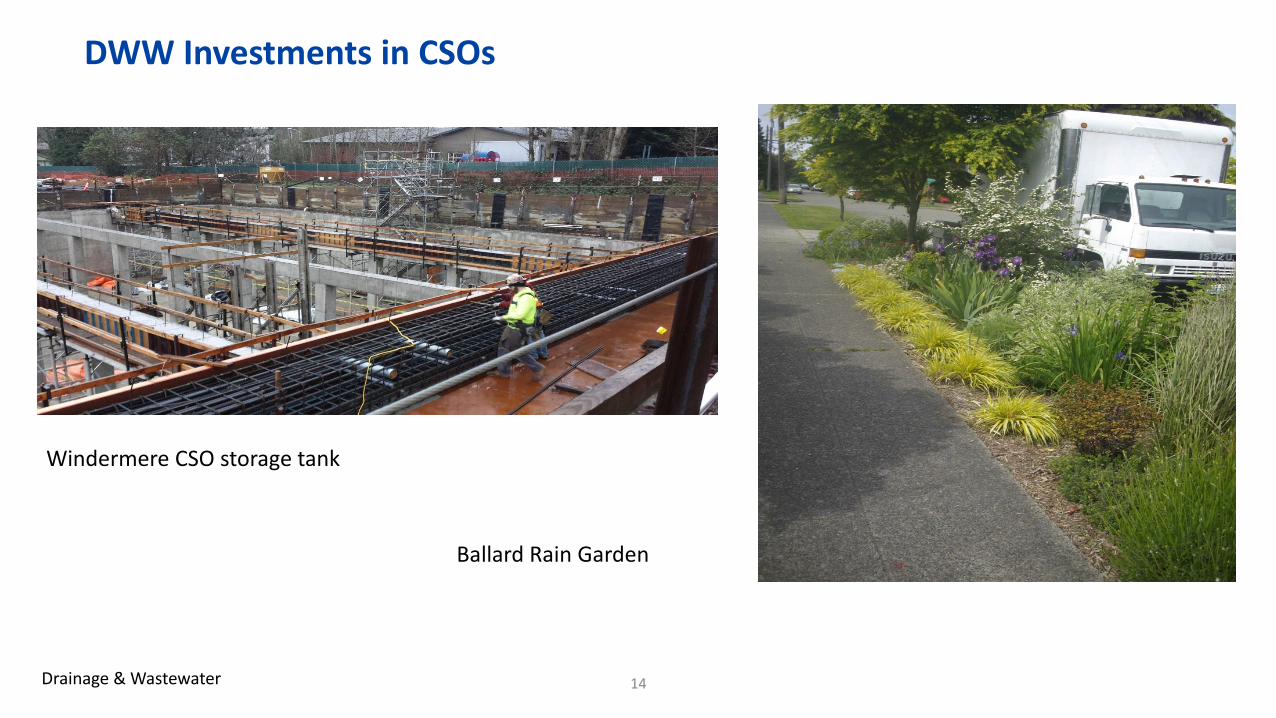
DWW Investments in CSOs
14
Windermere CSO storage tank
Ballard Rain Garden
Drainage & Wastewater
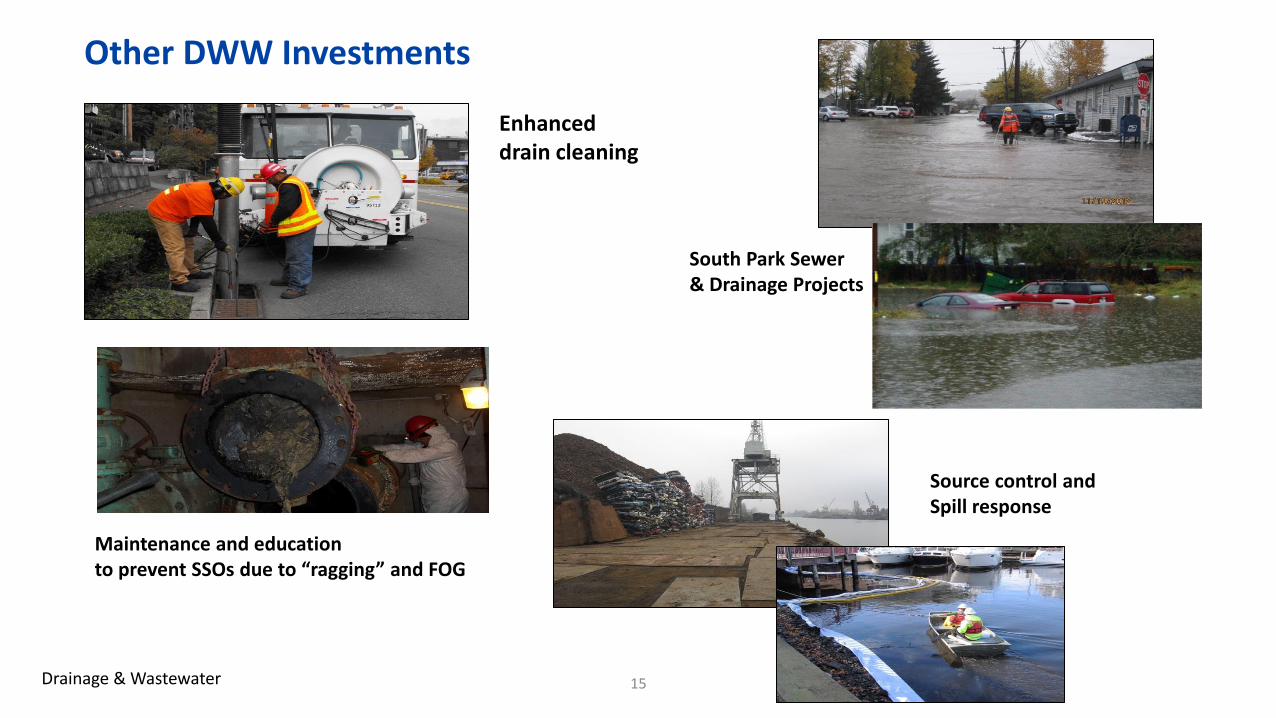
Other DWW Investments
15
South Park Sewer & Drainage Projects
Enhanced drain cleaning
Maintenance and education to prevent SSOs due to “ragging” and FOG
Source control and Spill response
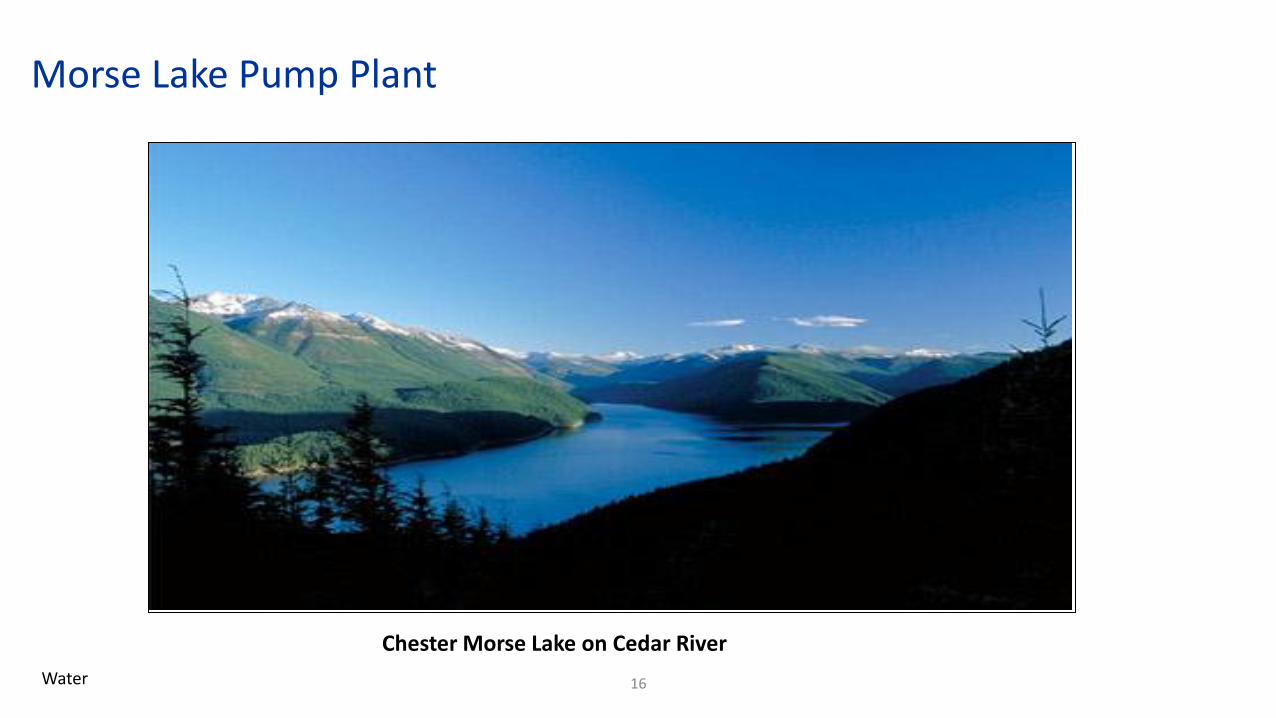
Morse Lake Pump Plant
Chester Morse Lake on Cedar River
16 Water
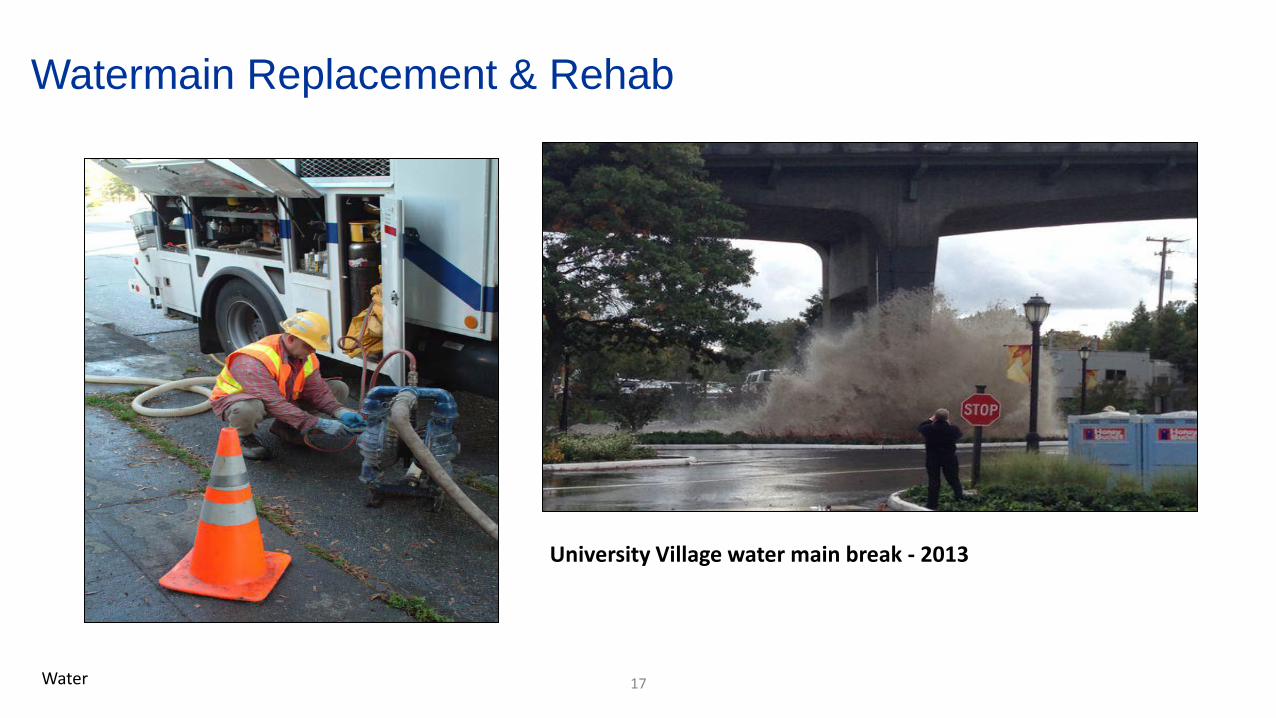
Watermain Replacement & Rehab
17
University Village water main break - 2013
Water
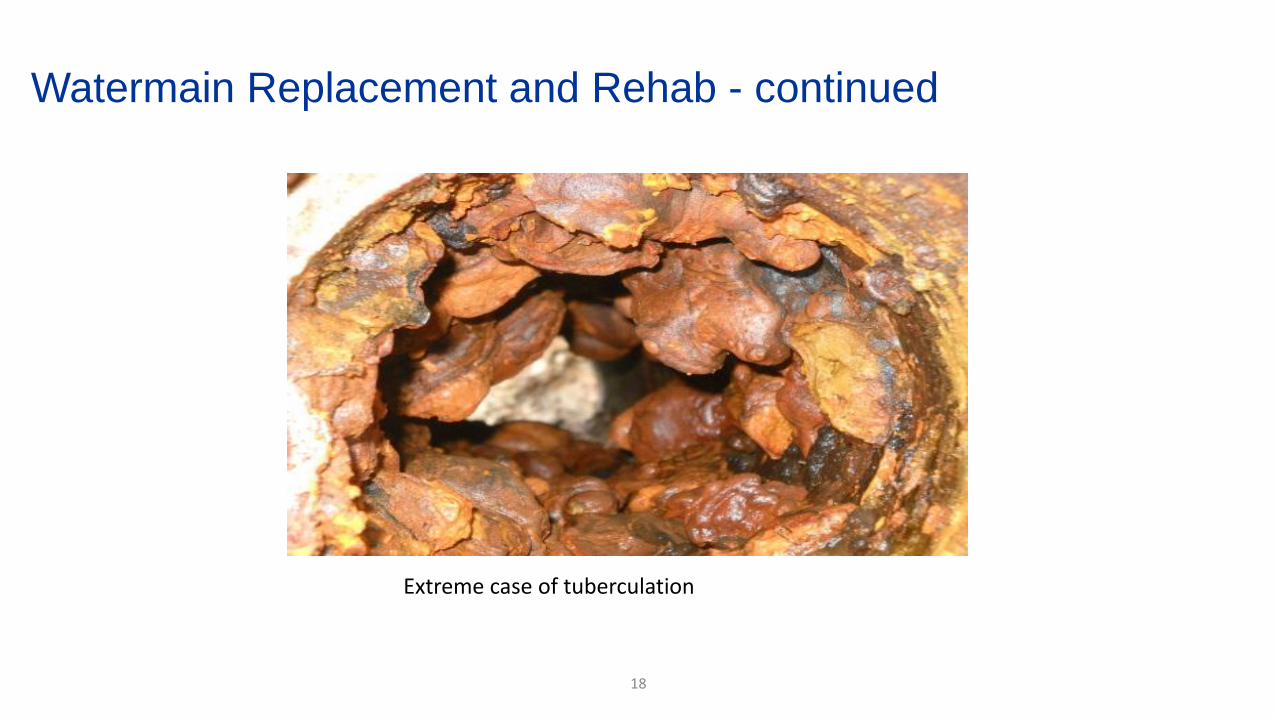
Watermain Replacement and Rehab - continued
18
Extreme case of tuberculation
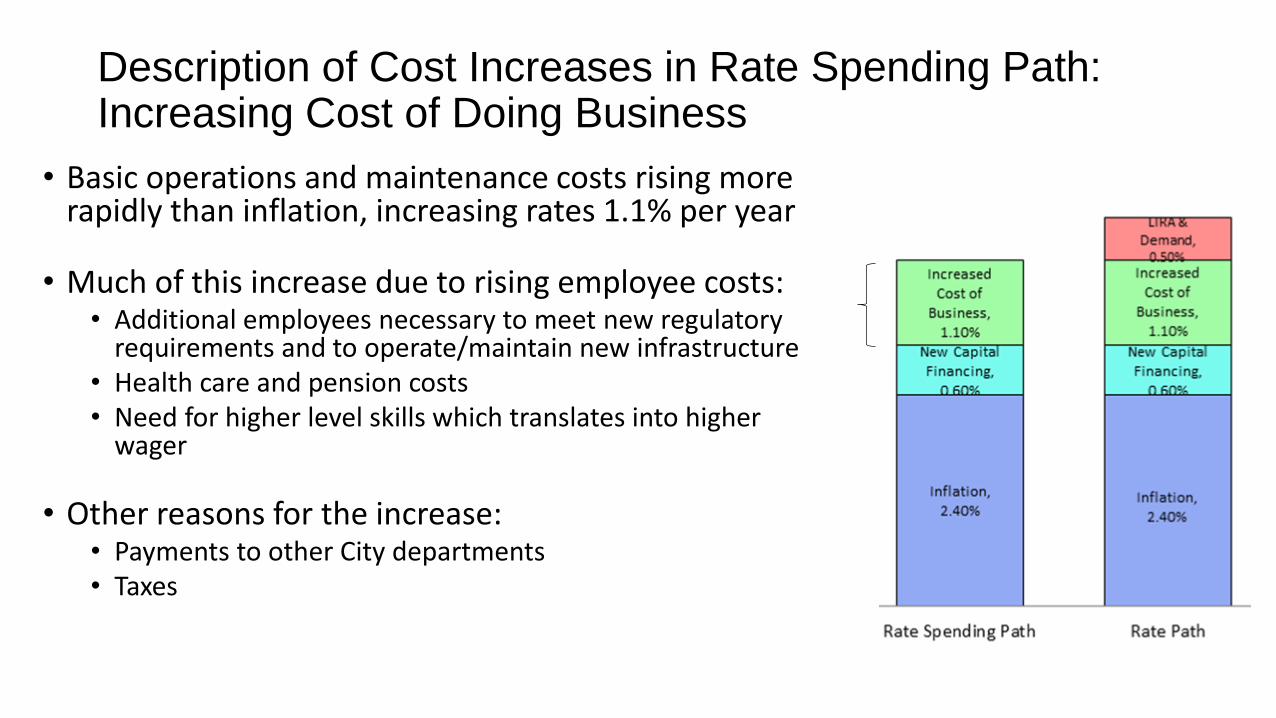
Description of Cost Increases in Rate Spending Path: Increasing Cost of Doing Business
• Basic operations and maintenance costs rising more rapidly than inflation, increasing rates 1.1% per year
• Much of this increase due to rising employee costs: • Additional employees necessary to meet new regulatory
requirements and to operate/maintain new infrastructure • Health care and pension costs • Need for higher level skills which translates into higher
wager
• Other reasons for the increase: • Payments to other City departments • Taxes
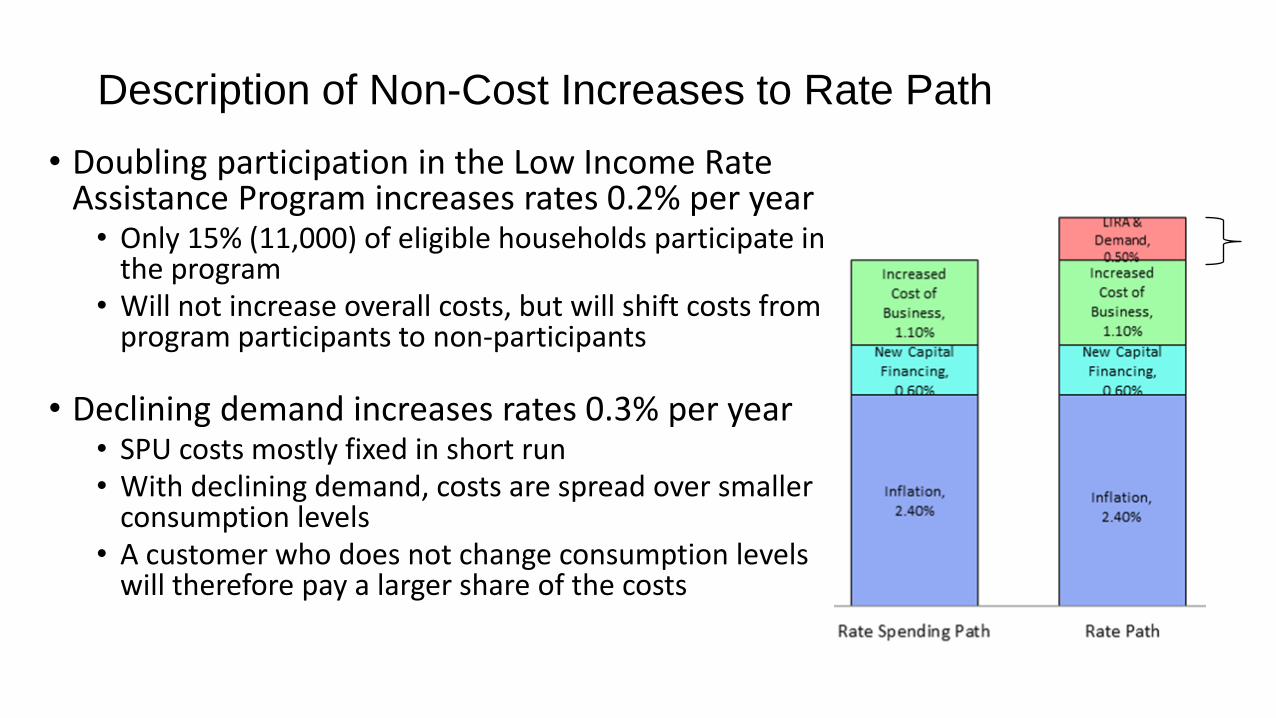
Description of Non-Cost Increases to Rate Path
• Doubling participation in the Low Income Rate Assistance Program increases rates 0.2% per year
• Only 15% (11,000) of eligible households participate in the program
• Will not increase overall costs, but will shift costs from program participants to non-participants
• Declining demand increases rates 0.3% per year • SPU costs mostly fixed in short run • With declining demand, costs are spread over smaller
consumption levels • A customer who does not change consumption levels
will therefore pay a larger share of the costs
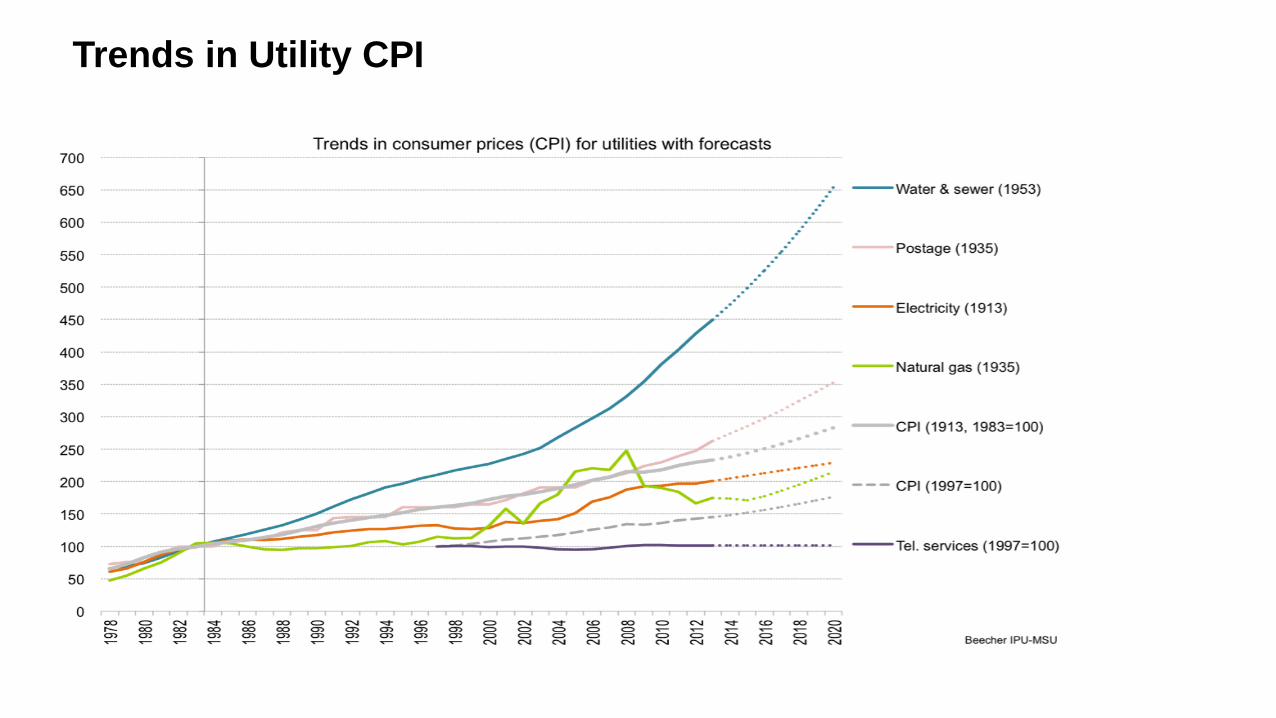
Trends in Utility CPI