spring 2012 practice questions. security analysis (spring 2012)asif ali qureshi, cfa question # 1...
TRANSCRIPT

Spring 2012
Practice Questions
Security Analysis (Spring 2012) Asif Ali Qureshi, CFA
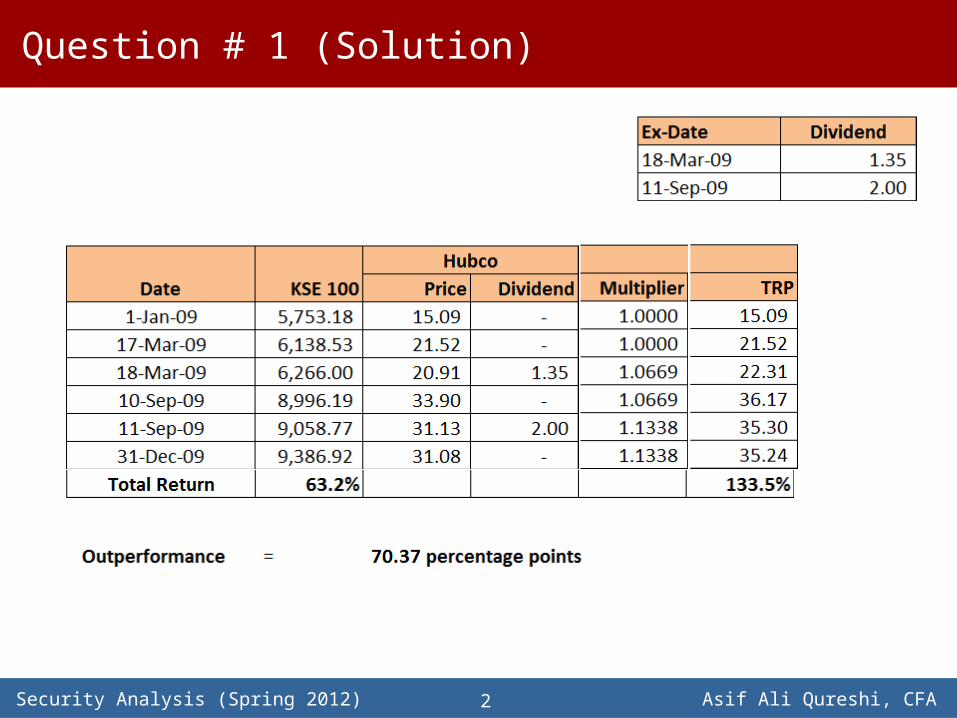
Question # 1 (Solution)
2
Security Analysis (Spring 2012) Asif Ali Qureshi, CFA
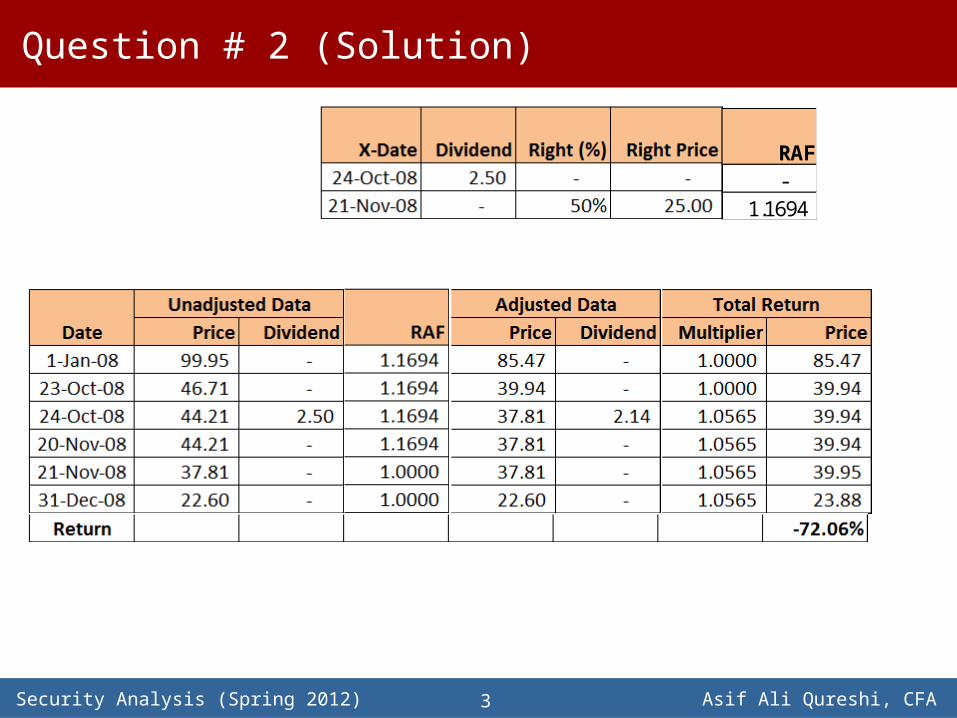
Question # 2 (Solution)
3
RAF-
1.1694
Security Analysis (Spring 2012) Asif Ali Qureshi, CFA
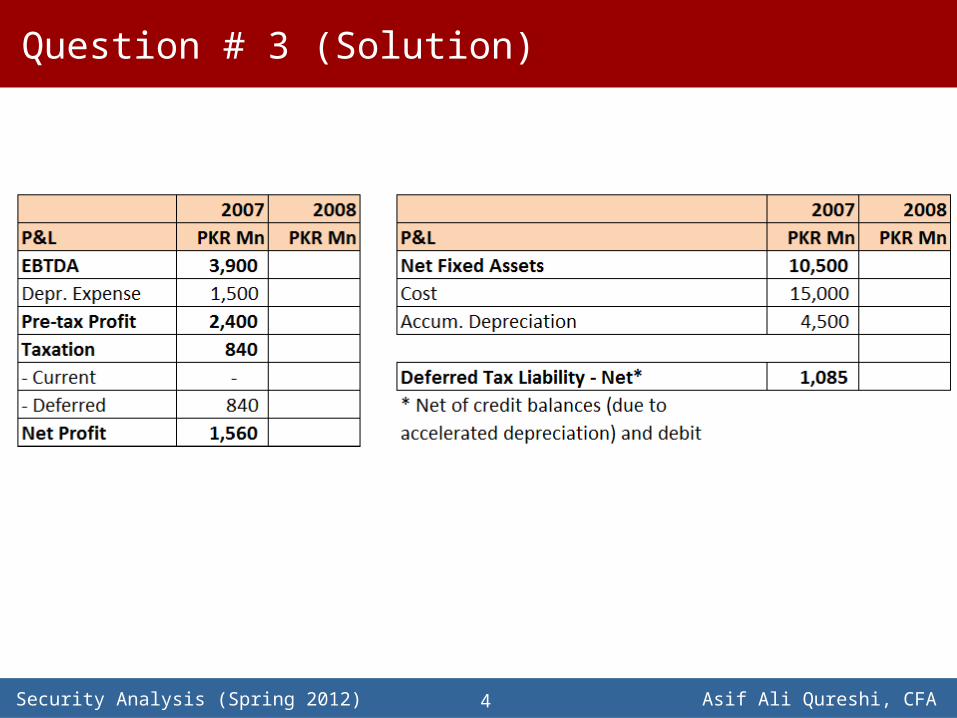
Question # 3 (Solution)
4

Security Analysis (Spring 2012) Asif Ali Qureshi, CFA
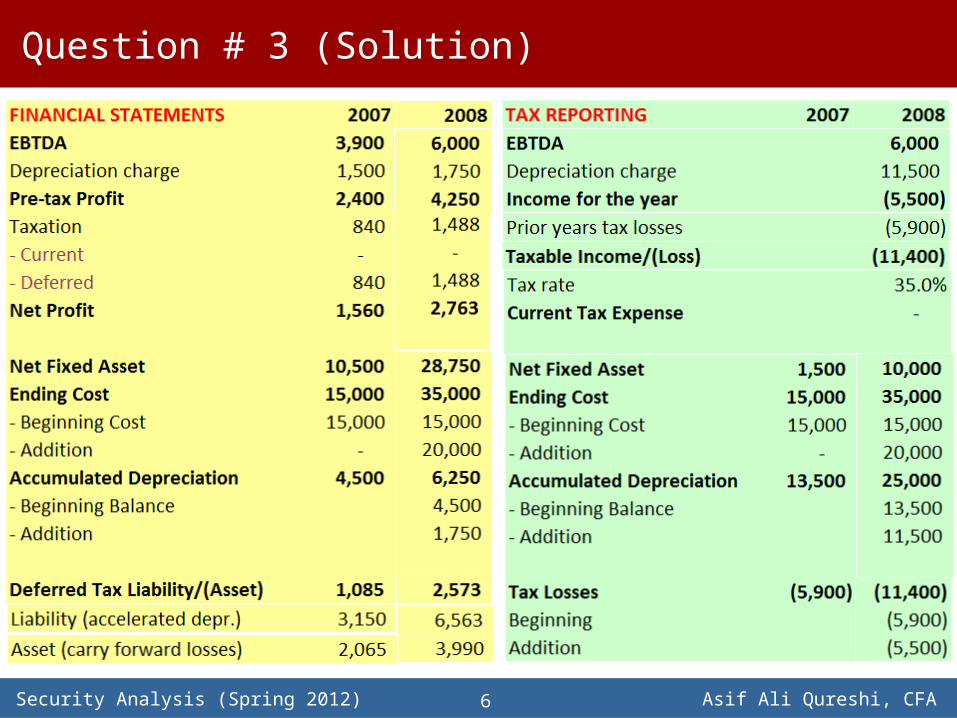
Question # 3 (Solution)
5
Security Analysis (Spring 2012) Asif Ali Qureshi, CFA
Question # 3 (Solution)
6
Security Analysis (Spring 2012) Asif Ali Qureshi, CFA
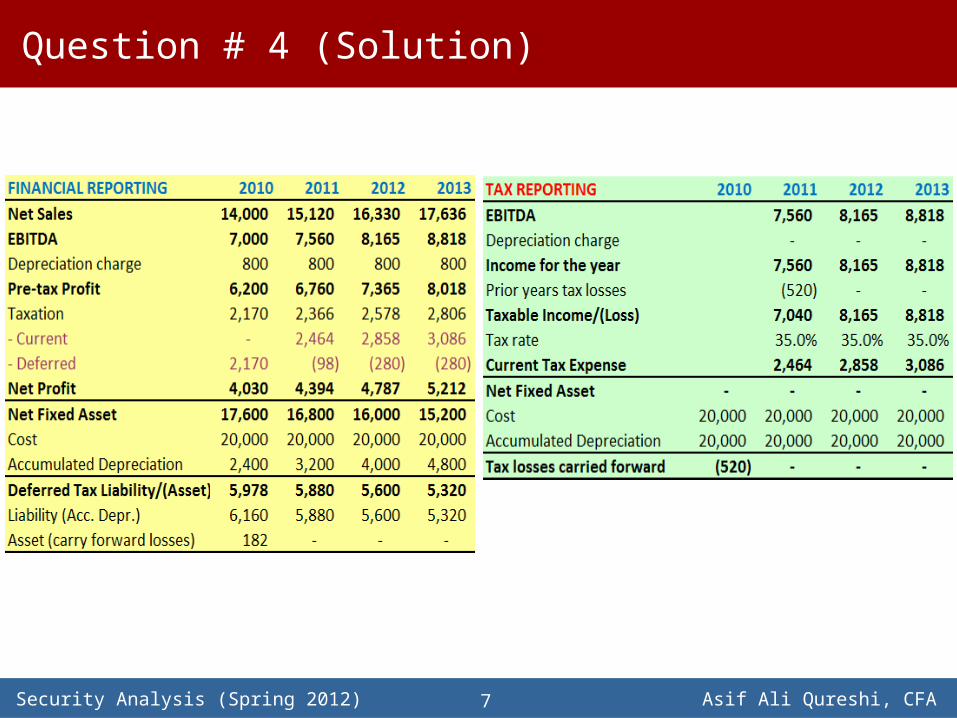
Question # 4 (Solution)
7
Security Analysis (Spring 2012) Asif Ali Qureshi, CFA
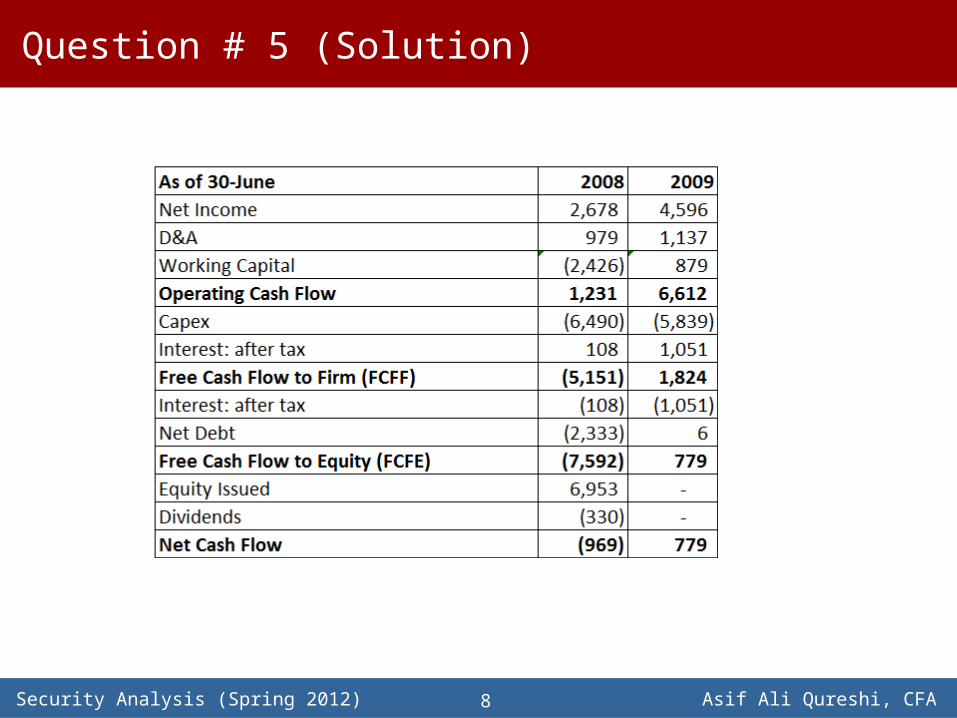
Question # 5 (Solution)
8
Security Analysis (Spring 2012) Asif Ali Qureshi, CFA
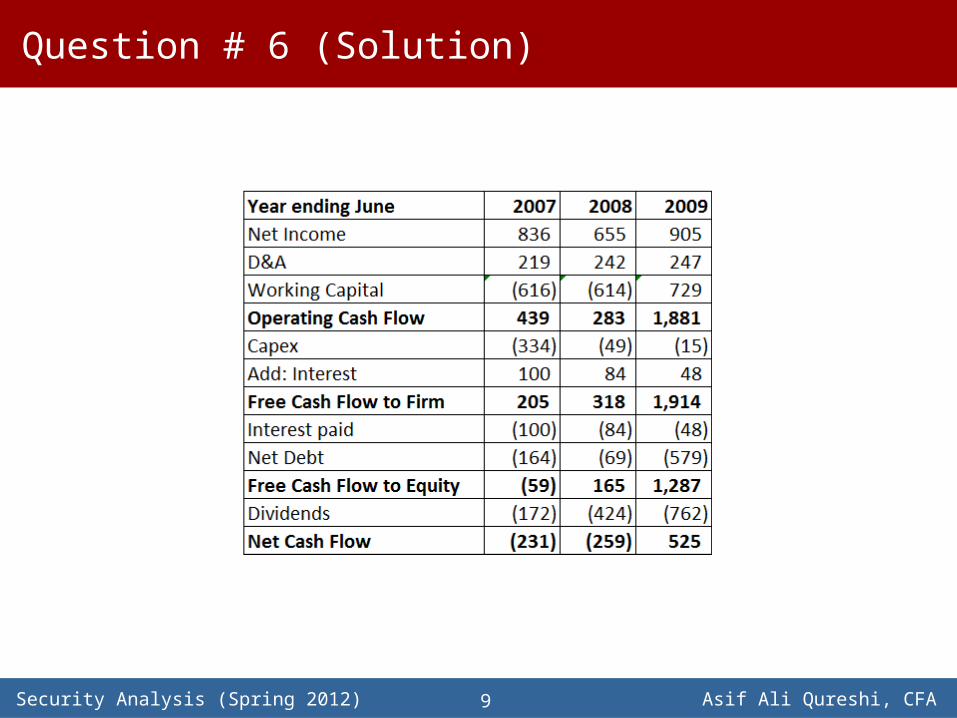
Question # 6 (Solution)
9
Security Analysis (Spring 2012) Asif Ali Qureshi, CFA
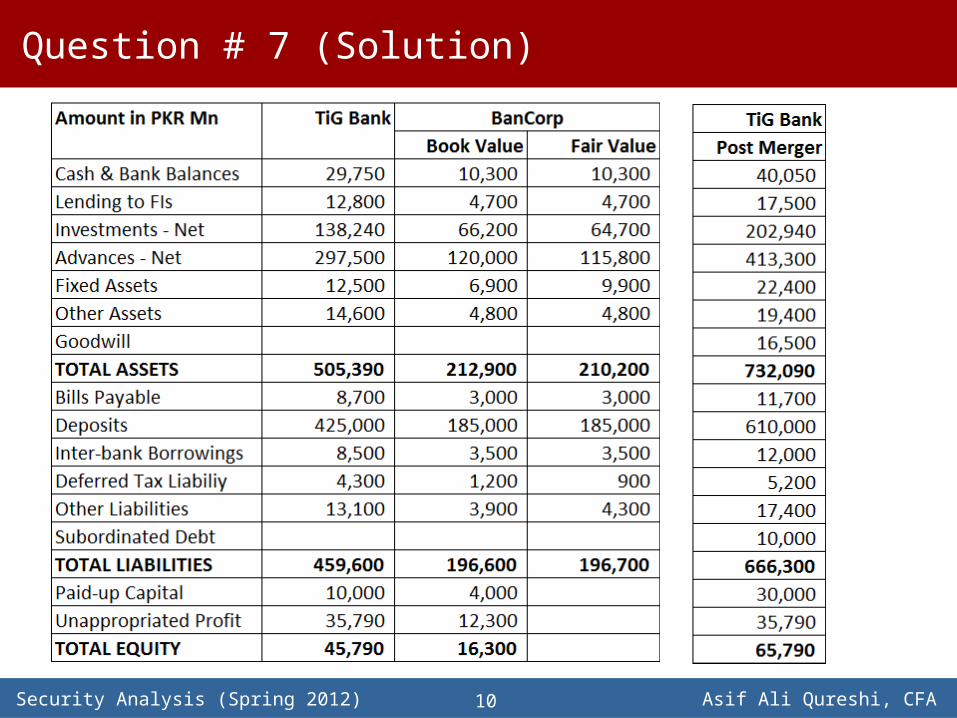
Question # 7 (Solution)
10
Security Analysis (Spring 2012) Asif Ali Qureshi, CFA
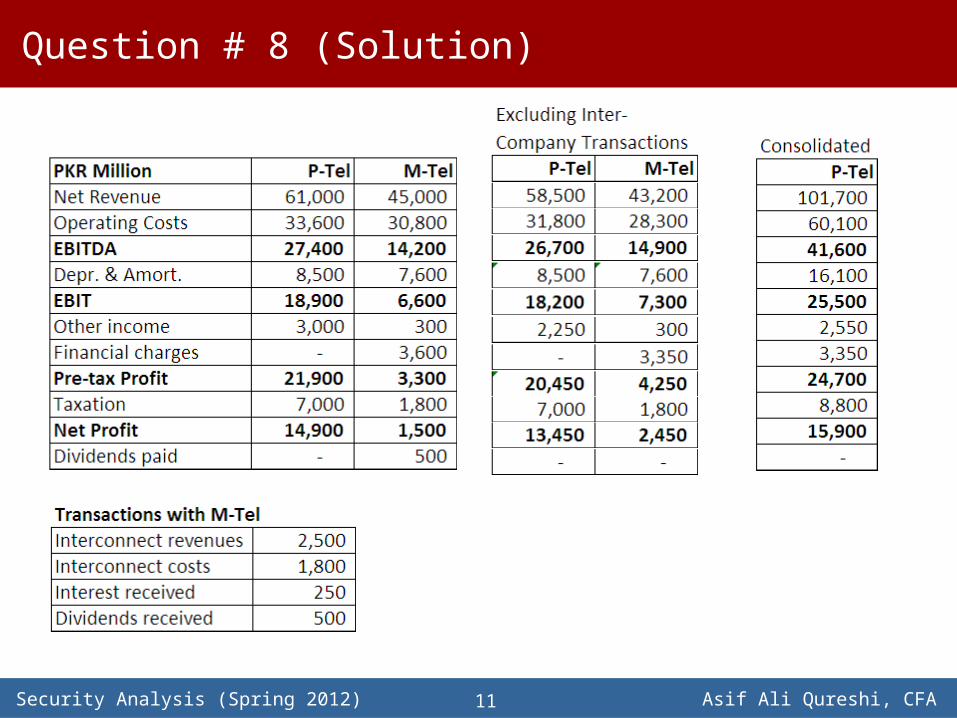
Question # 8 (Solution)
11
Security Analysis (Spring 2012) Asif Ali Qureshi, CFA
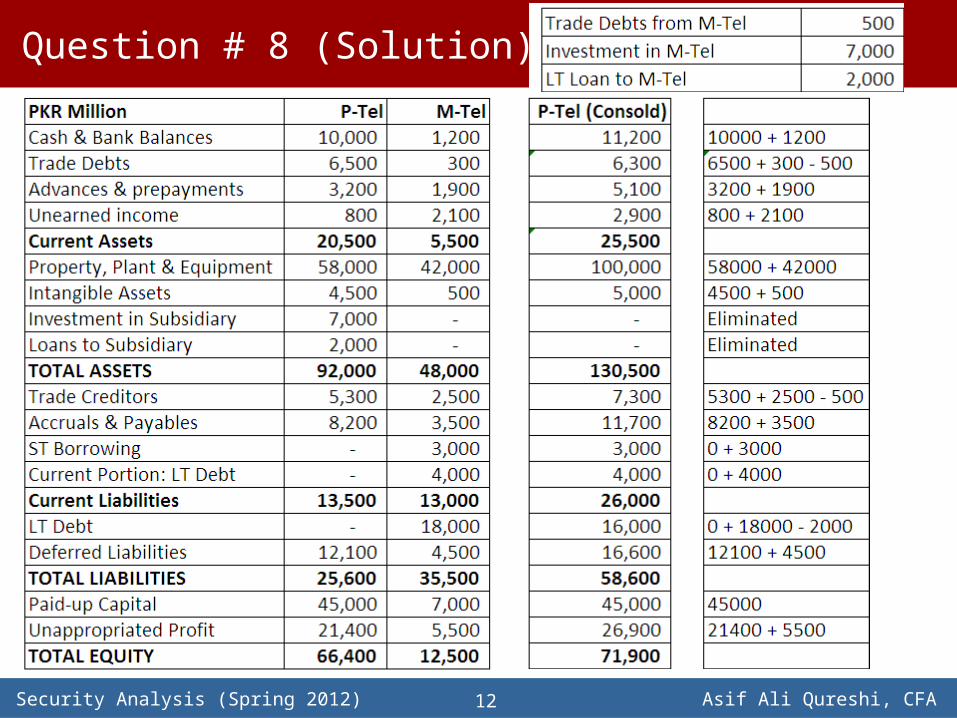
Question # 8 (Solution)
12
Spring 2012
Estimating Earning per Share (EPS)
Security Analysis (Spring 2012) Asif Ali Qureshi, CFA14
Earnings per Share (EPS)
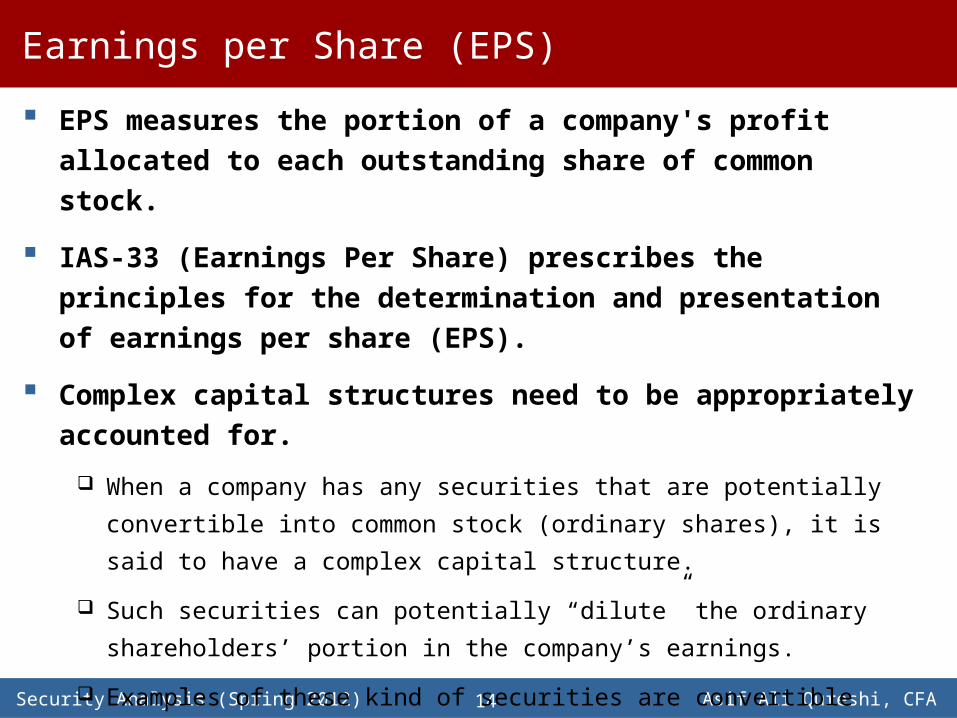
EPS measures the portion of a company's profit allocated to each outstanding share of common stock.
IAS-33 (Earnings Per Share) prescribes the principles for the determination and presentation of earnings per share (EPS).
Complex capital structures need to be appropriately accounted for.
When a company has any securities that are potentially convertible into common
stock (ordinary shares), it is said to have a complex capital structure.
Such securities can potentially “dilute” the ordinary shareholders’ portion in the
company’s earnings.
Examples of these kind of securities are convertible bonds, convertible preferred
stock, employee stock options and warrants.
Security Analysis (Spring 2012) Asif Ali Qureshi, CFA15
Basic EPS
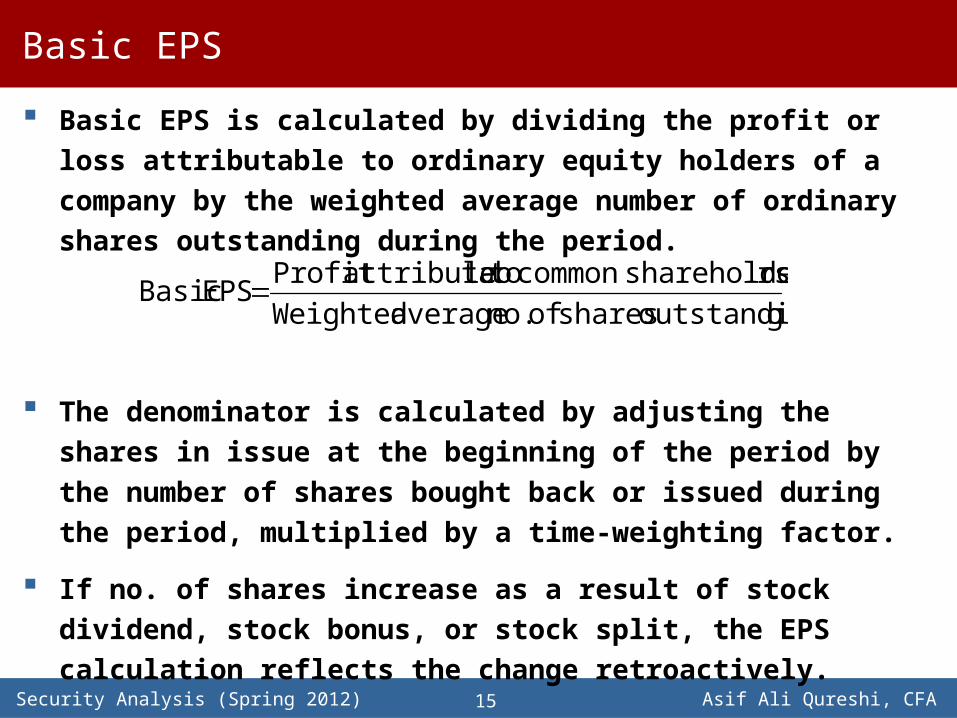
Basic EPS is calculated by dividing the profit or loss attributable to ordinary equity holders of a company by the weighted average number of ordinary shares outstanding during the period.
The denominator is calculated by adjusting the shares in issue at the beginning of the period by the number of shares bought back or issued during the period, multiplied by a time-weighting factor.
If no. of shares increase as a result of stock dividend, stock bonus, or stock split, the EPS calculation reflects the change retroactively.
goutstandin sharesof no. average Weightedrsshareholde common to leattributab Profit
EPS Basic
Security Analysis (Spring 2012) Asif Ali Qureshi, CFA16
Example 1: Basic EPS
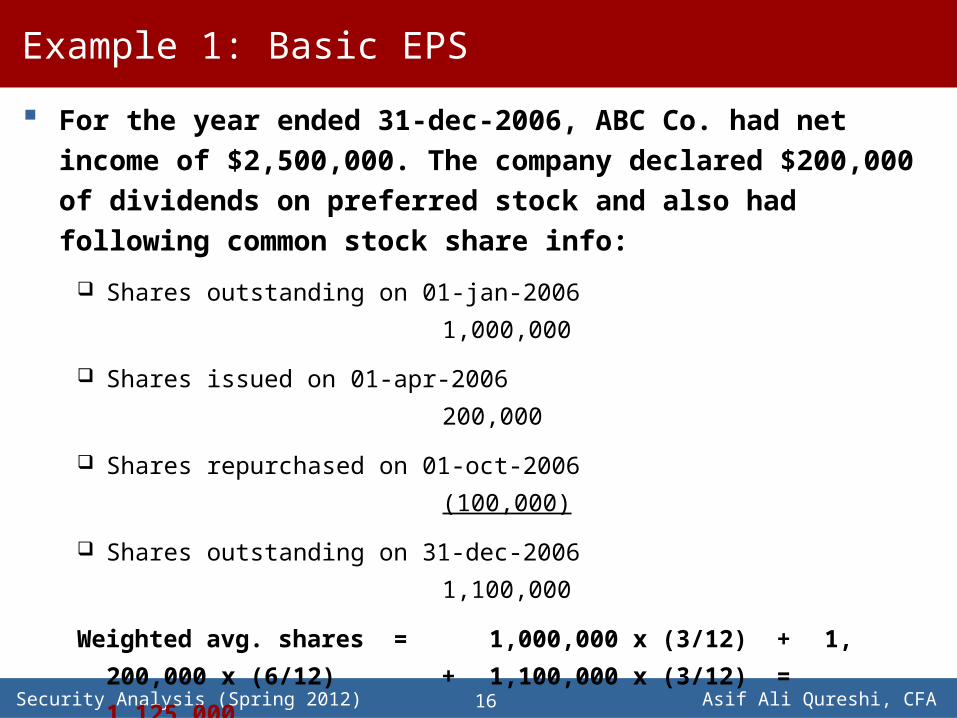
For the year ended 31-dec-2006, ABC Co. had net income of $2,500,000. The company declared $200,000 of dividends on preferred stock and also had following common stock share info:
Shares outstanding on 01-jan-2006 1,000,000
Shares issued on 01-apr-2006 200,000
Shares repurchased on 01-oct-2006 (100,000)
Shares outstanding on 31-dec-2006 1,100,000
Weighted avg. shares = 1,000,000 x (3/12) + 1, 200,000 x
(6/12) + 1,100,000 x (3/12) = 1,125,000
Basic EPS = ($2,500,000 – $200,000) / 1,125,000 = $2.04
Security Analysis (Spring 2012) Asif Ali Qureshi, CFA
Bonus issue
In a capitalization or bonus issue or a share split, ordinary shares are issued to existing equity holders for no additional consideration.
The number of ordinary shares outstanding is increased without an increase in resources.
The number of ordinary shares outstanding before the event is adjusted for the proportionate change in the number of ordinary shares outstanding as if the event had occurred at the beginning of the earliest period presented.
17
Security Analysis (Spring 2012) Asif Ali Qureshi, CFA
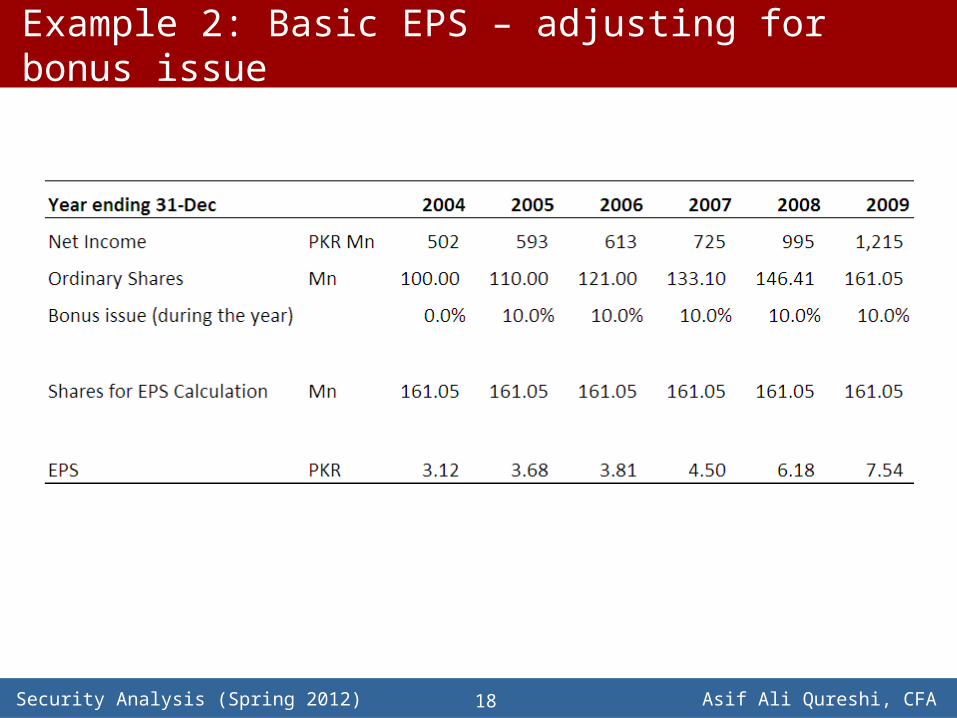
Example 2: Basic EPS – adjusting for bonus issue
18
Security Analysis (Spring 2012) Asif Ali Qureshi, CFA
Rights Issue
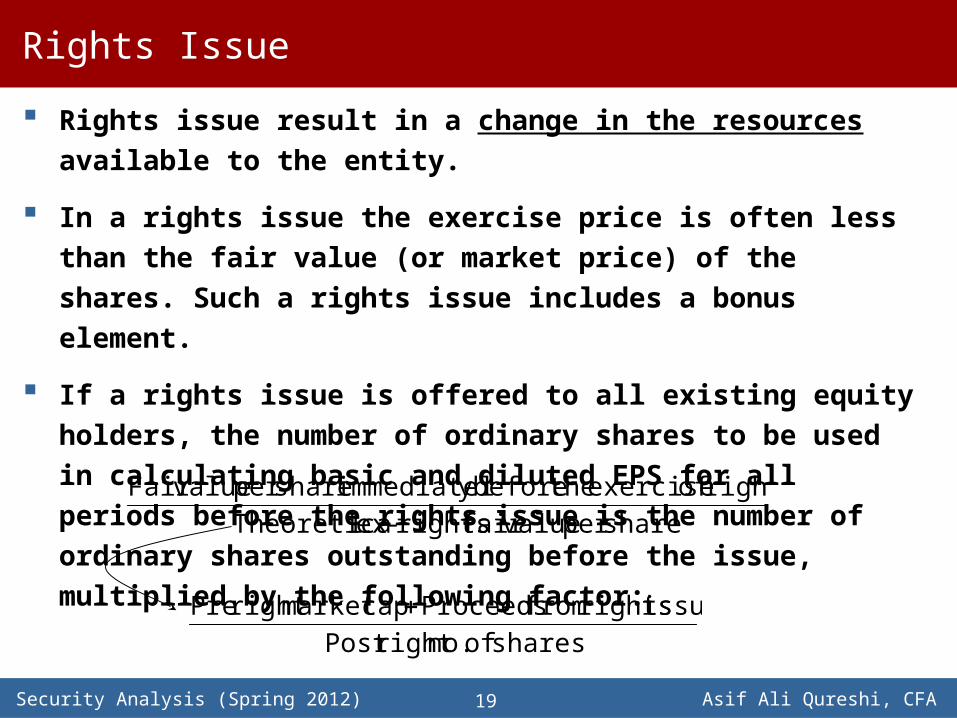
Rights issue result in a change in the resources available to the entity.
In a rights issue the exercise price is often less than the fair value (or market price) of the shares. Such a rights issue includes a bonus element.
If a rights issue is offered to all existing equity holders, the number of ordinary shares to be used in calculating basic and diluted EPS for all periods before the rights issue is the number of ordinary shares outstanding before the issue, multiplied by the following factor:
19
share per value fair rights-ex lTheoreticarightsof exercise the before yimmediatel share per value Fair
sharesof no. right Postissue rights from Proceeds cap market right Pre

Security Analysis (Spring 2012) Asif Ali Qureshi, CFA
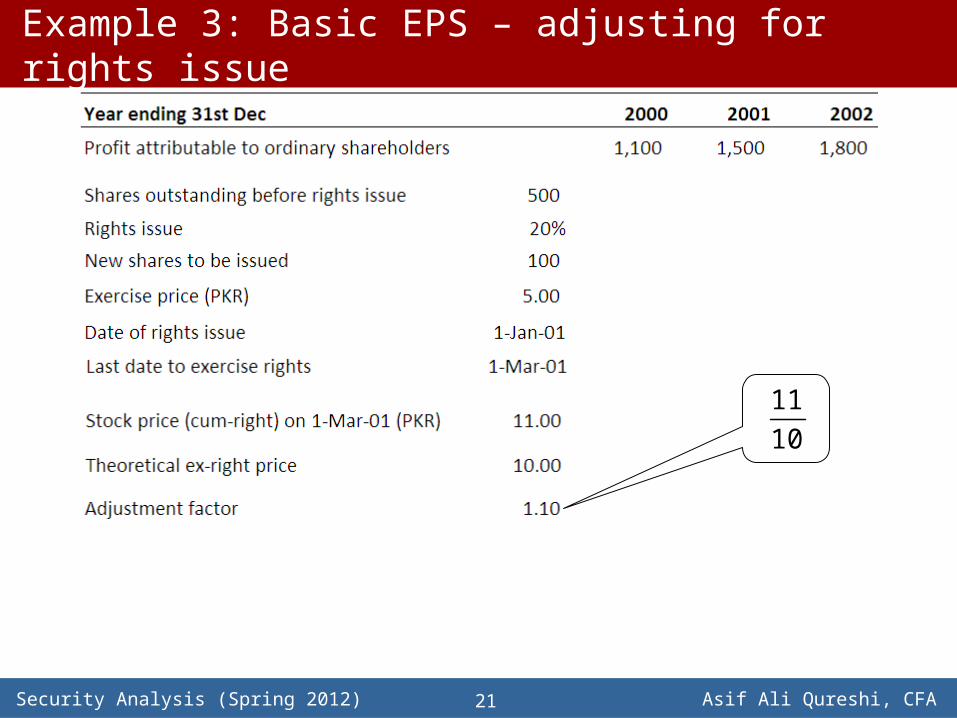
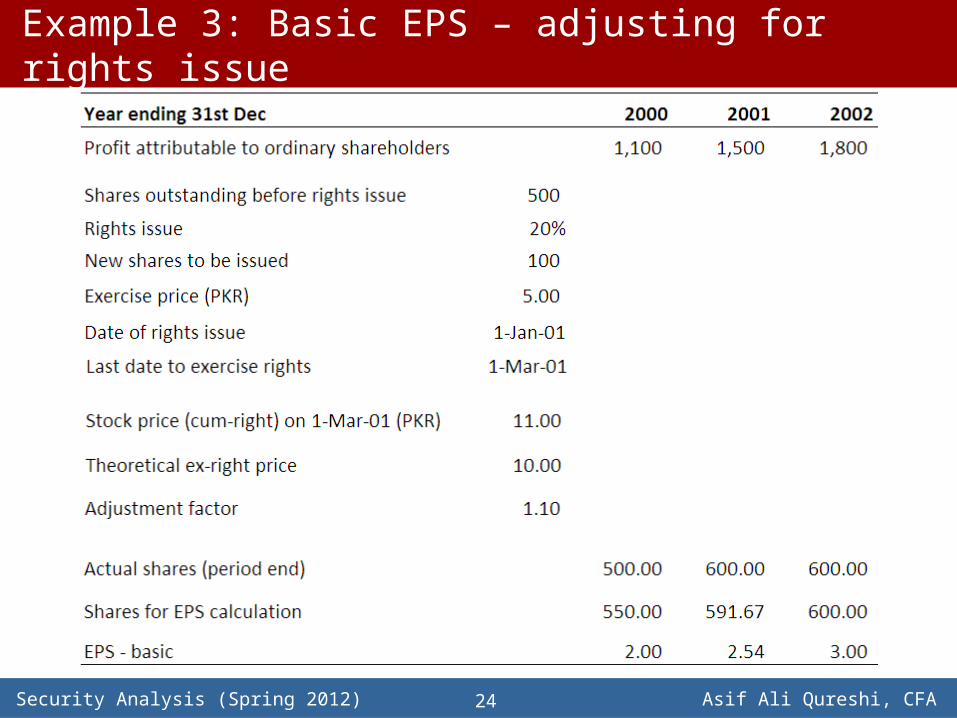
Example 3: Basic EPS – adjusting for rights issue
20
100 5005 x 100 11 x 500
Security Analysis (Spring 2012) Asif Ali Qureshi, CFA
Example 3: Basic EPS – adjusting for rights issue
21
1011
Security Analysis (Spring 2012) Asif Ali Qureshi, CFA
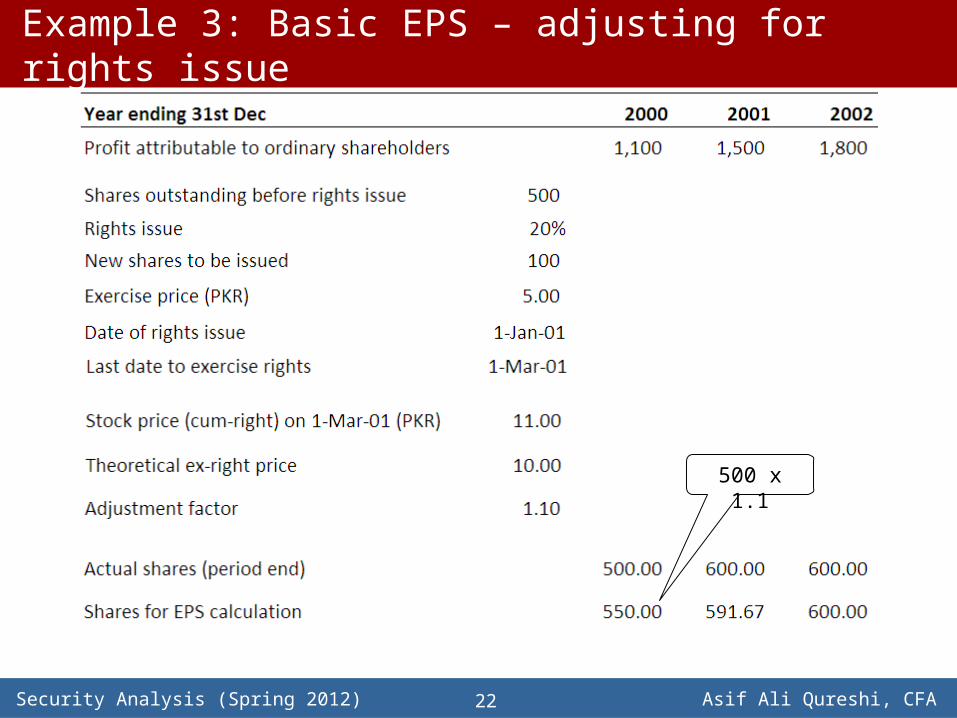
Example 3: Basic EPS – adjusting for rights issue
22
500 x 1.1
Security Analysis (Spring 2012) Asif Ali Qureshi, CFA
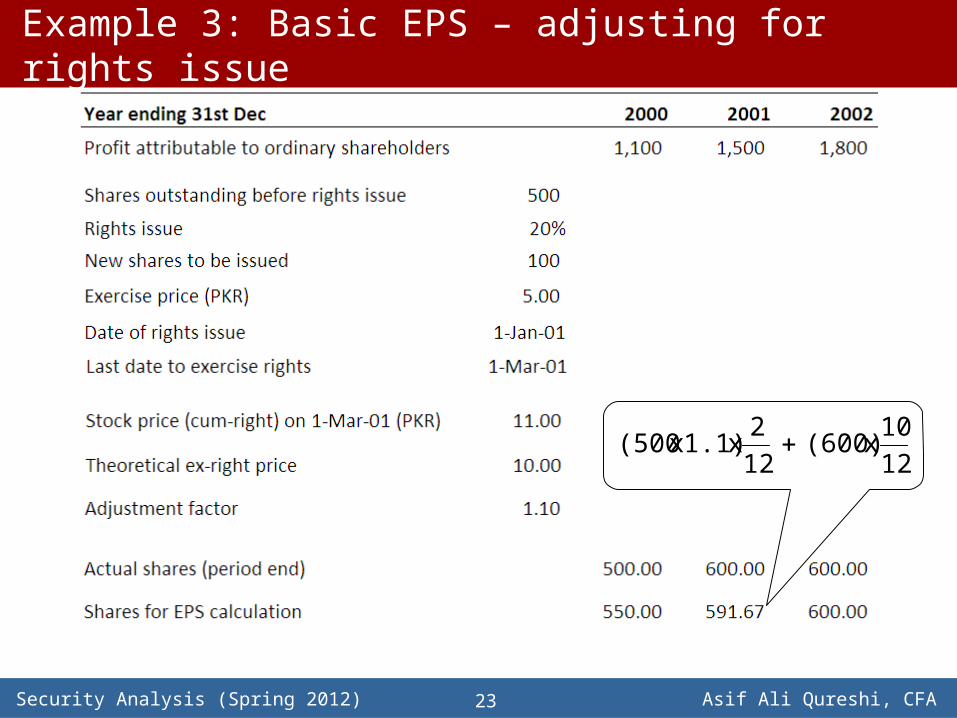
Example 3: Basic EPS – adjusting for rights issue
23
1210 x (600)
122
x 1.1) x (500
Security Analysis (Spring 2012) Asif Ali Qureshi, CFA
Example 3: Basic EPS – adjusting for rights issue
24
Security Analysis (Spring 2012) Asif Ali Qureshi, CFA25
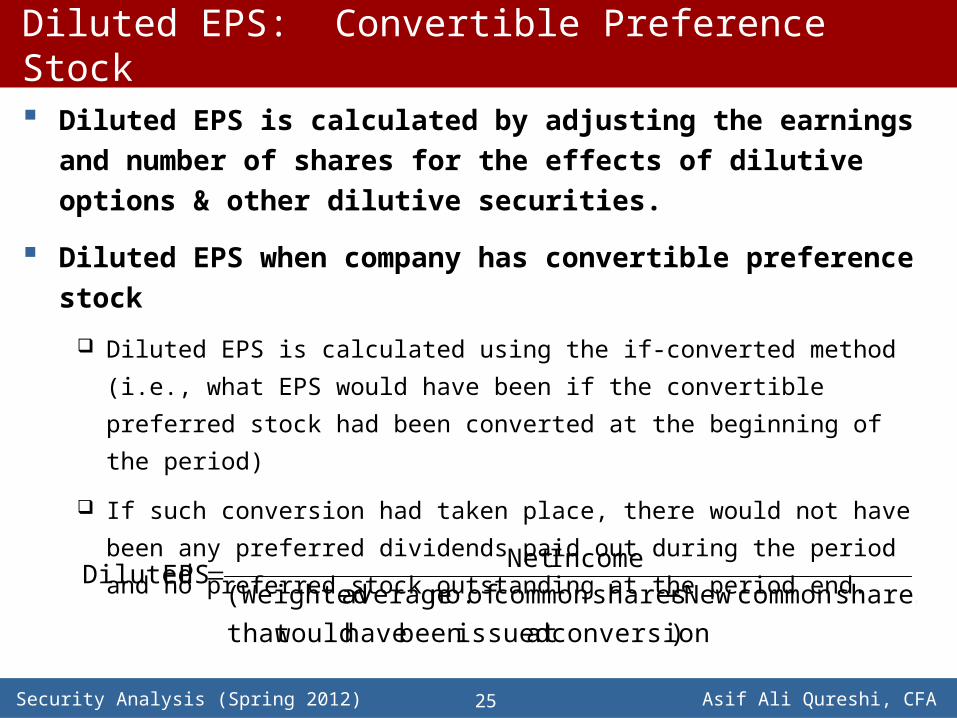
Diluted EPS: Convertible Preference Stock
Diluted EPS is calculated by adjusting the earnings and number of shares for the effects of dilutive options & other dilutive securities.
Diluted EPS when company has convertible preference stock
Diluted EPS is calculated using the if-converted method (i.e., what EPS would have
been if the convertible preferred stock had been converted at the beginning of the
period)
If such conversion had taken place, there would not have been any preferred
dividends paid out during the period and no preferred stock outstanding at the
period end.
)conversion at issued been have would that shares common New shares commonof no. average (Weighted
Income Net EPS Diluted
Security Analysis (Spring 2012) Asif Ali Qureshi, CFA26
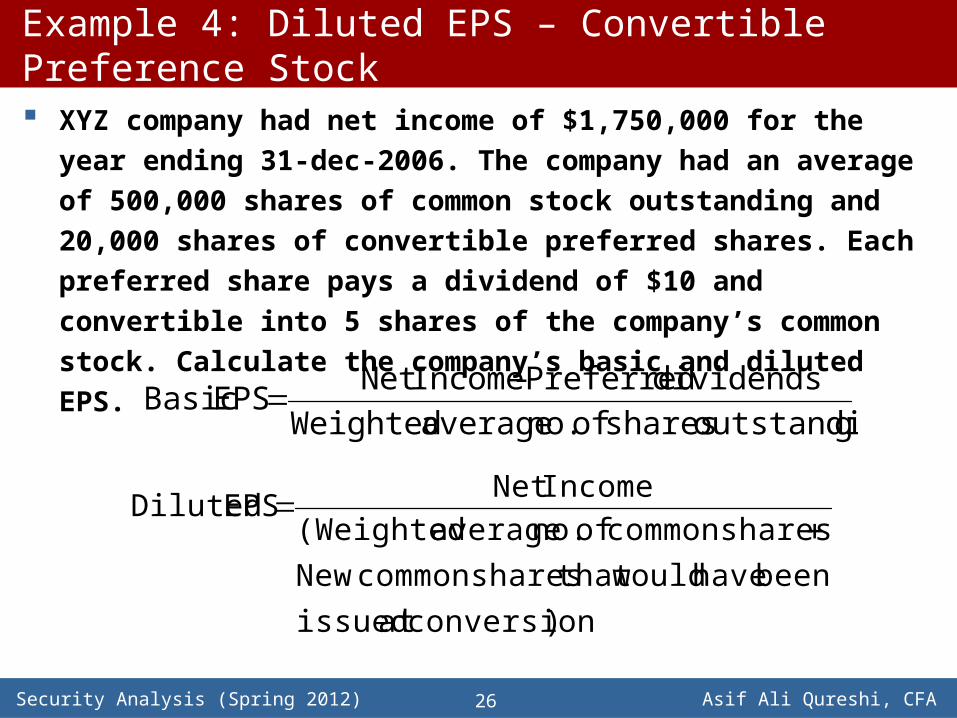
Example 4: Diluted EPS – Convertible Preference Stock XYZ company had net income of $1,750,000 for the year ending 31-dec-
2006. The company had an average of 500,000 shares of common stock outstanding and 20,000 shares of convertible preferred shares. Each preferred share pays a dividend of $10 and convertible into 5 shares of the company’s common stock. Calculate the company’s basic and diluted EPS.
goutstandin sharesof no. average Weighteddividends Preferred - Income Net
EPS Basic
)conversion at issued been have would that shares common New shares commonof no. average (Weighted
Income Net EPS Diluted
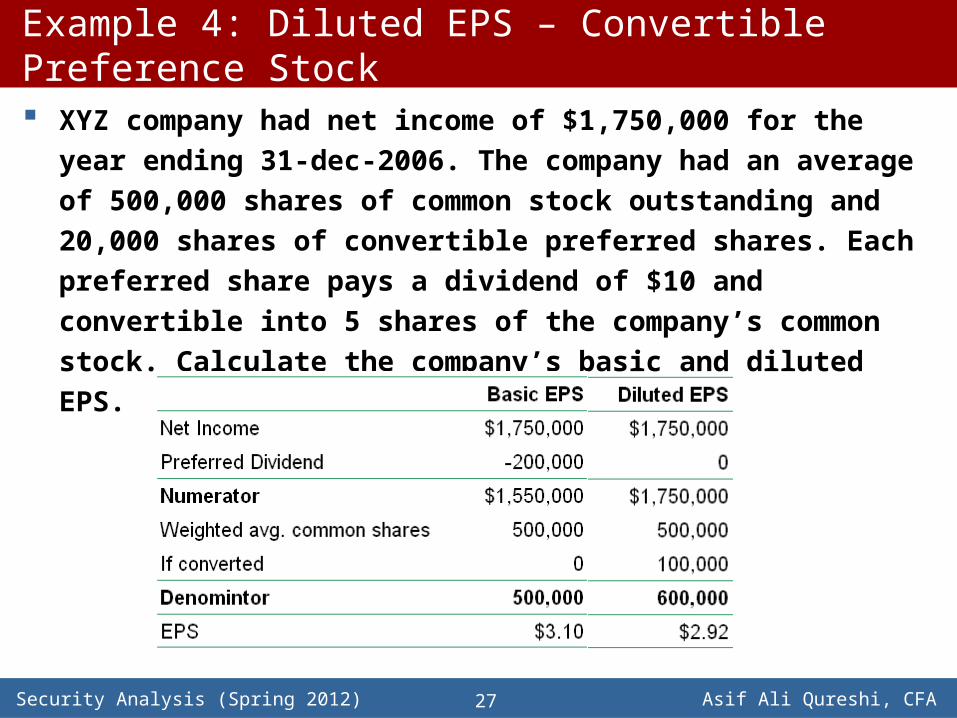
Security Analysis (Spring 2012) Asif Ali Qureshi, CFA27
Example 4: Diluted EPS – Convertible Preference Stock XYZ company had net income of $1,750,000 for the year ending 31-dec-
2006. The company had an average of 500,000 shares of common stock outstanding and 20,000 shares of convertible preferred shares. Each preferred share pays a dividend of $10 and convertible into 5 shares of the company’s common stock. Calculate the company’s basic and diluted EPS.
Security Analysis (Spring 2012) Asif Ali Qureshi, CFA28
Diluted EPS: Convertible Debt
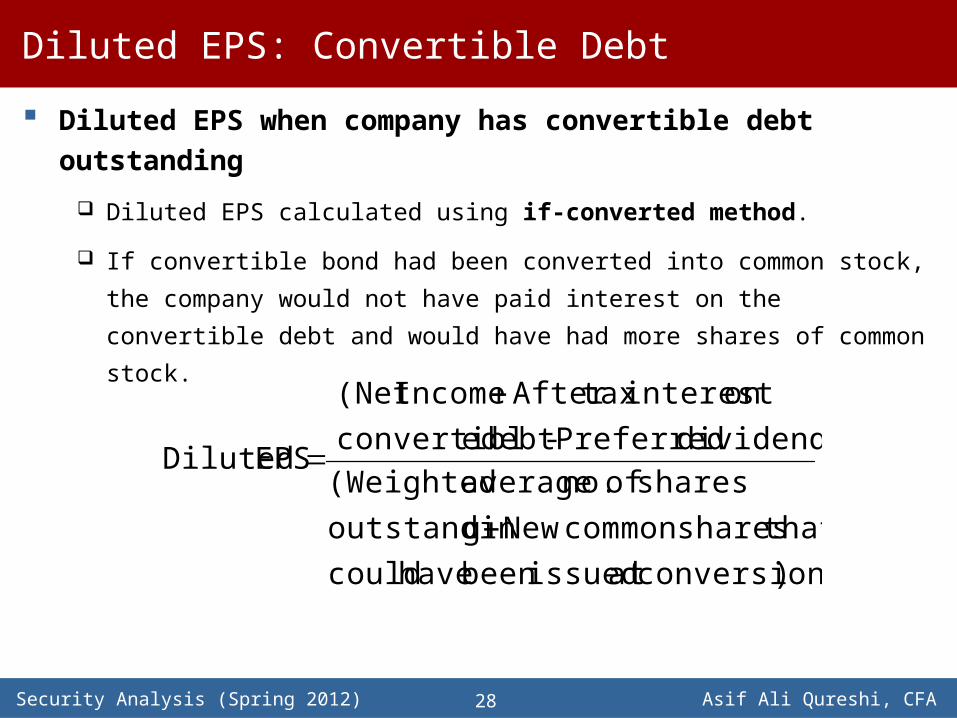
Diluted EPS when company has convertible debt outstanding
Diluted EPS calculated using if-converted method.
If convertible bond had been converted into common stock, the company would not
have paid interest on the convertible debt and would have had more shares of
common stock.
)conversion at issued been have couldthat shares common New goutstandin
sharesof no. average (Weighteddividends) Preferred - debt econvertibl
on interest tax After Income (Net
EPS Diluted
Security Analysis (Spring 2012) Asif Ali Qureshi, CFA29
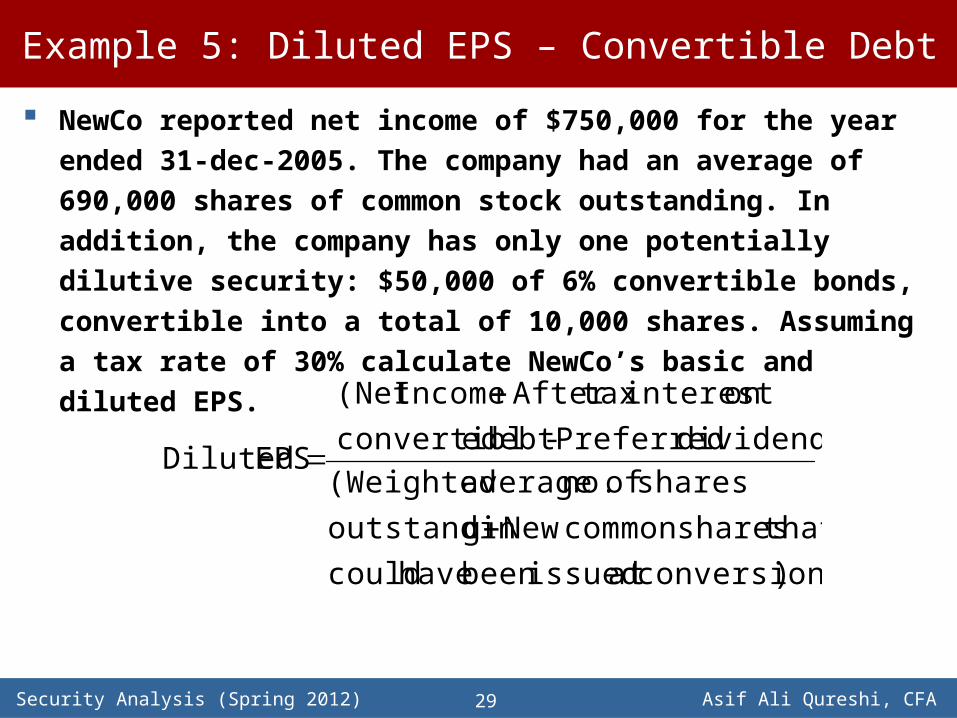
Example 5: Diluted EPS – Convertible Debt
NewCo reported net income of $750,000 for the year ended 31-dec-2005. The company had an average of 690,000 shares of common stock outstanding. In addition, the company has only one potentially dilutive security: $50,000 of 6% convertible bonds, convertible into a total of 10,000 shares. Assuming a tax rate of 30% calculate NewCo’s basic and diluted EPS.
)conversion at issued been have couldthat shares common New goutstandin
sharesof no. average (Weighteddividends) Preferred - debt econvertibl
on interest tax After Income (Net
EPS Diluted
Security Analysis (Spring 2012) Asif Ali Qureshi, CFA30
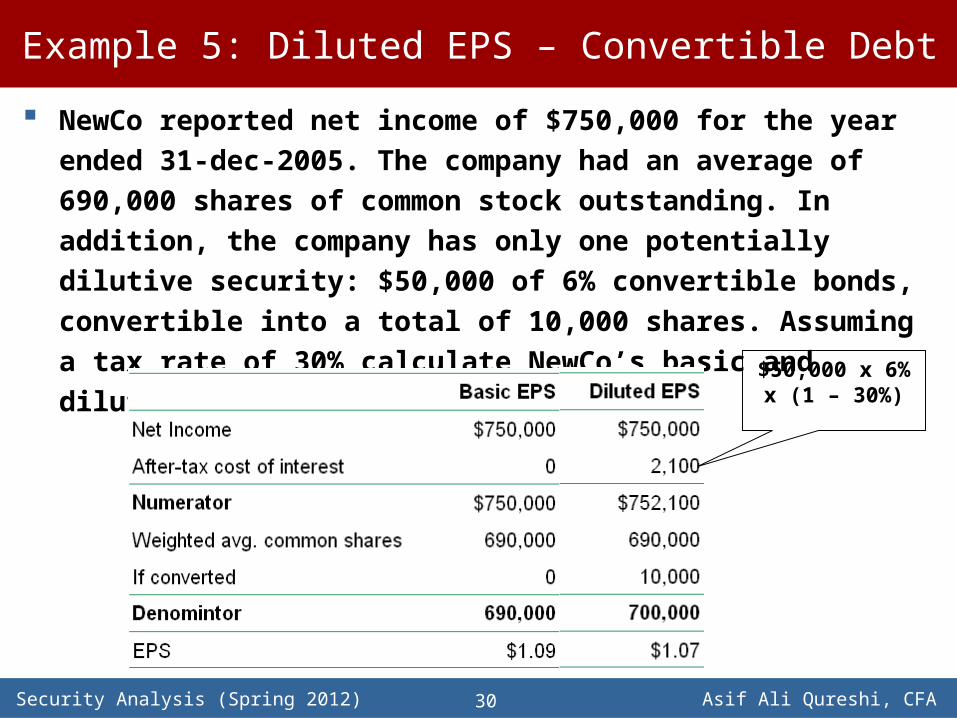
Example 5: Diluted EPS – Convertible Debt
NewCo reported net income of $750,000 for the year ended 31-dec-2005. The company had an average of 690,000 shares of common stock outstanding. In addition, the company has only one potentially dilutive security: $50,000 of 6% convertible bonds, convertible into a total of 10,000 shares. Assuming a tax rate of 30% calculate NewCo’s basic and diluted EPS.
$50,000 x 6% x (1 – 30%)
Security Analysis (Spring 2012) Asif Ali Qureshi, CFA31
Diluted EPS: Warrants and Options
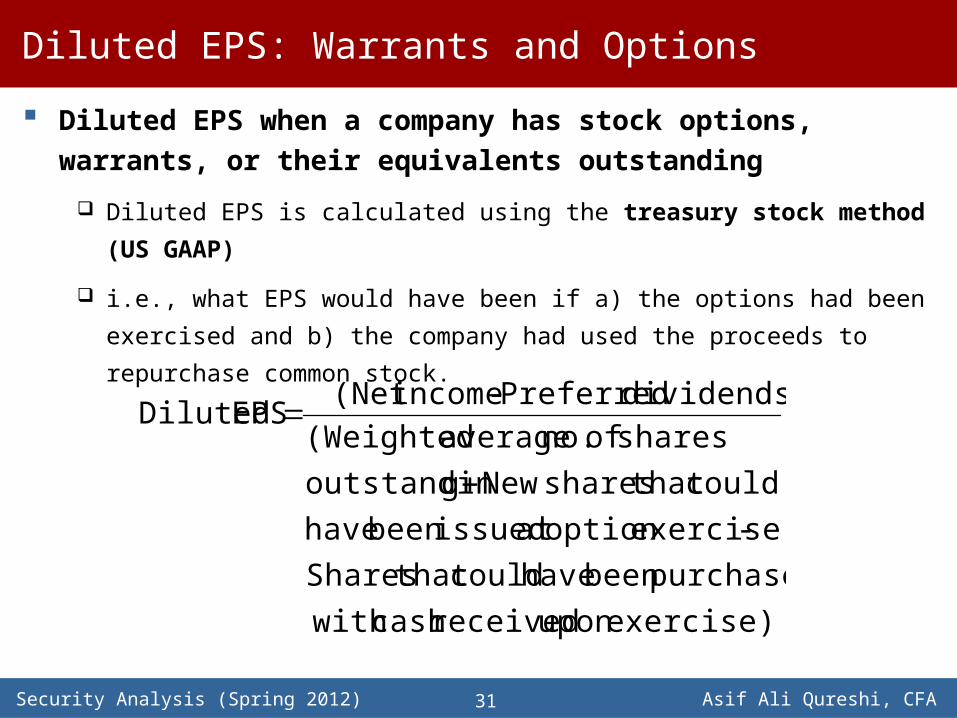
Diluted EPS when a company has stock options, warrants, or their equivalents outstanding
Diluted EPS is calculated using the treasury stock method (US GAAP)
i.e., what EPS would have been if a) the options had been exercised and b) the
company had used the proceeds to repurchase common stock.
exercise) upon received cash with purchased been have could that Shares
- exercise option at issued been have could that shares New goutstandin
sharesof no. average (Weighteddividends) Preferred - income (Net
EPS Diluted
Security Analysis (Spring 2012) Asif Ali Qureshi, CFA32
Example 6: Diluted EPS – Warrants & Options
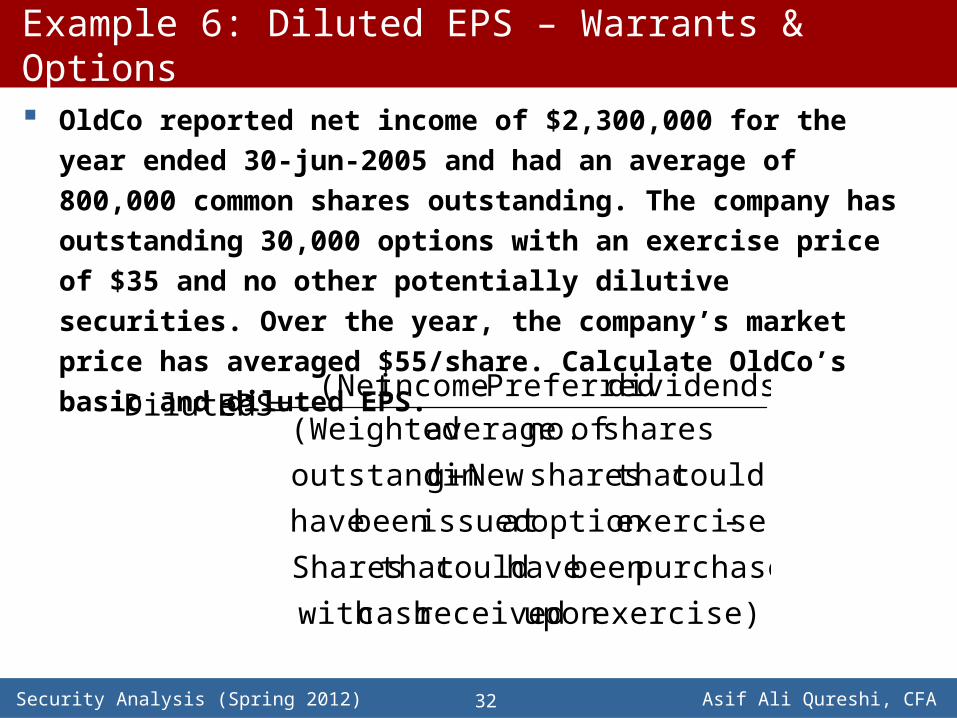
OldCo reported net income of $2,300,000 for the year ended 30-jun-2005 and had an average of 800,000 common shares outstanding. The company has outstanding 30,000 options with an exercise price of $35 and no other potentially dilutive securities. Over the year, the company’s market price has averaged $55/share. Calculate OldCo’s basic and diluted EPS.
exercise) upon received cash with purchased been have could that Shares
- exercise option at issued been have could that shares New goutstandin
sharesof no. average (Weighteddividends) Preferred - income (Net
EPS Diluted
Security Analysis (Spring 2012) Asif Ali Qureshi, CFA33
Example 6: Diluted EPS – Warrants & Options
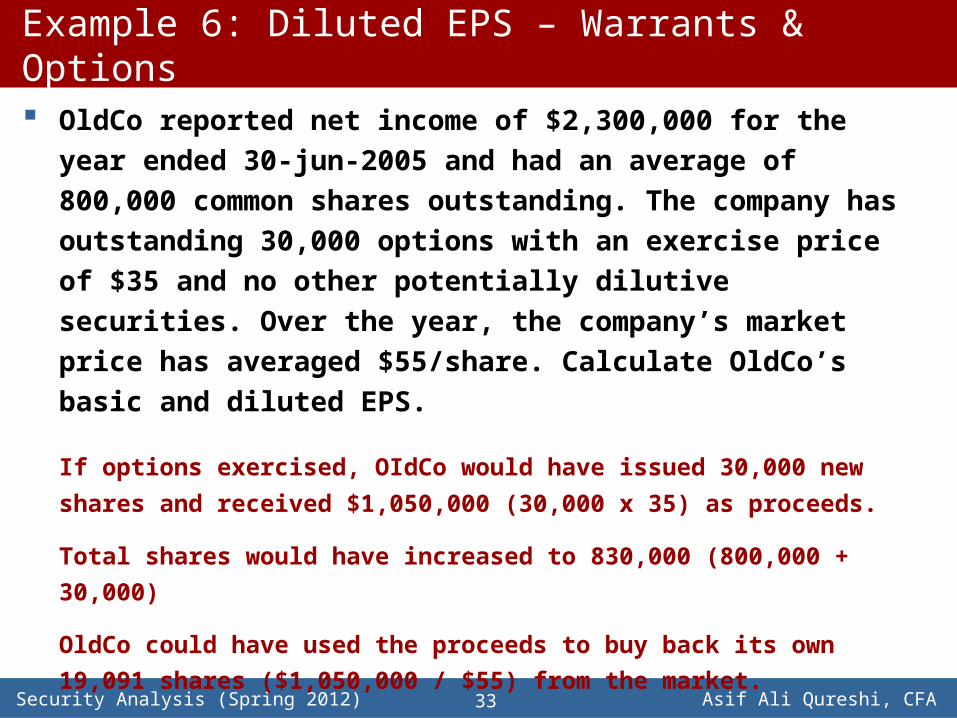
OldCo reported net income of $2,300,000 for the year ended 30-jun-2005 and had an average of 800,000 common shares outstanding. The company has outstanding 30,000 options with an exercise price of $35 and no other potentially dilutive securities. Over the year, the company’s market price has averaged $55/share. Calculate OldCo’s basic and diluted EPS.
If options exercised, OIdCo would have issued 30,000 new shares and received $1,050,000 (30,000 x 35) as proceeds.
Total shares would have increased to 830,000 (800,000 + 30,000)
OldCo could have used the proceeds to buy back its own 19,091 shares ($1,050,000 / $55) from the market.
Total shares would resultantly reduce to 810,909 (830,000 – 19,091).
Security Analysis (Spring 2012) Asif Ali Qureshi, CFA34
Example 6: Diluted EPS – Warrants & Options
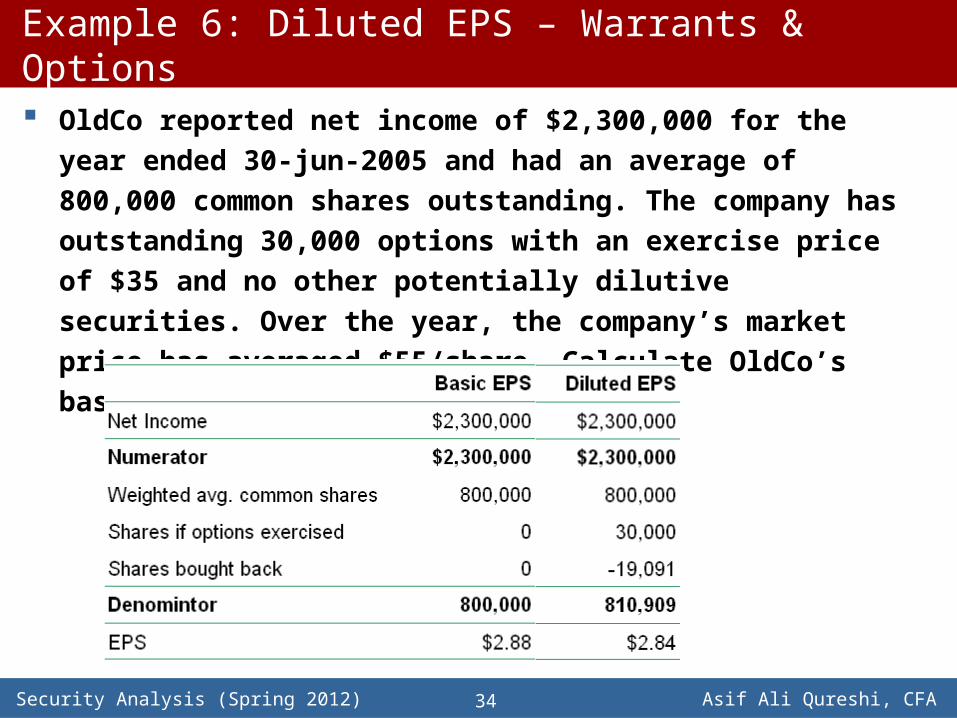
OldCo reported net income of $2,300,000 for the year ended 30-jun-2005 and had an average of 800,000 common shares outstanding. The company has outstanding 30,000 options with an exercise price of $35 and no other potentially dilutive securities. Over the year, the company’s market price has averaged $55/share. Calculate OldCo’s basic and diluted EPS.
Security Analysis (Spring 2012) Asif Ali Qureshi, CFA35
Anti-dilutive Securities
It is possible that some potentially convertible securities could be antidilutive i.e., their inclusion in the computation would result in an EPS higher than the company’s basic EPS.
Under accounting standards, antidilutive securities are not included in the calculation of diluted EPS.
Security Analysis (Spring 2012) Asif Ali Qureshi, CFA36
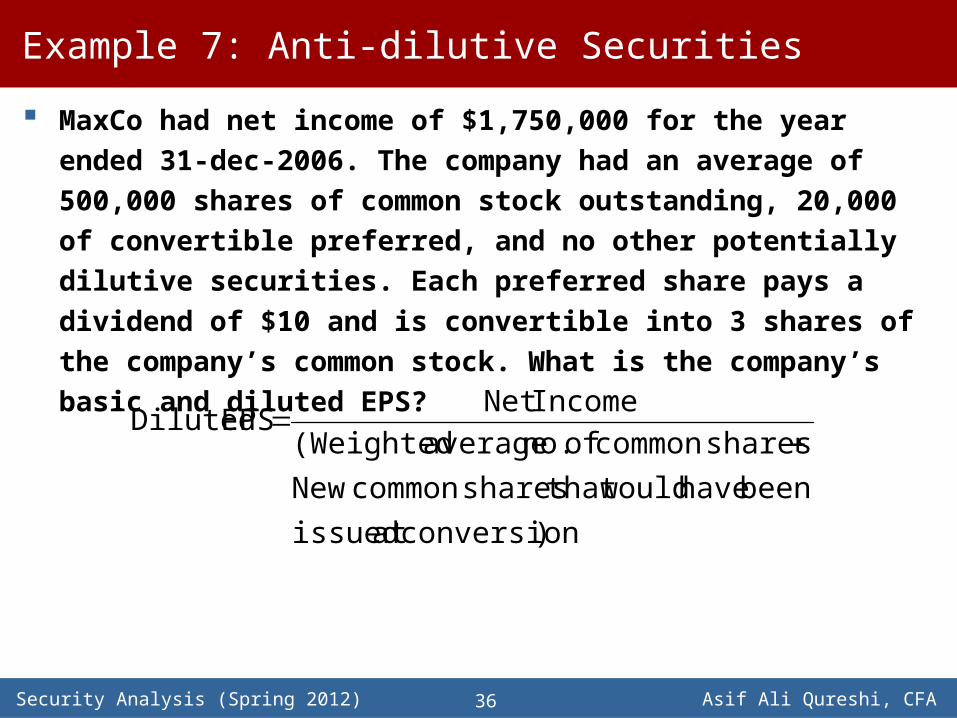
Example 7: Anti-dilutive Securities
MaxCo had net income of $1,750,000 for the year ended 31-dec-2006. The company had an average of 500,000 shares of common stock outstanding, 20,000 of convertible preferred, and no other potentially dilutive securities. Each preferred share pays a dividend of $10 and is convertible into 3 shares of the company’s common stock. What is the company’s basic and diluted EPS?
)conversion at issued been have would that shares common New shares commonof no. average (Weighted
Income Net EPS Diluted
Security Analysis (Spring 2012) Asif Ali Qureshi, CFA37
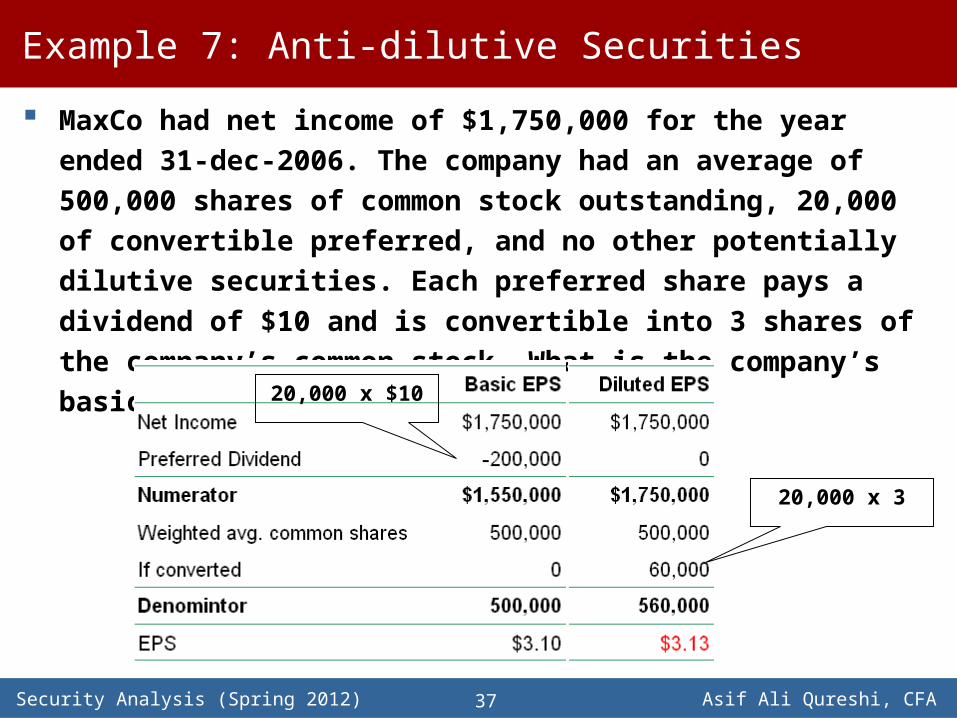
Example 7: Anti-dilutive Securities
MaxCo had net income of $1,750,000 for the year ended 31-dec-2006. The company had an average of 500,000 shares of common stock outstanding, 20,000 of convertible preferred, and no other potentially dilutive securities. Each preferred share pays a dividend of $10 and is convertible into 3 shares of the company’s common stock. What is the company’s basic and diluted EPS?
20,000 x 3
20,000 x $10
Security Analysis (Spring 2012) Asif Ali Qureshi, CFA38
Common Size Income Statement
Common-size analysis of the income statement can be performed by stating each line item on the income statement as %age of revenues (vertical common size analysis).
Common size analysis helps in:
Time series analysis i.e., analyzing a company’s performance over time by explaining
relative movements in costs and margins.
Cross-sectional analysis i.e., comparative analysis of two or more companies, which
helps understand the differences in operating and financial efficiencies, strategies,
etc.
Spring 2012
Financial Analysis Techniques
Security Analysis (Spring 2012) Asif Ali Qureshi, CFA40
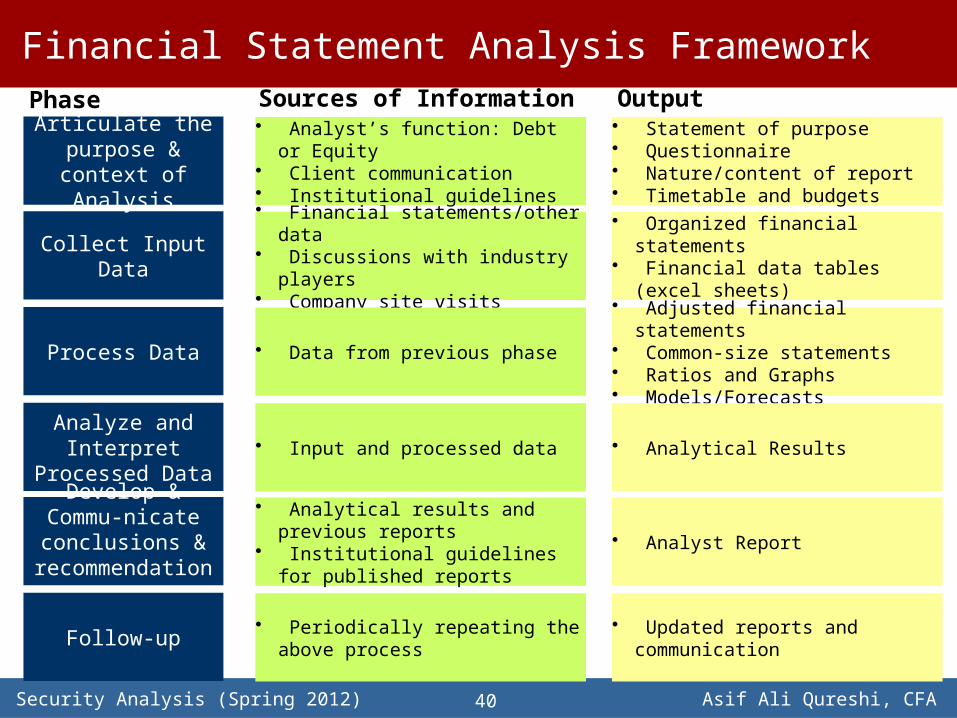
Financial Statement Analysis Framework
• Financial statements/other data• Discussions with industry players• Company site visits
• Data from previous phase
• Input and processed data
• Analytical results and previous reports• Institutional guidelines for published
reports
• Periodically repeating the above process
• Organized financial statements• Financial data tables (excel sheets)
• Adjusted financial statements• Common-size statements• Ratios and Graphs• Models/Forecasts
• Analytical Results
• Analyst Report
• Updated reports and communication
Collect Input Data
Process Data
Analyze and Interpret Processed Data
Develop & Commu-nicate conclusions &
recommendations
Follow-up
Articulate the purpose & context of
Analysis
Phase• Analyst’s function: Debt or Equity• Client communication• Institutional guidelines
Sources of Information• Statement of purpose• Questionnaire• Nature/content of report• Timetable and budgets
Output
Security Analysis (Spring 2012) Asif Ali Qureshi, CFA41
Analysis Tools and Techniques
Financial Ratios
Common Size Analysis
Graphical Analysis
Regression Analysis
Security Analysis (Spring 2012) Asif Ali Qureshi, CFA42
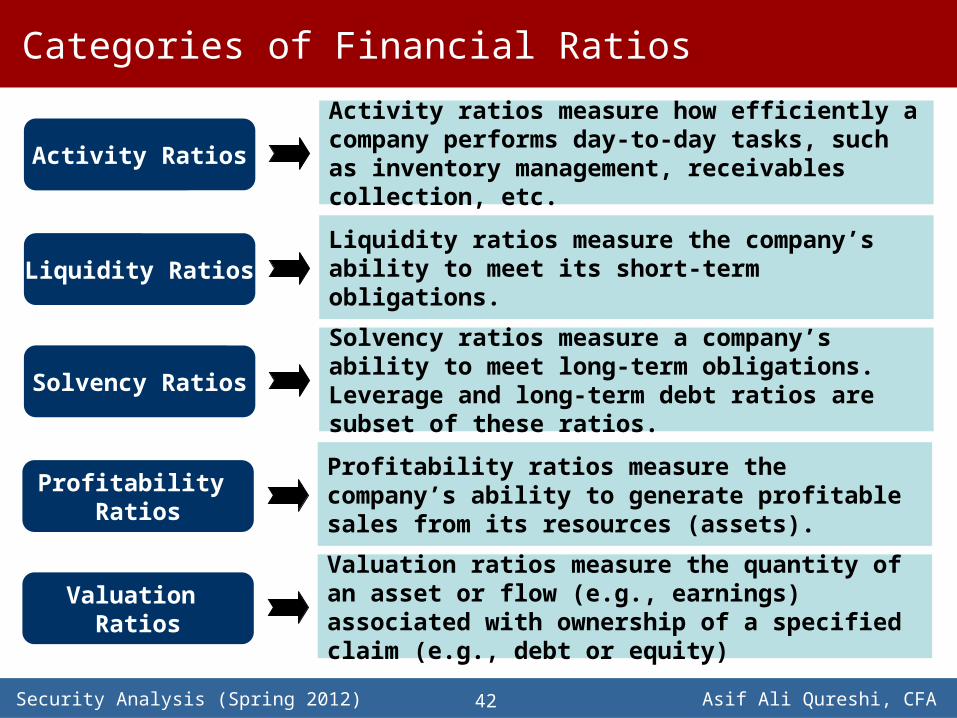
Categories of Financial Ratios
Activity RatiosActivity ratios measure how efficiently a company performs day-to-day tasks, such as inventory management, receivables collection, etc.
Liquidity RatiosLiquidity ratios measure the company’s ability to meet its short-term obligations.
Solvency RatiosSolvency ratios measure a company’s ability to meet long-term obligations. Leverage and long-term debt ratios are subset of these ratios.
Profitability Ratios
Profitability ratios measure the company’s ability to generate profitable sales from its resources (assets).
Valuation Ratios
Valuation ratios measure the quantity of an asset or flow (e.g., earnings) associated with ownership of a specified claim (e.g., debt or equity)
Security Analysis (Spring 2012) Asif Ali Qureshi, CFA43
Activity Ratios
Activity ratios measure how efficiently a company performs day-to-day tasks, such as inventory management, receivables collection, etc.
Activity ratios combine information from P&L and balance sheet.
P&L covers a time period while balance sheet is as of a specific date. Therefore, average balance sheet data should be used in estimating the activity ratios.
For meaningful analysis, activity ratios (likely all other sets of financial ratios) should be evaluated both on time-series and cross-sectional basis.
Security Analysis (Spring 2012) Asif Ali Qureshi, CFA44
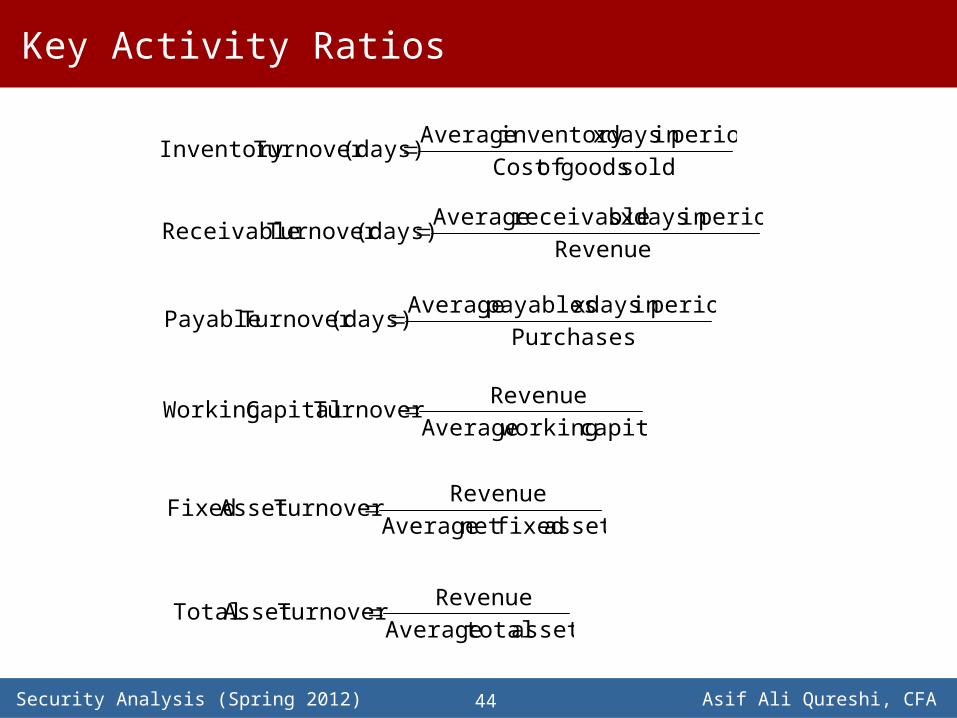
Key Activity Ratios
sold goodsof Costperiod in days x inventory Average
(days) Turnover Inventory
Revenueperiod in days x sreceivable Average
(days) Turnover Receivable
Purchasesperiod in days x payables Average
(days) Turnover Payable
capital working AverageRevenue
Turnover Capital Working
assets fixed net AverageRevenue
Turnover Asset Fixed
assets total AverageRevenue
Turnover Asset Total
Security Analysis (Spring 2012) Asif Ali Qureshi, CFA45
Inventory Turnover (days)
Measures how quickly the inventory is being converted into cash.
A low inventory turnover (days), relative to the industry, generally implies efficient inventory management.
However, low inventory turnover (days) may also indicate inventory shortages, which in turn hurts potential revenues.
Security Analysis (Spring 2012) Asif Ali Qureshi, CFA46
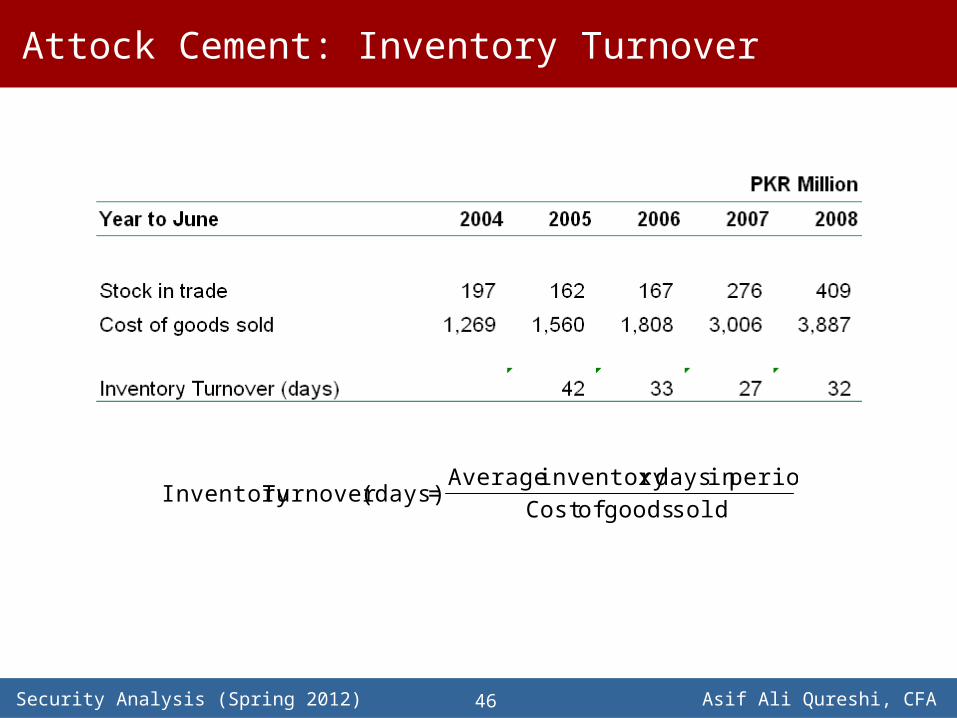
Attock Cement: Inventory Turnover
sold goods of Cost
period in daysx inventory Average = (days) TurnoverInventory
Security Analysis (Spring 2012) Asif Ali Qureshi, CFA47
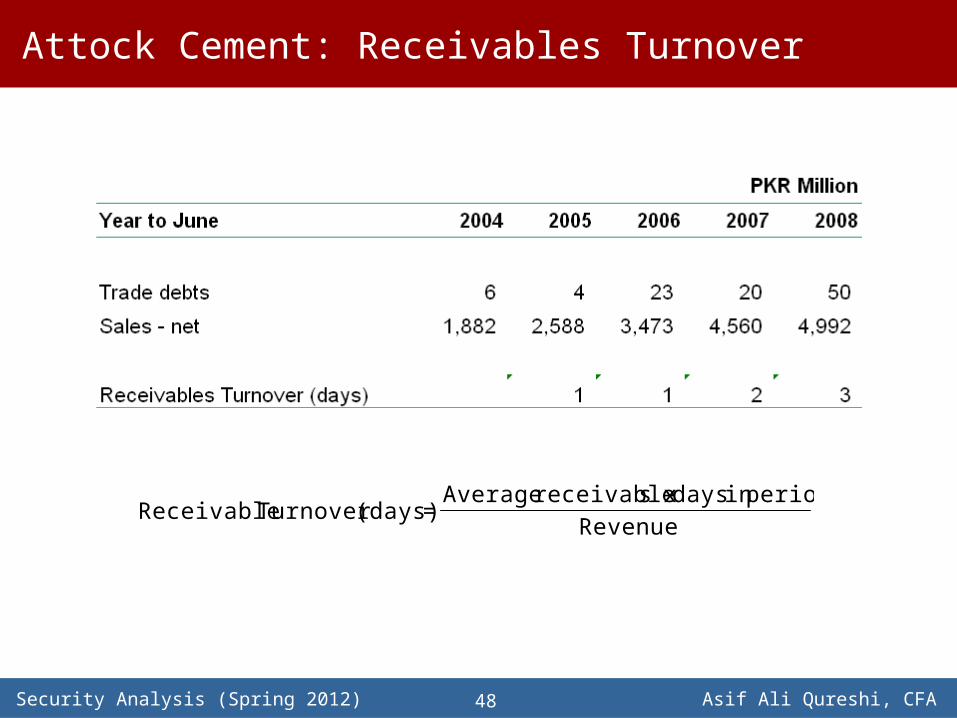
Receivables Turnover (days)
Measures how quickly the company is converting its receivables into cash.
A low receivable turnover (days), relative to the industry, generally indicates efficient receivables collection and low (client) credit risks.
However, the same may also indicate that the company is potentially loosing sales due to over-stringent credit policies.
Security Analysis (Spring 2012) Asif Ali Qureshi, CFA48
Attock Cement: Receivables Turnover
Revenue
period in days x sreceivable Average = (days) Turnover Receivable
Security Analysis (Spring 2012) Asif Ali Qureshi, CFA49
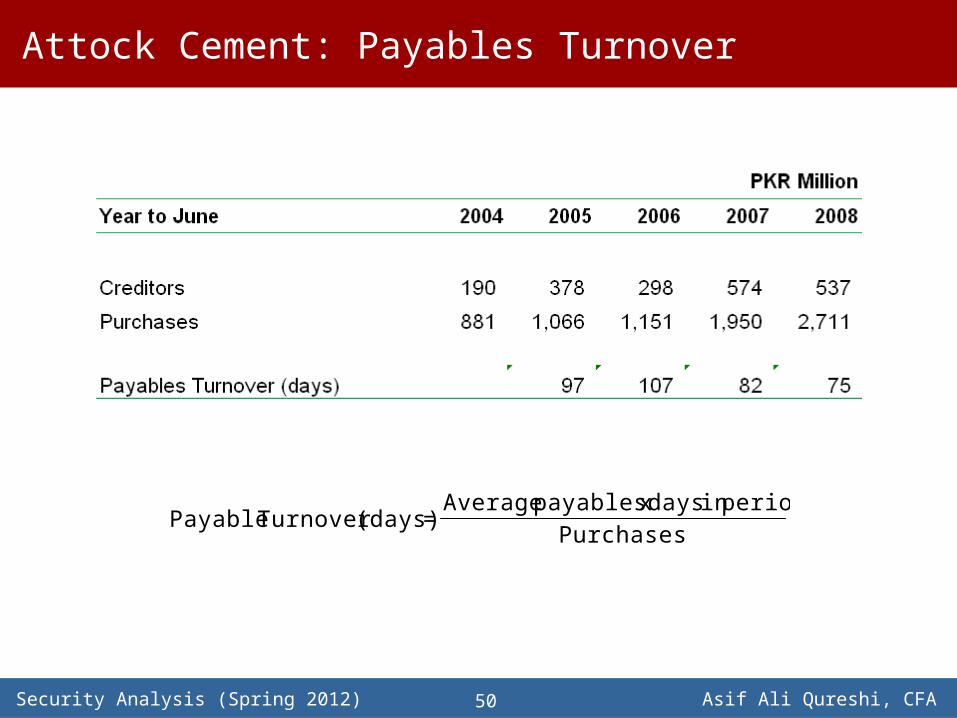
Payables Turnover (days)
Measures average suppliers payment cycle of a company.
A high payable turnovers (days), relative to the industry, indicates that the company has more favorable credit terms from its suppliers.
However, for a given period, the same may also indicate that the company is facing problems in meeting its payments towards its suppliers.
Security Analysis (Spring 2012) Asif Ali Qureshi, CFA50
Attock Cement: Payables Turnover
Purchases
period in days x payables Average = (days) Turnover Payable
Security Analysis (Spring 2012) Asif Ali Qureshi, CFA51
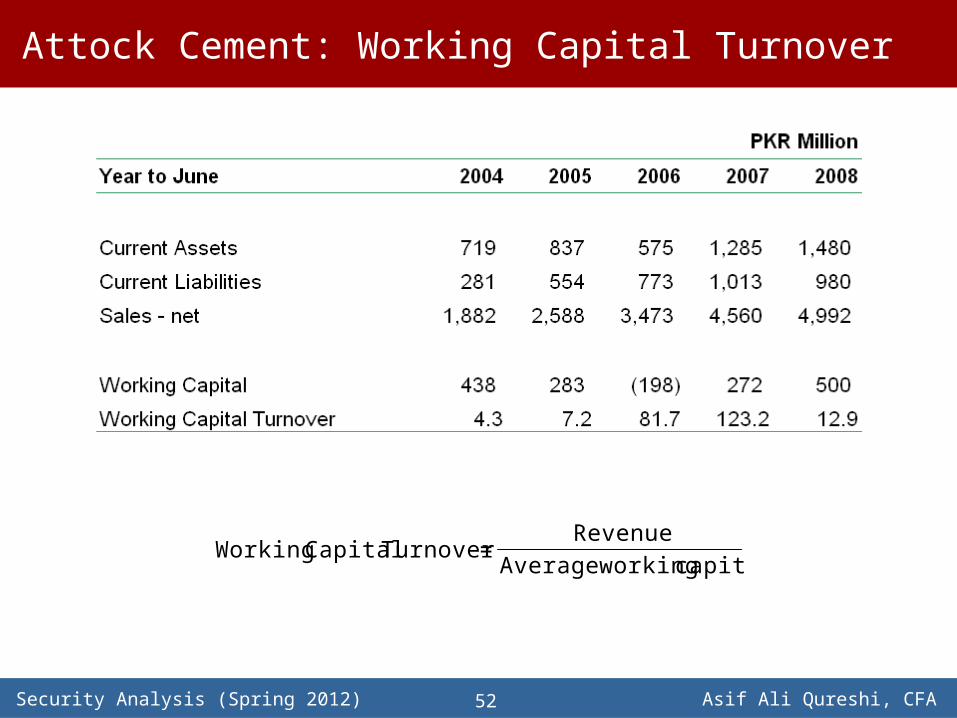
Working Capital Turnover
Measures how efficiently the company generates revenue with its working capital.
A high working capital, relative to industry, would indicate higher efficiency.
For some companies, working capital can be near zero or negative, which renders this ratio incapable of being interpreted. Asset turnover ratios are more useful in such situations.
Security Analysis (Spring 2012) Asif Ali Qureshi, CFA52
Attock Cement: Working Capital Turnover
capital workingAverage
Revenue = Turnover Capital Working
Security Analysis (Spring 2012) Asif Ali Qureshi, CFA53
Assets turnover
Measures the company’s overall ability to generate revenues with a given level of assets.
A higher ratio, relative to the industry, generally shows greater efficiency.
Security Analysis (Spring 2012) Asif Ali Qureshi, CFA54
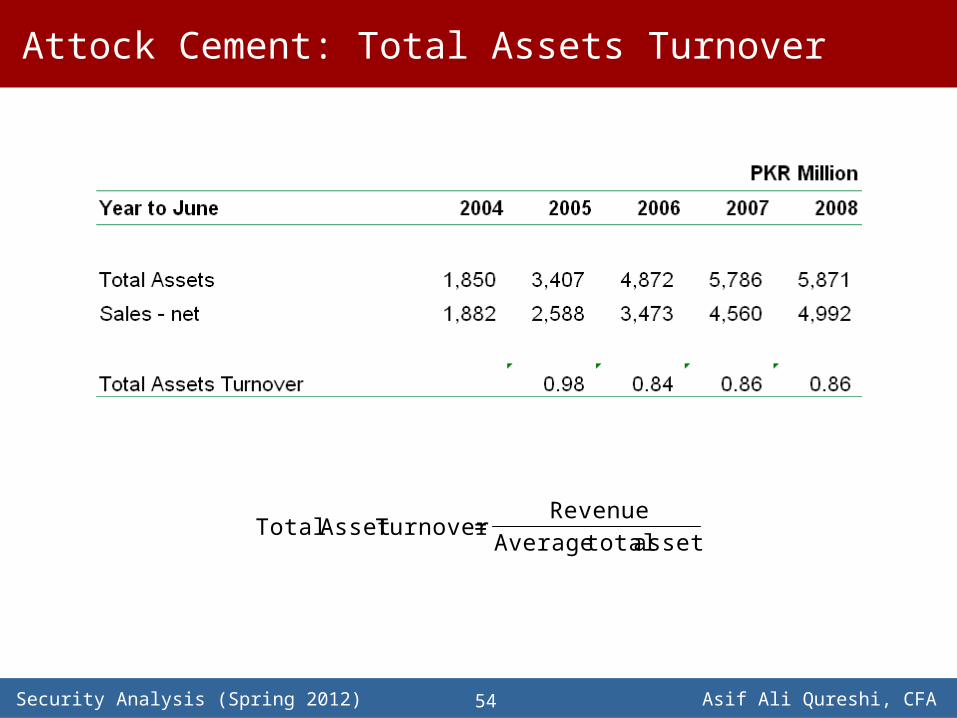
Attock Cement: Total Assets Turnover
assets total Average
Revenue = Turnover AssetTotal
Security Analysis (Spring 2012) Asif Ali Qureshi, CFA55
Liquidity Ratios
Liquidity ratios measure the company’s ability to meet its short-term obligations.
In day-to-day operations, liquidity management is typically achieved through efficient use of assets. In the medium term, liquidity is also addressed by managing the structure of liabilities.
Contingent liabilities, such as letters of credit or financial guarantees, can also be relevant when assessing liquidity.
The level of liquidity needed varies markedly from one industry to another. Liquidity ratios of sectors such as Utilities and Telecoms, are generally lower than those for manufacturing industries.
Security Analysis (Spring 2012) Asif Ali Qureshi, CFA56
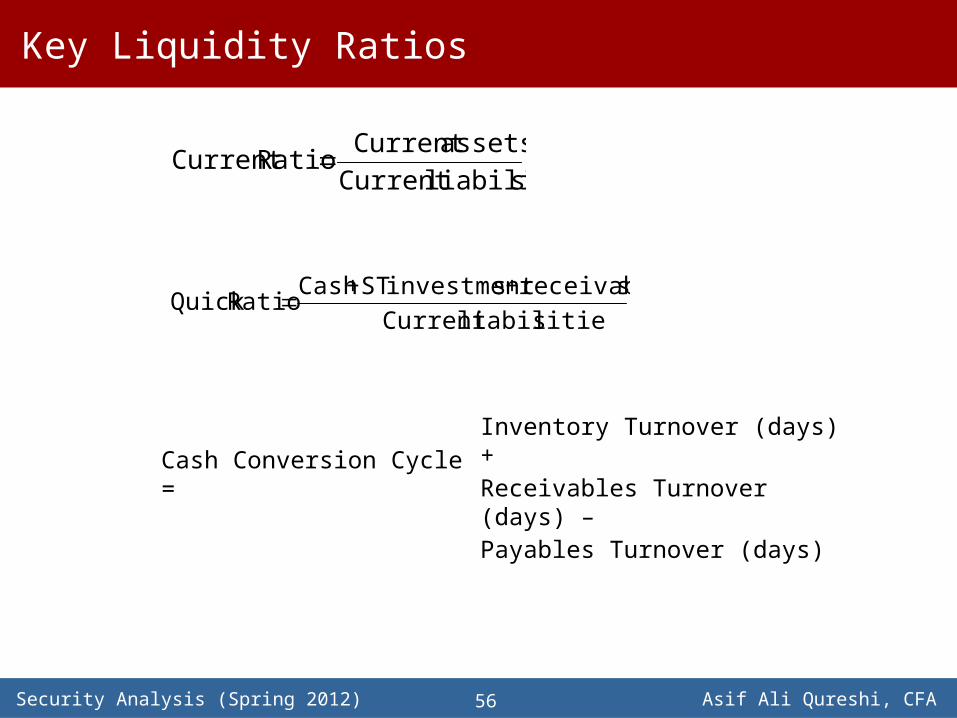
Key Liquidity Ratios
sliabilitie Currentassets Current
Ratio Current
sliabilitie Currentsreceivable + sinvestment ST + Cash
Ratio Quick
Cash Conversion Cycle = Inventory Turnover (days) + Receivables Turnover (days) – Payables Turnover (days)
Security Analysis (Spring 2012) Asif Ali Qureshi, CFA57
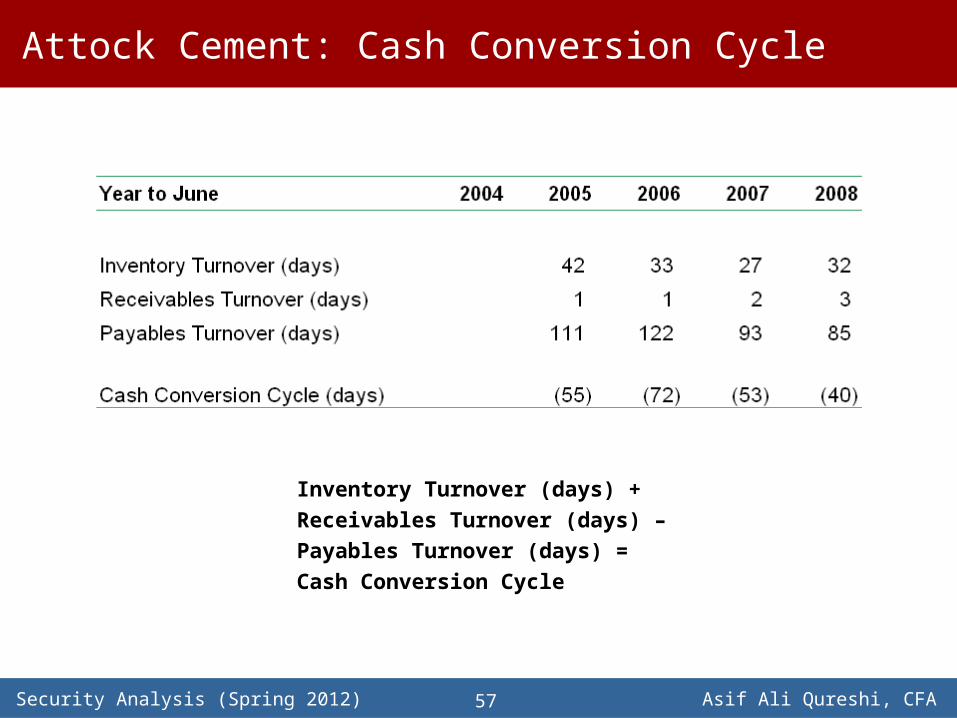
Attock Cement: Cash Conversion Cycle
Inventory Turnover (days) + Receivables Turnover (days) – Payables Turnover (days) = Cash Conversion Cycle
Security Analysis (Spring 2012) Asif Ali Qureshi, CFA58
Solvency Ratios
Solvency ratios measure a company’s ability to meet long-term obligations.
They provide information about the relative amount of debt in the company’s capital structure and the adequacy of earnings and cash flows to cover interest expense and other fixed charges (such as lease payments) as they come due.
A company’s relative solvency is fundamental to valuation of its debt securities and its creditworthiness.
Security Analysis (Spring 2012) Asif Ali Qureshi, CFA59
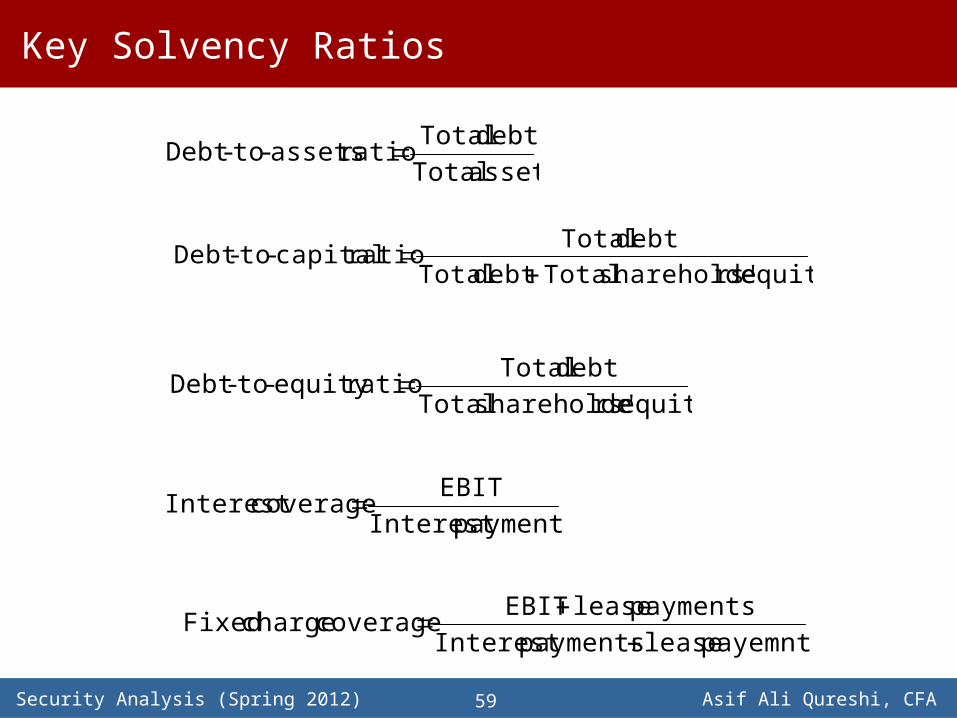
Key Solvency Ratios
assets Totaldebt Total
ratio assets-to-Debt
equity rs'shareholde Total debt Totaldebt Total
ratio capital-to-Debt
equity rs'shareholde Totaldebt Total
ratio equity-to-Debt
payments InterestEBIT
coverage Interest
payemnts lease payments Interestpayments lease EBIT
coverage charge Fixed
Security Analysis (Spring 2012) Asif Ali Qureshi, CFA60
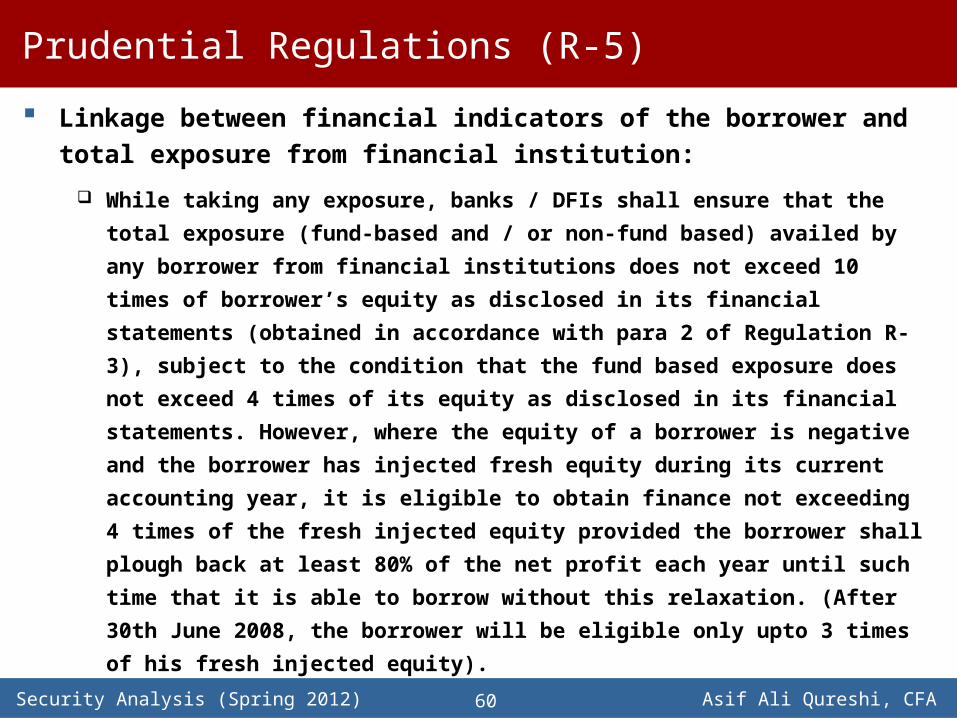
Prudential Regulations (R-5)
Linkage between financial indicators of the borrower and total exposure from financial institution:
While taking any exposure, banks / DFIs shall ensure that the total exposure (fund-based
and / or non-fund based) availed by any borrower from financial institutions does not exceed
10 times of borrower’s equity as disclosed in its financial statements (obtained in accordance
with para 2 of Regulation R-3), subject to the condition that the fund based exposure does
not exceed 4 times of its equity as disclosed in its financial statements. However, where the
equity of a borrower is negative and the borrower has injected fresh equity during its current
accounting year, it is eligible to obtain finance not exceeding 4 times of the fresh injected
equity provided the borrower shall plough back at least 80% of the net profit each year until
such time that it is able to borrow without this relaxation. (After 30th June 2008, the
borrower will be eligible only upto 3 times of his fresh injected equity).
Security Analysis (Spring 2012) Asif Ali Qureshi, CFA61
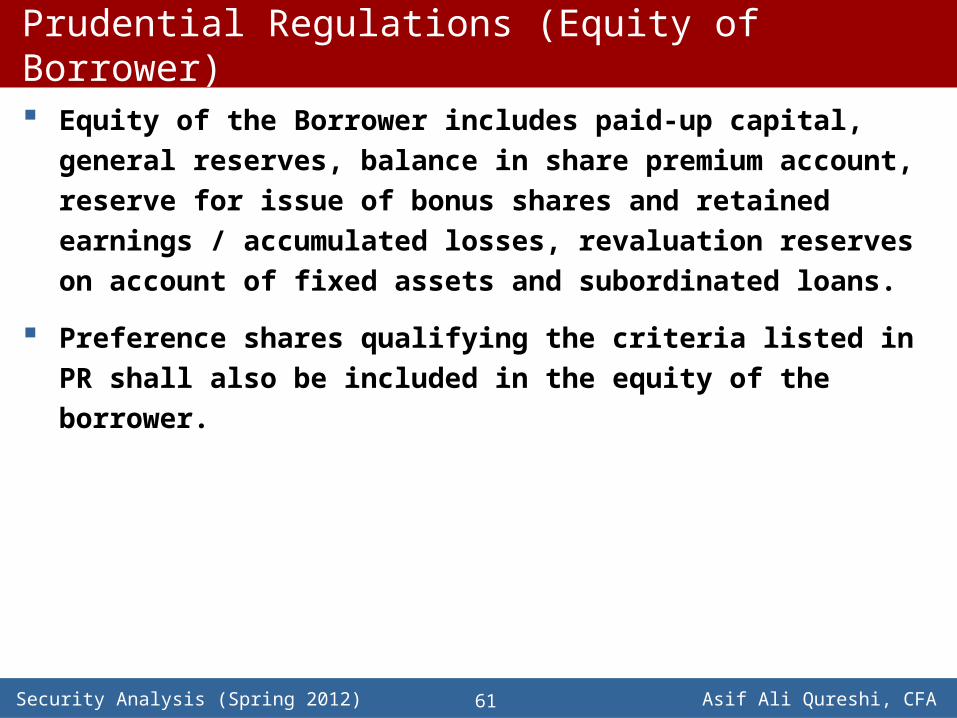
Prudential Regulations (Equity of Borrower)
Equity of the Borrower includes paid-up capital, general reserves, balance in share premium account, reserve for issue of bonus shares and retained earnings / accumulated losses, revaluation reserves on account of fixed assets and subordinated loans.
Preference shares qualifying the criteria listed in PR shall also be included in the equity of the borrower.
Security Analysis (Spring 2012) Asif Ali Qureshi, CFA62
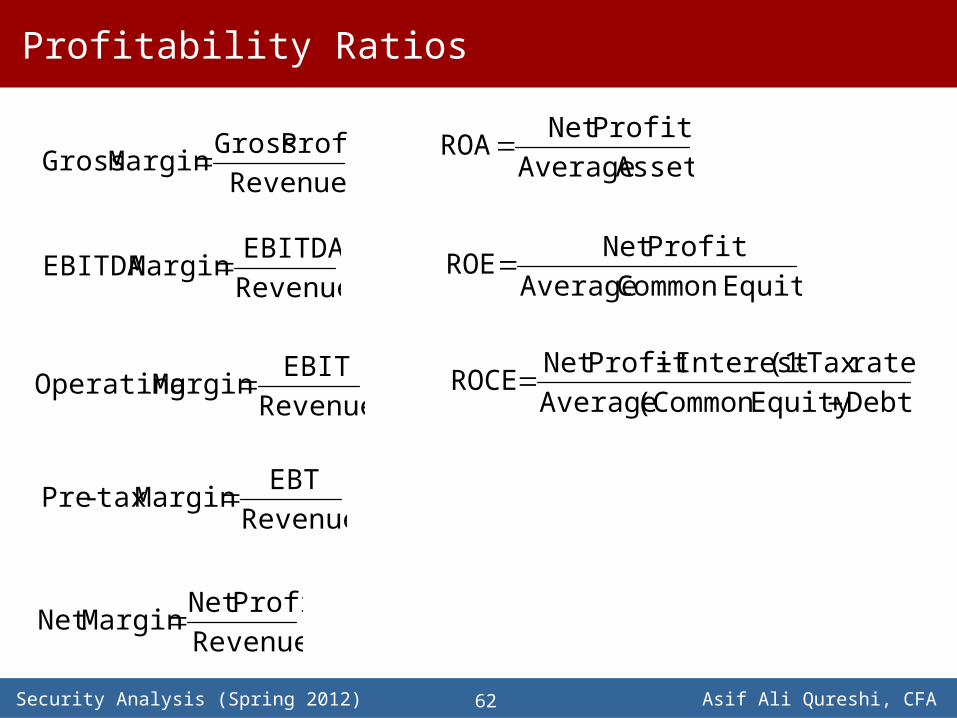
Profitability Ratios
RevenueProfit Gross
Margin Gross
RevenueEBIT
Margin Operating
RevenueEBT
Margin tax-Pre
RevenueProfit Net
Margin Net
RevenueEBITDA
Margin EBITDA
Assets AverageProfit Net
ROA
Equity Common AverageProfit Net
ROE
Debt) Equity (Common Averagerate) Tax - (1 Interest Profit Net
ROCE
Security Analysis (Spring 2012) Asif Ali Qureshi, CFA63
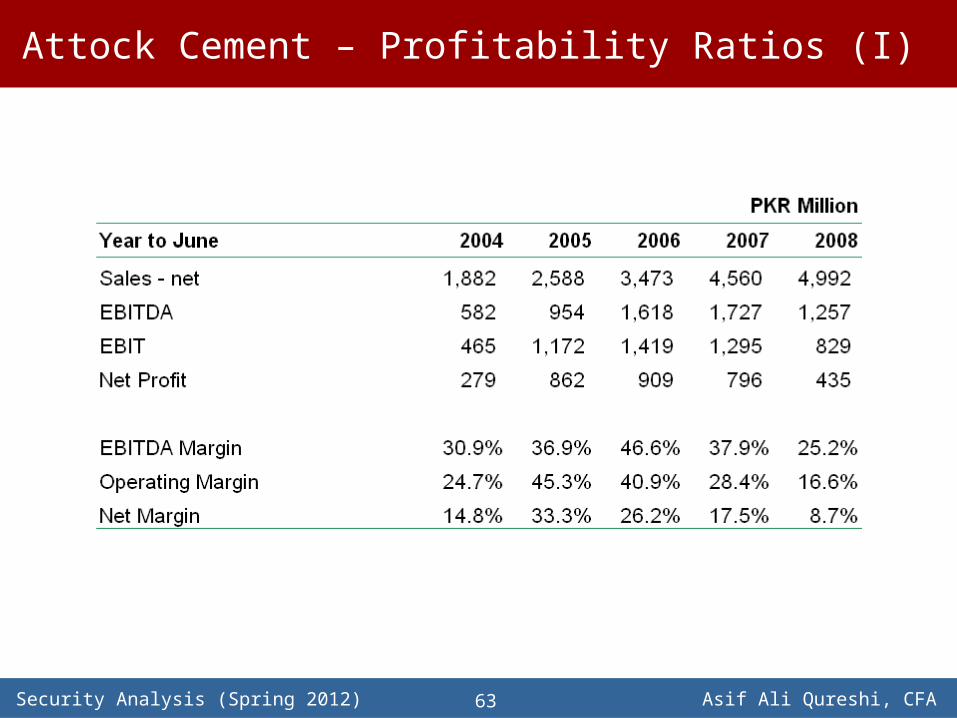
Attock Cement – Profitability Ratios (I)
Security Analysis (Spring 2012) Asif Ali Qureshi, CFA64
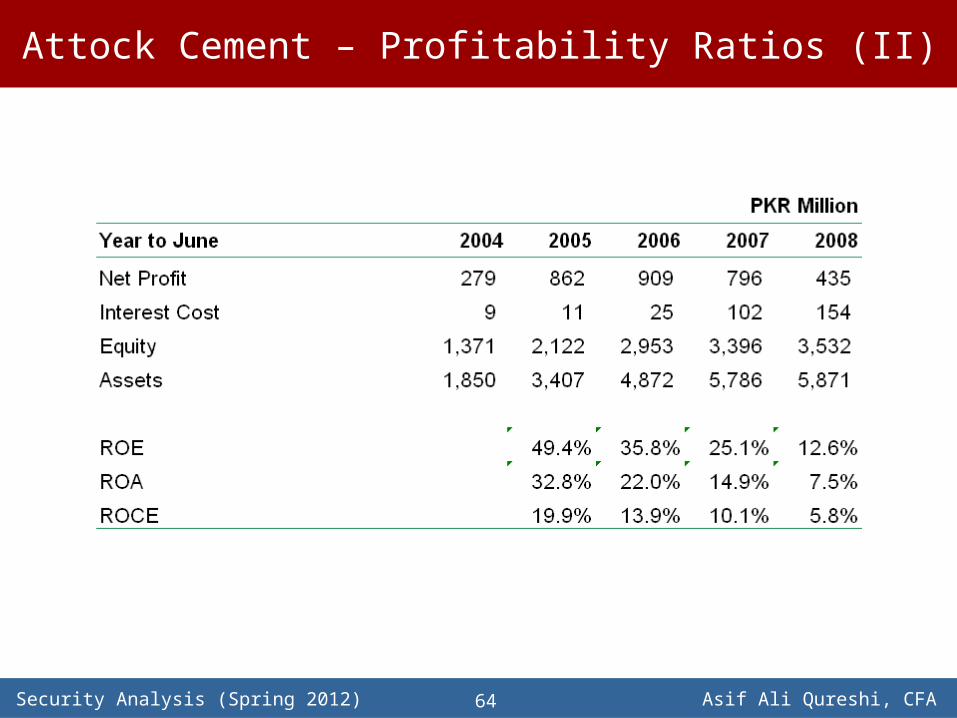
Attock Cement – Profitability Ratios (II)
Security Analysis (Spring 2012) Asif Ali Qureshi, CFA65
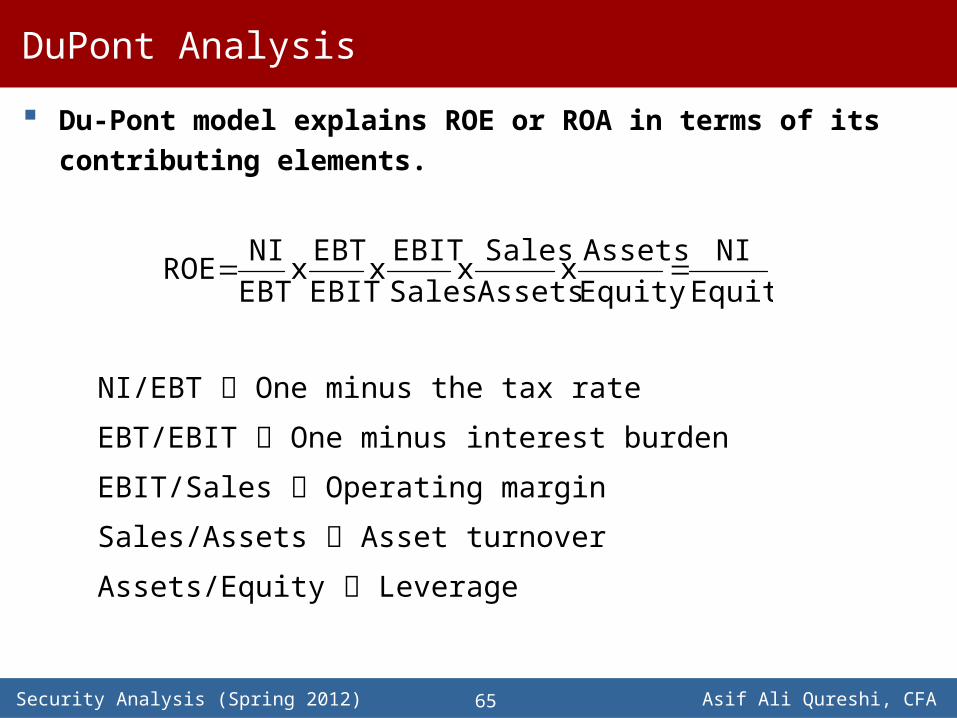
DuPont Analysis
Du-Pont model explains ROE or ROA in terms of its contributing elements.
EquityNI
Equity
Assets x
AssetsSales
x SalesEBIT
x EBITEBT
x EBTNI
ROE
NI/EBT One minus the tax rate
EBT/EBIT One minus interest burden
EBIT/Sales Operating margin
Sales/Assets Asset turnover
Assets/Equity Leverage
Security Analysis (Spring 2012) Asif Ali Qureshi, CFA66
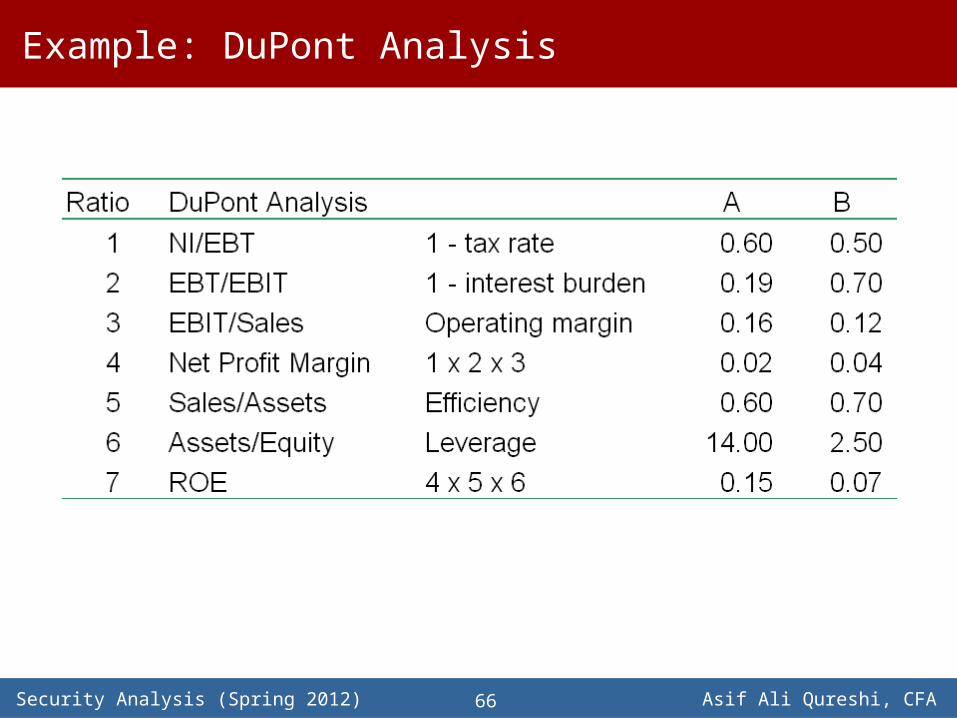
Example: DuPont Analysis
Security Analysis (Spring 2012) Asif Ali Qureshi, CFA67
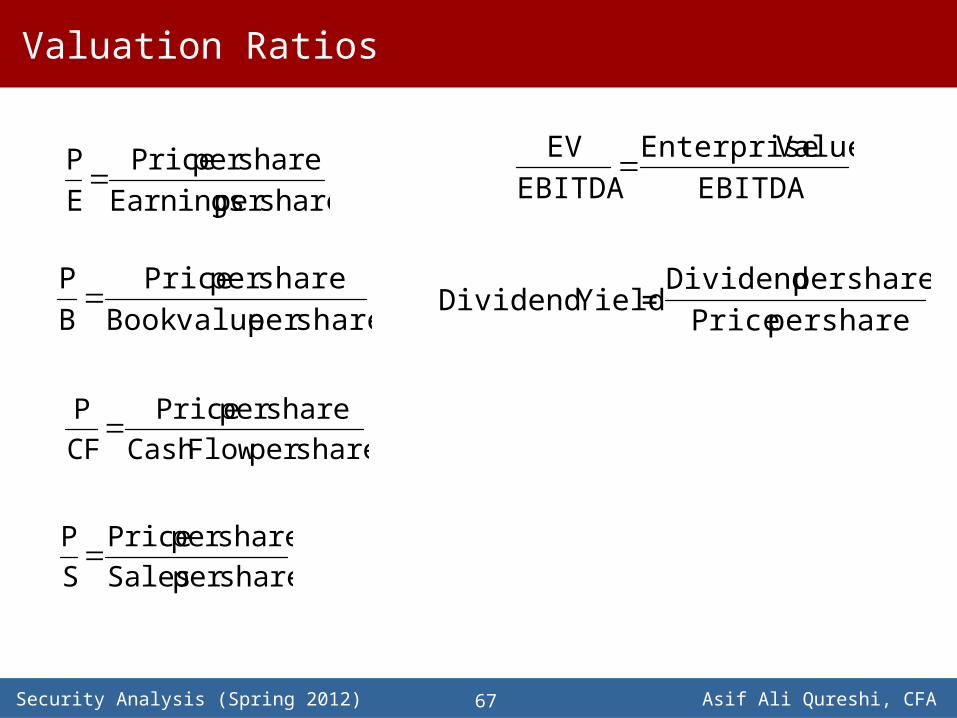
Valuation Ratios
share per Earningsshare per Price
EP
share per Flow Cashshare per Price
CFP
share per Salesshare per Price
SP
share per value Bookshare per Price
BP
EBITDAValue Enterprise
EBITDA
EV
share per Price
share per Dividend = YieldDividend
Security Analysis (Spring 2012) Asif Ali Qureshi, CFA68
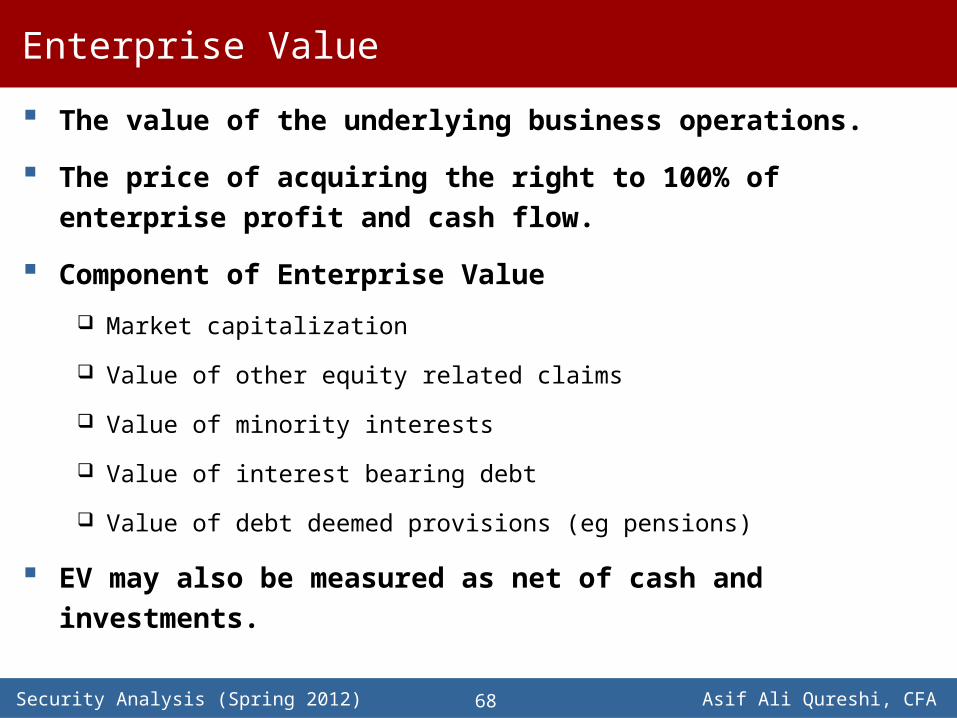
Enterprise Value
The value of the underlying business operations.
The price of acquiring the right to 100% of enterprise profit and cash flow.
Component of Enterprise Value
Market capitalization
Value of other equity related claims
Value of minority interests
Value of interest bearing debt
Value of debt deemed provisions (eg pensions)
EV may also be measured as net of cash and investments.
Security Analysis (Spring 2012) Asif Ali Qureshi, CFA69
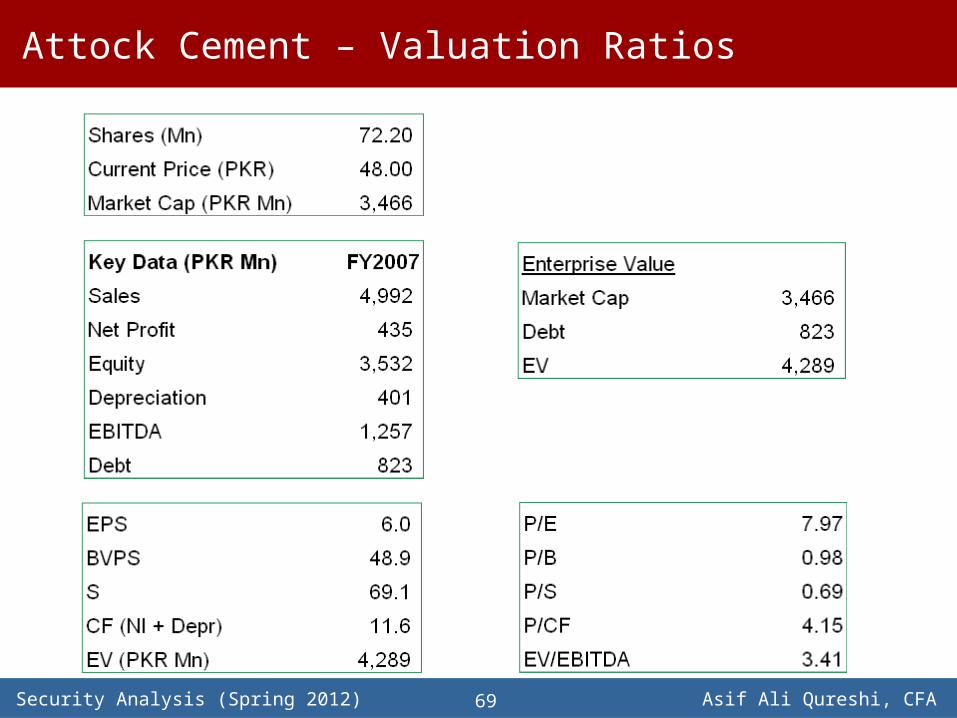
Attock Cement – Valuation Ratios