spps training presentation 1
TRANSCRIPT

Monday, May 1, 2023
JANUARY /2014JANUARY /2014
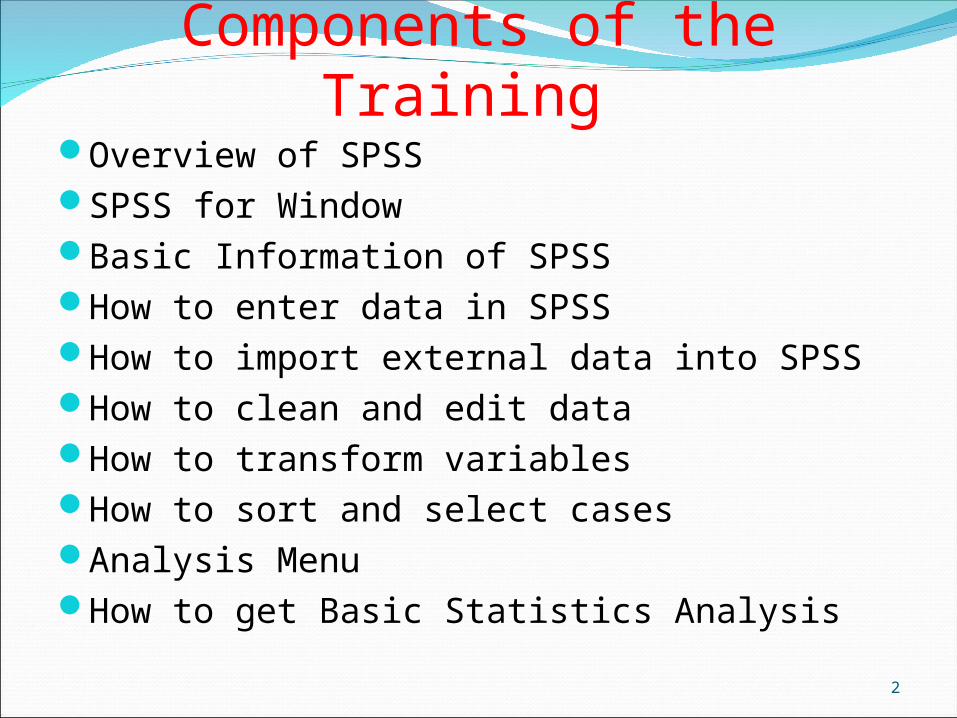
Components of the Training Overview of SPSS SPSS for Window Basic Information of SPSSHow to enter data in SPSSHow to import external data into SPSSHow to clean and edit dataHow to transform variablesHow to sort and select casesAnalysis MenuHow to get Basic Statistics Analysis
2
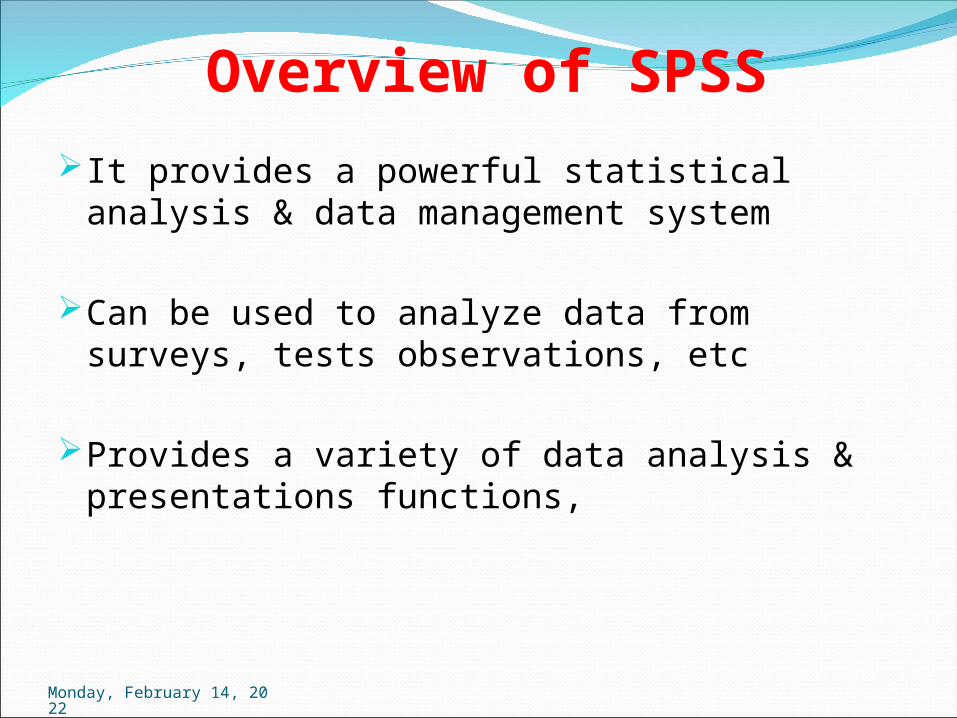
Overview of SPSSIt provides a powerful statistical analysis &
data management system
Can be used to analyze data from surveys, tests observations, etc
Provides a variety of data analysis & presentations functions,
Monday, May 1, 2023
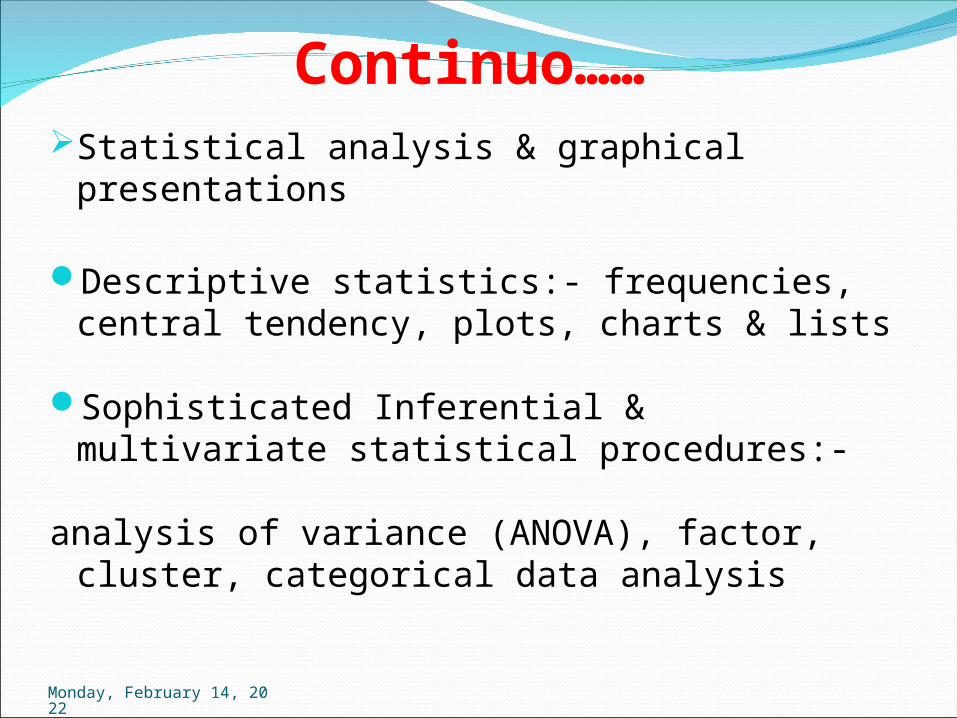
Continuo…… Statistical analysis & graphical
presentations
Descriptive statistics:- frequencies, central tendency, plots, charts & lists
Sophisticated Inferential & multivariate statistical procedures:-
analysis of variance (ANOVA), factor, cluster, categorical data analysis
Monday, May 1, 2023
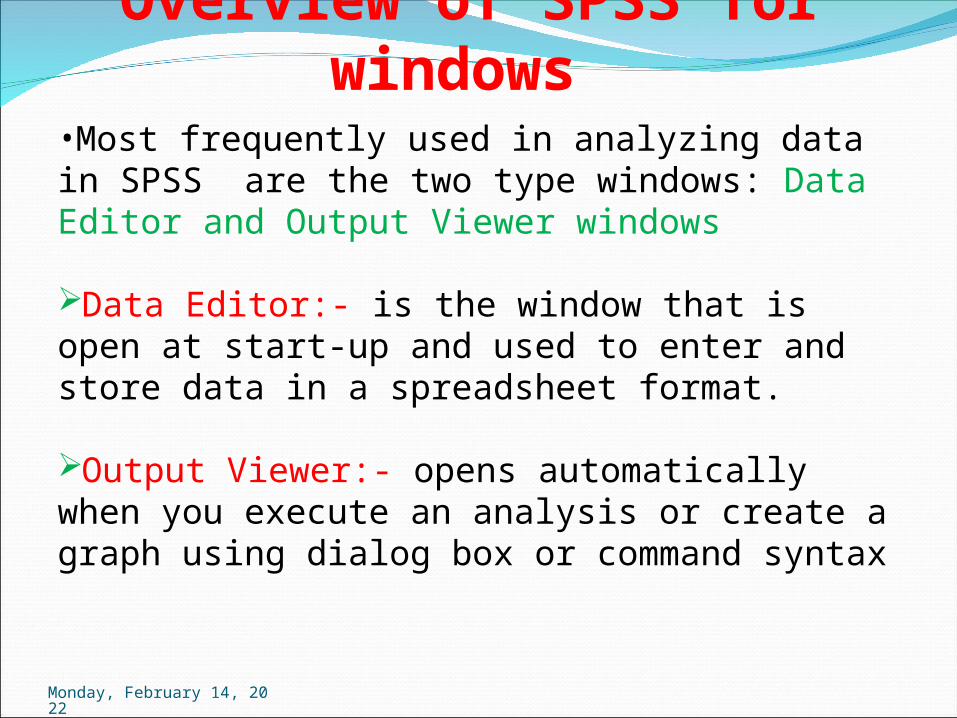
Overview of SPSS for windows
•Most frequently used in analyzing data in SPSS are the two type windows: Data Editor and Output Viewer windows
Data Editor:- is the window that is open at start-up and used to enter and store data in a spreadsheet format.
Output Viewer:- opens automatically when you execute an analysis or create a graph using dialog box or command syntax
Monday, May 1, 2023
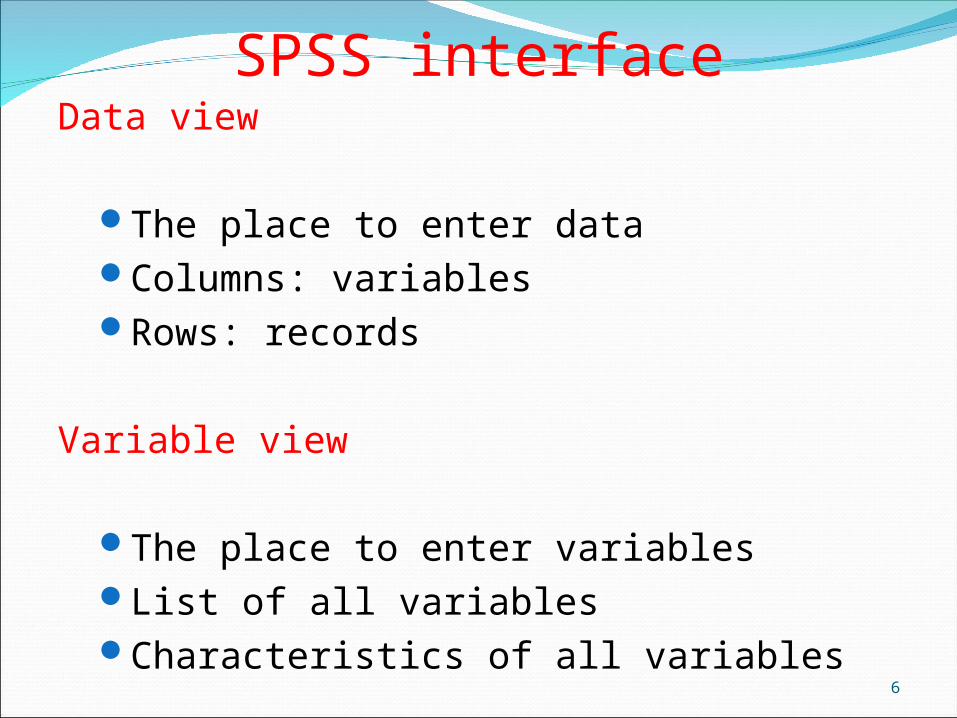
SPSS interfaceData view
The place to enter dataColumns: variablesRows: records
Variable view
The place to enter variablesList of all variablesCharacteristics of all variables
6
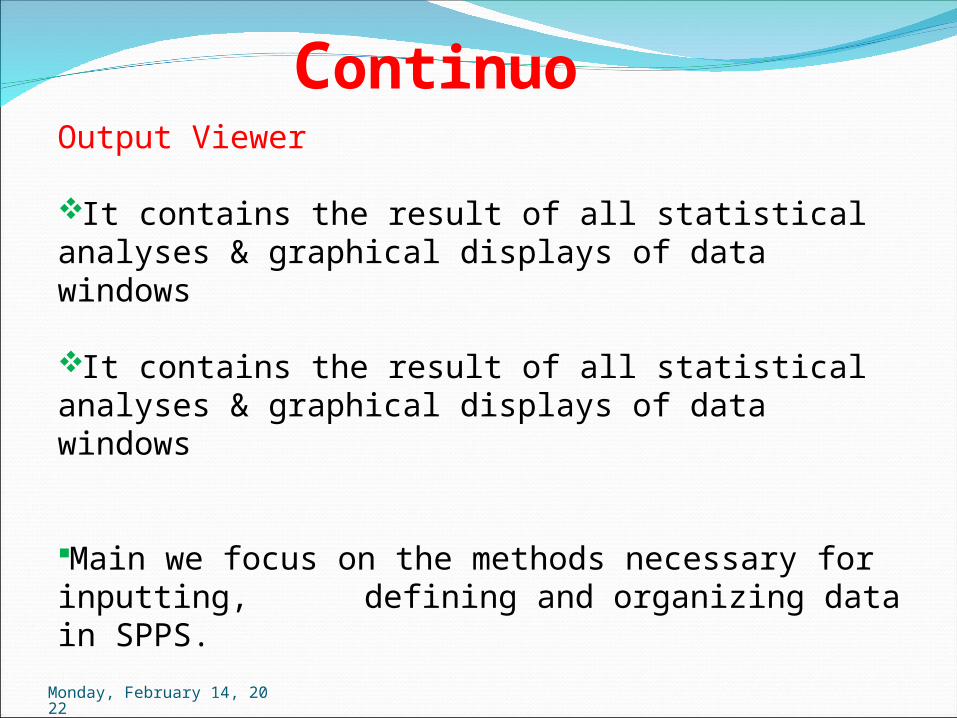
Continuo Output Viewer
It contains the result of all statistical analyses & graphical displays of data windows
It contains the result of all statistical analyses & graphical displays of data windows
Main we focus on the methods necessary for inputting, defining and organizing data in SPPS.
Monday, May 1, 2023

Basic Information of SPPsMenu Bar:The menu bar provides a series of “drop down”
commands to perform most essential SPSS functions.
By clicking on a menu command, a further series of menu options will appear.
File: These are the basic file management operations. (opening, saving, and printing files
Edit: This allows you to perform editing functions on the current data set. (cut, copy, clear, undo changes and redo changes
Monday, May 1, 2023
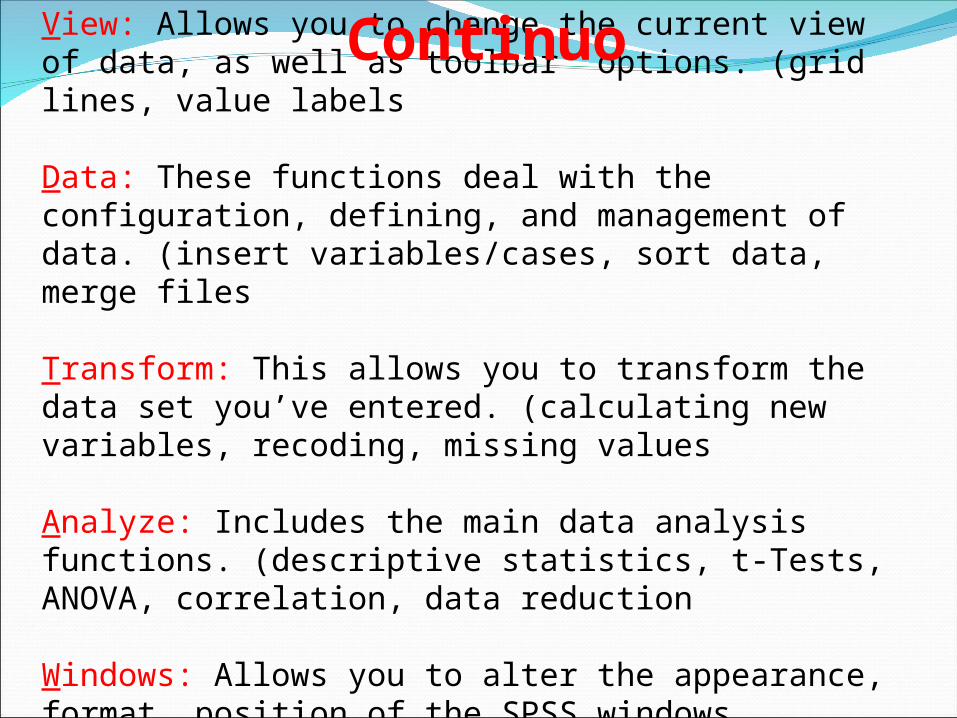
View: Allows you to change the current view of data, as well as toolbar options. (grid lines, value labels
Data: These functions deal with the configuration, defining, and management of data. (insert variables/cases, sort data, merge files
Transform: This allows you to transform the data set you’ve entered. (calculating new variables, recoding, missing values
Analyze: Includes the main data analysis functions. (descriptive statistics, t-Tests, ANOVA, correlation, data reduction
Windows: Allows you to alter the appearance, format, position of the SPSS windows.
Continuo
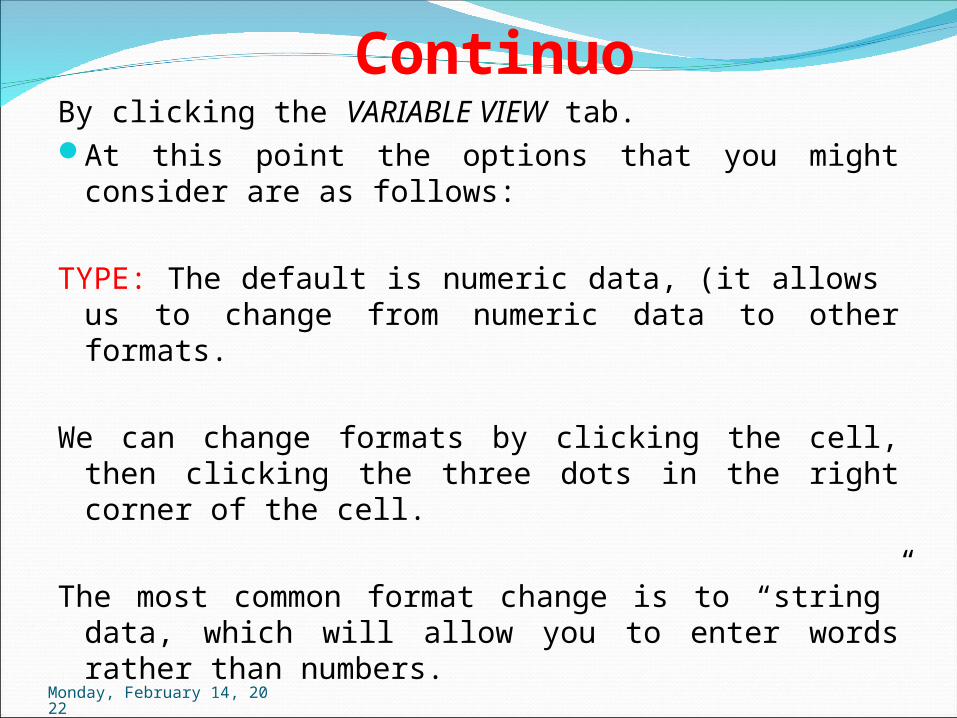
ContinuoBy clicking the VARIABLE VIEW tab.At this point the options that you might consider
are as follows:
TYPE: The default is numeric data, (it allows us to change from numeric data to other formats.
We can change formats by clicking the cell, then clicking the three dots in the right corner of the cell.
The most common format change is to “string” data, which will allow you to enter words rather than numbers.
Monday, May 1, 2023
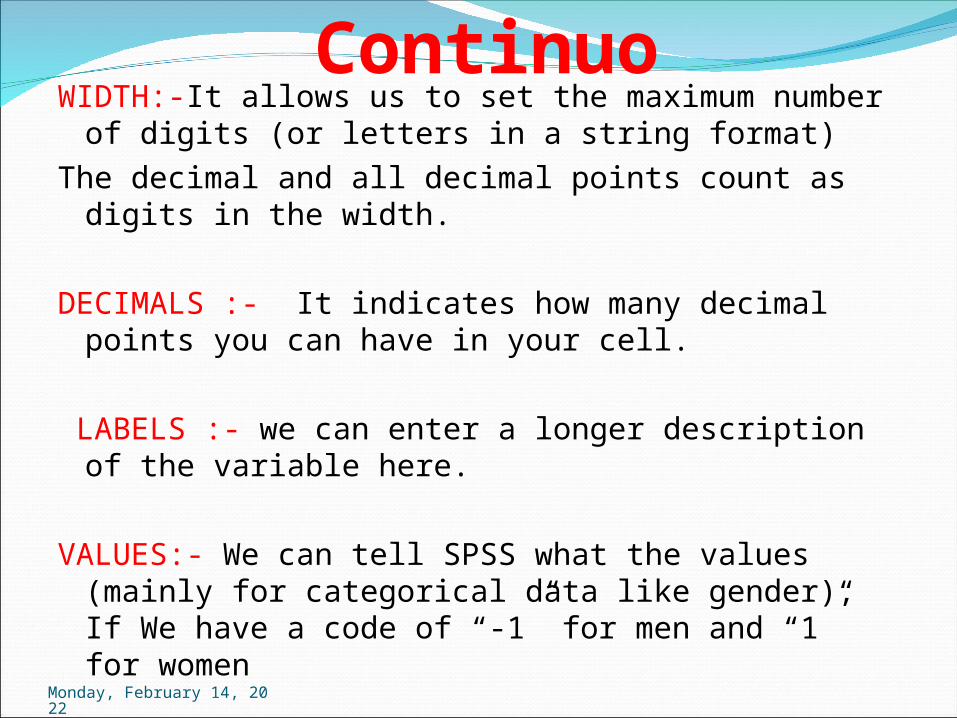
ContinuoWIDTH:-It allows us to set the maximum number of
digits (or letters in a string format) The decimal and all decimal points count as digits in
the width.
DECIMALS :- It indicates how many decimal points you can have in your cell.
LABELS :- we can enter a longer description of the variable here.
VALUES:- We can tell SPSS what the values (mainly for categorical data like gender), If We have a code of “-1” for men and “1” for women
Monday, May 1, 2023
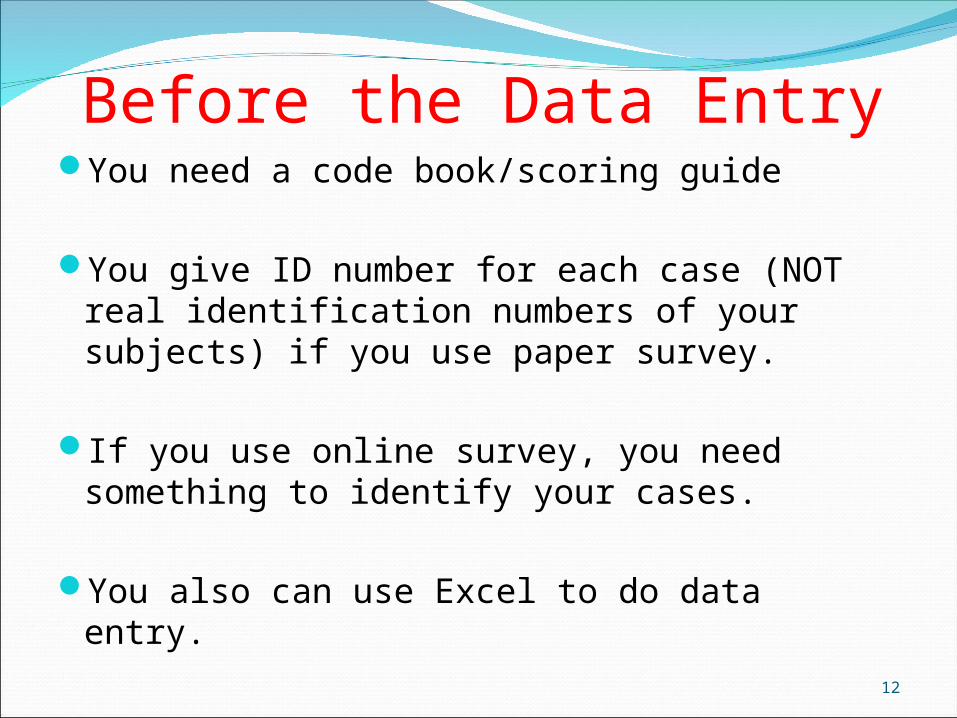
Before the Data EntryYou need a code book/scoring guide
You give ID number for each case (NOT real identification numbers of your subjects) if you use paper survey.
If you use online survey, you need something to identify your cases.
You also can use Excel to do data entry. 12

Example of a code book
13
A code book is about how you code your variables. What are in code book? 1.Variable names2.Values for each response option3.How to recode variables

Questionnaire Insert
Monday, May 1, 2023

Enter or Importing Data
Monday, May 1, 2023
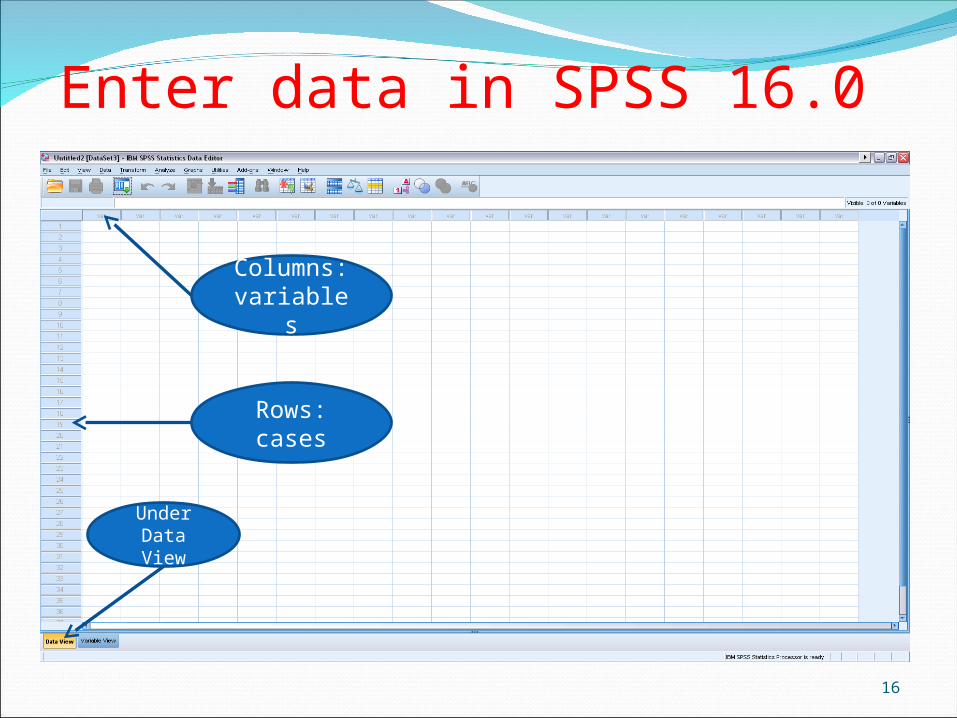
Enter data in SPSS 16.0
16
Columns: variables
Rows: cases
Under Data View

Enter variables
17
1. Click this
Window
1. Click Variable View2. Type variable name
under Name column (e.g. Q01).
NOTE: Variable name can be 64 bytes long, and the first character must be a letter or one of the characters @, #, or $.
3. Type: Numeric, string, etc.
4. Label: description of variables.
2. Type variable
name3. Type:
numeric or string
4. Description of variable
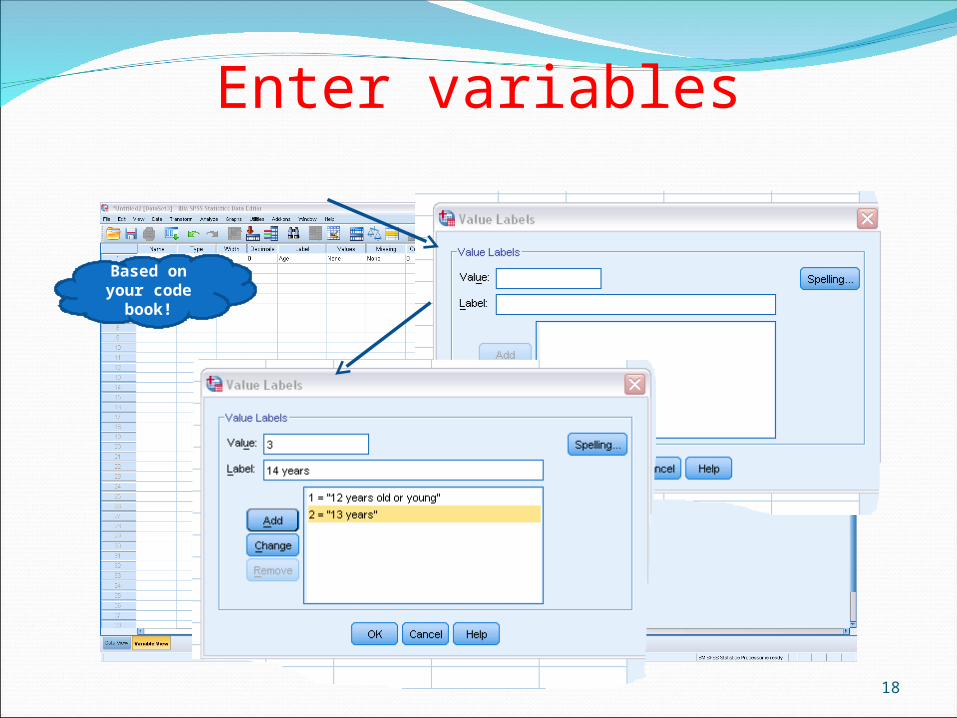
Enter variables
18
Based on your code
book!

Enter cases
19
Under Data View
1. Two variables in the data set.2. They are: Code and Q01.3. Code is an ID variable, used to identify
individual case (NOT people’s real IDs). 4. Q01 is about participants’ ages: 1 = 12
years or younger, 2 = 13 years, 3 = 14 years…

Import data from ExcelSelect File Open DataChoose Excel as file typeSelect the file you want to importThen click Open
20
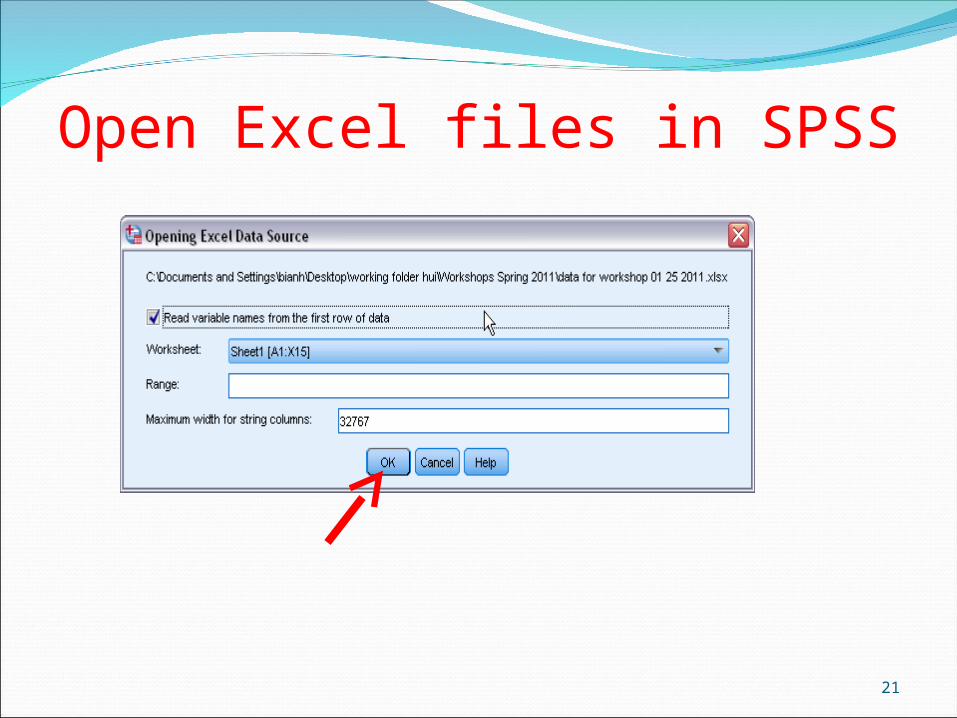
Open Excel files in SPSS
21
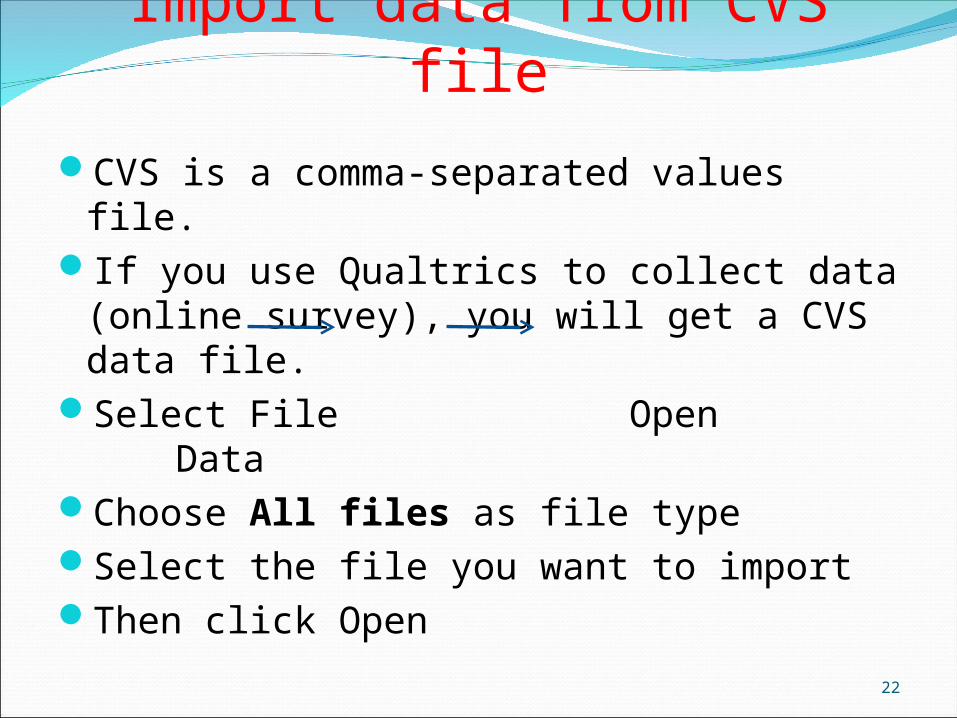
Import data from CVS fileCVS is a comma-separated values file.If you use Qualtrics to collect data (online
survey), you will get a CVS data file. Select File Open DataChoose All files as file typeSelect the file you want to importThen click Open
22
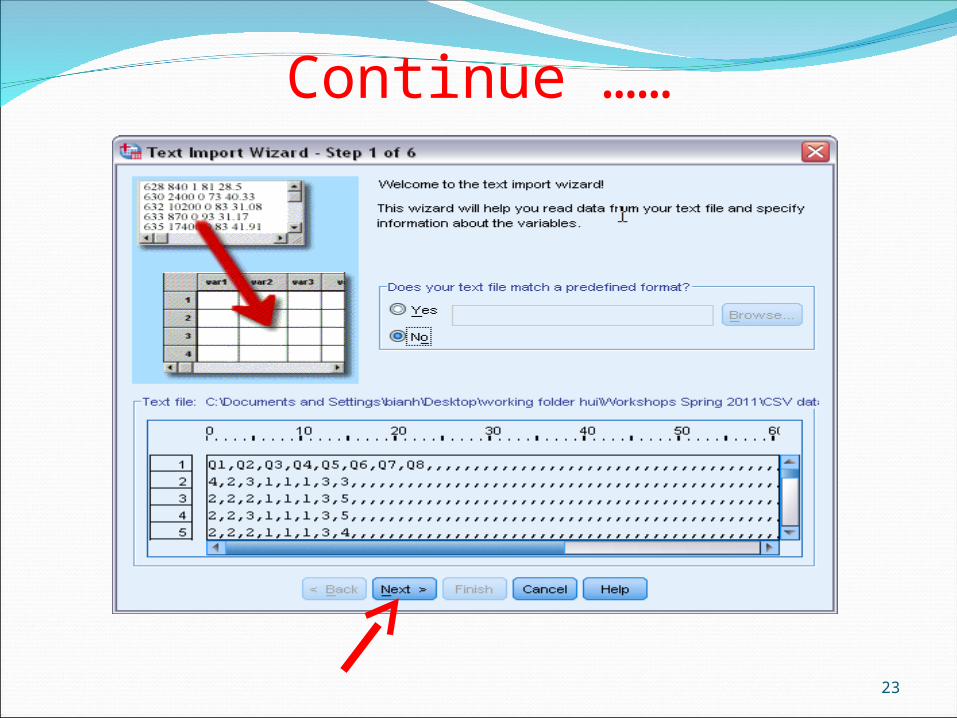
Continue ……
23
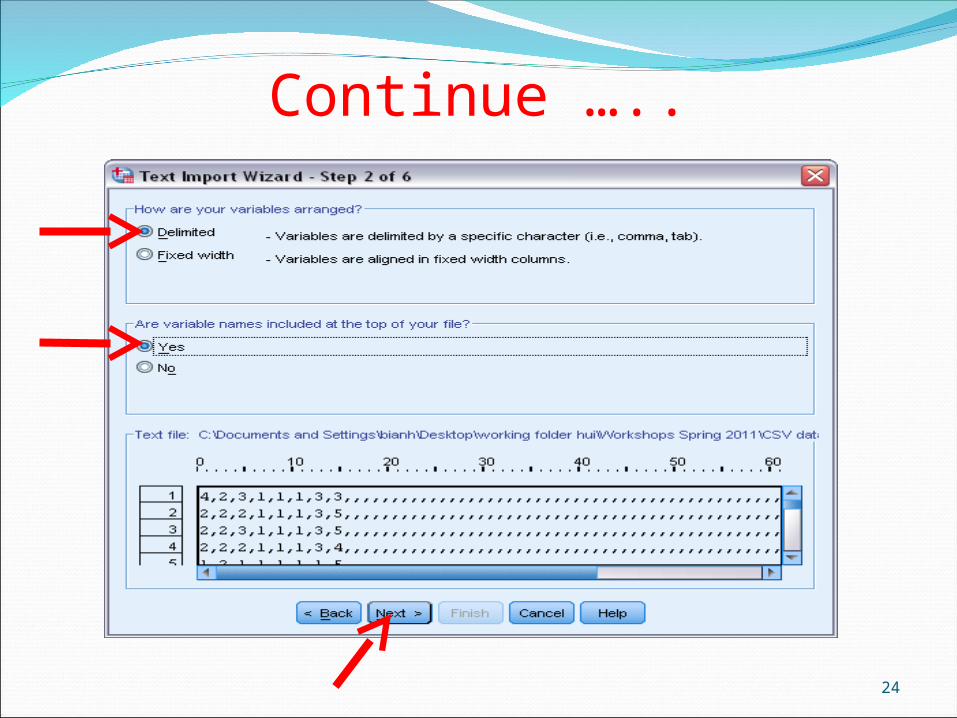
Continue …..
24
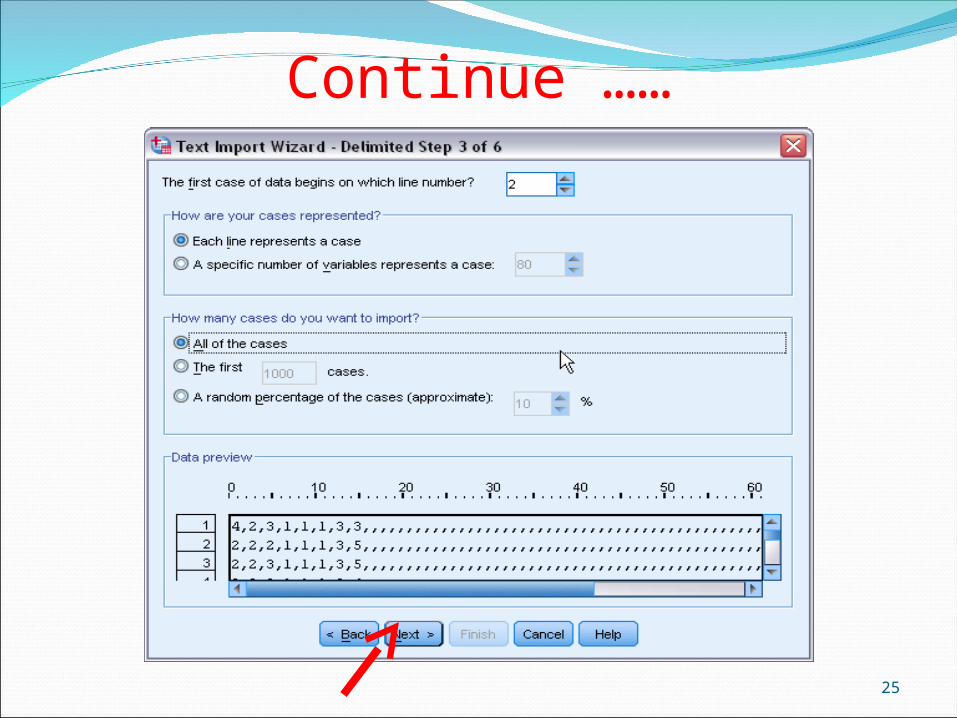
Continue ……
25
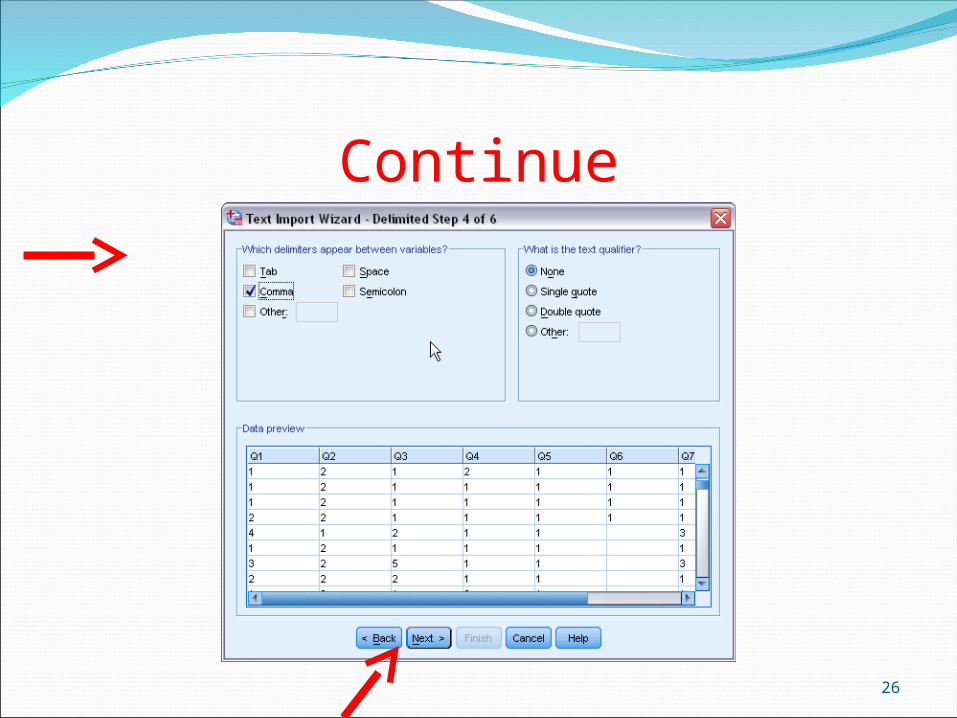
Continue
26

Continue
27
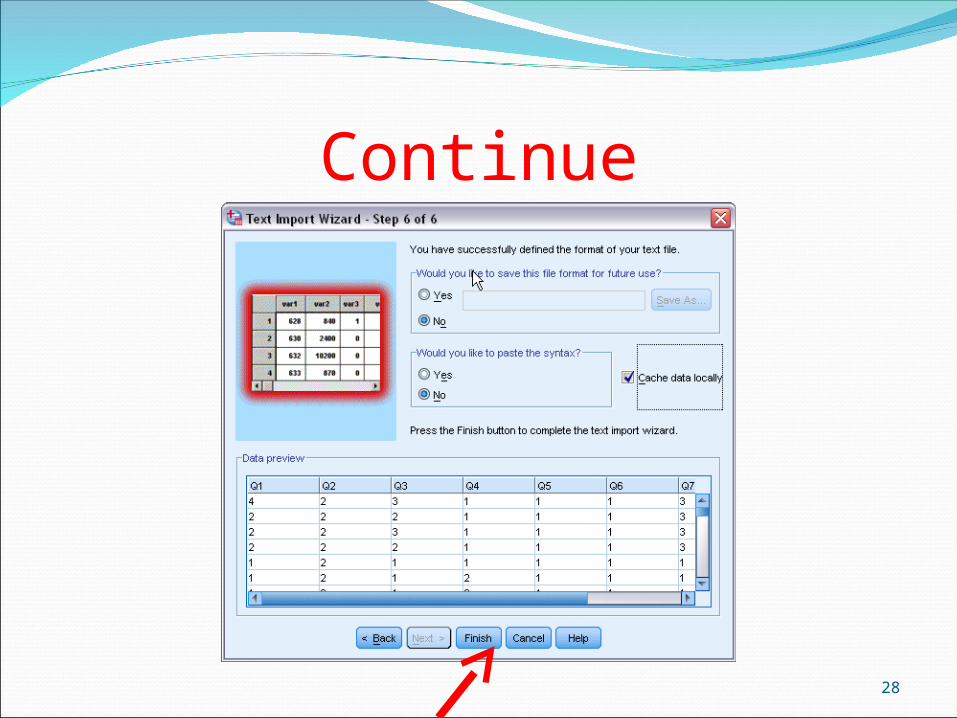
Continue
28
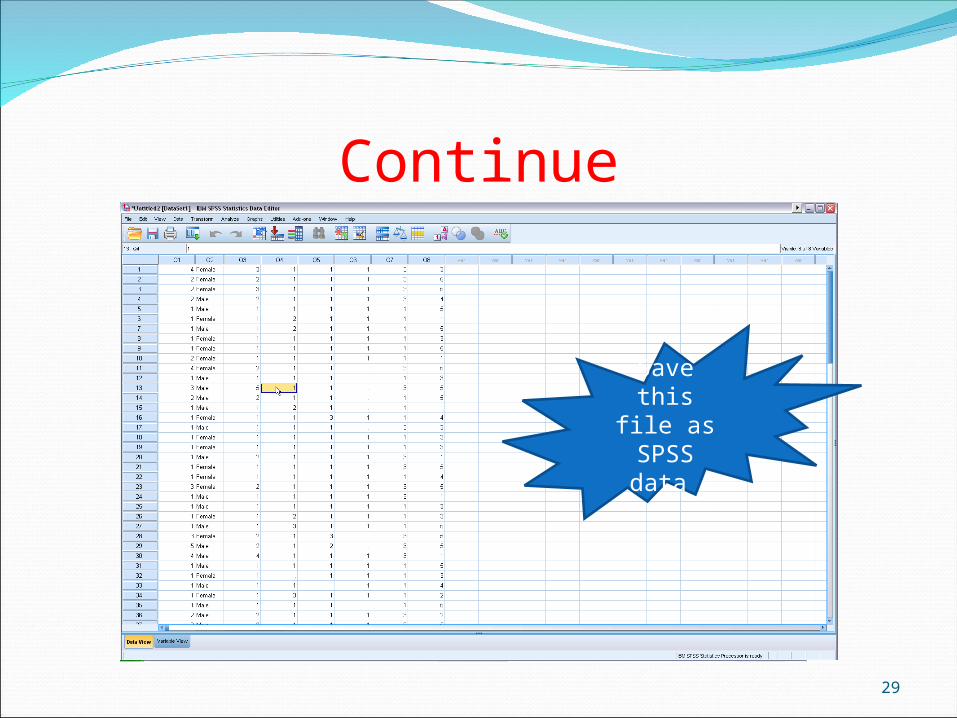
Continue
29
Save this file as
SPSS data
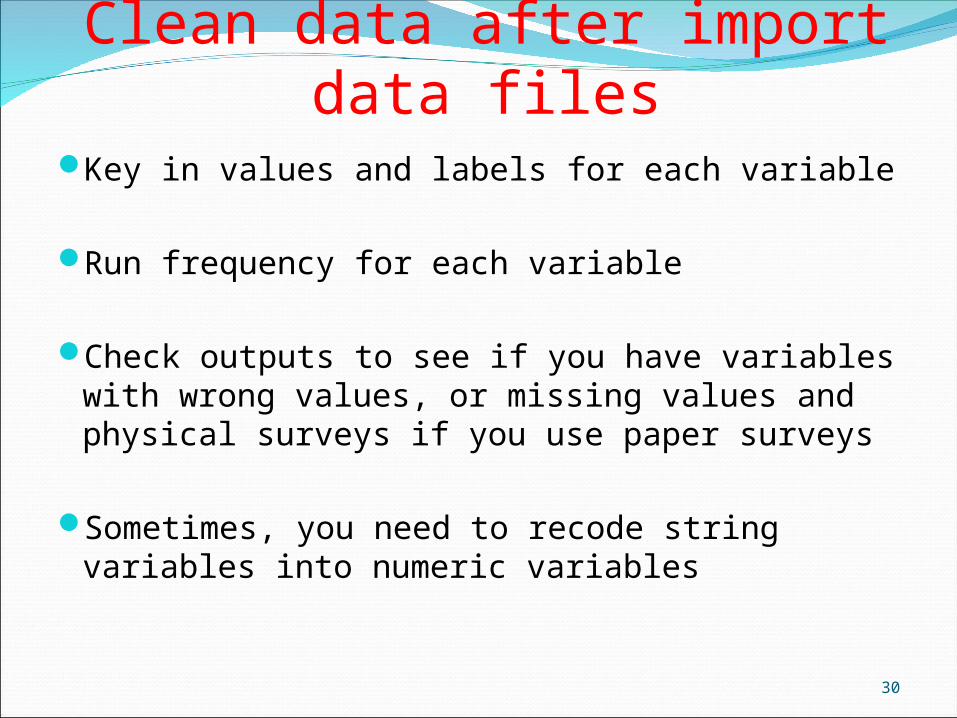
Clean data after import data files
Key in values and labels for each variable
Run frequency for each variable
Check outputs to see if you have variables with wrong values, or missing values and physical surveys if you use paper surveys
Sometimes, you need to recode string variables into numeric variables
30
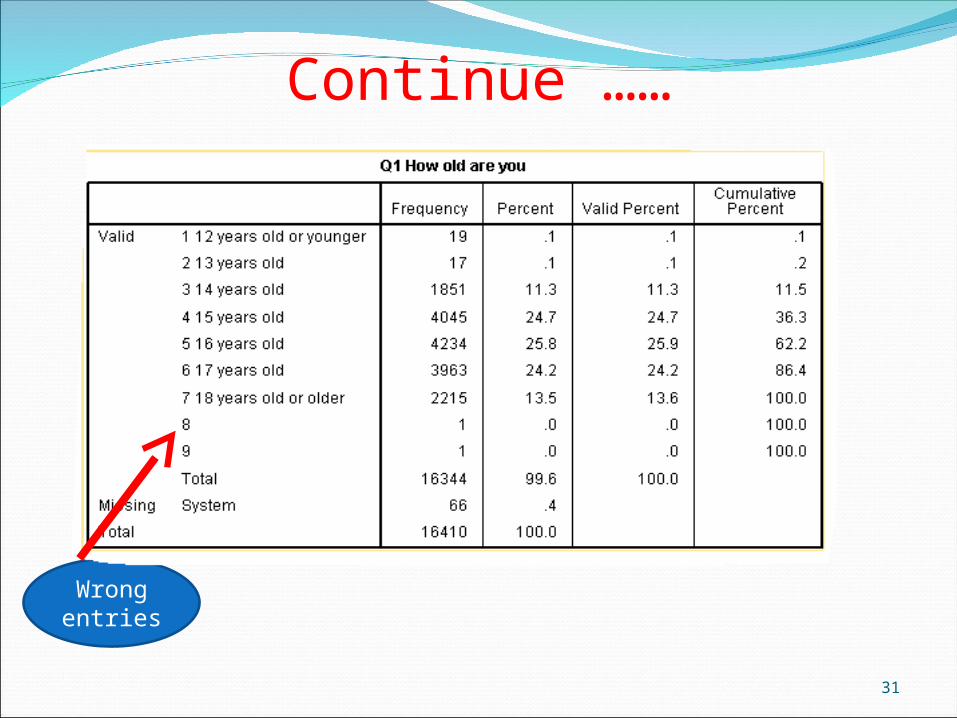
Continue ……
31
Wrong entries

Variable transformationRecode variables
32
1. Select Transform Recode into Different Variables
2. Select variable that you want to transform (e.g. Q20): we want1= Yes and 0 = No
3. Click Arrow button to put your variable into the right window
4. Under Output Variable: type name for new variable and label, then click Change
5. Click Old and New Values
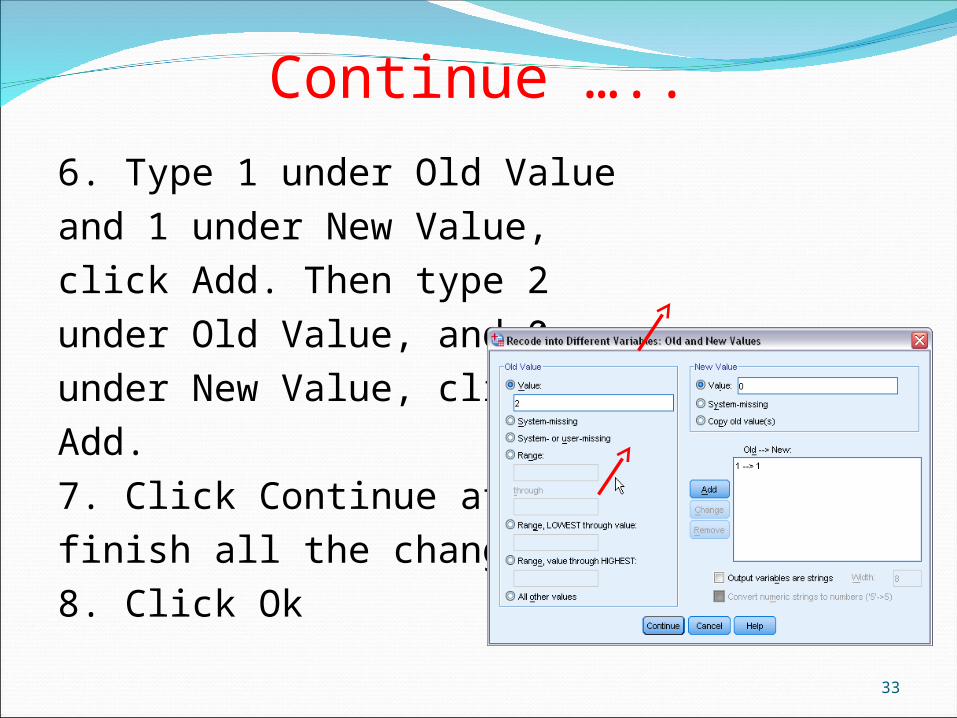
Continue …..6. Type 1 under Old Valueand 1 under New Value, click Add. Then type 2under Old Value, and 0under New Value, click Add.7. Click Continue after finish all the changes. 8. Click Ok
33
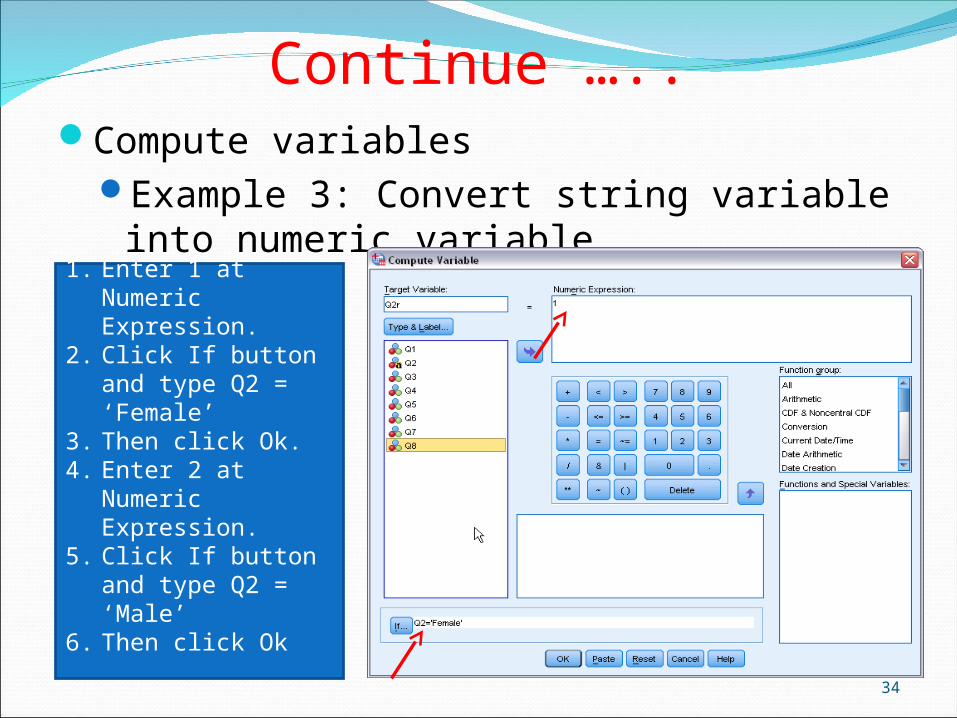
Continue …..Compute variables
Example 3: Convert string variable into numeric variable
34
1. Enter 1 at Numeric Expression.
2. Click If button and type Q2 = ‘Female’
3. Then click Ok.4. Enter 2 at
Numeric Expression.
5. Click If button and type Q2 = ‘Male’
6. Then click Ok
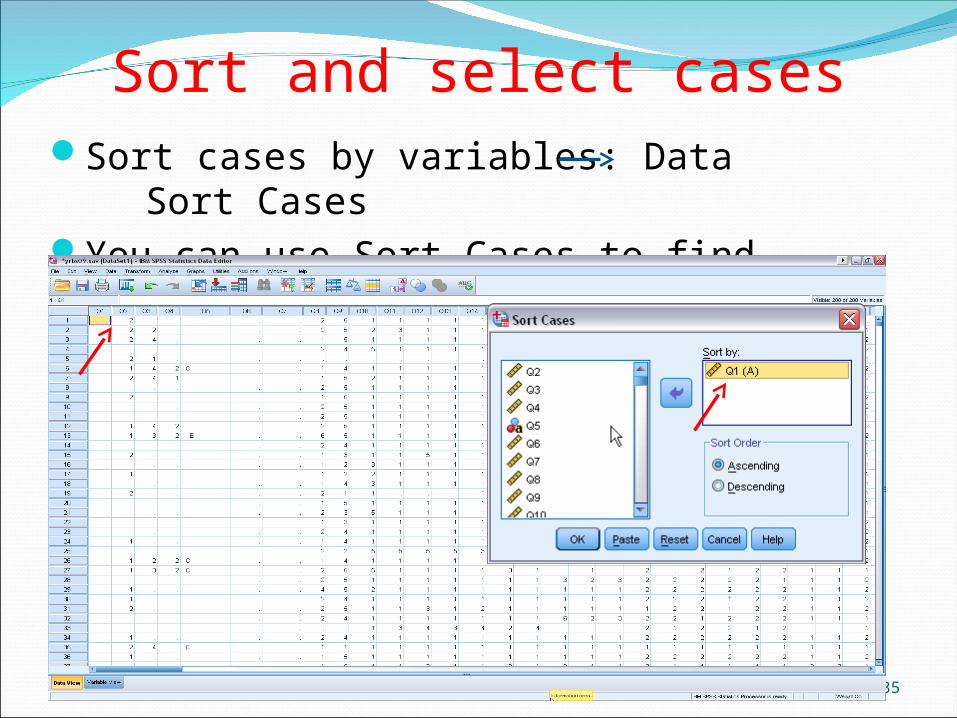
Sort and select casesSort cases by variables: Data Sort
Cases You can use Sort Cases to find missing.
35
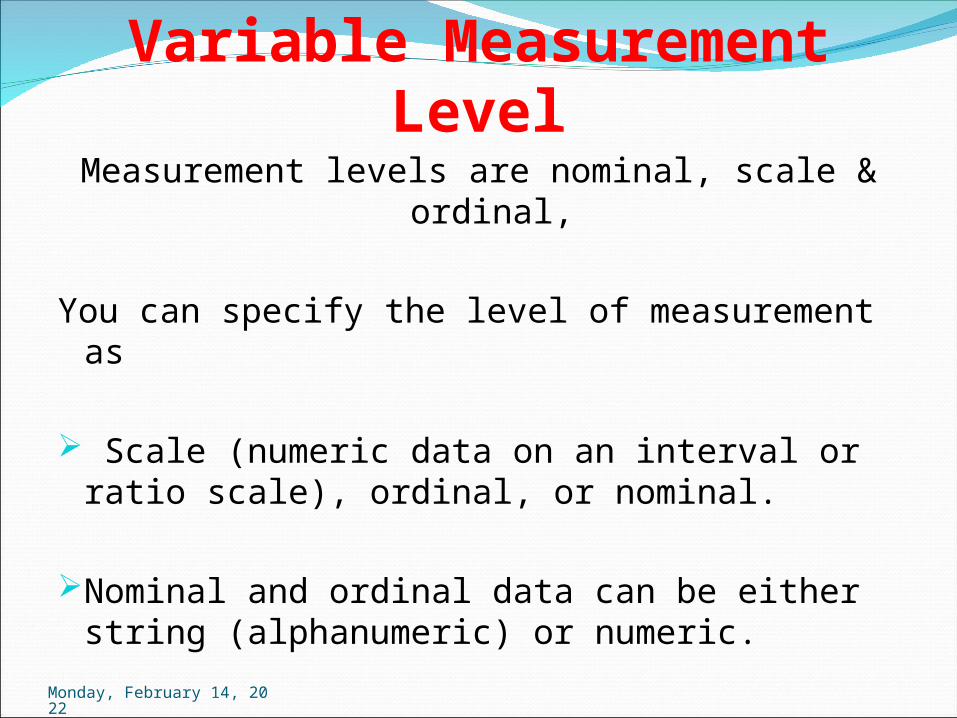
Variable Measurement Level
Measurement levels are nominal, scale & ordinal,
You can specify the level of measurement as Scale (numeric data on an interval or ratio
scale), ordinal, or nominal.
Nominal and ordinal data can be either string (alphanumeric) or numeric.
Monday, May 1, 2023

Continuo ……Nominal:- a variable can be treated as
nominal when its values represent categories with no intrinsic ranking .
For example:- department of the company in which an employee works,
It include region, zip code, and religious affiliation.
Monday, May 1, 2023
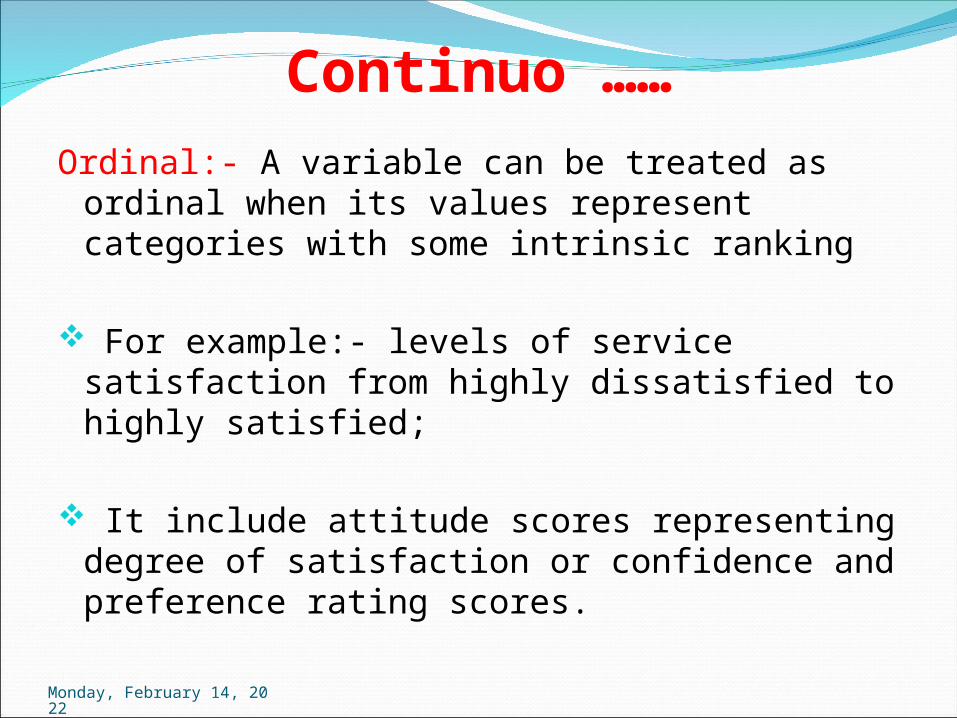
Continuo ……Ordinal:- A variable can be treated as ordinal
when its values represent categories with some intrinsic ranking
For example:- levels of service satisfaction from highly dissatisfied to highly satisfied;
It include attitude scores representing degree of satisfaction or confidence and preference rating scores.
Monday, May 1, 2023
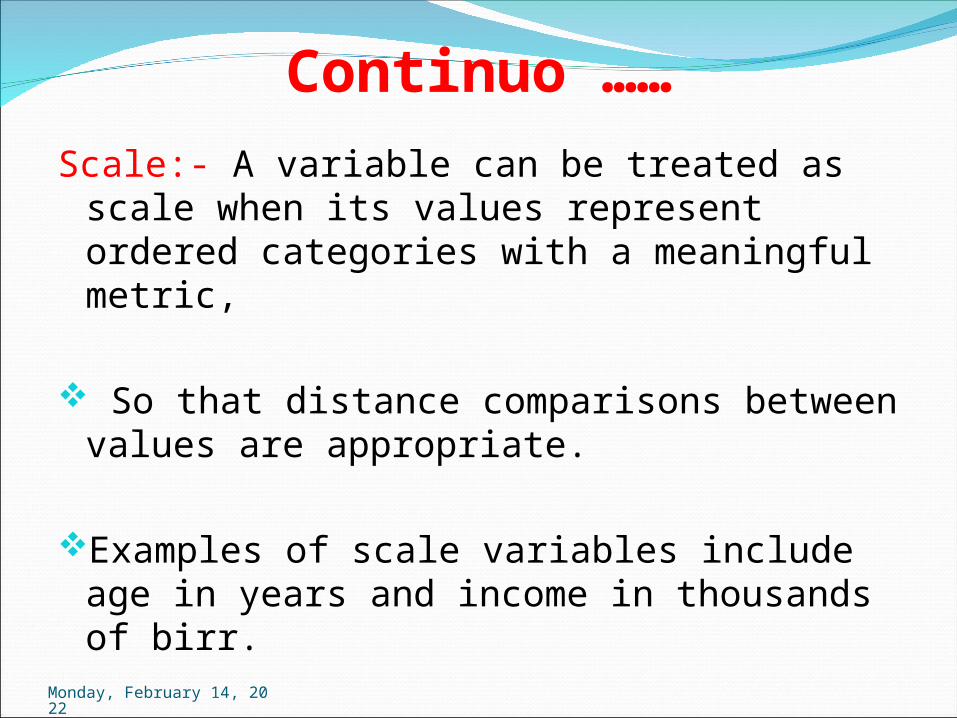
Continuo ……Scale:- A variable can be treated as scale
when its values represent ordered categories with a meaningful metric,
So that distance comparisons between values are appropriate.
Examples of scale variables include age in years and income in thousands of birr.
Monday, May 1, 2023
Continuo …..Note: For ordinal string variables, the
alphabetic order of string values is assumed to reflect the true order of the categories.
For example, for a string variable with the values of low, medium & high
The order of the categories is interpreted as high, low, medium, which is not the correct order.
In general, it is more reliable to use numeric codes to represent ordinal data.
Monday, May 1, 2023
Continuo …….New numeric variables created during a session
are assigned the scale measurement level.
For data read from external file formats and SPSS data files that were created prior to version 8.0, default assignment of measurement level is based on the following rules:
Numeric variables with fewer than 24 unique values and string variables are set to nominal.
Numeric variables with 24 or more unique values are set to scale.
Monday, May 1, 2023
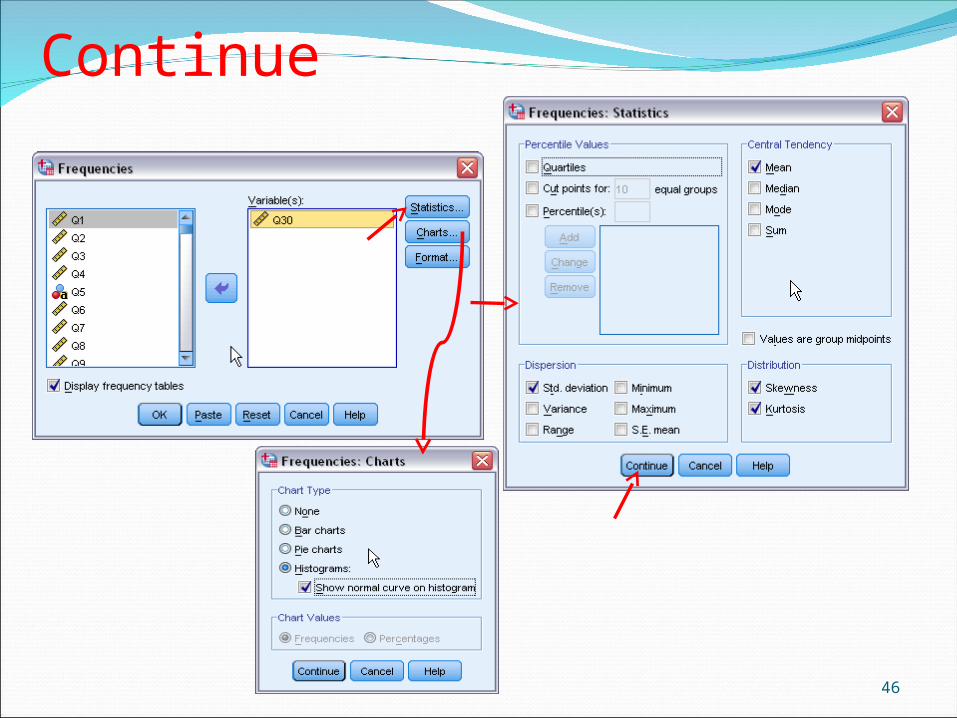
ANALAYSE MENUReports
We can choose one or more of the following subgroup statistics for the summary variables within each category of each grouping variable:-
Sum, number of cases, mean, median, grouped median
Standard error of the mean, minimum, maximum, range, variable value of the first or last category of the grouping variable
Monday, May 1, 2023
Continuo ……. Standard deviation, variance, kurtosis,
standard error of kurtosis, skewness, standard error of skewness, percentage of total cases,
Percentage of total sum, percentage of total cases within grouping variables
Percentage of total sum within grouping variables, geometric mean, and harmonic mean.
Monday, May 1, 2023
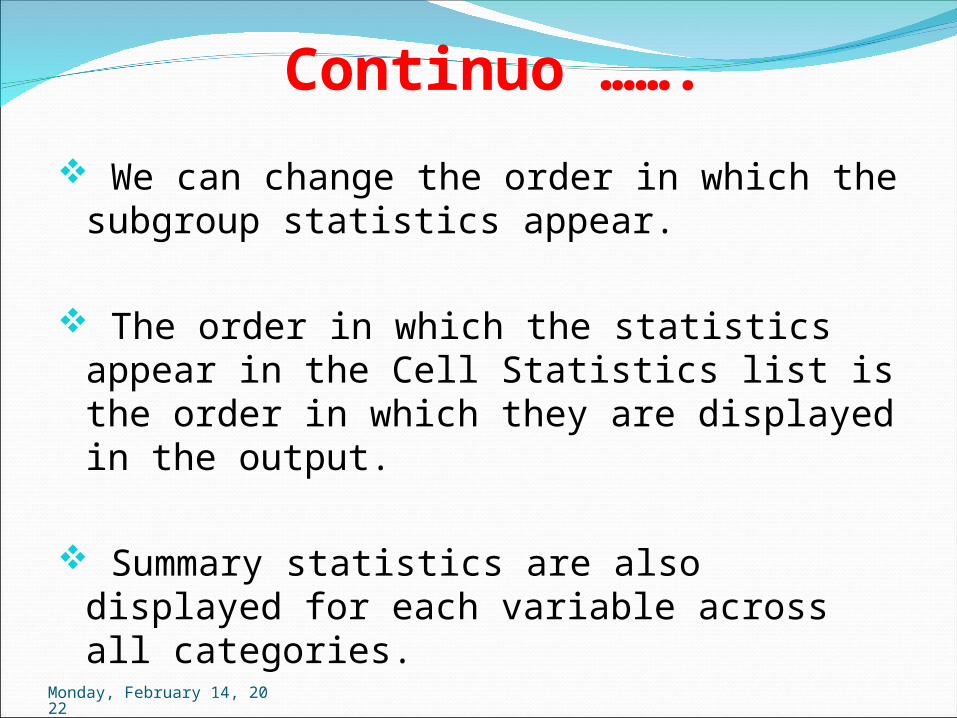
Continuo ……. We can change the order in which the
subgroup statistics appear.
The order in which the statistics appear in the Cell Statistics list is the order in which they are displayed in the output.
Summary statistics are also displayed for each variable across all categories.
Monday, May 1, 2023
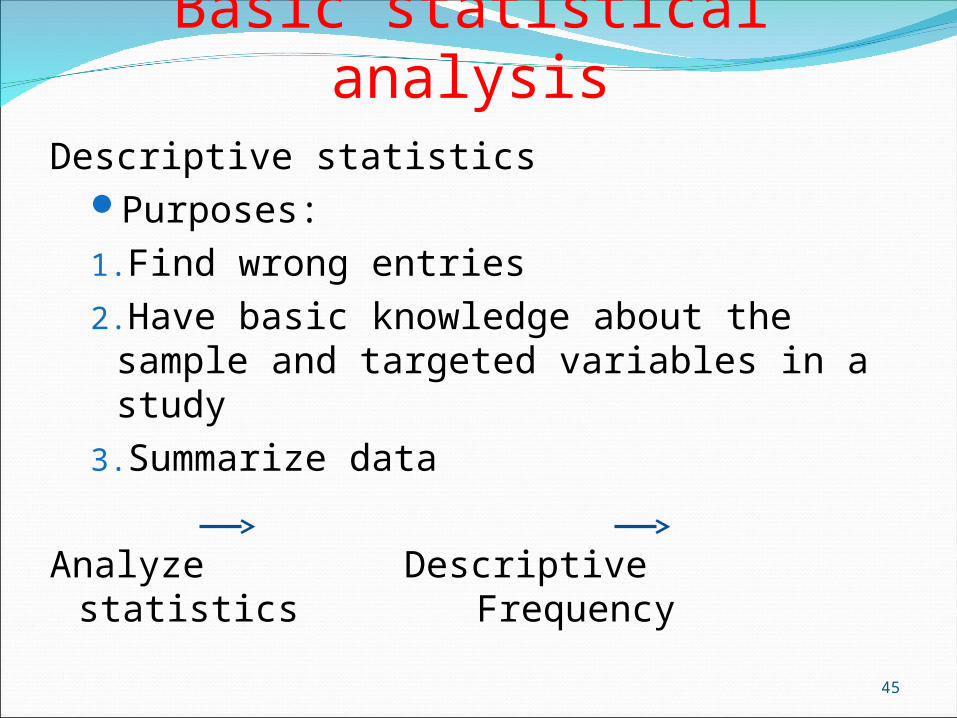
Basic statistical analysisDescriptive statistics
Purposes: 1.Find wrong entries2.Have basic knowledge about the sample
and targeted variables in a study3.Summarize data
Analyze Descriptive statistics Frequency
45
Continue
46
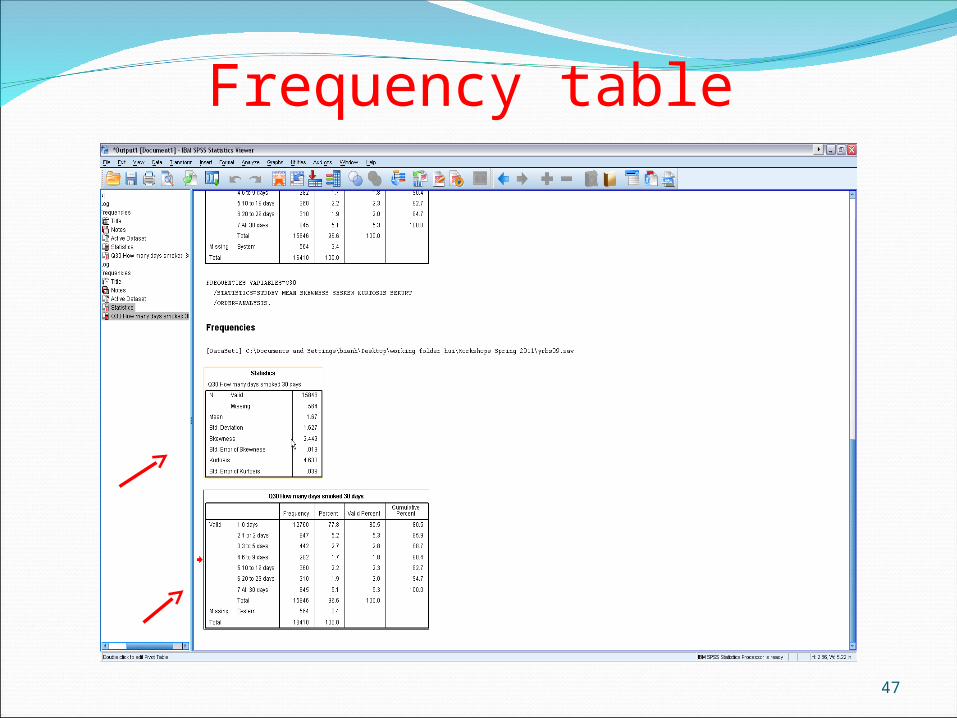
Frequency table
47
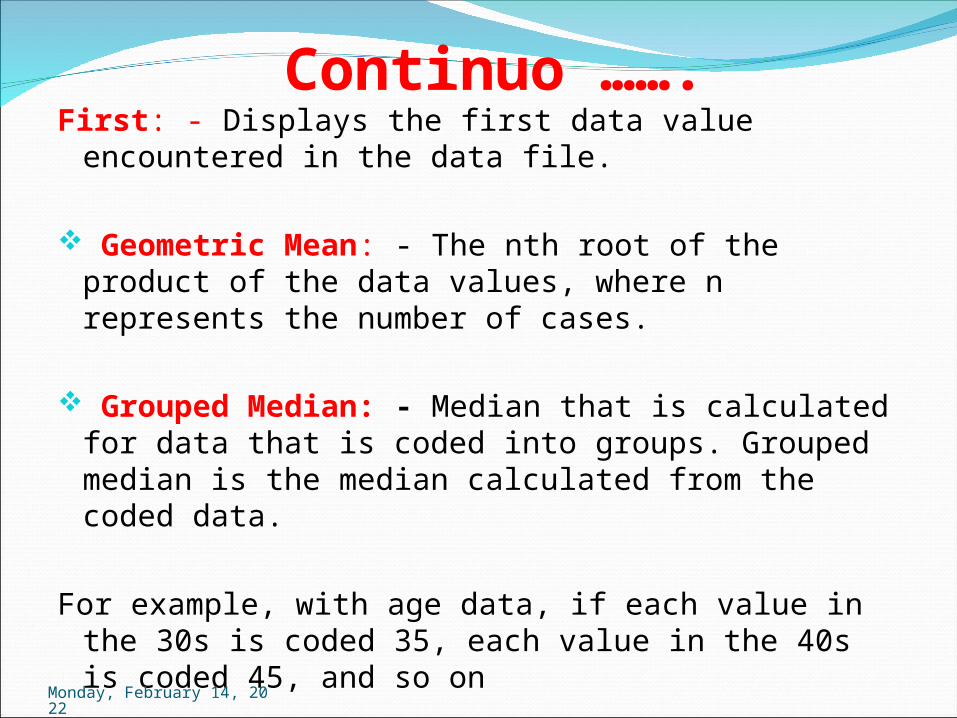
Continuo …….First: - Displays the first data value encountered in
the data file.
Geometric Mean: - The nth root of the product of the data values, where n represents the number of cases.
Grouped Median: - Median that is calculated for data that is coded into groups. Grouped median is the median calculated from the coded data.
For example, with age data, if each value in the 30s is coded 35, each value in the 40s is coded 45, and so on
Monday, May 1, 2023
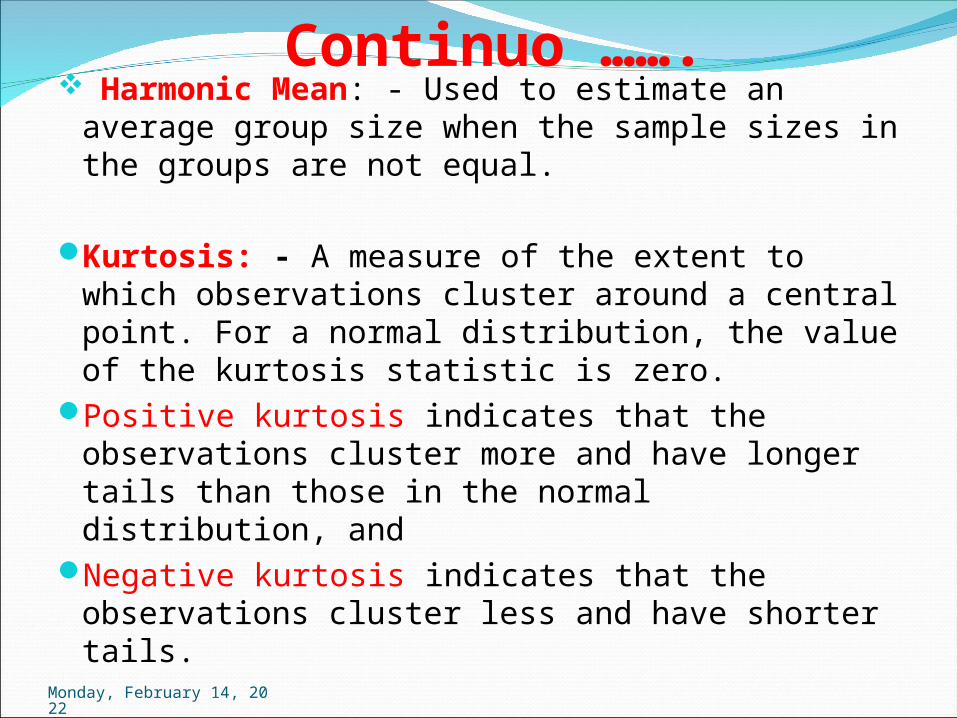
Continuo ……. Harmonic Mean: - Used to estimate an
average group size when the sample sizes in the groups are not equal.
Kurtosis: - A measure of the extent to which observations cluster around a central point. For a normal distribution, the value of the kurtosis statistic is zero.
Positive kurtosis indicates that the observations cluster more and have longer tails than those in the normal distribution, and
Negative kurtosis indicates that the observations cluster less and have shorter tails.
Monday, May 1, 2023

50
Normal
Curve
Monday, May 1, 2023
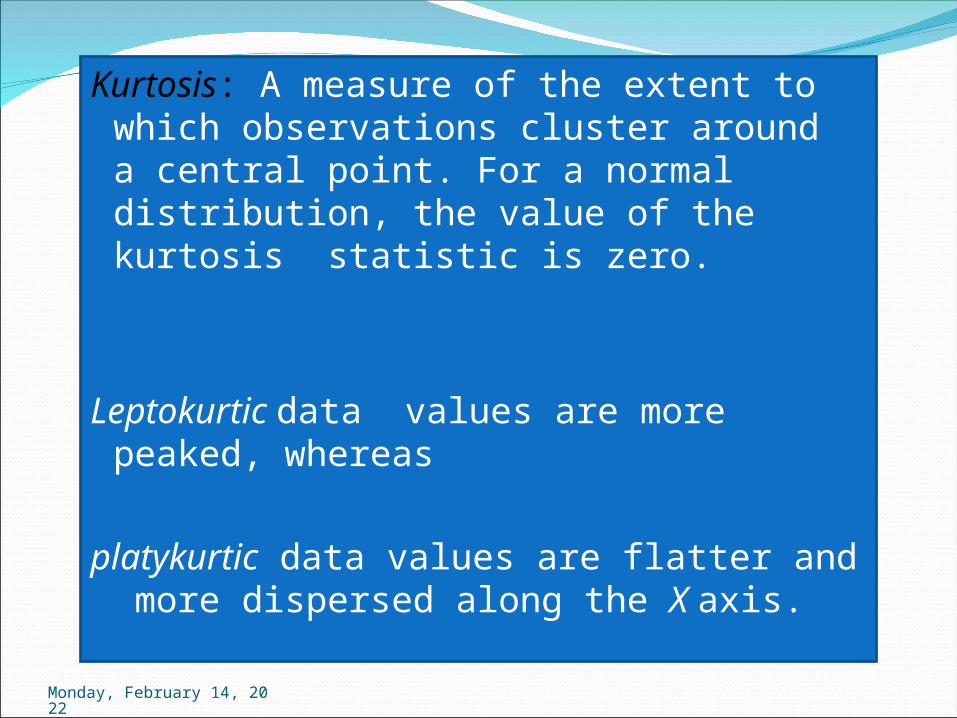
Kurtosis: A measure of the extent to which observations cluster around a central point. For a normal distribution, the value of the kurtosis statistic is zero.
Leptokurtic data values are more peaked, whereas
platykurtic data values are flatter and more dispersed along the X axis.
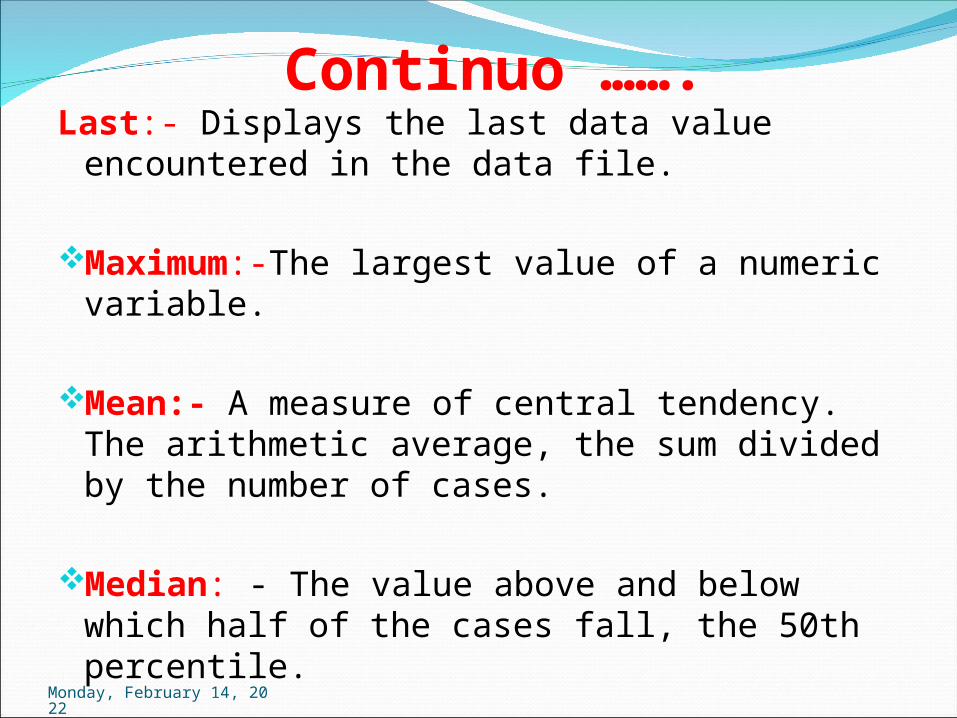
Continuo …….Last:- Displays the last data value
encountered in the data file.
Maximum:-The largest value of a numeric variable.
Mean:- A measure of central tendency. The arithmetic average, the sum divided by the number of cases.
Median: - The value above and below which half of the cases fall, the 50th percentile.
Monday, May 1, 2023

Continuo …….If there is an even number of cases, the
median is the average of the two middle cases when they are sorted in ascending or descending order.
Minimum: - The smallest value of a numeric variable.
N. The number of cases (observations or
records). Monday, May 1, 2023
Continuo …….Percent of N in: - Percentage of the
number of cases for the specified grouping variable within categories of other grouping variables.
If you only have one grouping variable, this value is identical to percentage of total number of cases.
Percent of Total N:-Percentage of the total number of cases in each category.
Monday, May 1, 2023
Continuo …….Percent of Sum in: - Percentage of the
sum for the specified grouping variable within categories of other grouping variables.
If you only have one grouping variable, this value is identical to percentage of total sum
Percent of Total Sum: - Percentage of the total sum in each category.
Monday, May 1, 2023
Continuo …….
Range: - The difference between the largest and smallest values of a numeric variable, the maximum minus the minimum.
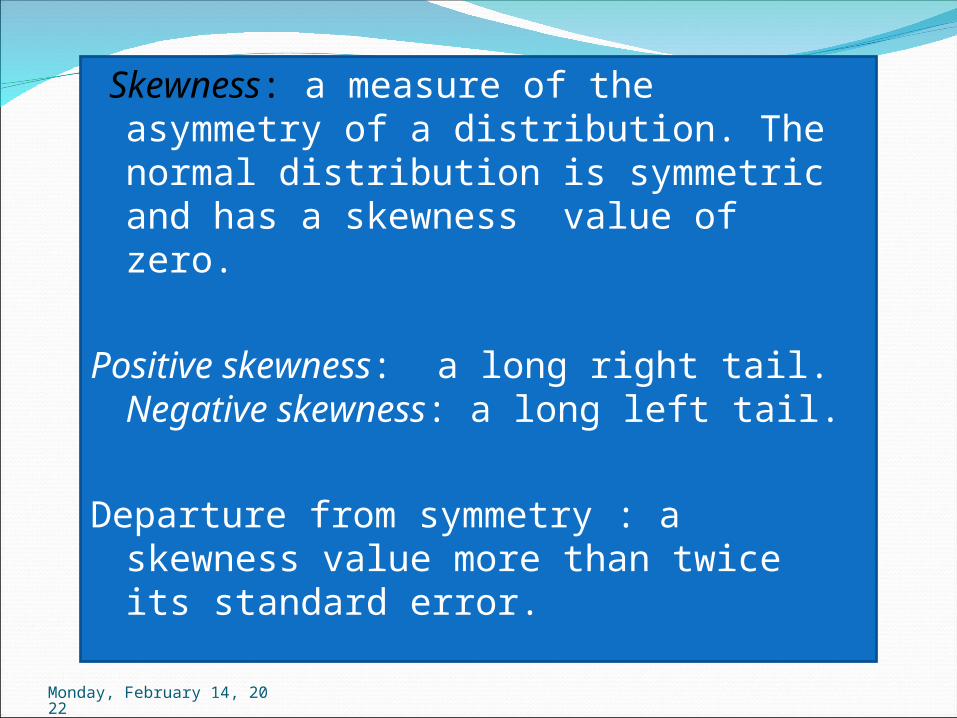
Skewness: - A measure of the asymmetry of a distribution. The normal distribution is symmetric and has a skewness value of 0.
Monday, May 1, 2023
Continuo ……. A distribution with a significant positive
skewness has a long right tail
A distribution with a significant negative skewness has a long left tail.
As a guideline, a skewness value more than twice its standard error is taken to indicate a departure from symmetry.
Monday, May 1, 2023
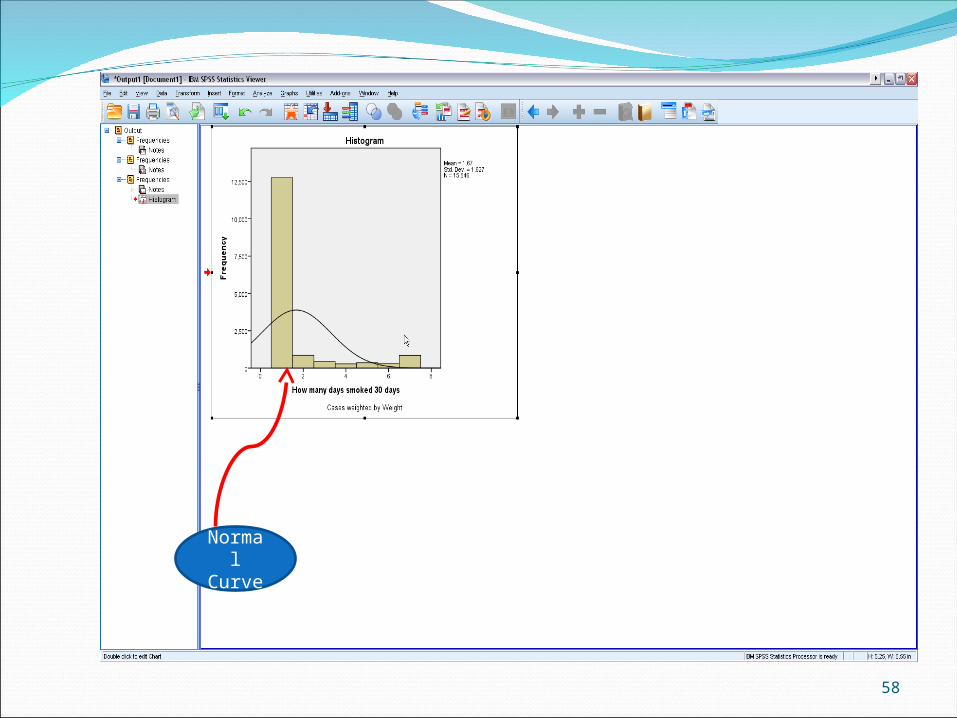
58
Normal
Curve
Monday, May 1, 2023
Skewness: a measure of the asymmetry of a distribution. The normal distribution is symmetric and has a skewness value of zero.
Positive skewness: a long right tail. Negative skewness: a long left tail.
Departure from symmetry : a skewness value more than twice its standard error.
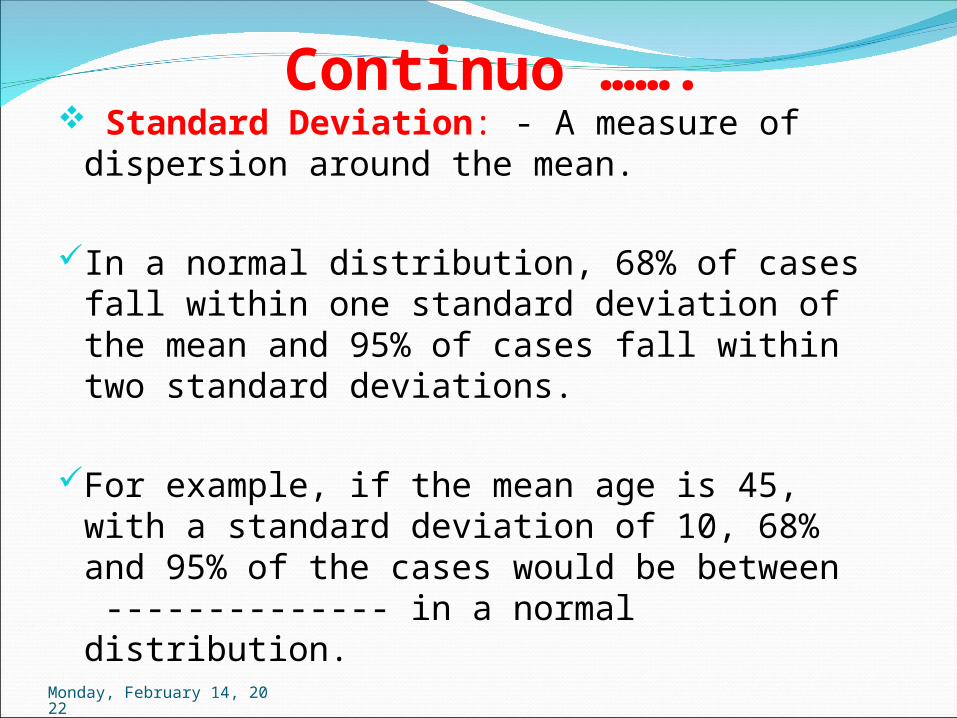
Continuo ……. Standard Deviation: - A measure of
dispersion around the mean.
In a normal distribution, 68% of cases fall within one standard deviation of the mean and 95% of cases fall within two standard deviations.
For example, if the mean age is 45, with a standard deviation of 10, 68% and 95% of the cases would be between -------------- in a normal distribution.
Monday, May 1, 2023
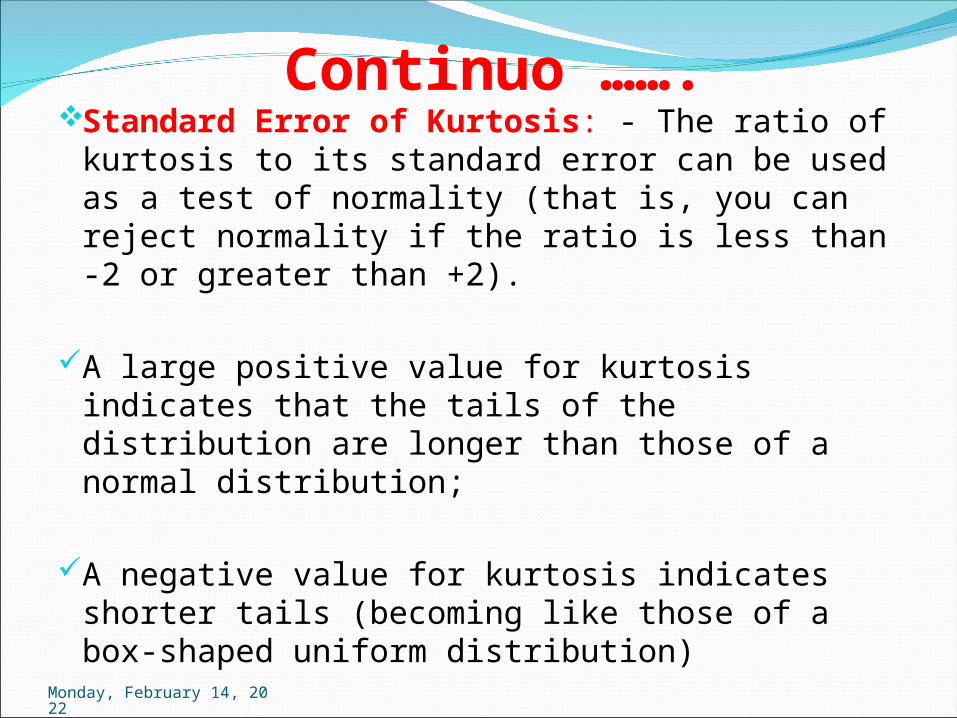
Continuo …….Standard Error of Kurtosis: - The ratio of
kurtosis to its standard error can be used as a test of normality (that is, you can reject normality if the ratio is less than -2 or greater than +2).
A large positive value for kurtosis indicates that the tails of the distribution are longer than those of a normal distribution;
A negative value for kurtosis indicates shorter tails (becoming like those of a box-shaped uniform distribution)
Monday, May 1, 2023
Continuo ……. Standard Error of Mean: - A measure of
how much the value of the mean may vary from sample to sample taken from the same distribution.
It can be used to roughly compare the observed mean to a hypothesized value (that is, you can conclude the two values are different if the ratio of the difference to the standard error is less than -2 or greater than +2).
Monday, May 1, 2023
Continuo …….Standard Error of Skewness: - The ratio
of skewness to its standard error can be used as a test of normality (that is, you can reject normality if the ratio is less than -2 or greater than +2).
A large positive value for skewness indicates a long right tail;
An extreme negative value indicates a long left tail.
Monday, May 1, 2023
Continuo ……. Sum: - The sum or total of the values,
across all cases with non missing values.
Variance: - A measure of dispersion around the mean, equal to the sum of squared deviations from the mean divided by one less than the number of cases.
The variance is measured in units that are the square of those of the variable itself.
Monday, May 1, 2023
THANK YOU FOR YOUR ATTENTATION
Monday, May 1, 2023