spotlight planning: uncertainty, challenges and...
TRANSCRIPT
SpotlightPlanning: Uncertainty,Challenges and Opportunity Summer 2016
Savills World Research UK Development & Planning
savills.co.uk/research
BUILDING teNSIONLocal politics versus national ambition
WheRe’S the PLaN?the deadline for local plans is looming
LONDON VS the SOUthhow to deal with the capital’s unmet need

02
Spotlight | Planning: Uncertainty, Challenges and Opportunity
the Government is firmly committed to increasing the number of new homes built, with ambitions to
increase homeownership and deliver one million new homes in england by 2020 (see box below). Notwithstanding these clear ambitions, there remains uncertainty about how the policies put in place to attain them will work in practice.
With this uncertainty, it looks likely that the Government’s ability to achieve its ambitions will be challenged by the political and practical realities faced by many local authorities. The challenge is most marked where the national
pro-growth agenda for housing is not shared by local politicians. It is through the planning system that this conflict between national and local objectives is played out.
The publication of the National Planning Policy Framework (NPPF) in March 2012 marked a change in approach to housing and planning. Its focus on Local and Neighbourhood Plans appeared aligned with the Government’s Localism agenda by giving local authorities and communities greater control.
Conversely, the “presumption in favour of sustainable development”, also introduced in the NPPF, has proven to be a powerful driver for
OverviewLOCaLISm VS CeNtRaLISm
the delivery of housing targets. The result being a substantial increase in planning permissions for residential development since 2012 (Figure 1). For some, including some local politicians and organisations that engage in the planning process, the complaint is that local control is being overridden.
Nevertheless, the Government has continued to reinforce a pro-growth agenda. The 2015 Productivity Plan proposed powers for Government to intervene and speed up local plan-making, while also proposing a ‘zonal’ planning system that grants automatic permission in principle to land allocated in Local and Neighbourhood Plans or identified in brownfield registers.
The 2016 Budget subsequently drew on the findings of the Local Plans Expert Group (LPEG) of March 2016 and the measures it proposes to speed up local plan delivery. Identifying the difficulties associated with assessing local housing need, the report recommends:n commissioning standard housing market area boundaries;n a single, shorter, simpler method for calculating objectively assessed housing need (OAN);
National ambitions for housebuilding and homeownership challenged by political and practical realities
meaSURING SUCCeSS POSt NPPFThe challenging targets for delivery
The Housing Minister, Brandon Lewis said in June 2015: “The previous system of top-down targets built nothing but resentment.” Notwithstanding this aversion to centrally set targets, the Government has set a few of its own in order to provide a benchmark for success, including to:
n Deliver one million homes by 2020n Deliver 400,000 affordable housing starts by 2020-21, including: 200,000 Starter Homes 135,000 Shared Ownership Homes
n Help one million more people own their home by 2020.
Meeting these national targets requires them to be embedded in ‘bottom-up’ local plans. The challenge is to get these local plans in place early enough for them to generate real change before the election. The Government’s commitment to housing delivery could therefore be tested as its term draws to a close.
Words: Neal hudson @resi_analyst
FIGURE 1
housing delivery and pipeline
Source: DCLG, HBF, Glenigan
300,000
250,000
200,000
150,000
100,000
50,000
0
An
nu
al C
han
ge in
Dw
elli
ng
s
20
01
/02
20
02
/03
20
03
/04
20
04
/05
20
05
/06
20
06
/07
20
07
/08
20
08
/09
20
09
/10
20
10
/11
20
11
/12
20
12
/13
20
13
/14
20
14
/15
n New Build Completions n New Additional Dwellings n Planning Permissions
Introduction of NPPF
savills.co.uk/research 03
Summer 2016
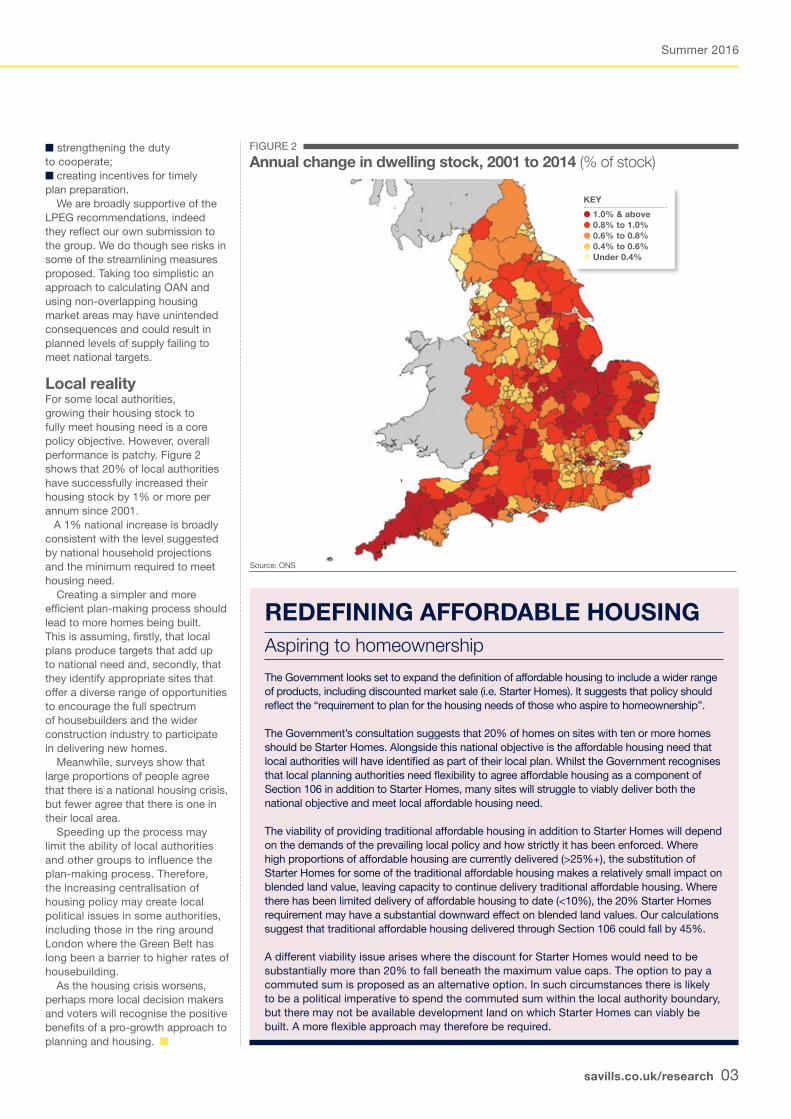
Source: ONS
FIGURE 2
annual change in dwelling stock, 2001 to 2014 (% of stock)n strengthening the duty to cooperate;n creating incentives for timely plan preparation.
We are broadly supportive of the LPEG recommendations, indeed they reflect our own submission to the group. We do though see risks in some of the streamlining measures proposed. Taking too simplistic an approach to calculating OAN and using non-overlapping housing market areas may have unintended consequences and could result in planned levels of supply failing to meet national targets.
Local reality For some local authorities, growing their housing stock to fully meet housing need is a core policy objective. However, overall performance is patchy. Figure 2 shows that 20% of local authorities have successfully increased their housing stock by 1% or more per annum since 2001. A 1% national increase is broadly consistent with the level suggested by national household projections and the minimum required to meet housing need.
Creating a simpler and more efficient plan-making process should lead to more homes being built. This is assuming, firstly, that local plans produce targets that add up to national need and, secondly, that they identify appropriate sites that offer a diverse range of opportunities to encourage the full spectrum of housebuilders and the wider construction industry to participate in delivering new homes.
Meanwhile, surveys show that large proportions of people agree that there is a national housing crisis, but fewer agree that there is one in their local area.
Speeding up the process may limit the ability of local authorities and other groups to influence the plan-making process. Therefore, the increasing centralisation of housing policy may create local political issues in some authorities, including those in the ring around London where the Green Belt has long been a barrier to higher rates of housebuilding.
As the housing crisis worsens, perhaps more local decision makers and voters will recognise the positive benefits of a pro-growth approach to planning and housing. n
ReDeFINING aFFORDaBLe hOUSINGAspiring to homeownership
The Government looks set to expand the definition of affordable housing to include a wider range of products, including discounted market sale (i.e. Starter Homes). It suggests that policy should reflect the “requirement to plan for the housing needs of those who aspire to homeownership”. The Government’s consultation suggests that 20% of homes on sites with ten or more homes should be Starter Homes. Alongside this national objective is the affordable housing need that local authorities will have identified as part of their local plan. Whilst the Government recognises that local planning authorities need flexibility to agree affordable housing as a component of Section 106 in addition to Starter Homes, many sites will struggle to viably deliver both the national objective and meet local affordable housing need. The viability of providing traditional affordable housing in addition to Starter Homes will depend on the demands of the prevailing local policy and how strictly it has been enforced. Where high proportions of affordable housing are currently delivered (>25%+), the substitution of Starter Homes for some of the traditional affordable housing makes a relatively small impact on blended land value, leaving capacity to continue delivery traditional affordable housing. Where there has been limited delivery of affordable housing to date (<10%), the 20% Starter Homes requirement may have a substantial downward effect on blended land values. Our calculations suggest that traditional affordable housing delivered through Section 106 could fall by 45%. A different viability issue arises where the discount for Starter Homes would need to be substantially more than 20% to fall beneath the maximum value caps. The option to pay a commuted sum is proposed as an alternative option. In such circumstances there is likely to be a political imperative to spend the commuted sum within the local authority boundary, but there may not be available development land on which Starter Homes can viably be built. A more flexible approach may therefore be required.
KeY
● 1.0% & above● 0.8% to 1.0%● 0.6% to 0.8%● 0.4% to 0.6%● Under 0.4%
04
Spotlight | Planning: Uncertainty, Challenges and Opportunity
Local authorities have until the end of march 2017 to produce new local plans in compliance with
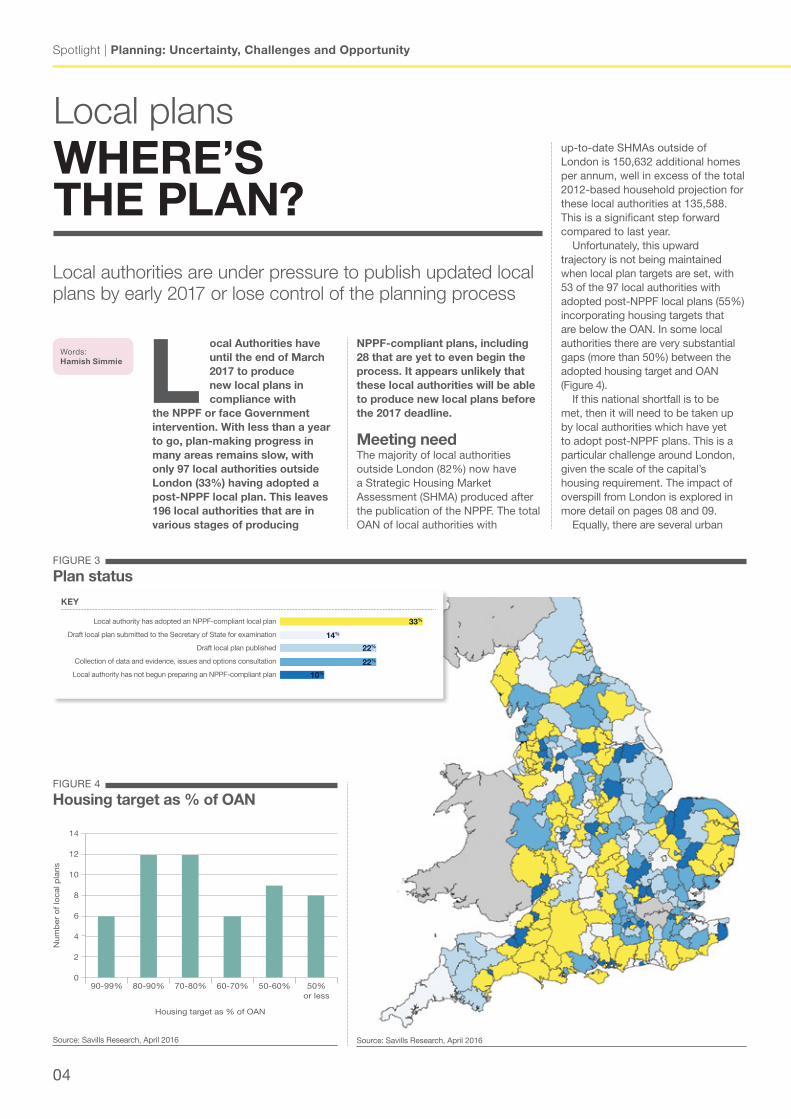
the NPPF or face Government intervention. With less than a year to go, plan-making progress in many areas remains slow, with only 97 local authorities outside London (33%) having adopted a post-NPPF local plan. this leaves 196 local authorities that are in various stages of producing
NPPF-compliant plans, including 28 that are yet to even begin the process. It appears unlikely that these local authorities will be able to produce new local plans before the 2017 deadline.
meeting needThe majority of local authorities outside London (82%) now have a Strategic Housing Market Assessment (SHMA) produced after the publication of the NPPF. The total OAN of local authorities with
Source: Savills Research, April 2016
FIGURE 3
Plan status
up-to-date SHMAs outside of London is 150,632 additional homes per annum, well in excess of the total 2012-based household projection for these local authorities at 135,588. This is a significant step forward compared to last year.
Unfortunately, this upward trajectory is not being maintained when local plan targets are set, with 53 of the 97 local authorities with adopted post-NPPF local plans (55%) incorporating housing targets that are below the OAN. In some local authorities there are very substantial gaps (more than 50%) between the adopted housing target and OAN (Figure 4).
If this national shortfall is to be met, then it will need to be taken up by local authorities which have yet to adopt post-NPPF plans. This is a particular challenge around London, given the scale of the capital’s housing requirement. The impact of overspill from London is explored in more detail on pages 08 and 09.
Equally, there are several urban
Local plansWheRe’S the PLaN? Local authorities are under pressure to publish updated local plans by early 2017 or lose control of the planning process
KeY
33%
14%
22%
22%
10%
Local authority has adopted an NPPF-compliant local plan
Draft local plan submitted to the Secretary of State for examination
Draft local plan published
Collection of data and evidence, issues and options consultation
Local authority has not begun preparing an NPPF-compliant plan
Words: hamish Simmie
FIGURE 4
housing target as % of OaN
Source: Savills Research, April 2016
Housing target as % of OAN
14
12
10
8
6
4
2
0
Num
ber
of
local p
lans
90 ‐99% 80 ‐90% 70‐80% 60 ‐70% 50-60% 50%or less

savills.co.uk/research 05
Summer 2016
districts with strong economies and growing populations that have yet to start a new local plan. These include Oxford and Bristol, which are key locations for economic growth and housing delivery. The constrained geography of these urban areas requires that housing need that cannot be met within their authority boundaries will be added to that of adjoining authorities – requiring application of the ‘duty to cooperate’. This issue is currently being grappled with by the Oxfordshire Growth Board, which is due to issue its recommended solution to Oxford’s 15,000 home overspill in September 2016.
Land supply Five-year land supply remains an issue for the majority of local authorities. This often becomes evident when Inspectors review housing levels as part of appeal proceedings. In the last year, 26% of local authorities outside London have been told by an Inspector that they
Source: Savills Research, April 2016
FIGURE 5
Five-year land supply
do not have a five-year land supply. A further 18% have themselves acknowledged that they do not have sufficient land for housing.
If local planning authorities cannot resolve this issue, it will continue to be an impediment to meeting housing requirements and the appeals process will continue to be a dominant factor in delivering new housing. Perfect stormMany local authorities without a five-year land supply are often those who have made slow progress with their local plans. Figure 6 shows the top 10 districts where plan-making progress has been slow, there is the greatest shortage of development land and affordability is most stretched. If these local authorities cannot get NPPF-compliant plans in place by early 2017 then they risk Government intervention and a consequent loss of control of housing delivery and development overall. n
FIGURE 6
Under pressure districts
Loca
l Pla
n S
tatu
s
Land
Sup
ply
aff
ord
abili
ty
elmbridge
epsom and ewell
Oxford
three Rivers
Sevenoaks
mole Valley
New Forest
Windsor and maidenhead
tunbridge Wells
tandridge
Source: Savills Research / DCLG
KeY
Failed at appeal in the year to April 2016
Published <5 years
Published >5 years, standard calculation <4.5 years
Published >5 years, standard calculation 4.5-5.5 years
Published >5 years, standard calculation >5.5 years
No published supply data
26%
18%
14%
10%
30%
2%
METHODOLOGYSavills has applied a simple five-year land supply calculation to alllocal authorities in England using the LPA published supply figures. No adjustment has been made to the supply, and the methodology does not impose any different treatment of the basic requirement other than it being annualised (spread over the relevant plan period). The map indicates categories based on the result, which allows a like-for-like comparison between authorities and echoes the arguments being used in appeals based on five-year land supply across the country. Our calculation works as follows:
1. Current five-year requirement (taking the first available data source from the following list):a. Post-NPPF local plan target (where Local Plan adopted post March 2012)b. SHMA figure (midpoint if a range) (where published after March 2012)2. Apply buffer (5% or 20% depending on authority statement) to requirement, we have assumed 20% where unclear or not stated.3. Then calculate five-year supply based on these figures (based on LPA quoted land availability – from SHLAA and/or AMR) – we are not questioning deliverability of the stated land supply in this exercise.
06
Spotlight | Planning: Uncertainty, Challenges and Opportunity
overall national need. The 2016 Budget recognises the challenges in assessing housing need and highlights the need to speed up the process.
household projectionsFollowing the closure of the National Housing and Planning Advice Unit, the task of estimating national housing need has been taken up by a range of academics, think-tanks, and private sector consultancies. The one set of official figures we do have are the household projections produced by DCLG, which are trend-based and indicate the number of additional households that would form if recent demographic trends continue. These projections are identified by the Planning Practice Guidance (PPG) as the ‘starting point’ for objectively assessing housing need.
The projections however are imperfect for a number of reasons; the main one being that because they are based on recent trends they can be influenced by factors other than population growth. For example, where migration has been suppressed by low levels of housebuilding, this will be reflected in lower future household projections.
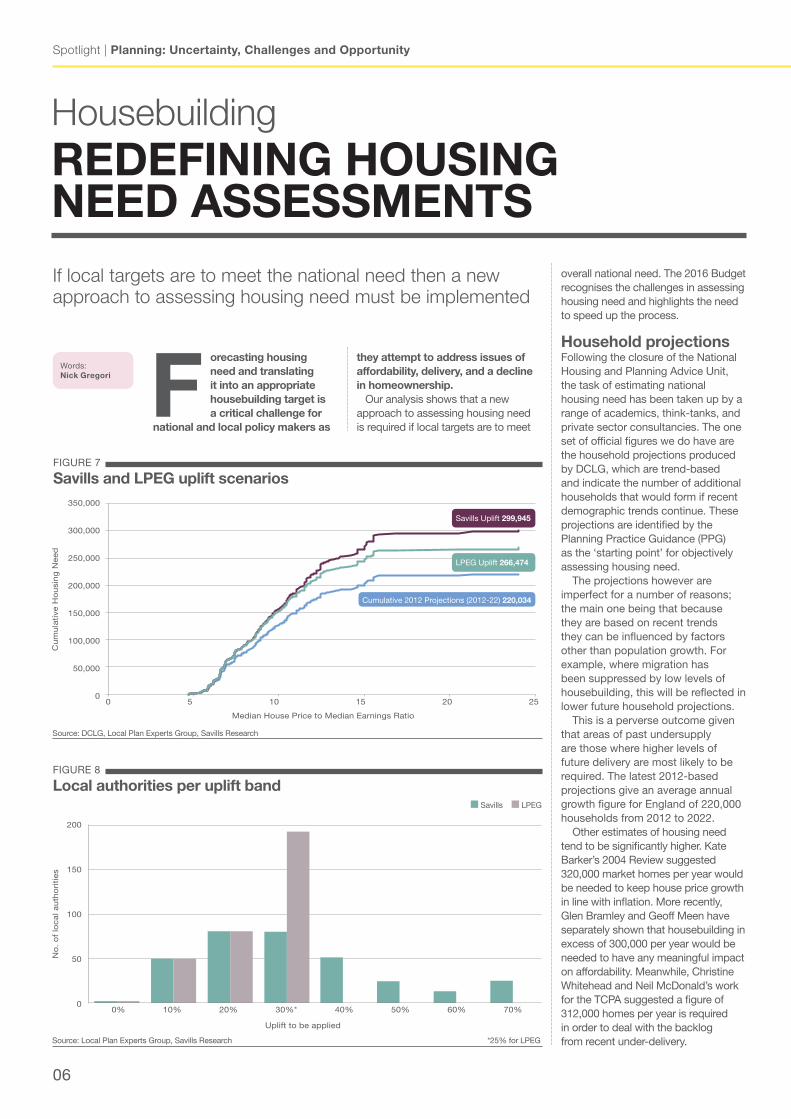
This is a perverse outcome given that areas of past undersupply are those where higher levels of future delivery are most likely to be required. The latest 2012-based projections give an average annual growth figure for England of 220,000 households from 2012 to 2022.
Other estimates of housing need tend to be significantly higher. Kate Barker’s 2004 Review suggested 320,000 market homes per year would be needed to keep house price growth in line with inflation. More recently, Glen Bramley and Geoff Meen have separately shown that housebuilding in excess of 300,000 per year would be needed to have any meaningful impact on affordability. Meanwhile, Christine Whitehead and Neil McDonald’s work for the TCPA suggested a figure of 312,000 homes per year is required in order to deal with the backlog from recent under-delivery.
HousebuildingReDeFINING hOUSINGNeeD aSSeSSmeNtS If local targets are to meet the national need then a new approach to assessing housing need must be implemented
they attempt to address issues of affordability, delivery, and a decline in homeownership. Our analysis shows that a new approach to assessing housing need is required if local targets are to meet
Forecasting housing need and translating it into an appropriate housebuilding target is a critical challenge for
national and local policy makers as
FIGURE 8
Local authorities per uplift band
Source: Local Plan Experts Group, Savills Research *25% for LPEG
FIGURE 7
Savills and LPeG uplift scenarios
Source: DCLG, Local Plan Experts Group, Savills Research
Words: Nick Gregori
350,000
300,000
250,000
200,000
150,000
100,000
50,000
0
Cu
mu
lati
ve H
ou
sin
g N
eed
0 5 10 15 20 25
Median House Price to Median Earnings Ratio
Savills Uplift 299,945
Cumulative 2012 Projections (2012-22) 220,034
LPEG Uplift 266,474
200
150
100
50
0
No
. o
f lo
cal a
uth
ori
ties
0% 10% 20% 30%* 40% 50% 60% 70%
n Savills n LPEG
Uplift to be applied
savills.co.uk/research 07
Summer 2016
FIGURE 9
market signals
If, as the evidence suggests, national need is well above the latest household projections then significant uplifts should be applied to the baseline projections. This could in part be achieved by uplifts to demographic projections that reflect market signals.
Uplift, uplift, everywhereThe LPEG recommends a banded system of uplifts based on house price to income and rental affordability ratios. We consider that the sentiment is correct – the current system is inconsistent and fails to deliver sufficient uplifts to demographic projections in the most unaffordable of housing markets. However, the LPEG approach is neither sufficiently flexible or ambitious.
Our analysis of the LPEG approach based on median house price and rental ratios indicates that the total uplift to household projections would be 22% to some 266,000 homes per annum. This is still significantly short of the number identified by the academics mentioned. This undershoot can in part be explained by the fact that the suggested uplift bands put over half of all local authorities in the highest (+25%) category. Consequently Boston in Lincolnshire and Kensington & Chelsea are in this same category. This suggests the need for additional higher bands of uplift to fully reflect the wider range of market signals that exists beyond the range considered by LPEG.
To get to, say, 300,000 homes per year requires a national uplift of 36%. We have set out a scenario where this can be achieved by increasing the 25% band to 30% and adding more bands for the least affordable markets, as shown opposite. Such a system needs to be introduced promptly if it is to have an effect on the Local Plans that are currently emerging. The risk remains that a locally-led approach, with no check to ensure local targets add up, could continue to deliver significantly fewer homes than are required. n
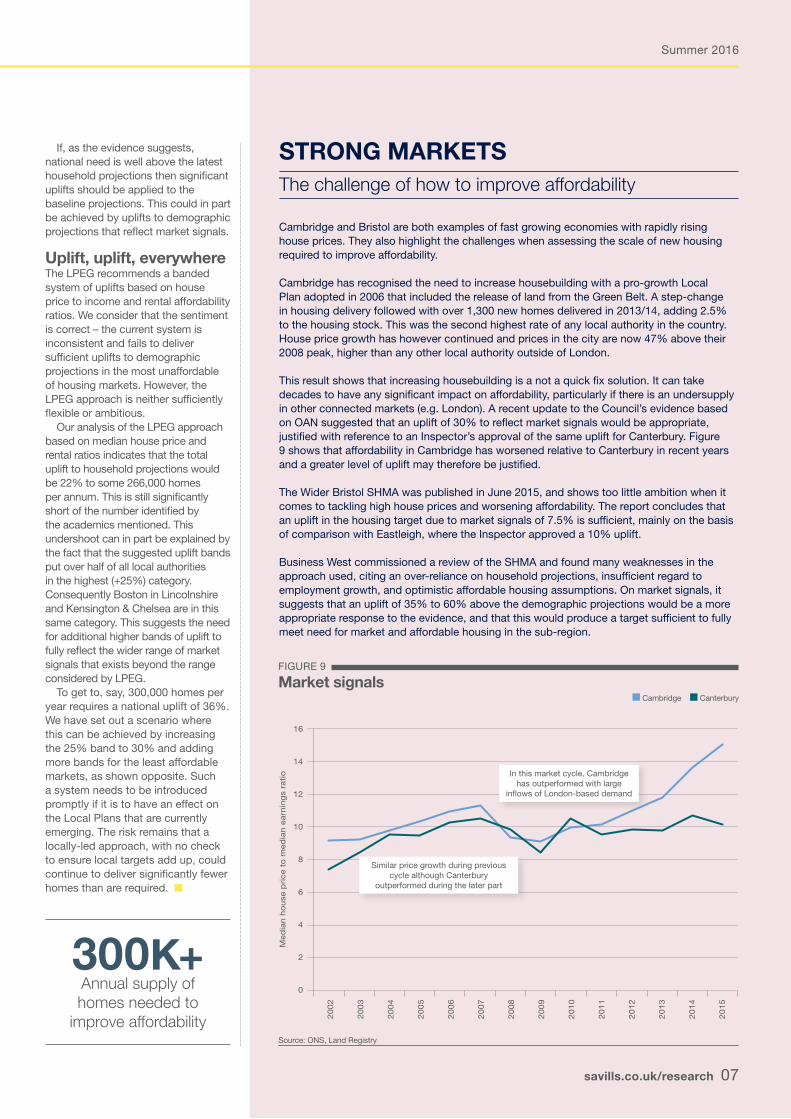
StRONG maRKetSThe challenge of how to improve affordability
Cambridge and Bristol are both examples of fast growing economies with rapidly rising house prices. They also highlight the challenges when assessing the scale of new housing required to improve affordability.
Cambridge has recognised the need to increase housebuilding with a pro-growth Local Plan adopted in 2006 that included the release of land from the Green Belt. A step-change in housing delivery followed with over 1,300 new homes delivered in 2013/14, adding 2.5% to the housing stock. This was the second highest rate of any local authority in the country. House price growth has however continued and prices in the city are now 47% above their 2008 peak, higher than any other local authority outside of London.
This result shows that increasing housebuilding is a not a quick fix solution. It can take decades to have any significant impact on affordability, particularly if there is an undersupply in other connected markets (e.g. London). A recent update to the Council’s evidence based on OAN suggested that an uplift of 30% to reflect market signals would be appropriate, justified with reference to an Inspector’s approval of the same uplift for Canterbury. Figure 9 shows that affordability in Cambridge has worsened relative to Canterbury in recent years and a greater level of uplift may therefore be justified.
The Wider Bristol SHMA was published in June 2015, and shows too little ambition when it comes to tackling high house prices and worsening affordability. The report concludes that an uplift in the housing target due to market signals of 7.5% is sufficient, mainly on the basis of comparison with Eastleigh, where the Inspector approved a 10% uplift.
Business West commissioned a review of the SHMA and found many weaknesses in the approach used, citing an over-reliance on household projections, insufficient regard to employment growth, and optimistic affordable housing assumptions. On market signals, it suggests that an uplift of 35% to 60% above the demographic projections would be a more appropriate response to the evidence, and that this would produce a target sufficient to fully meet need for market and affordable housing in the sub-region.
300K+Annual supply of homes needed to
improve affordability
n Cambridge n Canterbury
Source: ONS, Land Registry
16
14
12
10
8
6
4
2
0
Med
ian
ho
use
pri
ce t
o m
ed
ian
earn
ing
s ra
tio
20
02
20
03
20
04
20
05
20
06
20
07
20
08
20
09
20
10
20
11
20
12
20
13
20
14
20
15
In this market cycle, Cambridge has outperformed with large
inflows of London-based demand
Similar price growth during previous cycle although Canterbury
outperformed during the later part

08
Spotlight | Planning: Uncertainty, Challenges and Opportunity
a concerted region-wide response is required if we are going to get close to delivering the
new homes required across the south of england. With the march 2017 deadline for Local Plans approaching, our analysis of housing numbers shows that a much stronger pro-growth stance is required and the duty to cooperate must be meaningfully applied to ensure the numbers add up.
Growing painsLondon’s population is at a record high and continues to grow. Housing supply however is falling far short of required levels, with the London Plan housing target below that needed to meet even the lowest measures of need.
London’s adopted housing target is 42,000 per year. The London SHMA, published in 2013, concluded that housing need in London was 49,000 per annum. This figure assumes that the substantial backlog caused by past under-delivery is worked out over the whole plan period of 20 years. In this context, the stated policies of the main mayoral candidates to build at least 50,000 new homes per annum appear to be in line with requirements.
An alternative assumption put forward in the SHMA is that the backlog could be erased within ten years. This scenario gives rise to housing need of 62,000 per annum. A more usual approach, and the one most commonly used in five-year land supply assessments, is the Sedgefield method, i.e. to clear backlog in five years. This is the approach used in a recent paper from the TCPA and, using the 2012 based household projections, puts London’s housing need at 87,000 per annum until 2020. Oxford Economics’ employment-driven forecast indicates an annual housing need of 64,000 per annum over the next five years, although it makes no allowance for meeting the backlog.
In contrast to these figures indicating higher levels of requirement, our analysis of the sites coming through the development pipeline over the next five years in London suggests that 37,000 new homes per year will be delivered. This represents an annual shortfall of 5,000 homes against the target and between 12,000 and 50,000 against the various housing need assessments. This persistent shortfall in housing delivery leaves London with three options or a combination thereof:n A comprehensive review of density policies, including substantial increases in the number of homes delivered near key transport nodes. Our paper for London First, “Redefining Density”, looks at this option in more detail. Increasing
density doesn’t have to include large numbers of tall buildings and so it can still be consistent with the priorities of the leading mayoral candidates.n A strategic review of the Green Belt with the possibility of extending the designation elsewhere. A process of Green Belt ‘swapping’ could ensure a focused release of land around existing or proposed transport links.n Export the housing problem beyond the Green Belt. This is in effect what has already been happening. Unmet housing demand and even sub-market need is being shifted to surrounding housing markets. This has driven up prices and unaffordability across the south of England while increased numbers of social rented tenants have been moved out of the capital. A proactive response to this could be for central Government to commit to a new programme of Garden Village/Town/City developments. The 2016 Budget introduced financial support for Garden Villages, but it remains to be seen whether the financial commitment is sufficient to deliver enough new sites to address need as well as overcoming infrastructure capacity constraints.
All of the options require investment in strategic infrastructure and some form of ‘larger than local’ planning initiative, perhaps associated with strengthening the duty to cooperate. In 2014 we called for an ‘Arc of Co-operation’ around London, wherein local authorities would work jointly to meet London’s overspill housing requirement. To date such a joined-up approach has yet to be realised.
Bursting outFor at least the last 40 years, and probably the last 75, London has seen a net outflow of people to the wider south of England and rest of UK. Young people from across the country and the world come to London for work or study, then tend to move out to the wider south of England as they get older, have families and look for larger and more affordable housing. London’s failure to sufficiently meet its housing need results in increased pressure on housing stock outside its administrative boundaries.
This effect is compounded by the tendency of districts in the south of England to set housing targets that do not meet or exceed housing need. So far, 31 boroughs in the East and South East regions have adopted post-NPPF plans, but the housing targets in these boroughs leave a 3,500 homes shortfall
Unmet needLONDON VS the SOUth London’s inability to meet its housing targets puts pressure not only on the city itself but also the wider south of England
Words: Chris Buckle
FIGURE 10
London’s out migration
Net London migration
(% of residents)
hertsmere 2.1
epsom and ewell 2.1
epping Forest 2.0
elmbridge 1.9
Watford 1.9
Brentwood 1.9
tanbridge 1.9
Broxbourne 1.8
Dartford 1.7
three Rivers 1.6
Source: ONS

savills.co.uk/research 09
Summer 2016
against their locally assessed levels of housing need (a 70,000 home shortfall over a 20 year period). Therefore, the estimated total shortfall in housing targets compared to housing need across London, the East and South East regions is between 15,000 and 53,000 per year.
Addressing this housing shortfall will require a substantial change in approach, but there are a number of challenges and constraints to overcome. The south of England is part constrained by environmental designations including Special Protection Areas, Areas of Outstanding National Beauty and the South Downs National Park. This is compounded by the sensitive issue of widespread Green Belt designations. Transport and utilities infrastructure are also key issues.
London is clearly the epicentre of the problem, with the cost and lack of new housing regularly cited as a drag on economic performance. New development should focus on providing additional homes for those working in London as the most efficient way of meeting the shortfall. Infrastructure capacity is likely to be a barrier and hence the imperative for new investment in strategic infrastructure such as Crossrail 2, with its associated target of delivering 200,000 new homes or more.
The analysis shown on the map attempts to quantify the magnitude of the solution needed by sharing the identified shortfall amongst the well-connected districts with substantial quantities of unconstrained land. It’s clearly only one way of looking at the problem but the debate needs some meaningful numbers in order to understand the scale of the challenge.
The analysis indicates substantial increases in local housing targets are required. No local plan target has yet made such a significant contribution to this shortfall. Local plans need to stop aiming for the lowest possible housing number and recognise the longer term consequences of failing to deliver new homes in adequate numbers. n
FIGURE 11
Where to meet need
Source: Savills Research
KeY
Areas within 90 minute commute of central London
ClassificationNumber of districts with a substantial
amount of this land
Required increase in annual housing target
per district
No landscape designations; not in the Green Belt; relatively well-connected to central London by public transport, although infrastructure capacity may still be an issue
24If the shortfall is accounted for in only these districts
600 to 2,200
Only constrained by Green Belt, no landscape or environmental designations or constraints; relatively well-connected to central London
This classification and the one above
41
If the shortfall is accounted for in these districts and those in the classification above
350 to 1,300Areas within 90-minute commute of central London but constrained by landscape destinations, including Special Protection Areas, Areas of Outstanding Natural Beauty and the South Downs National Park
Post-NPPF plan adopted
Urban areas
31Boroughs in the
East and South East which have adopted
post-NPPF plans

10
Spotlight | Planning: Uncertainty, Challenges and Opportunity
the planning system has started to deliver large numbers of consents – sites for over 240,000
residential homes were permitted in the year to Q3 2015 – but there are concerns that this is not translating into increased delivery of homes.
A recent report by the Local Government Association (LGA) suggests that there are unimplemented consents for 457,945 homes in England. Our analysis tests this claim using similar data to examine sites of over 10 homes that have received full permission since 2011 and have not yet been fully completed. We have identified 5,702 sites with planning permission in the supply pipeline. These sites have the capacity for 532,000 homes, but our analysis shows that only a fraction of these could be considered ‘unimplemented permissions’.
The majority of homes (233,000) are on sites that are progressing towards construction or are on sites that have already started construction
(276,200). Only 21,500 homes are on sites that are clearly stalled such as those classified as on hold, cancelled or for sale, but this status may reflect issues outside of the landowner or developer’s control.
Of the homes that have started construction, 44% are on sites that gained full permission in 2013 or earlier (red bars). The vast majority of these (85%) are on sites of over 100 homes. These sites can take several years to build out, and their delivery rates are limited by what the local market can absorb.
Our previous analysis of delivery on greenfield urban extensions of over 250 homes has shown that it takes on average nine months from receiving detailed permission to starting on site, typically because of the number of planning conditions to discharge. This can be further delayed if there are major infrastructure or site remediation requirements. Once under construction, large sites typically deliver an average of 120 homes per annum. At these rates, it is not unreasonable for a site of over 300
homes to have not yet completed three or four years after gaining full permission.
Of the sites yet to begin construction, 1,199 sites with capacity for 108,000 homes have a construction contract in place, while a further 216 sites, with capacity for 17,600 homes, are currently in the tender process. The greatest concern is reserved for the 1,466 sites that are yet to tender. They have capacity for 107,000 homes however 67% of these sites only gained permission in the last year.
This does leave 47,000 homes on 480 sites that gained full permission over a year ago and are, at best, slowly progressing towards construction. There are many possible reasons why these sites are not yet delivering, for example developers needing to carry out site remediation or discharging complex pre-commencement conditions.
In summary, our analysis suggests that land with capacity for around 80,000-100,000 homes could be considered ‘unimplemented’. This is far below those figures suggested by other analysis, but may still be too high for a Government looking to increase housing delivery. As the Office of Fair Trading 2008 report showed, housebuilders’ approach to the land market is a consequence of the current system and they simply build homes at the rate they can sell them.
If Government is serious about increasing housing supply over the long term then it will need to look beyond the planning system and encourage greater activity from the full spectrum of potential housebuilders including SMEs, housing associations, local authorities, the wider construction industry, and Government.
Planning By appeal Our analysis shows 60% of refused residential developments (147 sites) were allowed on appeal in the year
Planning permissionsStUCK IN the PLaNNING PIPeLINe There are only 80,000 to 100,000 ‘unimplemented planning permissions’ in the pipeline, but that is still too many
Source: Savills Research using Glenigan
FIGURE 12
Status of consented homes
Words: emily Williams
300,000
250,000
200,000
150,000
100,000
50,000
0
Resi
den
tial U
nit
s
On hold/cancelled/For sale
Pre-Tender Tender/ContractAwarded
Started
Year of planning permission
2011
-13
2014
-16
n
n
n
n
n
n
n
n
Under 100 units100-200 units200-500 unitsOver 500 units

savills.co.uk/research 11
Summer 2016
OUtLOOKThe challenges ahead for housebuilding
n The Government is firmly committed to reversing the decline in home ownership by increasing new housing delivery. It has introduced national targets but success will depend on local planning and implementation. The Housing & Planning Bill is creating uncertainty but is only part of the solution, notably as amendments to the NPPF are anticipated in the summer following the March 2016 LPEG recommendations. n There is growing pressure on local authorities to get their plans in place and ensure a sufficient pipeline of land to meet their targets. In March 2016, 33% of local authorities had an up-to-date plan. That is better than 24% last year, but progress is slow. Some of the worst performing local authorities are those with the most unaffordable housing and greatest need.
n Meanwhile, a significant number of dwellings permitted (10%) have been via planning appeal. The absence of a five year supply of housing is the principal reason for appeals being granted, accounting for 54% of appeals over the last two years. Our analysis shows that only 30% of local authorities can demonstrate 5.5+ years of supply. Where there is no five-year supply, the March 2016 Court of Appeal decision (‘Richborough Estates Case’) makes it clear that all policies in a plan which restrict housing development could be considered ‘out of date’. n Urban areas with successful economies and rapidly growing populations present an additional challenge. These cannot meet housing needs within their administrative boundaries and so unmet housing need has to be taken up by surrounding authorities,
e.g. Birmingham, 38,000 dwelling shortfall. A strengthened Duty to Co-operate should help but greater progress is needed. Our call for an ‘Arc of Co-operation’ around London is louder than ever. Here and further afield, the pressures are being recognised, as the Secretary of State has now granted the first significant appeal on Green Belt land in Gloucestershire for circa 1,500 dwellings. n The planning system will inevitably come under further pressure to deliver more homes and local authorities will need to plan for higher levels of development. To be successful, both locally and nationally, they also need to identify a diverse range of development opportunities that facilitate greater activity from the full spectrum of potential housebuilders.
to March 2016. These add up to almost 27,000 homes, equivalent to over 10% of all permissions in this period. This is based on analysis of 244 planning appeals containing 50 or more homes.
We found that a lack of five-year housing land supply was the main reason for granting an appeal in 79 cases, totalling 15,000 homes.
A more general reference to the presumption in favour of sustainable development was mentioned in a majority of the remaining cases (56 out of 68).
For the 97 refused sites, containing 13,000 homes, the local authority being able to demonstrate a five-year land supply was cited as a reason to dismiss in only nine cases (1,500 homes).
The majority of sites (56%) were dismissed for “harm to the local area”, which covers environmental and amenity issues. A further 29% were dismissed for being “contrary to policy”, i.e. in conflict with local or neighbourhood plans, or specific spatial policies such as settlement boundaries or Green Gaps.
In a significant minority of cases an Inspector allowed an appeal, even though there was a valid five-year land supply. In some cases, Source: Savills Research using Glenigan
Inspectors referred to the fact that housing targets are a minimum and achieving a specified target is not itself a barrier to further land release.
Overall, these results show the importance of local authorities having a robust and credible analysis of housing need, adopting it as an appropriate local target, and
ensuring there is a sufficient and realistic five year land supply to meet the target.
Without this, we will continue to see a significant number of decisions relating to local housing supply being made through the appeal process rather than as a function of local decision-making. n
FIGURE 13
Contested residential developments
5,000
4,000
3,000
2,000
1,000
0
-1,000
-2,000
-3,000
-4,000
Un
its
allo
wed
or
dis
mis
sed
Ap
r 2
01
5
May
20
15
Jun
e 2
01
5
July
20
15
Au
g 2
01
5
Sep
20
15
Oct
20
15
No
v 2
01
5
Dec 2
01
5
Jan
20
16
Feb
20
16
Mar
20
16
n No 5YLS n Viability or technical argument n Sustainable development
n Other n Planning obligations n Harm to local market n Contrary to plan or policy n 5YLS
aLL
OW
eD
DIS
mIS
Se
D

Spotlight | Planning: Uncertainty, Challenges and Opportunity
12
Please contact us for further information
Neal hudsonResearch020 7409 [email protected]
Chris BuckleResearch020 7016 [email protected]
Nick GregoriResearch020 7409 [email protected]
emily WilliamsResearch020 7016 [email protected]
hamish SimmiePlanning Research 020 7299 [email protected]
David JacksonHead of Planning07967 555 [email protected]
Charlie CollinsStrategic Planning 07870 999 [email protected]
Savills plc is a global real estate services provider listed on the London Stock exchange. We have an international network of more than 700 offices and associates throughout the americas, the UK, continental europe, asia Pacific, africa and the middle east, offering a broad range of specialist advisory, management and transactional services to clients all over the world.
this report is for general informative purposes only. It may not be published, reproduced or quoted in part or in whole, nor may it be used as a basis for any contract, agreement or other document without prior consent. Whilst every effort has been made to ensure its accuracy, Savills accepts no liability for any direct or consequential loss arising from its use. the content is strictly copyright and reproduction of the whole or part of it in any form is prohibited without written permission from Savills Research.
Savills Team
Jonathan SteeleHead of Housing Planning07967 555 818 [email protected]
StRateGIC LaND PLaNNING CONtaCtS
Planning team
National LeadJonathan [email protected] 8071 3949N englandAdam [email protected] 220 1278
midlandsMichael [email protected] 348 436
CentralRoger [email protected] 269 057
South eastChris [email protected] 8071 3944
South WestNick [email protected] 100 364
eastDavid [email protected] 347 253
WalesTim [email protected] 368 914
ScotlandSimon [email protected] 222 4138
LondonJane [email protected] 3320 8274
mike ShawHead of National Strategic Development 07967 555 [email protected]
eCONOmICS SeRVICeSSavills are pleased to launch their planning economics team led by Rory Brooke. The team can offer economic, social and community impact assessments; development impacts and frameworks; feasibility studies and market research (in collaboration with the Research team); estate strategies and business plans; and infrastructure funding.Rory Brooke | [email protected] | 020 3320 8276
Richard ReesHead of Development Services07967 555 818 [email protected]