spotlight | autumn 2017 prime london & country · first half 2017 10604, first half 2016 5,585...
TRANSCRIPT

Savills World ResearchUK Residential
savills.com/research
Spotlight | Autumn 2017
Prime London & Country
Savills_Prime_p01_cover_v0.4.indd 2 21/09/2017 16:09

Savills_Prime_p03_foreword_v1.2.indd 2 21/09/2017 16:12

savills.co.uk/research 3
F O R E W O R D
4-5SUMMARYEight at-a-glance facts you need to know from this report about the prime market.
6-7MARKET OVERVIEWPrime properties continue to sell, but vendors must be realistic on price expectations.
8-13FORECASTS�e prime central London market faces challenges, but history says it has the ability to recover quickly.
Making sense of uncertainty
The information contained in this publication is correct at time of going to press. All rights reserved. No material may be used in whole or in part without the permission of Savills. The views expressed in this publication are not necessarily those of Savills or the publishers. While every care is taken in compiling content, Savills does not assume responsibility for effects arising from this publication.
Prime London & Country 2017
14-15PRIME TIMELINEForecasts and commentary on the changing fortunes of the central London prime market 2013-2022.
16-18£1 MILLION+Buying a £1m+ property? We look at what you’ll get for your money around the country.
19MIGRATIONMore people are leaving London, taking their housing wealth in search of more spacious homes.
20-21COMMERCIALMat Oakley discusses the impact of Brexit on London’s commercial market.
22-23RENTALAs prime London rents soften, we look at �ve micro-trends in the residential rental market.
24-26DEVELOPMENT�e prime development market is evolving with alternative uses and new buyers at the top end.
Katy Warrick Head of London Residential Research020 7016 3884 [email protected]
�ere have been some big votes of con�dence in the London market, despite Brexit
�is time last year, we published our �ve-year price forecasts for the prime housing markets
with the information available to us at the time – which, given the recent referendum, was very little. Our forecast then was for two years of no growth followed by a bounce back, before returning to the long-term trend rate at the end of the �ve-year period.
If 2016 was tough to forecast, 2017 is equally challenging. �e political landscape looks even less clear, with �eresa May holding a minority government, a US administration seemingly in chaos, and the complexity of Brexit becoming much more apparent.
In her market overview (page 6), Kirsty Bennison delves into new data from TwentyCi which shows how price sensitive the prime market has become as a result. However, the overwhelming evidence is that where sellers have realistic expectations on price the market is active.
Yolande Barnes and Lucian Cook have taken up the challenge of forecasting what happens next in prime central London (page 8), building in a further period of uncertainty post-Brexit and looking at how longer-term drivers for growth compare to those of the past.
What these two articles tell us is that prime property sentiment is fragile, but London has not ground to a halt. Prime London may not be able to maintain the stellar growth trajectory of 1979 to 2014, but it retains
its time zone, language and cultural o�erings, which underpin its status as the world’s business hub. And, as Mat Oakley, our head of commercial research, points out (page 20), there have been some big votes of con�dence in the London market, despite Brexit.
We are also including updated forecasts for the prime regions outside London, where buyers can
get at least twice the square footage for their money compared with prime central London (page 16).
�e stop-start nature of the ripple e�ect is likely to persist for a little longer, but the platform is set for a renewed �ow of wealth between London, its commuter zone and beyond.
In the meantime, the expectation of a price-sensitive market means buyers and sellers will need to continue to keep their feet on the ground.
Savills_Prime_p03_foreword_v1.2.indd 3 21/09/2017 17:20

4 savills.co.uk/research
S U M M A R Y
8This publication presents commentary on the prime property market. Here are some key facts that our research has uncovered. For more detailed perspectives, turn to the features and read our full analysis
things you need to know about prime real estate
Forecast for price growth in the prime central London residential market to end of 2022PAGE 8
� e average length of tenancy for prime residential property is 17.7 months, up from 13.1 months � ve years ago PAGE 22
In the � rst half of 2017, the volume of leasing activity in the central London o� ce market was 25% higher than the 10-year averagePAGE 20
20%
17.7months
25%
In the � rst half of 2017, the asking price was cut on 10,604 properties marketed at £1m+, compared with 5,585 in the � rst half of 2016. � is was a rise of 90%PAGE 6
90%1
Savills_Prime_p04-05_Summary_v1.2.indd 4 21/09/2017 16:12

savills.co.uk/research 5
S U M M A R Y
In Kensington and Chelsea, £1m will buy you 806 sq ft. In Elmbridge, the � gure is 1,797 sq ftPAGE 16
During the next 20 years, the number of over-65s in London
will grow by 65%, making it the fastest-growing
age groupPAGE 26
Over the next � ve years, an average of 8,500 new build homes above £1,000psf will be completed every year in LondonPAGE 24
£1m£1m
� e � ve-year increase in the number of
people in their 30s moving out of London
PAGE 19
8,50065%
27%
Savills_Prime_p04-05_Summary_v1.2.indd 5 21/09/2017 16:58

They say a week is a long time in politics. When the political backdrop is uncertain, three years can seem like an eternity in
the prime housing markets.A lot has happened in that time. Two general
elections. Changes in the leadership of all of the main political parties. A vote to leave the EU.
�is level of political uncertainty alone would be enough to make buyers cautious. But, there has also been a series of stamp duty increases and, for those buying an additional home, a further stamp duty rise.
Prices in central London are now 15.2% below their peak of three years ago. With a snap general election and a hung parliament forerunners to the
The prime market remains price sensitive, but it’s far from dormant. Realistic pricing is key
W O R D S K I R S T Y B E N N I S O N
Precision pricing
start of Brexit negotiations, prices have fallen 3.2% in the �rst nine months of this year.
Elsewhere across London, the price adjustment has been less signi�cant. �is re�ects less exposure to stamp duty and other tax changes. But, as price growth in the mainstream London markets has slowed dramatically, so prices in the prime markets along London’s wealth corridors have softened, falling 6.5% since September 2015.
In both cases, the e�ect of mortgage regulation has been felt – a factor that is less relevant to prime central London. �e hint of interest rate rises has not helped sentiment, even though those rates are coming o� unprecedented lows.
Pricing change Prime markets beyond London have been more resilient
Source Savills Research
The Boltons, Chelsea
6 savills.co.uk/research
M A R K E T O V E R V I E W
-3.2% -15.0%
9 months to September 2017 3 years to September 2017
-2.1% -4.7%
Central London
Other London
Suburban
Inner commute
Outer commute
Wider South of England & Wales
Midlands/North
Scotland
-0.5% -0.4%
0.0% 3.1%
0.0% 6.2%
2.2% 8.2%
1.8% 3.8%
1.3% 2.0%
Savills_Prime_p06-7_Market overview_v1.6.indd 6 21/09/2017 16:13

Source Savills Research using TwentyCi
London
-13%
£1m+ Market Activity Tracker 1st half 2017 vs 1st half 2016
London
-2%
London
-20%
Source Savills Research using TwentyCi
Cuts in asking price over £1m (UK)
+90% Increase in the number of £1m+ properties where the asking price has been cut
FIRST HALF 2017
10,604
FIRST HALF 2016
5,585
122 Price reductions for every 100 London properties sold for more than £1m in the year to the end of June 2017
76 Price reductions for every 100 properties sold for more than £1m across the rest of the UK in the year to the end of June 2017
With much lower levels of price growth in the run up to the past three years, prime markets beyond London have been more resilient. Still, in the past year, they have struggled to deliver any meaningful price growth, whether in the commuter belt, the increasingly fashionable uber-towns, the second-home hotspots or the rural idylls.
Across all, the market has become much more needs-based. �is is re�ected in less stock being brought to the market. Still though, some sellers are happy to chance their arm and see if they can turn back the clock to 2014. Few have succeeded.
So, optimistic asking prices are being cut with increasing regularity. In these cases, properties are continuing to sell, as shown in our £1 million+ activity tracker which is based on marketwide information from TwentyCi. �is suggests the prime market remains price sensitive, but far from dormant. Much like the curate’s egg, it can be deceivingly good in parts, but this should not detract from sellers having realistic price expectations.
Over the next three years, as the political and economic implications of Brexit become clearer, there will be more change. �e prime markets will probably take their lead from the central London market. Here, depending on the underlying conditions, sentiment can spin on a sixpence.
For now, and through 2018, a pick-up in sentiment seems unlikely. Much, then, depends on the economic outlook. But after the period of adjustment and sobriety already seen across the prime markets, we are forecasting a return to growth.
FOR
SALE SALE
AGREEDSOLD
M A R K E T O V E R V I E W
Rest of UK
2%11%-8%
Rest of UK Rest of UK
Number of properties brought to the market
Number of sales that have been
agreed
Number of agreed sales
that have exchanged
savills.co.uk/research 7
Savills_Prime_p06-7_Market overview_v1.7.indd 7 22/09/2017 11:42

Abingdon Villas, Kensington
8 savills.co.uk/research
F O R E C A S T S
Savills_Prime_p8-15_forecast_v2.3.indd 8 21/09/2017 16:17

Since 1979, the performance of central London’s prime residential real estate has been underpinned by three influential phases. Now, against a backdrop of political and economic uncertainty, we assess its prospects as the market enters a fourth phase
savills.co.uk/research 9
F O R E C A S T S
W O R D S Y O L A N D E B A R N E S & L U C I A N C O O K
The fourth phase
Savills_Prime_p8-15_forecast_v2.3.indd 9 21/09/2017 16:17

Between 1979 and 2014 the prime central London market delivered average annual house price growth of 5.7% above the rate
of in� ation – despite going through large peaks and troughs. During that time, three distinct phases underpinned performance.
As we go forward, the prospects of a recovery are linked to whether we are entering a fourth phase – one where higher taxation and changing relative returns from other assets result in di� erent drivers of price growth.
To bring this into context, we need to understand what happened before.
Phase 1Domestic (pre-1984)Prior to 1984, London was depopulating and underperforming the rest of the south-east of England economically. London was a national capital, a centre of parliament, arts and culture, but not yet a globalised � nancial centre.
At this time, the prime real estate market was dominated by domestic buyers. Compared with the country, urban living was relatively unfashionable,
typically linked to work or a need to be in London. Lea� er, outlying prime districts, like Hampstead or Richmond were often preferred to more central areas, such as Mayfair.
During this period, price movements in prime London were closely linked to the domestic economy, so were more similar to the mainstream UK property market than they have been subsequently.
Phase 2 Promotion (1984-2007)� e promotion phase was characterised by an extraordinary period of globalisation and the emergence of London, alongside New York, as a premier world � nancial centre and a focus of global attention.
London’s ascendency from the � rst division into the premier league was kicked o� by Margaret � atcher in 1983, when plans to end restrictive practices in London’s stock exchange were announced. � e subsequent deregulation of the � nancial sector in 1986 enabled a massive expansion. Over the years, this, in turn, boosted many other areas of the London economy.
800
700
600
500
400
300
200
100
0
Jun
79
Jun
80
Jun
81
Jun
82
Jun
83
Jun
84
Jun
85
Jun
86
Jun
87
Jun
88
Jun
89
Jun
90
Jun
91
Jun
92
Jun
93
Jun
94
Jun
95
Jun
96
Jun
97
Jun
98
Jun
99
Jun
00
Jun
01
Jun
02
Jun
03
Jun
04
Jun
05
Jun
06
Jun
07
Jun
08
Jun
09
Jun
10
Jun
11
Jun
12
Jun
13
Jun
14
Jun
15
Jun
16
Jun
17
Jun
18
Jun
19
Jun
20
Jun
21
Jun
22
Prices 40% above trend line in Q1 1988. Prices peak in the 1st quarter of 1989 following house price growth of 297% in the preceding 10 years
Prices fall to 34% below their trend line by end of 1992, having fallen by 26% in nominal terms
PromotionDomestic
Demand is primarily driven by domestic wealth
Big Bang and Lawson boom is followed by Black Monday
UK recession is followed by White Wednesday
Russian Debt Crisis temporarily interrupts period of price growth
Inde
x, 1
00=
June
197
9
10 savills.co.uk/research
F O R E C A S T S
Tracking change Prime central London prices compared with trend line growth (5.7% per annum above the rate of infl ation)
Source Savills Research
Key Real house price ForecastTrend line (June 1979-Sept 2014)
Savills_Prime_p8-15_forecast_v2.3.indd 10 21/09/2017 16:17
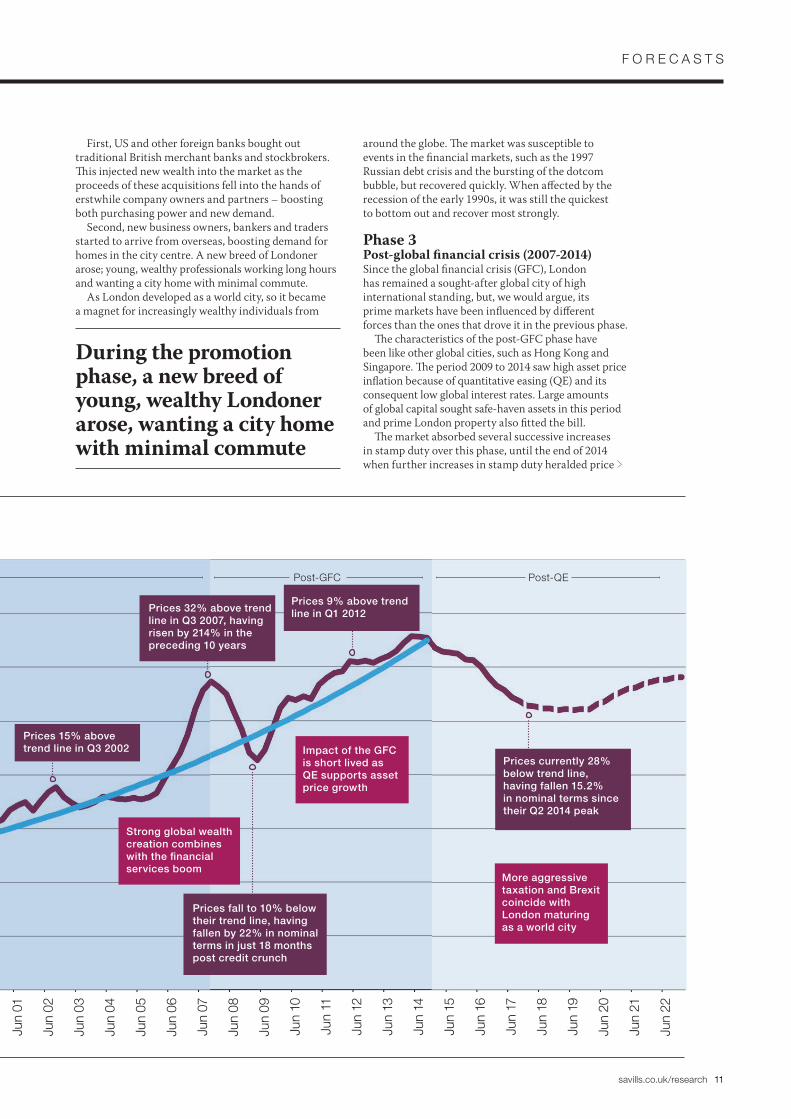
First, US and other foreign banks bought out traditional British merchant banks and stockbrokers. � is injected new wealth into the market as the proceeds of these acquisitions fell into the hands of erstwhile company owners and partners – boosting both purchasing power and new demand.
Second, new business owners, bankers and traders started to arrive from overseas, boosting demand for homes in the city centre. A new breed of Londoner arose; young, wealthy professionals working long hours and wanting a city home with minimal commute.
As London developed as a world city, so it became a magnet for increasingly wealthy individuals from
around the globe. � e market was susceptible to events in the � nancial markets, such as the 1997 Russian debt crisis and the bursting of the dotcom bubble, but recovered quickly. When a� ected by the recession of the early 1990s, it was still the quickest to bottom out and recover most strongly.
Phase 3 Post-global � nancial crisis (2007-2014)Since the global � nancial crisis (GFC), London has remained a sought-after global city of high international standing, but, we would argue, its prime markets have been in� uenced by di� erent forces than the ones that drove it in the previous phase.
� e characteristics of the post-GFC phase have been like other global cities, such as Hong Kong and Singapore. � e period 2009 to 2014 saw high asset price in� ation because of quantitative easing (QE) and its consequent low global interest rates. Large amounts of global capital sought safe-haven assets in this period and prime London property also � tted the bill.
� e market absorbed several successive increases in stamp duty over this phase, until the end of 2014 when further increases in stamp duty heralded price
Jun
79
Jun
80
Jun
81
Jun
82
Jun
83
Jun
84
Jun
85
Jun
86
Jun
87
Jun
88
Jun
89
Jun
90
Jun
91
Jun
92
Jun
93
Jun
94
Jun
95
Jun
96
Jun
97
Jun
98
Jun
99
Jun
00
Jun
01
Jun
02
Jun
03
Jun
04
Jun
05
Jun
06
Jun
07
Jun
08
Jun
09
Jun
10
Jun
11
Jun
12
Jun
13
Jun
14
Jun
15
Jun
16
Jun
17
Jun
18
Jun
19
Jun
20
Jun
21
Jun
22
Prices 15% above trend line in Q3 2002
Prices 32% above trend line in Q3 2007, having risen by 214% in the preceding 10 years
Prices fall to 10% below their trend line, having fallen by 22% in nominal terms in just 18 months post credit crunch
Prices 9% above trend line in Q1 2012
Prices currently 28% below trend line, having fallen 15.2% in nominal terms since their Q2 2014 peak
Post-QEPost-GFCPromotion
Strong global wealth creation combines with the fi nancial services boom
Impact of the GFC is short lived as QE supports asset price growth
More aggressive taxation and Brexit coincide with London maturing as a world city
savills.co.uk/research 11
F O R E C A S T S
Tracking change Prime central London prices compared with trend line growth (5.7% per annum above the rate of infl ation)
During the promotion phase, a new breed of young, wealthy Londoner arose, wanting a city home with minimal commute
Savills_Prime_p8-15_forecast_v2.3.indd 11 21/09/2017 16:17

falls, as the market adjusted to a new tax environment as well as the tapering of QE and increased expectation of rising global interest rates.
Phase 4Post-quantitative easing (2014 onward)While being some way above their 2007 levels, prices in the prime central London market are now 15.2% below their 2014 peak. �is is not just because of stamp duty. For a £5 million property bought as an investment or second home, the fall in value is more than four times the extra stamp duty now payable.
Other tax factors are also at play. �ese include more exposure to capital gains tax and inheritance tax for overseas owners. �is higher tax environment makes this part of the market far more sensitive to changes in underlying sentiment.
As we stand, that sentiment has been knocked by the political uncertainty fuelled by Brexit. It has not been helped by the uncertainty surrounding city employment when cities, such as Paris, appear to be ready to roll out the red carpet to the banking industry.
At the same time, QE has been halted and global interest rates have stopped falling, with increased expectations of rate rises and more focus on yields.
�is all suggests a permanent departure from the historic trend line. It is di�cult to see what could support the huge surge in prices that would be needed to make up for lost ground on an ever-upward arching curve of prime London house prices.
�e rocket-fuelled promotion phase is over. London’s rise to an elite group of world cities is complete and it has secured its place in this company. It cannot see another promotion, but it can maintain its global status.
Irrespective of the decision to leave the EU, London will retain the features that make it unique in this group – the quality and accessibility of its real estate underpinned by constants such as language, culture, education and legal structure. Whatever the challenge from other cities, it will almost certainly remain a key global �nancial centre and can develop as one of several major European hubs for the growing tech sector.
�is means London’s prime housing stock will continue to bene�t from new sources of domestic wealth generation, as well as attracting wealthy overseas buyers. Returns in future will re�ect this low-risk world status.
So, when prime London real estate once again represents identi�ably good value and the fog of uncertainty clears, we expect a return to growth.
Lancaster Gardens, Bayswater
12 savills.co.uk/research
F O R E C A S T S
Whatever the challenge from other cities, London will almost certainly remain a key global �nancial centre
Savills_Prime_p8-15_forecast_v2.3.indd 12 21/09/2017 16:17

Prime
Central London
Suburban
Inner commute
Outer commute
Wider South of England & Wales
Midlands/North
Scotland
Other London
2018 2019 2020 2021 20225-year
compound growth
0.0% 2.0% 8.0% 5.5% 3.5%
-2.0% 0.0% 5.0% 4.5% 2.5%
0.0% 0.0% 4.5% 4.5% 3.0%
0.0% 2.0% 4.0% 4.0% 4.0%
0.0% 1.0% 5.0% 4.5% 4.0%
1.0% 1.5% 3.5% 3.5% 4.0%
1.5% 1.0% 3.0% 3.0% 3.5%
1.5% 1.5% 3.0% 3.5% 3.5%
20.3%
10.2%
12.5%
14.7%
15.3%
14.2%
12.6%
13.7%
� e factors that drive the central London market are not as relevant to other prime markets.
� e other prime London housing markets have a far more domestic buyer pro� le. So, while they can be a� ected by the migration of housing equity from central London, they are less a� ected by the concerns of international buyers. By contrast, they are more in� uenced by the state of high-value employment markets, such as � nance, banking and the growing tech industry.
Similarly, factors such as the availability and cost of mortgage � nance play their part – though not to the same extent as in the mainstream markets.
� e � ow of wealth out of London plays a signi� cant role in our forecasts for the prime housing markets of the commuter zone. Here, the price gap that is re� ected by the di� erence in what you can buy for £1 million is an important factor, especially as the market becomes more � uid (see page 16).
Further from London, much depends on more general economic drivers and the extent to which they support a wider ripple e� ect.
Oxshott Way, Cobham, Surrey
savills.co.uk/research 13
F O R E C A S T S
Source Savills Research Note These forecasts apply to average prices in the secondhand market. New-build values may not move at the same rate
Five-year forecast The future performance of prime London will refl ect the capital’s low-risk world status. Elsewhere, much depends on economic drivers and the extent to which they support a wider ripple effect
Prime outer London and the country
Savills_Prime_p8-15_forecast_v2.3.indd 13 21/09/2017 16:17

14 savills.co.uk/research
F O R E C A S T S
• A Conservative minority government remains throughout the period to 2022 • �e London economy grows by 11% over the period of the forecast (2018-2022)* • Job losses in the �nancial and insurance sectors are contained to no more than 20,000 (a similar scale to those seen in the early 1990s and post credit crunch). Employment in these sectors is retained at circa 350,000 over the remainder of the forecast period • Bank base rates increase to 1.81% by the end of the forecast period* • Transitional agreements are put in place to minimise business disruption as the UK leaves the EU • Brexit ultimately results in a free-trade agreement with the remaining EU members • �ere are no further changes to stamp duty • �e 2022 general election is close run, assuming the main political parties maintain the same broad policy agendas currently adopted. *According to Oxford Economics
Prime central London timeline and forecast 2013-2022
Actual 2013
(+6.1% inflation adjusted) Price growth continued despite successive increases in stamp duty that were introduced in 2011 and 2012.
+8.3%
Actual 2014
(-1.3% inflation adjusted) Price adjustments in the final quarter, that were triggered by stamp duty reform in the Autumn Statement, resulted in annual price falls.
Actual 2015
(-3.4% inflation adjusted) Prices continued to adjust to a higher tax environment that included greater exposure to capital taxes for non-doms and overseas buyers.
Actual 2016
(-8.0% inflation adjusted) The introduction of the 3% stamp duty surcharge for purchases of ‘additional’ homes was compounded by buyer caution, following the vote to leave the EU.
Forecast 2017
(-6.7% inflation adjusted) Uncertainty regarding Brexit feeds into domestic political uncertainty, with the snap general election resulting in a hung parliament.
-0.4%
-6.8% -3.3%
-4.0% -6.8%
To arrive at our forecasts we have made the following assumptions
Five years to end 2017
(-13.1% inflation adjusted) The performance during this period reflects the changed tax environment, as well as increasing political and economic uncertainty.
Savills_Prime_p8-15_forecast_v2.3.indd 14 21/09/2017 16:17

savills.co.uk/research 15
F O R E C A S T S
Forecast 2018
(-1.5% inflation adjusted)Continued uncertainty regarding the economic impact of the Brexit result prevents any recovery in values.
Forecast 2019
(+0.2% inflation adjusted) Growth is delayed to reflect ongoing uncertainty during transitional arrangements post-Brexit.
Forecast 2020
(+6.0% inflation adjusted) Overseas and domestic buyers re-enter the market on the basis that property looks good value in both sterling and foreign currencies with greater post-Brexit certainty.
Forecast 2021
(+3.6% inflation adjusted) Growth is lower than the previous long-term trend to reflect the higher tax environment, weaker demand drivers and increased returns from other investment assets.
Forecast 2022
(+1.6% inflation adjusted) Political uncertainty is expected to curtail price growth on the basis of a close-run general election.
Five years to end 2022
(+10.2% inflation adjusted) Our five-year forecasts for a delayed recovery are based on a number of key assumptions regarding the political and economic backdrop and are detailed left.
10 years to end 2022
(-4.3% inflation adjusted) The overall effect is that values will have grown by 12% over a 10-year period, with a more modest recovery than in previous cycles.
0.0% +2.0%
+5.5% +8.0%
+3.5% +20.3%
+12.1%
Savills_Prime_p8-15_forecast_v2.3.indd 15 21/09/2017 16:18

16 savills.co.uk/research
£ 1 M I L L I O N +
How many £1 million-plus properties are there in Great Britain?We estimate that in 2016 there were 394,000 properties worth £1 million or more across the country. Despite falling back by 3.4% in 2016, we believe this number has more than doubled over the past 10 years, driven mostly by the strong house price growth seen in and around London.
Owning a property worth £1 million or more was once the reserve of an elite group. But, with rising prices over the past 10 years, many more homeowners across the country have joined the club
�e million pound questionsW O R D S F R A N C E S C L A C Y
How many of those properties are in London and the South East? �e capital accounts for almost two-thirds (250,000) of £1 million-plus homes, with a further 21% (81,400) located in the South East. �e highest concentration of these are in central London boroughs: for example, almost half of all privately-owned housing stock in Kensington and Chelsea exceeds the £1 million mark.
Jessica Road, Wandsworth
Savills_Prime_p16-18_£1m_v1.0.indd 16 27/09/2017 10:57

savills.co.uk/research 17
£ 1 M I L L I O N +
18% Proportion of £1 million+ homes that are located in Westminster, and Kensington and Chelsea
95% Proportion of all £1 million+ properties which are located in the South of England
£883bn Combined value of £1 million+ properties in GB
250,000 Number of £1 million+ properties in London (equivalent to 63% of the GB total)
2006
176,000 2016
394,000 Total number of £1 million+ properties across GB
Spatial awareness The size of property (in sq ft) that £1 million will buy across the country
Source Savills Research Source Savills Research
£1 million+ properties in numbers
Kensington and Chelsea
Average sq ft
Windsor and M
aidenhead
Brighton & Hove
Cotswolds
Stratford-upon-Avon
806
3,500
3,00
0
2,500
2,00
0
1,500
1,00
0
5000
1,214
2,312
2,321
2,442
2,482
2,490
2,551
2,645
2,709
2,786
2,919
2,926
2,975
3,050
3,071
3,075
3,532
1,451
1,733
1,740
1,797
1,898
1,952
2,054
2,079
2,151
2,187
2,291
2,131
Wandsworth
EalingOxfordSt AlbansElmbridgeCambridgeGuildford
SevenoaksBrom
leySouth BucksW
inchester
PooleSouth Ham
s
Bath & NE SomersetM
id SussexChelmsford
BristolCornwall
Test ValleyCheshire East
SolihullHarrogateSuffolk CoastalRushcliffe
Leeds
Savills_Prime_p16-18_£1m_v1.0.indd 17 27/09/2017 14:17

18 savills.co.uk/research
£ 1 M I L L I O N +
People migrating from central London to Oxford or Cambridge will get twice as much for their money
What £1 million will buy you across London (sq ft) In Kensington and Chelsea, expect a bijou 806 sq ft
How does this compare to other areas? Despite hotspots in Cheshire and Yorkshire’s golden triangle, there are just 7,900 £1 million+ homes across the north of England, re�ecting the huge disparity in property values across the country.
Where in London can I get the most for my £1 million?�e smallest £1 million homes are found in Kensington and Chelsea, where this seven-�gure price tag will buy you just 806 sq ft on average. South of the �ames, your money will stretch to just over 1,200 sq ft in Wandsworth and around 1,300 sq ft in Richmond. For London’s biggest £1 million homes, buyers will need to look east to Havering, where the average is almost 2,500 sq ft.
As discussed in our ‘Migration’ piece on page 19, those who have accumulated considerable housing wealth in the capital during the past decade will be looking to see where else in the country they can get more for their money.
Where are those buyers moving to? Beyond the capital, £1 million will stretch much further. It shows why those looking to upsize without
signi�cantly increasing their budget, particularly now they also face higher stamp duty rates, are likely to move further out.
�ose migrating from central London boroughs to Oxford or Cambridge, the most popular choices, will get twice as much home for their money. Similarly, in the established commuter hotspots of Elmbridge and St Albans, highly favoured by London migrants, buyers can expect to get a property of 1,800 sq ft and 1,740 sq ft respectively.
For those willing to look further a�eld, Bristol and Bath both o�er around 2,500 sq ft for the £1 million price tag, while in Harrogate, Rushcli�e and Stratford-upon-Avon, you can get around 3,000 sq ft.
Insufficient data 800-1,199 sq ft 1,200-1,599 sq ft 1,600-1,999 sq ft 2,000-2,399 sq ft More than 2,400 sq ft
Key
Source Savills Research
Savills_Prime_p16-18_£1m_v1.0.indd 18 27/09/2017 14:17

M I G R A T I O N
savills.co.uk/research 19
W O R D S L U C I A N C O O K
The number of people moving out of London continues to rise, taking the capital’s housing wealth to more affordable and spacious locations
More country, more space
According to migration data released by the O� ce for National Statistics (ONS), the number
of people moving out of the capital is on the increase. For people in their 30s, for example, the migration � gure has risen by 27% in the � ve years to the end of June 2016.
By leaving London, movers are taking advantage of a signi� cant house price gap. Our analysis shows that, across the housing market, the average house price in the areas they are moving from is as high as £580,000, while the average value in the areas they move to is £333,000.
Unsurprisingly, the biggest recipients of migration � ow from London among the over-25s are those areas closest to the capital. � e most popular destinations are the ones that o� er more a� ordable locations. However, Elmbridge, Surrey, where the average sale price of all properties in the year to the end of April 2017 was £750,000, comes in sixth on the list. Elmbridge is also the most popular location for people moving out of Hammersmith and Fulham.
People living in Islington and Camden are most likely to move to St Albans, whereas homeowners in Richmond and Wandsworth look to Spelthorne, and Epsom and Ewell respectively.
People moving out of the central London boroughs of Westminster and Kensington and Chelsea, tend to move further a� eld, with Cambridge and Oxford the two most popular locations.
Other higher-value locations that have bucked the trend in terms of the demand they attract from London relative to their
distance from the capital, include Brighton and Hove, the Bournemouth-Poole conurbation, and neighbours Bristol and Bath – which have become as much of a magnet as the Cotswolds.
In each case, the level of demand from London has contributed to the relatively strong house price growth in prime urban markets. But, as we report in
our analysis of what can be bought for £1 million (see page 16), these locations continue to be attractive to those leaving the capital in search of more space.
� e movement out of London is likely to continue to underpin demand in these locations, even though the slowing down of the London market may temper that demand in the short term.
Savills_Prime_p19_Migration_v1.0.indd 19 21/09/2017 16:20

20 savills.co.uk/research
C O M M E R C I A L
Is the outlook for London’s office-based businesses as negative as many predict?Following the referendum, commentators were suggesting that the loss of �nancial services passports could lead to hundreds of thousands of jobs being put at risk in the city. However, 2017 has seen a degree of calm emerging in the London o�ce market. Major employers are thinking that the exit from the EU may not be as cataclysmic as �rst imagined. More importantly, it’s going to take a lot longer than was expected in July 2016.
But won’t many jobs have to move because of EU banking licences?Finance organisations need an EU banking licence, but there are few businesses among the global players that do not already have one. �e European Central Bank will not accept this licence to just be ‘brass-plated’ in terms of sitting in an empty representative o�ce somewhere in the EU. So, some jobs will be moved from London or new ones created within the EU. One or two regulatory organisations will also leave London for operational reasons. However, the main reason we do not expect to see large numbers of jobs relocating is the simple matter of cost.
Even though some EU countries are making encouraging offers to attract business?Eurostat’s own data shows that average employers’ costs in Germany are 25% higher than in the UK.
In France, they are 37% higher. Given that the global �nance industry has been in a sustained period of cost control since the global �nancial crisis (GFC), it is a challenge to imagine that large-scale job moves from London to the EU are credible, unless operating costs in London rise dramatically in a post-Brexit world.
But the impact of Brexit on London’s jobs will not be confined just to the finance sector, will it? No, but this is where the biggest regulatory push is likely to occur.
So, what are the concerns for other key industries for London jobs?Any mishandling of the freedom to hire skilled and unskilled workers could impact rapidly growing industries, such as the technology and media sectors. Indeed, these sectors are more important to London’s employment structure than �nance. Even in the City of London and Tower Hamlets, �nance and insurance are no longer the largest employer of o�ce workers. Information and communication, and professional and tech sectors now employ more people in what used to be relative monocultures.
Is there anything we can learn from previous events, such as the GFC?What may surprise people is just how resilient London’s employment levels have been, with none of the last
Mat Oakley discusses the impact of Brexit on London’s commercial market and assesses the resilience of the city’s diverse employment sectors in the face of an uncertain future
“It is a challenge to imagine that large-scale job moves from London to the EU are credible”
Savills_Prime_p20-21_Q&A_v0.4.indd 20 21/09/2017 16:22

savills.co.uk/research 21
three economic shocks leading to a fall in o�ce-based employment of more than 70,000 jobs. �is resilience shapes our scenarios for the London o�ce market in the run-up to and aftermath of Brexit. �ese scenarios have more to do with how long the process takes than whether the exit is hard or soft.
In that case, when do you expect businesses to decide whether they will move or not?We see the point of peak uncertainty being a year or so after we exit. Businesses will then have the data to assess whether their operating costs in London have gone up su�ciently to consider downsizing in London or moving to the EU.
Is there evidence in the property market that reflects this longer view?�e volume of leasing activity in the City and West End of London is up 19% and 33% respectively year on year. Across central London, the �rst six months of 2017 has seen a rise in the proportion of leases being signed of 15 years or more compared with either 2015 or 2016 – another sign that an immediate exodus is unlikely.
So, you expect businesses to play more of a waiting game than react in the short term?Without doubt, Brexit will result in some structural change for all business types in London. However, we believe that the downside risks are being overplayed
dramatically. Generally, we do not expect to see any major corporate decisions being taken until the early 2020s. When those decisions are made, even in our worst-case scenario, the downside for London’s employment numbers are not as bad as the correction that was seen during the GFC, and it will be spread over a longer period. Whether it’s demand for housing or o�ce space in London, the impact will be comparatively small.
Mat Oakley is Head of Savills European Commercial Research. He is an expert in office, retail and leisure real estate, and advises investors and developers across these markets. He is also on the board of the British Council for Offices.
In the �rst half of 2017, the volume of leasing activity in the central London o�ce market was 25% higher than the 10-year average
Savills_Prime_p20-21_Q&A_v0.4.indd 21 21/09/2017 16:22

22 savills.co.uk/research
R E N T A L S
W O R D S K I R S T Y B E N N I S O N
Prime London rents have continued to fall slowly during the past year in the face of increased uncertainty, recording an eighth consecutive quarter of marginal falls. Rents were softening ahead of the EU referendum, but the Brexit vote has altered the shape of the market. Here we look at five micro-trends in the residential rental market that the broad averages conceal
Renting, rather than buying, is becoming an increasingly popular choice, whether for convenience or financial reasons. As a result, longer tenancy lengths are more common thanks to the stability they provide. Our data highlights this growth across prime London, where the average length of tenancy increased from 13.1 months in 2012 to 17.7 months in 2017.
One particular group behind this increase is tenants at the top end of the market who are showing renewed commitment to renting. In particular, there has been a growth in the number of 35 to 45-year-old long-term renters looking to upsize.
For those looking to rent for a longer period than maybe originally planned, the quality of the space they rent is of great importance and they are willing to pay a premium for these properties.
During the past 12 months, there has been a rise in super prime rental properties (£4k+ per week) being brought to market, mainly from developers providing new luxury homes and individuals who have chosen to let their properties while waiting to see how the sales market moves during the next few years.
The supply of available properties has coincided with a rising number of high-net-worth individuals now choosing to rent, rather than buy, a London home. Only needing a London base for a few years and deterred from buying given the 2014 stamp duty changes, the cost of short-term renting can make more financial sense than the purchasing costs.
In recent years, we have also seen a rise in the number of global entrepreneurs who are living more transient lifestyles, moving from country to country, year by year. These wealthy tenants prefer prime central London locations, and properties with the type of decor and amenities that enable them to move straight in.
�e lifestyle upsizer commits to renting
Changing demands of super prime
Average length of tenancy 2012 – 13.1 months2017 – 17.7 months
Lifestyle upsize commits to renting
Best in class beats location
Corporate budgets rising Try before you buy
FOR SALE
Super prime market is on the move
FOR SALE
Lifestyle upsize commits to renting
Best in class beats location
Corporate budgets rising Try before you buy
FOR SALE
Super prime market is on the move
FOR SALEIt’s all
in the detail
Savills_Prime_p22-23_rentals_v0.4.indd 22 21/09/2017 16:22

savills.co.uk/research 23
R E N T A L S
Against a backdrop of falling rents, corporate budgets have risen 13% year on year according to Savills Corporate Services, largely driven by higher financial-sector budgets. In the first half of 2017, these were 59% higher than the same period last year, adding more than £2,000 to the average monthly budget.
This time last year, companies were relocating fewer senior executives to London, focusing more on mid-ranking staff moving alone or as a couple. Now, banks and financial institutions are relocating higher-level staff to steer decision making through the Brexit process.
The diplomatic community is experiencing a similar trend, which means in some locations the market is seeing greater demand for family housing close to the best schools.
As more and more tenants choose to rent (up from 15% in 2013 to 20% in 2017 according to our data) the decision of what and where to rent is becoming more important. It is now common for tenants to focus their search on one area, but eventually decide to live somewhere entirely different.
Often, the standard of property has become more important than the location. Tenants now prefer high-spec properties in immaculate condition over the prestige of a well-known address. New build properties are setting the bar, with the quality of place an important factor, favouring locations such as Marylebone and Westminster over more traditional core central London areas.
This means that investors entering the market need to consider what they buy and where. Existing owners, particularly the great London estates, should continue their programme of stock upgrades and public-realm improvements to retain a rental premium and prevent voids.
The decision to move out of London can be a daunting one for those unsure of whether to make the leap. So, for many, renting before committing to making a purchase is a sensible step to ensure the new area is suitable. According to our dealbooks, tenants moving from London and renting in the commuter zone accounted for 21% of the market between 2015 and 2017.
These relocators have a clear preference for properties in a city or town with good schools, easy access to amenities and transport. This is not a new tendency and, by contrast, demand continues to be weaker for both village and rural locations.
Looking forward, we expect this trend to continue, particularly as we see more meaningful increases in the number of people following traditional relocation routes out of London.
Corporate budgets have increased
Best in class beats location
�e rise of try before you buy
59%�e rise in �nancial sector corporate budgets, H1 2017 versus H1 2016
21%Proportion of tenants moving from London and renting in the commuter zone between 2015 and 2017
Lifestyle upsize commits to renting
Best in class beats location
Corporate budgets rising Try before you buy
FOR SALE
Super prime market is on the move
FOR SALE
Lifestyle upsize commits to renting
Best in class beats location
Corporate budgets rising Try before you buy
FOR SALE
Super prime market is on the move
FOR SALE
Lifestyle upsize commits to renting
Best in class beats location
Corporate budgets rising Try before you buy
FOR SALE
Super prime market is on the move
FOR SALE
Savills_Prime_p22-23_rentals_v0.4.indd 23 21/09/2017 16:22

24 savills.co.uk/research
L O N D O N D E V E L O P M E N T
The alternative reality of new build realtyAre we heading into new territory for the prime London residential development market, as alternative uses serve to mitigate over-supply and buyers at the top end of the market change nature?
W O R D S E M I LY D O N O V A N
1Completions hit record levels
The increase in London’s prime supply pipeline is unprecedented. Over the next five years, we forecast that, on average, 8,500 new build homes above £1,000psf will be physically completed every year. That’s three times more than the annual average over the last five years, and nearly double the number of completions during the 12 months to Q2 this year. However, completion figures do not paint the full picture of the prime development market; the pipeline is best understood by also looking at sales and construction starts.
2 Sales hold up in an uncertain market
With more than 6,200 exchanges of prime new build homes over the last 12 months in London, new build activity at the top end has held up in an uncertain market. This is the highest number ever of £1,000psf+ sales in the London development market and 8% higher than the peak of 2013. This contrasts with the more domestically driven prime secondhand market, which has felt the effects of taxation changes and mortgage regulation.
3 Falling starts will ease pressure on the future pipeline
Despite strong off-plan sales in the prime new build market, starts continue to outpace sales. As a result, there remains a large pipeline of unsold homes yet to complete. The number of starts increased significantly between 2014 and 2016, as many tower schemes that cannot be phased began construction. This meant that in 2016, nearly two units were being started for every home sold. Looking forward, unless sales increase from their current levels,
there will be more practically completed and unsold homes on the market. This is an important consideration for developers’ expectations of future sales rates.
However, there are mitigating factors which could reduce future prime residential supply. First, during the last year, the annual number of starts reduced to 8,000 units, down from the peak of 11,000 seen during 2016.
Second, there is a growing trend by pragmatic residential developers to diversify into alternative asset classes.
Savills_Prime_p24-26_Development_v0.7.indd 24 21/09/2017 16:11

savills.co.uk/research 25
L O N D O N D E V E L O P M E N T
Investor Owner occupier
Investor or owner occupier? The length of time purchased off-plan
Completed unit
Up to 3 months
3 months to 1 year
1-2 years
More than 2 years 75%
29%
44%
48%
32%
25%
71%
56%
52%
68%
Source Savills Research Note 2014-first half of 2017
5 The changing nature of prime demandNew homes in London are being purchased closer to
their practical completion (PC). Our data shows that, in 2014, the average length of time a prime new build property was bought off-plan was 2.9 years pre-PC. By 2016, this was down to 1.9 years. During the first half of 2017, the average reduced to just over a year. More recently in the new build market above £5 million, buyers have been more focused on completed units as buyers at the top end prefer homes that are ready to move into. Just 25% of £5 million+ new build sales were of completed units in 2016. During the first half of 2017, this proportion increased to two-thirds of sales.
With more properties available upon, or closer to, completion, the profile of buyers is changing in the prime new build market. Owner occupiers (whether downsizing or purchasing for a main residence, a second home or a weekday pied-a-terre) tend to feature more heavily closer to practical completion.
In previous years, buy-to-let investors have been an important source of demand for the new build market. These buyers are often prepared to purchase off-plan, enabling developers to unlock the development finance required to commence construction. However, investors, particularly those with mortgages in the UK, are facing more stringent mortgage regulations and taxation changes.
London has experienced an uptick in overseas investors, but, contrary to popular belief, the majority of overseas-bought stock is occupied. The GLA’s recent study found less than 1% of new homes were left unoccupied on a long-term basis.
While international buyers may also face the difficulties mentioned above (depending on how they procure finance), those buyers who are willing to take a long-term view and believe in the fundamentals of London as an attractive place to invest, could benefit from favourable currency movements.
There is little doubt that the prime development market is evolving. Flexible developers are exploring new uses and new buyers are enjoying the tangibility of completed homes.
4What are the alternatives?
Large-scale residential developments that
are phased have the ability to deliver future
phases as commercial office units, serviced
apartments, retirement housing (see p26) and,
to a lesser extent at the top end, build to rent.
Battersea Power Station has already
exercised this option, choosing to hold on the
delivery of the residential element in the next
phase and focus on delivering the 1.2 million
sq ft of office and commercial space.
Savills_Prime_p24-26_Development_v0.7.indd 25 21/09/2017 16:10

26 savills.co.uk/research
L O N D O N D E V E L O P M E N T
313 Over the last three years, only 313 private homes for retirement were delivered in London
£253bnOver-65s in London own £253bn in housing equity, 35% of all owner-occupier equity in London
65% During the next 20 years, the number of over-65s will grow by 65% in London, making it the fastest-growing age group
54% �e proportion of over-65s who are under-occupying their London homes by two or more bedrooms, according to the 2011 Census
2,620 �e GLA has a target of 2,620 retirement properties to be delivered every year over the next �ve years
The London retirement market
Source Savills Research
W ith increasing undersupply and signs of government support, more investors are directing their attention and cash at retirement housing. Although companies such as Audley and
McCarthy & Stone are already well established in the UK, there remains a massive opportunity for other developers. Demand is growing for homes that meet the needs and aspirations of downsizers and the retirement market.
Challenges remain in this market. Developers/operators typically need to provide homes at values that allow downsizers to release equity from their current home, which may be used to enhance their quality of life, pay for later-life care, or provide �nancial support for children and grandchildren. Keeping service charges a�ordable is also an important consideration, given that most downsizers will not have been accustomed to paying annual property fees and tend to be asset rich and cash poor.
Planning remains a hurdle for this sector. Currently, there is inconsistency in the way boroughs treat retirement housing. Whether schemes qualify for C3 ‘dwelling house’ or C2 ‘residential with care’ status depends on a whole range of opaque and confusing factors. �e di�erence in Community Infrastructure Levy (CIL) and section 106 requirements for each class can make or break the �nancial viability of these schemes, which typically deliver higher levels of residents facilities than a typical residential scheme.
With a fundamental lack of suitable housing for downsizers in the capital, some retirees might look to move beyond the boundaries of the M25 (see page 19 for our feature on London’s migration). Developers/operators have an opportunity to help meet the needs of the undersupplied, undercatered for, but rapidly growing downsizer market in London.
Living the high (retirement) life
Dovehouse Street, Chelsea
Savills_Prime_p24-26_Development_v0.7.indd 26 21/09/2017 16:10

C O N T A C T S
Jonathan Hewlett
Head of London Residential
020 7824 9018
Yolande Barnes
Head of World Research
020 7409 8899
Emily Donovan
Associate
London Residential Research
020 7409 5903
Lucian Cook
Head of UK
Residential Research
020 7016 3837
Lindsay Cuthill
Head of Country Department
020 7016 3820
Katy Warrick
Head of London
Residential Research
020 7016 3884
Frances Clacy
Associate, UK
Residential Research
020 7409 5905
Justin Marking
Head of Global Residential
020 7016 3810
Gaby Day
Analyst, UK
Residential Research
020 7299 3003
Savills Residential Research We’re a dedicated team with an unrivalled reputation for producing well-informed and accurate analysis, property research and commentary on all sectors of the UK’s housing market. Established prime residential markets make the UK a global centre. Savills Residential Research understands the reasons why
Savills plc: Savills is a leading global real estate service provider listed on the London Stock Exchange. The company was established in 1855 and has a rich heritage with unrivalled growth. It is a company that leads rather than follows, and now has more than 700 offices and associates throughout the Americas, Europe, Asia Pacific, Africa and the Middle East. This report is for general informative purposes only. It may not be published, reproduced or quoted, in part or in whole, nor may it be used as a basis for any contract, prospectus, agreement or other document without prior consent. While every effort has been made to ensure its accuracy, Savills accepts no liability whatsoever for any direct or consequential loss arising from its use. The content is strictly copyright and reproduction of the whole or part of it in any form is prohibited without written permission from Savills Research.
Kirsty Bennison
Associate, UK
Residential Research
020 7016 3836
Research
SalesEd Lewis
Head of London Residential
Development Sales
020 7409 9997
Jane Cronwright-Brown
Head of Lettings
020 7578 9980
Mat Oakley
Head of European
Commercial Research
020 7409 8781
Lettings
Savills_Prime_p24-26_Development_v0.7.indd 27 21/09/2017 17:11

Savills_Prime_p01_cover_v0.4.indd 1 21/09/2017 16:09