sportswear sector - corp · sportswear sector quity research | consumer discretionary dec 24, 2015e...
TRANSCRIPT

Sportswear Sector
Dec 24, 2015 Equity Research | Consumer Discretionary
Momentum to continue in 2016; Li Ning initiation, raise TP for Anta, Xtep and Peak
Albert Yip, CFA SFC CE No. ADT599 [email protected] +852 3719 1010 GF Securities (Hong Kong) Brokerage Limited 29-30/F, Li Po Chun Chambers 189 Des Voeux Road Central Hong Kong
Momentum to remain strong in 2016 Government supportive policies, peoples’ rising health awareness and strong capital investment by corporates will continue to fuel the rapid development of the sports industry in China. Driven by the surge in running events, we expect the sales of running products (largest sportswear category) to remain the key growth driver of the sportswear sector. We expect the football industry to develop rapidly following several mega deals in 2015, and the sportswear sector re-rating to continue on better growth visibility. We raise our TP for Anta, Xtep and Peak (all rated Buy), and initiate coverage of Li Ning (2331 HK) with Buy and TP of HK$4.40. China’s sports participation still far below the US On 25 Nov 2015, the General Administration of Sport of China released the "2014 National Fitness Survey", showing that 33.9% of people aged 6 or above participated in sports regularly during 2014. In the US, only 28.3% of people (aged 6 or above) reported no physical activity in 2014, according to the Physical Activity Council. Fast growing running participant base The number of marathon competitions in China is expected to surge 124% YoY to 114 in 2015. Given the larger number of monthly competitions in 2H than in 1H, strong growth in the number of competitions is anticipated to continue into 2016. In addition, as many running events in China have a short history, we believe the per event participant number will increase quickly. Sector outlook better and healthier than in 2010 The 1-year forward P/E of the sportswear sector peaked in Oct 2010, when sales growth had been driven by aggressive store opening (store number peaked in 2011) and overly optimistic order book growth driven by sportswear companies’ distributors. We think both the micro and macro fundamental factors at present are stronger and healthier than in 2010. On the macro side, apart from favorable government policies, stronger capital input from corporate investors (Wanda, China Media Capital, Alibaba, Tencent, etc.) and people’s rising health awareness are boosting demand. On the micro side, sportswear companies now focus more on improving store productivity than on opening more stores. The proportion of stores connected to ERP systems has also increased significantly from 2010, which should help sportswear companies better monitor their channel inventory levels. Therefore, we expect sportswear sector growth to be more sustainable than in 2010. Initiate coverage of Li Ning and raise TP for Anta, Xtep and Peak We initiate coverage of Li Ning with a Buy rating and TP of HK$4.40, which is arrived at by discounting a target FY17E P/E of 17x one year back. We expect Li Ning to deliver the strongest net profit CAGR among peers during FY15-17, led by both top line growth and an OP margin recovery. The recovery of its OP margin will be driven by the control of staff and A&P costs which had been overspent previously. Leveraging on its brand name, the company targets to increase its market share by turning back to the mass market and launching smart products at competitive prices. We also raise the target P/E for three sportswear stocks under our coverage as we expect the sportswear re-rating to continue. We raise our TP for Anta from HK$21.50 to HK$24.70, based on 22x FY16E P/E. Our TP for Xtep is increased from HK$4.60 to HK$5.30, based on 14x FY16E P/E. We also revise up Peak’s TP from HK$2.41 to HK$2.60, based on 12.7x FY16E P/E.
Stock performance
Source: Bloomberg
Key data
Source: Bloomberg
-30%
-20%
-10%
0%
10%
20%
30%
40%
50%
60%
Dec-14 Mar-15 Jun-15 Sep-15 Dec-15
Sportswear sector
MSCI China Consumer Discretionary Index
1M % Chg YTD % Chg
Anta (6.6) 60.7
Peak (9.3) 4.2
Xtep (14.6) 30.0
Li Ning (4.5) 18.3
361 Degrees (8.7) 36.1
Average (8.7) 29.9
Stock valuation
Sources: Company data, Bloomberg estimates, GF Securities (HK) Research
Ticker Company Price
(HK$)
Rating Target price
(HK$)
2015
P/E
2016E
P/E
2017E
P/E
2015E
ROE (%)
2016E
ROE (%)
2015E
P/B
2016E
P/B
2020 HK Anta 21.90 Buy 24.70 22.1 19.5 17.0 24.5 26.3 5.0 4.8
2331 HK Li Ning 4.07 Buy 4.40 649.4 24.3 14.7 0.4 9.6 2.0 2.1
1368 HK Xtep 4.02 Buy 5.30 11.9 10.0 12.6 10.6 9.8 1.5 1.4
1968 HK Peak 2.24 Buy 2.60 10.9 10.9 10.1 8.1 8.2 0.9 0.9
1361 HK 361 Degrees 2.83 Not-rated NA 9.7 8.0 6.7 9.8 11.1 0.9 0.8
Average 140.8 14.5 12.2 10.7 13.0 2.0 2.0
Dec 24, 2015
2
Sector report
China’s sports participation still far below the US
On 25 Nov 2015, the General Administration of Sport of China released the "2014 National Fitness Survey", which showed that 33.9% of people (aged 6 or above) in China participated in sports regularly during 2014, up 5.7pp from 2007. In addition, the study estimated that only 410m people aged 20 or above participated in sports in 2014, representing about 47% of the total population in that age group by our estimates. In the US, 28.3% of people (aged 6 or above) reported no physical activities in 2014, according to the Physical Activity Council. Therefore, we think there is still much room for China’s sports participation to improve. Nielsen published the 2015 Sports Enthusiasts Tracker on 10 Dec 2015. Some of the key findings are listed below:
76% of respondents said the main reason for exercising is to improve their physical fitness; 60% said they enjoy posting their workout achievements on social media;
80% and 70% of the sports population purchased sneakers and sportswear respectively in the previous year;
The top four favorite sports for men are running (71%), badminton (53%), basketball (44%) and swimming (38%), while the top four for women are running (69%), badminton (58%), swimming (35%) and yoga (31%);
Among consumers participating in sports, the most watched sports event is football (63%), followed by basketball (61%) and swimming (61%);
Among consumers participating in sports, UEFA Champions League is the most watched football league (39%); 30% of the consumers also watch Chinese Football Association Super League;
Among consumers participating in sports, NBA is the most watched basketball competition (56%), followed by CBA (34%);
The NBA team most supported by consumers is Houston Rockets (24%), followed by LA Lakers (17%) and Chicago Bulls (12%).
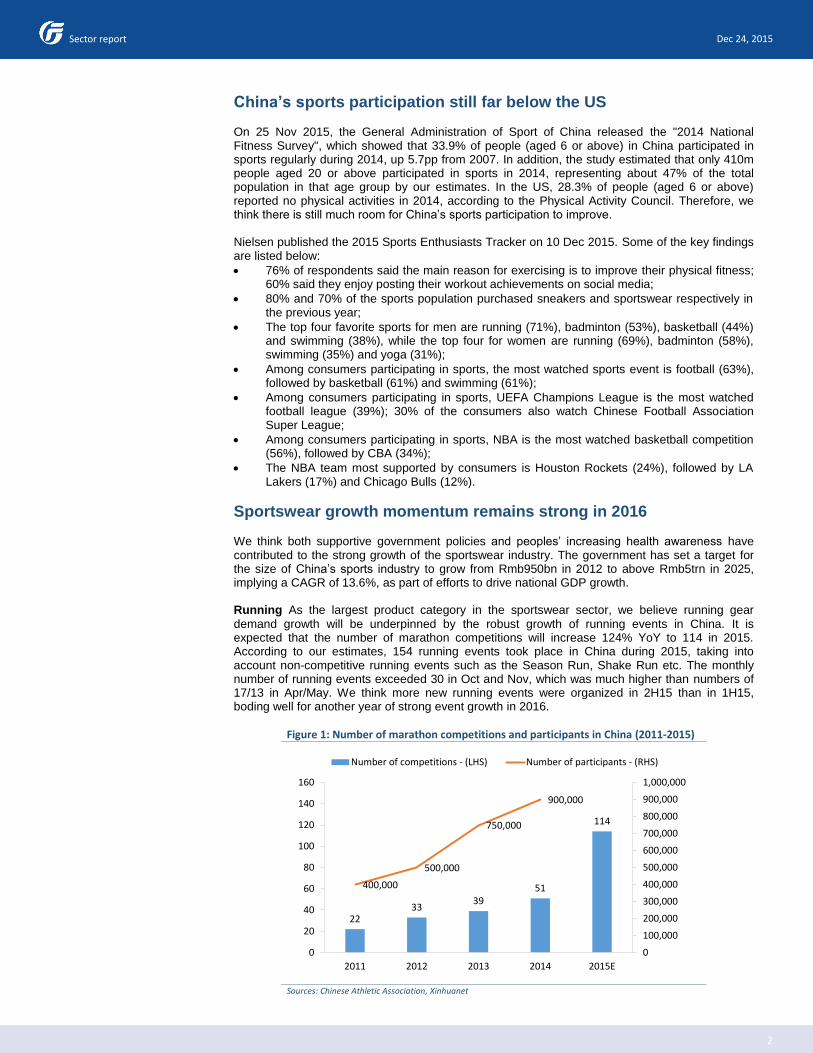
Sportswear growth momentum remains strong in 2016 We think both supportive government policies and peoples’ increasing health awareness have contributed to the strong growth of the sportswear industry. The government has set a target for the size of China’s sports industry to grow from Rmb950bn in 2012 to above Rmb5trn in 2025, implying a CAGR of 13.6%, as part of efforts to drive national GDP growth. Running As the largest product category in the sportswear sector, we believe running gear
demand growth will be underpinned by the robust growth of running events in China. It is expected that the number of marathon competitions will increase 124% YoY to 114 in 2015. According to our estimates, 154 running events took place in China during 2015, taking into account non-competitive running events such as the Season Run, Shake Run etc. The monthly number of running events exceeded 30 in Oct and Nov, which was much higher than numbers of 17/13 in Apr/May. We think more new running events were organized in 2H15 than in 1H15, boding well for another year of strong event growth in 2016.
Figure 1: Number of marathon competitions and participants in China (2011-2015)
Sources: Chinese Athletic Association, Xinhuanet
2233
3951
114
400,000
500,000
750,000
900,000
0
100,000
200,000
300,000
400,000
500,000
600,000
700,000
800,000
900,000
1,000,000
0
20
40
60
80
100
120
140
160
2011 2012 2013 2014 2015E
Number of competitions - (LHS) Number of participants - (RHS)

Dec 24, 2015
3
Sector report
Figure 2: Monthly breakdown of running events in 2015
Sources: General Administration of Sport of China, GF Securities (HK) Research
20
6
17
13
10
5 4
22
31
35
9
0
5
10
15
20
25
30
35
40
Jan Feb Mar Apr May Jun Jul Aug Sep Oct Nov Dec

Dec 24, 2015
4
Sector report
Figure 3: Running events by different tiers of cities during 2015 (Part I)
Sources: General Administration of Sport of China, GF Securities (HK) Research
Date Tier 1 Tier 2 Tier 3 or below
03-Jan Xiamen Int'l Marathon
11-Jan R&F Haikou Marathon
15-Mar Wuxi Int'l Marathon
22-Mar Changan Auto Chongqing Int'l Marathon
22-Mar Fuzhou 12-hr Marathon
29-Mar Zheng-Kai Int'l Marathon
29-Mar Suzhou Jinjihu Int'l Half-marathon
29-Mar Nanjing Hillroad Marathon
11-Apr The North Face汇跑越野·鼋春赛
11,12-Apr Shenzhen The Season Run
12-Apr Shanghai Happy 10K
12-Apr Guangzhou Li Ning 10k Road Run
19-Apr Yangzhou Int'l Half-marathon
19-Apr Yiwu Half-marathon
19-Apr Jinshanling Great Wall Marathon
19-AprShanghai Suiming Hengshadao Half-marathon (550
Rural Marathon round 3)
25-Apr Shanghai Kate Pink Run
25-Apr Lanling Half-marathon
25-Apr Wuxi Happy 10K
25-Apr Ningbo Hill land Marathon
26-Apr Huanghekou Int'l Marathon
26-Apr Yangling Agricultural City Marathon
26-Apr Beijing Int'l Long Run Festival
26-Apr Jiulonghu (Ningbo) Half-marathon
26-Apr Wuhan Li Ning 10k Road Run
02-May Shijiazhuang 100km Challenge
02-May 武汉后官湖半程马拉松
09-May Tianjin The Season Run
09-May Dalian Int'l Marathon
10-May Shanghai Li Ning 10k Road Run
17-May Yingkou Bayuquan Int'l Half-marathon
17-May Hengdian Half-marathon
17-May Beijing Guangming Lepao Half-marathon relay
23-May Guangzhou Xtep Il lumi Run
24-May Xuzhou Li Ning 10k Road Run
31-May Dandong Yalujiang Int'l Marathon
31-May Qinhuangdao Marathon competition
31-MayShanghai Qingpu Half-marathon (550 Rural
Marathon round 4)
06-Jun Xian The Season Run
13-Jun Chongqing The Season Run
13-Jun Lanzhou Int'l Marathon
13-Jun Changchun Jingyuetan Forest Marathon
13-Jun Beijing Yaopao 24-hr City Relay
14-Jun Zhengzhou Li Ning 10k Road Run
20-Jun Beijing Ultramarathon Challenge Series
27-Jun Zhangjiakou KangBao Grassland Int'l Marathon
28-Jun Beijing The Season Run
28-Jun Xian Happy 10K
05-Jul Guiyang Int'l Marathon
12-Jul Xingkaihu Marathon
12-Jul Kunming Li Ning 10k Road Run
18-Jul Beijing Xtep Il lumi Run
25-Jul南京“NORTHLAND杯”三夫户外“量山好汉”紫金山荧
光跑

Dec 24, 2015
5
Sector report
Figure 4: Running events by different tiers of cities during 2015 (Part II)
Sources: General Administration of Sport of China, GF Securities (HK) Research
Date Tier 1 Tier 2 Tier 3 or below
15-Aug Liangdu Liupanshui Summer Int'l Marathon
16-Aug Chengdu First 5k Run
23-Aug Shenyang Li Ning 10k Road Run
30-Aug Kunming Highland Int'l Half-marathon
04-Sep Dalian Changshan Qundao Marathon
05-Sep Helong Int'l Marathon
05-Sep Wulanchabu Int'l Marathon
05-Sep Tengzhou Marathon
05-Sep 美丽中国·生态马拉松张掖临泽站
05-Sep Qingdao Li Ning 10k Road Run
12-Sep Panjin Red Beach Int'l Marathon
12-Sep 烟台长岛环岛半程马拉松赛
13-Sep Tianjin Int'l Marathon
13-Sep Taiyuan Int'l Marathon
13-Sep Suzhou Happy 10k
19-Sep Guizhou Huangguoshu Int'l Half-marathon
19-Sep 青岛·莱西国际马拉松
20-Sep Beijing Marathon
20-Sep Xian Li Ning Road Run 10k
20-Sep Yaoshan Ultra-Marathon
20-Sep 三夫户外2015千岛湖山地半程马拉松
26-Sep Hengshuihu int'l Marathon
26-Sep Zhengzhou Shake Run
27-Sep Shenyang Marathon
27-Sep 伊春国际森林马拉松
27-Sep Beijing Bimbo Global Energy Race
07-Oct Chongqing Shake Run
11-Oct Ningbo Shake Run
11-Oct 济宁环太白湖秋季半程马拉松
11-Oct 潍坊(峡山)国际乡野马拉松
17-Oct Shenzhen Xtep Il lumi Run
17-Oct Yunnan Shuifu Int'l Marathon
17-Oct Beijing Greatwall Marathon
18-Oct Beijing Li Ning 10k Road Run
18-Oct Beijing Shake Run
18-Oct Taishan Int'l Marathon
18-Oct Dunhuang Silkroad Int'l Friendly Marathon
18-Oct 宁海越野挑战赛
18-Oct Changsha Int'l Marathon
18-Oct Changzhou Wujin West Tailake Int'l Half-marathon
18-Oct Tailake Tuying Int'l Half-marathon
18-Oct Shanghai Happy 10K
18-Oct 承德国际半程马拉松
18-Oct Chengdu Wenjiang Half-marathon
18-Oct 文成半程马拉松暨浙江马拉松精英赛
18-Oct Changshu Shanghu Int'l Half-marathon
22-Nov Wuhan Half-marathon
24-Oct Xian Shake Run
24-Oct Ningbo Int'l Marathon
24-Oct Shanghai Chongming Half-marathon
25-Oct Lianyungang Xuyu Int'l Marathon
25-Oct Hefei Int'l Marathon
25-Oct 大连环黄泥川越野赛
25-Oct上海金山廊下半程马拉松 (550 Rural Marathon
round 5)
31-Oct Jinan 12-hour Ultramarathon
31-Oct 苏州大阳山跑山赛
31-Oct Chengdu Shake Run

Dec 24, 2015
6
Sector report
Figure 5: Running events by different tiers of cities during 2015 (Part III)
Sources: General Administration of Sport of China, GF Securities (HK) Research
Based on the historical pattern of the Standard Chartered Hong Kong Marathon, the number of participants has grown rapidly since the first year the event was held. Given that many running events in China have a short history, we believe the number of running participants in China will grow strongly over the coming few years, which should boost the demand for running apparel and footwear.
Date Tier 1 Tier 2 Tier 3 or below
01-Nov Hangzhou Int'l Marathon
01-Nov Beijing Olympic Forest Park 100+ Ultramarathon
01-Nov Shenzhen Nanshan Half-marathon
01-Nov Nanjing Happy 10k
01-Nov 平武国际山地半程马拉松赛
07-Nov Wuhan Shake Run
07-NovChina University of Mining and Technology Half-
marathon (Xuzhou)
08-Nov 酒泉国际戈壁超级马拉松
08-Nov Shanghai Int'l Marathon
08-Nov Xichang Qionghai Wetland Int'l Marathon
08-Nov Mount Wuyi Int'l Marathon
08-Nov Hunan Zhaoshan Half-marathon
08-Nov Beijing Bird's Nest Half-marathon
13-NovGuizhou Tour of Lei Gong Mountain Int'l 100km
Ultra Trail Challenge
14-Nov Nanjing Shake Run
14-Nov Xiamen Xtep Il lumi Run
14-Nov Chengdu The Season Run
15-Nov Linyi Int'l Marathon
15-Nov Nanjing Gaochun Int'l Marathon
15-Nov Shenzhen Happy 10k
15-Nov Taizhou Marathon
15-Nov 舟山群岛国际马拉松赛
15-Nov 上饶半程马拉松
21-Nov 上海浦东国际女子半程马拉松
21-Nov 北京三夫户外超能量山地马拉松
21-Nov 西双版纳热带精英马拉松
21-Nov Guangzhou Shake Run
22-Nov Haikou Int'l Beach Marathon
22-Nov Songshan Shaolin Int'l Marathon
22-Nov 蜀道驿传4x1驿接力赛
22-Nov 泗洪生态湿地国际半程马拉松
28-Nov Wenzhou Marathon
29-Nov 千岛湖马拉松
29-Nov 宁德三沙山地马拉松
29-Nov Nanjing Int'l Marathon
05-Dec Zhenjiang Int'l Half-marathon
06-Dec Guangzhou Marathon
06-Dec Shenzhen Int'l Marathon
06-Dec Ninghai Shenzhen Mountain Marathon
06-Dec Chongqing Happy 10k
12-Dec Nanning Int'l Half-marathon
20-Dec Hainan Danzhou Int'l Marathon
26-Dec 永定河国际马拉松
27-Dec Huizhou Happy 10k
Total 33 40 81

Dec 24, 2015
7
Sector report
Figure 6: Number of participants in Standard Chartered Hong Kong Marathon
Sources: Hong Kong Amateur Athletic Association, Hong Kong Major Sports Events Committee
Football On 16 Mar 2015, the State Council issued the Overall Plan for Football Reform and
Development (《中国足球改革发展总体方案》) to include the development of football as part of
economic development planning. A key part of the football reform plan is to actively promote football sports in primary and secondary schools and universities, by: (1) including football in the syllabus of physical education of all primary and secondary schools; (2) increasing primary and secondary schools with strengths in football to 20,000 in 2020 and 50,000 in 2025; and (3) establishing school football teams in primary and secondary schools and universities as well as promoting inter-school football competitions. On 17 Aug 2015, the Chinese Football Association was officially separated from the management of the General Administration of Sports of China. Going forward, the Chinese Football Association will be fully responsible for industry development planning, interaction with international professional entities, as well as the management of the association’s man power, finance and salaries. This restructuring was seen as a major step of football industry reform. The Ministry of Education has announced that there were 8,651 primary and secondary schools with strengths in football as of 27 Jul 2015. According to an official from the Ministry of Education
(教育部体卫艺司司长王登峰), China could have a football population of 50m by 2025 (around
1,000 per school) which would be the largest in the world. In Nov 2012, China’s school football population was only 2.7m. Given the government’s determination to execute its football development plan, we believe the target to have 20,000 schools with strengths in football by 2020 is achievable. On 1 Dec 2015, City Football Group announced a partnership with a consortium made up of China Media Capital Holdings and CITIC Capital, which invested US$400m for a 13% of stake in CFG. CFG currently owns a 100% stake in Manchester City FC, New York City FC and Melbourne City FC, as well as a minority stake in Yokohama F. Marinos, and it has relationships with a number of football clubs across various countries which act as its training/scouting partners. Prior to this deal, CFG was wholly owned by Abu Dhabi United Group, a UAE private equity company owned by Sheikh Mansour bin Zayed Al Nahyan, member of the Abu Dhabi Royal Family and Minister of Presidential Affairs for the UAE. Meanwhile, the shareholders of CMC Holdings include Alibaba, Tencent and Oriza Holdings. CMC chairman Mr. Li Ruigang will represent the consortium on CFG’s Board. Following this partnership deal, CFG will provide a wealth of industry expertise and resources to the rapidly developing Chinese football industry. There have been media reports saying that CFG is considering investing in Beijing Guoan Football Club, which is owned by CITIC Group. On 25 Sep 2015, Ti’ao Power (体奥动力) won the bid for the broadcasting right of the Chinese Football
Association Super League for five seasons from 2016 to 2020 for a consideration of Rmb8bn, or Rmb1.6bn per year, which is much higher than the ~Rmb70m for the 2015 season. The surge in the price of the broadcasting right should improve the financial position of the league’s football clubs. Media reports said that Ti’ao Power was funded by China Media Capital Partners, whose chairman is also Mr. Li. On 18 Dec 2015, Mr. Li was added to the executive committee of the
1,000
6,000 7,000 10,000
13,000
18,500
24,000
31,330
40,174 43,956
50,000
55,000
60,000
65,000
70,000 72,000
73,000
0
10,000
20,000
30,000
40,000
50,000
60,000
70,000
80,000
1997 1998 1999 2001 2002 2003 2004 2005 2006 2007 2008 2009 2010 2011 2012 2013 2014

Dec 24, 2015
8
Sector report
Chinese Football Association. Following the Chinese consortium’s investment in CFG, we expect more positive news to drive the rapid development of the Chinese football industry, which should boost the demand of football related products.
Sportswear outlook better and healthier than in 2010 According to Nike’s 2020 target, the company expects to see mid-teens revenue growth from the China market over the next five years. Such a growth rate would be the strongest among all of Nike’s major markets. That means Nike also has a very positive view on China’s sportswear market. The 1-year forward P/E of the sportswear sector peaked in Oct 2010, when sales growth had been driven by aggressive store opening (store number peaked in 2011) and overly optimistic placement of future orders by sportswear companies’ distributors. We think both the micro and macro fundamental factors at present are stronger and healthier than in 2010. On the macro side, apart from favorable government policies, stronger capital input from corporate investors (Wanda, China Media Capital, Alibaba, Tencent, etc.) and people’s rising health awareness are boosting demand. On the micro side, sportswear companies now focus more on improving store productivity than on opening more stores. The proportion of stores connected to ERP systems has also increased significantly from 2010, which should help sportswear companies better monitor their channel inventory levels. Therefore, we expect sportswear sector growth to be more sustainable than in 2010.
Figure 7: Core brand revenue growth in China market (FY09-11)
Sources: Companies, GF Securities (HK)
Figure 8: Store growth in China (FY09-11) Figure 9: SSS growth (FY09-11)
Sources: Companies, GF Securities (HK) Sources: Companies, GF Securities (HK)
-20%
0%
20%
40%
60%
80%
100%
120%
140%
160%
180%
FY09 FY10 FY11
Anta Li Ning Xtep Peak 361 Degrees
0%
5%
10%
15%
20%
25%
30%
35%
FY09 FY10 FY11
Anta Li Ning Xtep Peak 361 Degrees
0%
5%
10%
15%
20%
FY09 FY10 FY11
Anta Li Ning Xtep Peak 361 Degree

Dec 24, 2015
9
Sector report
Figure 10: P/E band of Anta
Source: Company data, GF Securities (HK)
Figure 11: P/E band of Xtep
Source: Company data, GF Securities (HK)
Figure 12: P/E band of Peak
Source: Company data, GF Securities (HK)
6x
10x
14x
18x
22x
0
5
10
15
20
25
30
Jul-
09
Oct
-09
Jan
-10
Ap
r-1
0
Jul-
10
Oct
-10
Jan
-11
Ap
r-1
1
Jul-
11
Oct
-11
Jan
-12
Ap
r-1
2
Jul-
12
Oct
-12
Jan
-13
Ap
r-1
3
Jul-
13
Oct
-13
Jan
-14
Ap
r-1
4
Jul-
14
Oct
-14
Jan
-15
Ap
r-1
5
Jul-
15
Oct
-15
HK$
1
2
3
4
5
6
7
8
9
Jun
-09
Oct
-09
Feb
-10
Jun
-10
Oct
-10
Feb
-11
Jun
-11
Oct
-11
Feb
-12
Jun
-12
Oct
-12
Feb
-13
Jun
-13
Oct
-13
Feb
-14
Jun
-14
Oct
-14
Feb
-15
Jun
-15
Oct
-15
12.5x
10x
7.5x
5x
15x
(HK$)
1
2
3
4
5
6
7
8
Oct
-09
Feb
-10
Jun
-10
Oct
-10
Feb
-11
Jun
-11
Oct
-11
Feb
-12
Jun
-12
Oct
-12
Feb
-13
Jun
-13
Oct
-13
Feb
-14
Jun
-14
Oct
-14
Feb
-15
Jun
-15
Oct
-15
14x
12x
10x
7x
17x
(HK$)

Dec 24, 2015
10
Sector report
Figure 13: Order book growth for sportswear companies
Source: Company data, GF Securities (HK)
Figure 14: SSS trend for sportswear companies
Source: Company data, GF Securities (HK)
Li Ning (2331 HK, Buy) Initiate at Buy with TP of HK$4.40 We expect Li Ning to deliver the strongest net profit CAGR
among peers during FY15-17, led by both top line growth and an OP margin recovery. The recovery of its OP margin will be driven by the control of staff and A&P costs which had been overspent previously. Leveraging on its brand name, the company targets to increase its market share by turning back to the mass market and launching smart products at competitive prices. Our TP of HK$4.40 is arrived at by discounting a target FY17 P/E of 17x one year back at 7.1% WACC. OP margin recovery Li Ning is the second largest domestic sportswear brand just behind Anta in
terms of 1HFY15 revenue, while its 3.8% OP margin in FY15 was far below Anta’s 22.9% by our estimates. We believe there is room for Li Ning to improve its OP margin by controlling operating cost and improving the sales mix of new products. The company streamlined and flattened its organizational structure during 1HFY15. We believe staff cost saving could reach Rmb60m in FY15 and Rmb130m in FY16 compared to FY14. We also expect to see cost saving from A&P expenses (the greatest operating expense item) given that the company’s A&P expense ratio was high at 19% in FY14 (vs peers’ 10-17%). We expect the company to gradually drop the sponsorships outside its five core categories (basketball, running, badminton, training, sports life) when they expire. The sponsorship of CBA, the company’s most expensive sponsorship which cost Rmb2bn for five years according to media reports, will expire in 2HFY17. While it is too early to tell how competitive the bidding for the CBA sponsorship will be in FY17, we expect the company to offer its bidding price more prudently. Even if its CBA sponsorship cannot be renewed successfully in 2017, Li Ning has already endorsed eight CBA stars to maintain its high exposure in CBA. If these CBA players are picked by NBA teams in the future, it would be a big bonus for Li Ning. Separately, we see two factors that will drive a GM improvement for the company: (1) the negative impact of the tag cost increase ended in 1H15; (2) the decrease in old inventory levels could improve the sales mix of new products. E-commerce targeted to contribute 20% of total revenue in 3-5 years E-commerce revenue
surged 110% YoY in 1HFY15 and contributed 7% of the Li Ning brand’s revenue. In Jul, the company partnered with Xiaomi to sell two models of smart running shoes exclusively through online channels, with the retail prices set at the low to mid-end of the price range of its running products. Market response has been satisfactory with more than 200,000 pairs sold since their launch. During this year’s Singles’ Day shopping spree, Li Ning recorded the highest sales
1Q14 2Q14 3Q14 4Q14 1Q15 2Q15 3Q15 4Q15 1Q16 2Q16
Antahigh single-
digit growth
high single-
digit growth
high single-
digit growth
low double-
digit growth
low double-
digit growth
low double-
digit growth
low double-
digit growth
low double-
digit growth
low double-
digit growth
low double-
digit growth
Li Ning NA NA NAlow-teens
growth
mid-twenties
growth
mid-teens
growth
high-teens
growth
low-teens
growth
mid-teens
growth
high-teens
growth
Xtephigh single-
digit decline
mid single-
digit decline
low single-
digit decline0%
low single-
digit growth
low single-
digit growth
low single-
digit growth
low single-
digit growth10% 10%
Peaklow single-
digit decline
high single-
digit growth
mid-teens
growth
mid-teens
growth
mid-teens
growth
mid-teens
growth
mid-teens
growth
mid-teens
growth
mid-teens
growth
mid-teens
growth
361 Degrees 11% decline 11% decline 7% decline 8% 11% 11% 16% 18% 15% 15%
1Q14 2Q14 3Q14 4Q14 1Q15 2Q15 3Q15
Antamid single-
digit growth
low double-
digit growth
high single-
digit growth
high single-
digit growth
high single-
digit growth
high single-
digit growth
high single-
digit growth
Li Ninglow single-
digit growth
low single-
digit decline
low single-
digit growth
mid single-
digit growth
mid single-
digit growth
low-teens
growth
mid single-
digit growth
Xteplow single-
digit growth
mid single-
digit growth
mid single-
digit growth
mid single-
digit growth
mid single-
digit growth
high single-
digit growth
high single-
digit growth
Peaklow single-
digit growth
low single-
digit growth
low single-
digit growth
low single-
digit growth
mid single-
digit growth
mid single-
digit growth
high single-
digit growth
361 Degrees 2% 3% 5% 6% 6% 7% 8%

Dec 24, 2015
11
Sector report
(>Rmb200m on self-operated and third-party operated stores) on the Tmall platform among domestic brands. We expect e-commerce to contribute 9% of the Li Ning brand’s revenue in FY15 and its GM to improve on a lower sales mix of old inventories. More smart products to be launched in FY16 We expect Li Ning to launch more smart sports
products in FY16 relying on its strategic cooperation with Xiaomi, which could help differentiate its products from those of its peers. The retail prices of these smart products might be as competitive as the Xiaomi running shoes as the company is repositioning itself as a mass market brand. Expanding casual wear business Unlike its peers which are improving the sales mix of
functional products, Li Ning will expand its sports life category by distinguishing it as a blue label product line in individual stores. The market positioning of targeting young and trendy customers in the mass market is the same as other domestic sportswear brands. About 50% of products will be prepared through trade fairs 7-8 months ahead with the other 50% prepared under the fast fashion business model. The contribution of sports life was 32% in terms of retail sell-through mix in 1H15. After counting in the contribution from Double Happiness and badminton products, the sales mix of sports life would be even lower. Store expansion We expect the company to add 410/450/400 stores in FY15/16/17 to strengthen
its presence in the southern region and expand the retail network of its blue label products. During 1HFY15, the company set up strategic partnerships with the operators of nine department stores and supermarkets such as Parkson, Bailian, Grandbuy, RT-Mart, Rainbow and Maoye. New stores opened within retail chains tend to require less capex and have a more flexible rental structure compared to street stores. The breakeven period has been shortened to ~6 months (vs 6-9 months previously). We expect some of the new stores to be opened in FY16-17 will be counters in hypermarkets and department stores. Valuation Our TP of Anta and Xtep represent 19.2x and 12.9x FY17E P/E. Given Li Ning’s
market share which is between Anta and Xtep, and its high earnings growth in FY18 (+32% net profit growth led by a 1.4pp OP margin improvement mainly on a lower A&P expense ratio as the spending on the CBA sponsorship ends), we think a target valuation of 17x FY17E P/E is not aggressive. Our TP is set at HK$4.40 by discounting one year back at 7.1% WACC. Risks The absence of improvement in the company’s relatively high channel inventory levels (6.9
months in 1H15) will weigh on its GM; its store expansion plan might be missed as distributors’ profitability fails to improve; the company has a limited track record due to the frequent change of its management and strategies.
Figure 15: Key assumptions
Sources: Company data, GF Securities (HK) estimates
(Rmb m) FY13 FY14 FY15E FY16E FY17E
Total revenue 5,824 6,728 7,805 7,920 8,591
growth % -13.6% 15.5% 16.0% 1.5% 8.5%
Li Ning products 5,083 5,932 6,923 7,783 8,441
growth % -14.2% 16.7% 16.7% 12.4% 8.5%
Double Happiness 612 682 757 na na
growth % 13.1% 11.3% 11.0%
Other products 129 114 125 138 150
growth % -38.2% -11.7% 10.0% 10.0% 9.0%
Gross margin 44.5% 44.6% 45.5% 46.6% 46.7%
SG&A expenses ratio 50.0% 53.0% 42.2% 41.6% 39.6%
Operating profit margin -3.5% -7.9% 3.8% 5.4% 7.5%
Effective tax rate 14.0% 13.0% -73.2% -26.0% -26.0%
Net profit margin -7.3% -11.1% 0.1% 4.3% 6.6%
Adj net profit margin -7.3% -11.1% 0.1% 4.3% 6.6%
Payout ratio 0% 0% 0% 0% 30%

Dec 24, 2015
12
Sector report
Figure 16: Financial statements
Sources: Company data, GF Securities (HK) estimates
Anta (2020 HK, Buy) Maintain Buy and lift TP to HK$24.70 Anta is the first domestic brand to have set out a detailed
strategy for the football business. While we see limited contribution from this business over the coming 1-2 years, we expect to see more meaningful contribution in 3-5 years given the government’s strong determination to develop China’s football industry. In addition, the company is seeking to add international brands into its brand portfolio. It is leveraging on its execution track record and stronger-than-peers financial resources (earnings base and net cash position) to achieve above-peers growth and to widen its market share advantage over domestic peers. We continue to like Anta’s diversified growth drivers and market share expansion trend underpinned by strong execution and rising brand equity. We raise our TP from HK$21.50 to HK$24.70, based on 22x FY16E P/E (vs 18x previously).
Year ended 31 Dec (Rmb m) FY13 FY14 FY15E FY16E FY17E Year ended 31 Dec (Rmb m) FY13 FY14 FY15E FY16E FY17E
Revenue 5,824 6,728 7,805 7,920 8,591 Fixed assets
Cost of sales (3,230) (3,724) (4,254) (4,229) (4,578) PPE 791 861 1,085 1,242 1,451
Gross profit 2,594 3,004 3,551 3,692 4,013 Land use rights 351 372 363 353 343
Intangible assets 381 446 414 362 310
Other income and gains 113 34 41 28 36 Investment in JV/associates 13 21 31 639 657
SG&A expenses (2,910) (3,567) (3,292) (3,293) (3,401) Others 173 65 72 72 76
Operating profit (203) (529) 300 427 648 Deferred tax assets 346 311 311 311 311
2,055 2,077 2,275 2,979 3,148
Net finance cost (150) (143) (137) (134) (72)
Other gains 34 0 0 260 0 Current assets
Share of profit/(loss) of associates 0 0 0 111 126 Inventories 942 1,289 1,178 1,045 1,132
Share of profit/(loss) of JV 2 7 10 14 18 Trade receivables 1,371 1,260 1,299 1,274 1,361
Profit before tax (317) (665) 172 677 719 Prepayments 363 379 440 319 346
Income tax expense (42) (79) (116) (87) (150) Others 5 3 3 3 3
Non-controlling interests (32) (38) (46) 0 0 Cash and cash equivalents 1,281 1,031 1,862 1,794 1,973
Net profit (392) (781) 10 590 570 3,962 3,963 4,781 4,435 4,815
Adj net profit (425) (747) 10 341 570
FD Adj EPS (Rmb) (0.32) (0.48) 0.01 0.14 0.24 Total assets 6,017 6,040 7,057 7,414 7,963
Current liabilities
Growth rates (%) Trade payables 914 953 1,089 981 1,062
Revenue (14) 16 16 1 8 Other payables 837 1,105 1,051 963 1,044
Adj net profit (78) 76 (101) 3,383 67 Bank borrowings 200 551 250 250 250
FD Adj EPS (81) 47 (101) 2,679 67 CB 13 13 13 750 0
Others 55 58 35 21 13
Margin & ratios (%) 2,018 2,679 2,437 2,964 2,368
Gross margin 44.5 44.6 45.5 46.6 46.7
OP margin -3.5 -7.9 3.8 5.4 7.5 Non-current liabilities
Adj net profit margin -7.3 -11.1 0.1 4.3 6.6 Bank borrowings 200 298 298 298 298
Effective tax rate 14.0 13.0 -73.2 -26.0 -26.0 CB 646 676 710 0 0
Payout ratio na na na na 30.0 Others 186 140 109 93 82
Deferred tax l iabilities 75 76 76 76 76
1,107 1,191 1,194 467 457
Year ended 31 Dec (Rmb m) FY13 FY14 FY15E FY16E FY17E
Profit before tax (317) (665) 56 590 570 Equity
Share of (profit)/loss of JV and associates (2) (7) (10) (125) (144) Shareholders' equity 2,684 1,952 3,162 3,980 5,135
Depreciation and amortization 193 198 238 247 273 Non-controlling interests 208 218 264 3 3
Net finance cost 150 140 137 134 72 2,892 2,169 3,426 3,982 5,138
Others (608) (14) 7 (236) 17
Change of working capital 566 (1) 94 (89) (39) Total liabilities & equity 6,017 6,040 7,057 7,414 7,963
Tax paid 4 (46) (97) (102) (118)
Operating cash flow (14) (394) 425 419 630
Year ended 31 Dec (Rmb m) FY13 FY14 FY15E FY16E FY17E
Capex (286) (327) (420) (420) (420) Current ratio 2.0 1.5 2.0 1.5 2.0
Interest received 9 6 26 9 9 Quick ratio 1.5 1.0 1.5 1.1 1.6
Others 58 (13) 0 25 0
Investing cash flow (219) (334) (394) (386) (411) A/C receivable turnover days 89 71 60 59 56
A/C payable turnover days 104 84 88 89 81
Change of borrowings (1,045) 602 (301) 0 0 Inventory turnover days 104 109 106 96 87
Interest paid (97) (100) (106) (101) (41)
Dividend paid (24) (28) 0 0 0 Asset turnover 1.0 1.1 1.1 1.1 1.1
Proceeds from shares/securities issuance 1,443 3 1,207 0 0 Total assets/total equity 2.1 2.8 2.1 1.9 1.5
Others 14 (3) 0 0 0 Net gearing ratio net cash 23% net cash net cash net cash
Financing cash flow 292 475 799 (101) (41)
ROE (%) -19.8 -32.2 0.4 9.6 12.5
Net change of cash flow 59 (254) 830 (67) 179 ROA (%) -7.1 -12.4 0.1 4.7 7.4
Forex effect (20) 4 0 0 0
Income Statement Balance Sheet
Cash Flow Statement
Financial Ratios

Dec 24, 2015
13
Sector report
Football business development Anta recently launched three types of adult football boots (tag
price range Rmb239-399/per pair) and four types of children football boots (tag price range Rmb159-239/per pair) on a trial basis at its self-operated online flagship store. Market response has been satisfactory as several size numbers have been sold out. We think school students are the main customers of football boots because of China’s ambitious school football development plan, which targets to have 20,000 schools with strengths in football by 2020. Anta has formed a strategic partnership with the Jiangsu Province Administration of Sports to establish a Jiangsu Youth Soccer League, which is intended to host more than 200,000 league matches covering 1,000 elementary schools, junior and senior high schools. We think this is a feasible strategy to effectively promote Anta’s football products to its target customers. Anta hopes to replicate the Jiangsu model to other provinces and cities, and it targets to sell 1m pairs of football boots in FY16. Potential M&A: The company is proactively seeking to add international brands to implement its
multi-brand strategy. It is rumored that Anta has acquired a value-for-money outdoor brand Sprandi for a consideration in tens of millions of US dollars. Established in 1995, Sprandi distributes outdoor and lifestyle sportswear throughout Russia, Belorussia, Kazakhstan and Poland. In 2008, Sprandi was among the top five sports brands in Russia with retail revenue over US$100m. There is also rumor that Anta is preparing to acquire Descente (8114 JP), a well-known professional winter sports gear brand. Sitting on a net cash balance of Rmb5.6bn in 1H15, Anta could comfortably finance the acquisition of Sprandi. We think external financing will be needed if Anta is to acquire Descente, which has a market cap of JPY109.6bn. We think Anta might acquire Descente’s Greater China business. On Dec 8, the Deputy Head of the General Administration of Sport of China indicated that the agency is formulating development plans for outdoor and winter sports. Positives: We think Anta is well positioned to capture the growth
opportunities in these two types of sports through M&A. Sprandi’s distribution network and international market experience could help Anta grow its own-brand sales overseas. Risk:
Uncertainties surrounding the execution of the Sprandi brand in the China market. Recent updates (1) Star Wars products: Anta has obtained the license right to sell Star Wars
causal wear in China. The film “Star Wars: The Force Awakens” is expected to be released in China on 9 Jan 2016; (2) Launch of Klay Thompson’s signature basketball shoe “KT1”: The shoes will be available online and offline at Anta stores in China and The Champs stores in the San Francisco Bay Area. This is the first time for Anta to sell its signature basketball shoes in the US.
Figure 17: Key assumptions
Sources: Company data, GF Securities (HK) estimates
(Rmb m) FY13 FY14 FY15E FY16E FY17E
Total revenue 7,281 8,923 10,943 13,055 15,128
growth % -4.5% 22.5% 22.6% 19.3% 15.9%
- Anta products 5,823 6,464 7,238 8,112 9,067
growth % -14.5% 11.0% 12.0% 12.1% 11.8%
- Other products 1,458 2,459 3,705 4,942 6,061
growth % 79.0% 68.6% 50.7% 33.4% 22.6%
-- FILA 692 1,223 1,898 2,541 3,102
growth % 76.8% 55.2% 33.9% 22.1%
-- Kids 451 680 951 1,222 1,493
growth % 50.5% 40.0% 28.4% 22.2%
-- E-commerce 255 459 734 1,028 1,284
growth % 80.0% 60.0% 40.0% 25.0%
-- Others 60 97 122 152 182
growth % 62.2% 25.0% 25.0% 20.0%
Gross profit 3,039 4,027 5,115 6,201 7,247
Gross margin 41.7% 45.1% 46.7% 47.5% 47.9%
- Anta products 41.2% 43.6% 43.8% 44.2% 44.5%
- Other products 44.2% 48.9% 52.1% 52.9% 53.0%
Selling & distribution expenses ratio 16.5% 19.0% 21.0% 22.0% 22.3%
Administrative expenses ratio 5.2% 4.4% 4.2% 4.1% 4.0%
Operating profit margin 21.5% 22.6% 22.9% 22.8% 23.0%
Effective tax rate 24.1% 22.7% 23.3% 23.5% 23.7%
Net profit 1,315 1,700 1,999 2,353 2,731
growth % -3.2% 29.3% 17.6% 17.7% 16.1%
Net profit margin 18.1% 19.1% 18.3% 18.0% 18.1%
Payout ratio 71.7% 71.0% 71.0% 71.0% 71.0%

Dec 24, 2015
14
Sector report
Figure 18: Financial statements
Sources: Company data, GF Securities (HK) estimates
Peak Sport (1968 HK, Buy) Maintain Buy and raise TP to HK$2.60 The recent signing of LA Lakers’ Lou Williams fulfilled
management’s promise to bring in quality NBA players after the expiry of its NBA China sponsorship. So far Peak has endorsed NBA players from three teams popular among Chinese fans. We think this could help promote Peak’s brand. Going forward, Peak will continue to focus on its two key product categories – running and basketball. We fine tune our FY15/16/17 net profit estimates by -2%/0%/0% to reflect exchange loss in FY15 and revised sales assumptions. We raise our TP from HK$2.41 to HK$2.60, based on 12.7x FY16E P/E (at +1sd). The stock offers a 6% yield and is trading at an undemanding 2.4x ex-net cash FY15E P/E.
Year ended 31 Dec (Rmb m) FY13 FY14 FY15E FY16E FY17E Year ended 31 Dec (Rmb m) FY13 FY14 FY15E FY16E FY17E
Revenue 7,281 8,923 10,943 13,055 15,128 Fixed assets
Cost of sales (4,242) (4,896) (5,828) (6,854) (7,881) PPE 935 1,068 1,158 1,241 1,317
Gross profit 3,039 4,027 5,115 6,201 7,247 Lease prepayments 149 163 159 154 149
Prepayment for acquisition of land use rights 152 147 147 147 147
Other income 110 97 166 181 206 Intangible assets 507 489 463 436 409
Other net (loss)/income (8) (11) (11) (11) (11) Other financial assets 39 20 20 20 20
Selling & distribution expenses (1,199) (1,697) (2,302) (2,872) (3,374) Deferred tax assets 149 149 149 149 149
Administration expenses (376) (397) (460) (532) (606) 1,931 2,037 2,095 2,147 2,192
Operating profit 1,566 2,019 2,508 2,978 3,474
Current assets
Net finance cost 187 224 157 174 193 Inventories 689 867 1,001 1,154 1,327
Profit before tax 1,753 2,243 2,665 3,152 3,666 A/C receivables 852 876 1,042 1,205 1,355
Income tax expense (423) (510) (621) (741) (869) Prepayments 1,081 825 982 1,155 1,328
Non-controlling interests (15) (32) (45) (58) (67) Other financial assets 510 535 350 350 350
Net profit 1,315 1,700 1,999 2,353 2,731 Plegded bank deposits 215 210 210 210 210
EPS (RMB) 0.53 0.68 0.80 0.94 1.09Fixed deposits held at banks with maturity over
3 months495 1,100 1,700 2,500 3,300
Cash and cash equivalents 4,344 4,934 4,741 4,610 4,595
Growth rates (%) 8,187 9,347 10,026 11,184 12,465
Revenue (4) 23 23 19 16
Net profit (3) 29 18 18 16 Total assets 10,118 11,384 12,121 13,332 14,657
EPS (3) 29 17 18 16
Current liabilities
Margin & ratios (%) A/C payables 867 582 693 815 937
Gross margin 41.7 45.1 46.7 47.5 47.9 Other payables 1,023 1,072 1,212 1,355 1,480
OP margin 21.5 22.6 22.9 22.8 23.0 Bank borrowings 490 1,348 1,000 1,000 1,000
Net margin 18.1 19.1 18.3 18.0 18.1 Amounts due to related parties 7 6 6 6 6
Effective tax rate 24.1 22.7 23.3 23.5 23.7 Tax payables 187 176 248 296 348
Payout ratio 71.7 71.0 71.0 71.0 71.0 2,574 3,185 3,160 3,472 3,770
Non-current liabilities
Year ended 31 Dec (Rmb m) FY13 FY14 FY15E FY16E FY17E Long-term payable to non-controlling interests 37 36 36 36 36
Deferred tax l iabilities 159 158 158 158 158
Profit before tax 1,753 2,243 2,665 3,152 3,666 195 194 194 194 194
Depreciation and amortization 130 159 191 198 205
Net finance cost (175) (229) (157) (174) (193) Equity
(Reversal of)/provision for doubtful debts 26 (46) 10 0 0 Shareholders' equity 7,154 7,795 8,513 9,353 10,314
Write-down/(reversal write-down) of
inventories8 (59) (15) 0 0 Non-controlling interests 195 209 255 312 379
Others (32) 3 0 0 0 7,349 8,005 8,767 9,666 10,693
Due to related parties 4 (1) 0 0 0
Change of working capital (425) (68) (206) (225) (248) Total liabilities & equity 10,118 11,384 12,121 13,332 14,657
Interest received 206 205 214 198 218
Tax paid (367) (522) (566) (681) (805)
Operating cash flow 1,128 1,686 2,137 2,468 2,843 Year ended 31 Dec FY13 FY14 FY15E FY16E FY17E
Capex (179) (263) (250) (250) (250) Current ratio 3.2 2.9 3.2 3.2 3.3
Acquisition of subsidiaries (15) 0 0 0 0 Quick ratio 2.9 2.7 2.9 2.9 3.0
Disposals 7 4 0 0 0 Inventory turnover days 59 58 59 57 57
Others 0 0 0 0 0 A/C payable turnover days 65 54 40 40 41
Change of other financial investments 312 (6) 185 0 0 A/C receivable turnover days 38 35 32 31 31
Change in pledged deposit 9 5 0 0 0
Change in time deposit with maturity over 3M 485 (605) (600) (800) (800) Asset turnover 0.7 0.8 0.9 1.0 1.0
Investing cash flow 620 (865) (665) (1,050) (1,050) Total assets/total equity 1.4 1.4 1.4 1.4 1.4
Net cash (RMBm) 5,074 5,431 6,001 6,670 7,455
Change of borrowings (528) 858 (348) 0 0
Others (5) (13) (4) (4) (4) ROE (%) 18.9 22.7 24.5 26.3 27.8
Dividend paid (878) (1,090) (1,313) (1,545) (1,805) ROA (%) 13.0 15.8 17.0 18.5 19.5
Share issue 4 6 0 0 0
Financing cash flow (1,408) (238) (1,665) (1,549) (1,808)
Net change of cash flow 341 583 (193) (131) (15)
Income statement Balance sheet
Cash flow statement (RMBm)
Financial ratios

Dec 24, 2015
15
Sector report
Signing of LA Lakers’ Lou Williams The company signed with Los Angeles Lakers’ Lou
Williams, winner of the NBA’s Sixth Man of the Year Award in 2014/15, as an endorsed NBA player in early Dec. According to a recent survey conducted by Nielsen, LA Lakers is the second most favorite NBA team in China. So far Peak has endorsed NBA players in three popular teams (Houston Rockets, San Antonio Spurs and LA Lakers), which could lead to good exposure of Peak’s brand to Chinese basketball lovers. According to a recent survey by Nielsen, NBA is the most watched basketball competition in China (by 56% of respondents), while 34% of respondents watch the CBA. The signing fulfilled management’s promise of bringing in star players after the expiry of its NBA China sponsorship. We think Peak will continue to invest in quality NBA players to enhance its player endorsement list. Impact of Rmb depreciation The company plans to repay Rmb400m worth of foreign currency
debt in 2HFY15 with the proceeds from its share placement. Given that around 20% of its trade receivables are denominated in US dollars (based on 20% of revenue coming from overseas sales), we believe its exposure to foreign debt stands at around Rmb500m. Based on 4% YTD depreciation of the Rmb against the US dollar, we estimate potential exchange loss of around Rmb20m in FY15, equivalent to 5% of FY15E net profit. China and overseas market outlook We think the US dollar rally in Oct-Nov and the terrorist
attack in Paris could negatively affect overseas sales, especially sales in the European market. We revise down our estimates for FY15/16 overseas market sales growth from +5%/+10% to -2%/+5%. That said, we remain optimistic on China’s functional sportswear segment. We think Peak’s sales will benefit from the expanding running population and the enhanced quality of its endorsed NBA players (running and basketball combined contributed 60%+ of footwear sales volume). We therefore lift our estimates for FY15/16 SSSG from 6% to 7%.
Figure 19: Key assumptions
Sources: Company data, GF Securities (HK) estimates
(Rmb m) FY13 FY14 FY15E FY16E FY17E
Total revenue 2,613 2,841 3,064 3,330 3,627
growth % -10.0% 8.7% 7.8% 8.7% 8.9%
China market 2,080 2,189 2,424 2,659 2,888
growth % -17.3% 5.2% 10.7% 9.7% 8.7%
Overseas market 533 653 640 672 739
growth % 37.2% 22.5% -2.0% 5.0% 10.0%
Gross profit 927 1,079 1,158 1,262 1,378
Gross margin 35.5% 38.0% 37.8% 37.9% 38.0%
Selling & distribution expenses ratio 12.8% 12.6% 12.1% 12.6% 12.7%
Administrative expenses ratio 9.6% 10.3% 8.5% 8.4% 8.3%
Operating profit margin 13.8% 15.9% 17.8% 17.5% 17.6%
Effective tax rate 37.4% 34.4% 33.8% 33.5% 33.5%
Net profit 244 321 373 414 448
growth % -21.3% 31.3% 16.3% 11.0% 8.1%
Net profit margin 9.3% 11.3% 12.2% 12.4% 12.3%
Payout ratio 108.8% 62.3% 70.0% 60.0% 60.0%

Dec 24, 2015
16
Sector report
Figure 20: Financial statements
Sources: Company data, GF Securities (HK) estimates
Year end Dec 31 (Rmb m) FY13 FY14 FY15E FY16E FY17E Year end Dec 31 (Rmb m) FY13 FY14 FY15E FY16E FY17E
Revenue 2,613 2,841 3,064 3,330 3,627 Fixed assets
Cost of sales (1,686) (1,762) (1,906) (2,068) (2,249) PPE 533 506 487 469 453
Gross profit 927 1,079 1,158 1,262 1,378 Lease prepayments 204 176 172 168 164
Deposits for acquisition of land use rights 37 37 37 37 37
Other income 19 23 19 20 22 Intangible assets 23 25 27 28 30
Selling & distribution expenses (334) (359) (372) (420) (461) Deferred tax assets 27 45 45 45 45
Administration expenses (252) (291) (260) (280) (302) 824 790 768 747 729
Operating profit 360 451 545 582 637
Current assets
Net finance cost 30 37 38 41 37 Inventories 366 346 377 418 454
Profit before tax 390 489 563 623 673 A/C receivables 907 868 889 967 1,032
Income tax expense (146) (168) (190) (209) (226) Prepayments 71 118 127 139 151
Net profit 244 321 373 414 448 Pledged deposit 348 502 407 554 713
EPS (Rmb) 0.12 0.15 0.17 0.17 0.19 Term deposit 1,000 1,400 1,800 2,100 2,400
Cash and cash equivalents 1,933 1,850 2,002 1,953 1,961
Growth rates (%) 4,624 5,084 5,603 6,130 6,711
Revenue (10) 9 8 9 9
Net profit (21) 31 16 11 8 Total assets 5,448 5,874 6,371 6,878 7,439
EPS (21) 31 9 4 8
Current liabilities
Margin & ratios (%) A/C payables 242 154 200 217 236
Gross margin 35.5 38.0 37.8 37.9 38.0 Other payables 174 265 244 265 288
OP margin 13.8 15.9 17.8 17.5 17.6 Amount due to a related party 0 0 0 0 0
Net margin 9.3 11.3 12.2 12.4 12.3 Bank borrowings 530 702 529 776 998
Effective tax rate 37.4 34.4 33.8 33.5 33.5 Current tax liabilities 65 68 78 86 92
Payout ratio 108.8 62.3 70.0 60.0 60.0 1,010 1,190 1,050 1,343 1,614
Non-current liabilities
Year end Dec 31 (Rmb m) FY13 FY14 FY15E FY16E FY17E Bank borrowings 237 350 285 333 428
Deferred tax liabilities 80 87 87 87 87
Profit before tax 390 489 563 623 673 317 437 372 420 515
Depreciation and amortization 47 50 50 48 46
Net finance cost (30) (37) (38) (41) (37) Equity
(Reversal of)/provision for impairment of receivables 15 0 0 0 0 Shareholders' equity 4,122 4,247 4,948 5,114 5,310
Write-down/(reversal write-down) of inventories (3) 0 0 0 0
Others 6 4 5 5 5 Total liabilities & equity 5,448 5,874 6,371 6,878 7,439
Change of working capital 167 55 (38) (91) (72)
Tax paid (85) (176) (179) (200) (217)
Operating cash flow 507 384 363 344 399 Year end Dec 31 FY13 FY14 FY15E FY16E FY17E
Capex (75) (25) (27) (27) (27) Current ratio 4.6 4.3 5.3 4.6 4.2
Interest received 42 45 60 64 68 Quick ratio 4.2 4.0 5.0 4.3 3.9
(Increase) in pledged deposit (47) (155) 96 (148) (158)
(Increase) in time deposit with mat. >3 months (775) (400) (400) (300) (300) A/C receivable turnover days 135 114 105 102 101
Others 0 1 0 0 0 A/C payable turnover days 45 41 34 37 37
Investing cash flow (855) (534) (272) (411) (418) Inventory turnover days 81 74 69 70 71
Change of borrowings 270 286 (239) 296 316 Asset turnover 0.5 0.5 0.5 0.5 0.5
Interest paid (13) 0 (21) (23) (31) Total assets/total equity 1.3 1.4 1.3 1.3 1.4
Dividend paid (217) (200) (230) (255) (259) Net cash (Rmb m) 2,514 2,699 3,395 3,498 3,648
Share issue 0 1 553 0 0
Others (1) (20) 0 0 0 ROE (%) 6.0 7.7 8.1 8.2 8.6
Financing cash flow 38 67 62 18 27 ROA (%) 4.7 5.7 6.1 6.3 6.3
Net change of cash flow (310) (83) 152 (49) 8
Forex changes 6 (0) 0 0 0
Income statement Balance sheet
Cash flow statement
Financial ratios

Dec 24, 2015
17
Sector report
Rating definitions Benchmark: Hong Kong Hang Seng Index Time horizon: 12 months
Company ratings
Buy Stock expected to outperform benchmark by more than 15%
Accumulate Stock expected to outperform benchmark by more than 5% but not more than 15%
Hold Expected stock relative performance ranges between -5% and 5%
Underperform Stock expected to underperform benchmark by more than 5%
Sector ratings
Positive Sector expected to outperform benchmark by more than 10%
Neutral Expected sector relative performance ranges between -10% and 10%
Cautious Sector expected to underperform benchmark by more than 10%
Analyst Certification The research analyst(s) primarily responsible for the content of this research report, in whole or in part, certifies that with respect to the company or relevant securities that the analyst(s) covered in this report: (1) all of the views expressed accurately reflect his or her personal views on the company or relevant securities mentioned herein; and (2) no part of his or her remuneration was, is, or will be, directly or indirectly, in connection with his or her specific recommendations or views expressed in this research report.
Disclosure of Interests (1) The proprietary trading division of GF Securities (Hong Kong) Brokerage Limited (“GF Securities (Hong Kong)”) and/or its affiliated or associated companies do not hold any shares of the securities mentioned in this research report. (2) GF Securities (Hong Kong) and/or its affiliated or associated companies did not have any investment banking relationships with the companies mentioned in this research report in the past 12 months. (3) All of the views expressed in this research report accurately reflect the independent views of the analyst(s). Neither the analyst(s) preparing this report nor his/her associate(s) serves as an officer of the companies mentioned in this report, or has any financial interests in or holds any shares of the securities mentioned in this report.
Disclaimer This report is prepared by GF Securities (Hong Kong). It is published solely for information purpose and does not constitute an offer to buy or sell any securities or a solicitation of an offer to buy, or a recommendation for investing in, any securities. This research report is intended solely for use by the clients of GF Securities (Hong Kong). The securities mentioned in this research report may not be allowed to be sold in certain jurisdictions. No action has been taken to permit the distribution of this research report to any persons in any jurisdictions that the circulation or distribution of such research report is unlawful. The information contained in this research report has been compiled or arrived at from publically available sources believed to be reliable in good faith, and no representation or warranty, either express or implied, is made by GF Securities (Hong Kong) as to their accuracy and completeness. GF Securities (Hong Kong) accepts no liability for any losses arising from the use of the materials presented in this research report, unless otherwise required by applicable laws or regulations. Please be aware of the fact that investments involve risks and that the prices of securities may fluctuate and therefore returns may vary. Past results do not guarantee future performance. Any recommendations contained in this research report do not have regard to the specific investment objectives, financial situation and the particular needs of any individuals. This report is not to be taken in substitution for the exercise of judgment by the respective recipients of this report. Where necessary, the recipients should obtain professional advice before making investment decisions. GF Securities (Hong Kong) may have issued, and may in the future issue, other communications that are inconsistent with, and reach different conclusions from, the information presented in this research report. The points of view, opinions and analytical methods adopted in this research report are solely expressed by the analyst(s) but not GF Securities (Hong Kong) or its subsidiaries. The information, opinions and forecasts presented in this research report are the current opinions of the analyst(s) as of the date appearing on this material and are subject to changes at any time without notice. The salespersons, dealers or other professionals of GF Securities (Hong Kong) may deliver opposite points of view to their clients and the proprietary trading division with respect to market commentaries and dealing strategies either in writing or verbally. The proprietary trading division of GF Securities (Hong Kong) may have investment decisions which are contrary to the opinions expressed in this research report. GF Securities (Hong Kong) or its affiliates or respective directors, officers, analysts and employees may have rights and interests in the securities mentioned in this research report. The recipients should be aware of relevant disclosures of interests (if any) when reading this report. Copyright © GF Securities (Hong Kong) Brokerage Limited. Without the prior written consent obtained from GF Securities (Hong Kong) Brokerage Limited, any part of the materials contained herein should not (i) in any forms be copied or reproduced or (ii) be re-disseminated. © GF Securities (Hong Kong) Brokerage Limited. All rights reserved. 29-30/F, Li Po Chun Chambers, 189 Des Voeux Road Central, Hong Kong Tel: +852 3719 1111 Fax: +852 2907 6176 Website: http://www.gfgroup.com.hk