sport fish investigations of alaska annual performance report for a
TRANSCRIPT

SPORT FISH INVESTIGATIONS OF ALASKA
Annual Performance Report f o r
Study No. D-I
A Study o f Land use A c t i v i t i e s and t h e i r Re l a t i onsh ip of Spor t
Fish Resources i n Alaska
D-I-A Dennis Hubart t
D-I-B Steven E l i o t t

TABLE OF CONTENTS
STUDY NO. D - I A STUDY OF LAND USE ACTIVITIES AND THEIR RELATIONSHIP TO THE SPORT FISH RESOURCES IN ALASKA
Job No. D-I-A Establishment of Guidelines for Protec t ion of t h e Sport Fish Resources During Land Use A c t i v i t i e s By: Dennis Hubartt
Abstract Background Recommendations
Research Management
Obj ec t ives Techniques Used
S t a t i s t i c a l Design Assessment o f Rearing Salmonids
Methods Equipment
Findings Results
Switzer Creek Jordan Creek Montana Creek Peterson Creek North Hood Bay, unnamed stream Big Bay-Upper Lake I n l e t s Olive Cove (unnamed stream) Luck Lake, Eagle Creek Red Lake I n l e t F l icker Creek Keta River
Discussion L i t e ra tu re Cited
Page
APPENDIX


Volume 20 Study D-I-A
STATE OF ALASKA
Jay S. Hammond, Governor
Annual Performance Report for
ESTABLISHMENT OF GUIDELINES FOR PROTECTION OF THE SPORT FISH
RESOURCES DURING LAND USE ACTIVITIES
Dennis Hubartt
ALASKA DEPARTMENT OF FISH AND GAME RonuZd 0. Skoog, Commissioner
SPORT FISH DIVISION Rupert E. Andrews, Director

Volume 20 Study No. D-I
RESEARCH PROJECT SEGMENT
State: A1 as ka
Project No.: F-9-11
Study NO. : D- I
Job No.: D-I-A
Name: Sport Fish Investigations o f A1 as ka
Study T i t l e : A STUDY OF LAND USE ACTIVITIES AND THEIR RELATIONSHIP TO THE SPORT FISH RESOURCES IN ALASKA
Job T i t l e :
Period Covered: July 1, 1978 to June 30, 1979.
ABSTRACT
Because of t h e increasing interagency need f o r quan t i t a t ive techniques which may be applied t o t h e evaluation of b io log ica l parameters of streams during short-term surveys, p ro jec t personnel have developed and applied a f i e l d technique which provides quan t i t a t ive information about rear ing salmonid f i shes and aquat ic i n s e c t s i n small streams. The f i e l d technique employs t h e systematic placement of ba i t ed minnow t raps i n t h e assessment o f f i s h populations and a c i r c u l a r deplet ion sampler (CDS) i n t h e assessment o f aquat ic insec t s .
Baited minnow t r a p s captured Dolly Varden, SaZveZinus maha (Walbaum), coho salmon, Oncorhynchus kisutch (Walbaum) , cu t th roa t t r o u t , SaZmo cZarki Richardson, s teelhead and rainbow t r o u t , Saho gairdneri Richardson, chinook salmon, Oncorhynchus tshcajytscha (Walbaum), threespine s t ickleback, Gasterosteus acuZeatus Linnaeus, and sculpin, Cottus sp. When s u f f i c i e n t numbers of species of rearing salmonids were captured quantitative measures of t h e following parameters were obtained: (1) mean catch p e r un i t - e f fo r t , (2) species composition, (3) numerical estimates, (4) densi ty est imates, and (5) mean lengths.
Use of the c i r c u l a r deplet ion sampler (CDS) provided measurements of species composition and numerical est imates of aquat ic insec t communities.
The main t h r u s t of the current study was t o t e s t and modify as necessary a s p e c i f i c sampling design f o r the assessment of b io logical parameters which, hopefully, could be incorporated i n some s o r t of standardized survey method

s u i t a b l e f o r interagency use. The f i e l d techniques were used i n eleven d i f f e r e n t watersheds throughout Southeast Alaska, and t h e r e s u l t s were a range o f values f o r each o f t h e parameters measured. The f i e l d technique d id provide useful q u a n t i t a t i v e measurements o f t h e f i v e parameters i n each watershed; but , s ince t h e study s i t e s were se lec ted i n order t o t e s t t h e techniques i n a v a r i e t y o f s i t u a t i o n s , i n t e r p r e t a t i o n of r e s u l t s was l imi ted t o t h e v a l i d i t y and usefulness o f t h e technique and t o poss ib le fu tu re appl ica t ions .
BACKGROUND
From i t s incept ion i n 1970 a s a job e n t i t l e d "Effects of Logging on Dolly Varden" (Reed and Armstrong, 1971) the Land Use Projec t has focused on various problems associa ted with land use a c t i v i t i e s and poss ib le e f f e c t s on stream ecosystems. The 1970 study was designed t o develop techniques f o r t h e determination o f the s t a t u s o f f i s h populations p r i o r t o land use a c t i v i t i e s .
I n i t i a l s t u d i e s included general surveys o f logged streams throughout Southeast Alaska, an extensive l i t e r a t u r e review on t h e subjec t of t h e e f f e c t s o f logging on rear ing f i s h , and a continuation of t h e e f f o r t s t o develop useful methods f o r evaluat ing f i s h populations. This period of s tudy revealed t.hat f u r t h e r work was needed i n two areas: (1) cooperative e f f o r t s need t o be es tabl i shed with o the r agencies involved i n management a c t i v i t i e s a f fec t ing f i s h h a b i t a t (primari ly the U.S. Forest Service) , and ( 2 ) methods need t o be developed t o obta in useful information about populations of rear ing f i s h and aquat ic i n s e c t s so t h a t t h e impacts o f land use a c t i v i t i e s could be assessed (Reed and E l l i o t t , 1972).
In response t o these needs, t h e study was divided i n t o two jobs: "Establish- ment o f Guidelines f o r Protec t ion of Sport Fish Resources During Logging Operations" (Reed and E l l i o t t , 1973) and "Ecology o f Rearing Fish" ( E l l i o t t and Reed, 1973). The f i r s t job focused on t h e need t o work with o the r agencies so t h a t important f i s h h a b i t a t could be i d e n t i f i e d and protec ted during land use a c t i v i t i e s . One important product o f t h i s job was t h e publ ica t ion o f a pamphlet which presented guidel ines f o r protec t ing f i s h h a b i t a t during logging operat ions (U.S. Forest Service, Alaska Department of Fish and Game, and Alaska Department of Natural Resources, 1973:).
The second job developed a s e r i e s of s tud ies concerning t h e ecology o f r ea r ing f i s h i n a logged watershed and emphasized the development o f research techniques which could be used t o evaluate t h e s t a t u s of rear ing f i s h i n small streams i n conjunction with changes i n t h e stream environment. These two jobs continued with s i m i l a r objec t ives from 1973 through 1976.
Throughout the time period from 1974 through 1976 the "Guidelines" job attempted t o i d e n t i f y and p ro tec t spor t f i s h resources by p a r t i c i p a t i n g i n mul t i -d isc ip l inary surveys (MDT's) and in te r -d i sc ip l ina ry surveys (IDT's) conducted by the U.S. Forest Service; conducting post-logging

surveys t o evaluate t h e e f f e c t s of recommendations made during MDT o r IDT surveys; reviewing and commenting on Environmental Analysis Reports (EAR'S), Environmental Impact Statements (EISts) , and land use mangement plans; and conducting short-term surveys i n areas t o be o r being af fec ted by land use a c t i v i t i e s (see Annual Reports: Reed, 1974; Dinneford, 1975; Dinneford, 1976; and Hubartt , 1977).
In t h e f a l l of 1976 t h e U.S. Forest Service began developing a land use management p lan f o r t h e Tongass National Forest which encompasses most of Southeast Alaska. Projec t personnel ac t ive ly p a r t i c i p a t e d i n t h e planning process through an interagency Fisher ies Task Force (FTF). The FTF was assigned t h e t a sk of ident i fy ing, evaluating and p r i o r i t i z i n g f i s h e r i e s resource values i n t h e Tongass National Forest. During t h e process of assembling and evaluating t h e avai lable information about t h e f i s h e r i e s resources i n Southeast Alaska, it became apparent t h a t t h e ex i s t ing information about streams and stream h a b i t a t d id not cover every watershed and was not of a uniform qua l i ty . The s p a r s i t y of information needed f o r bas ic land use management planning is r e f l e c t e d by t h e f a c t t h a t l e s s than 30 percent of t h e streams t h a t had been i d e n t i f i e d by t h e Alaska Department of Fish and Game a s important t o anadmmous f i shes were ra ted by t h e FTF. The r a t i n g system was designed t o evaluate and p r i o r i t i z e t h e following data:
Fish species presence and abundance Available spawning areas S h e l l f i s h species presence and use System morphology and es tua r ine areas Rare o r unique f i s h populations Important spor t f i sh ing areas Areas with c r i t i c a l h a b i t a t Areas of s c i e n t i f i c i n t e r e s t Rehabil i tated o r enhanced areas Areas of exceptional product iv i ty Areas with enhancement p o t e n t i a l Areas with unique management s i t u a t i o n s Streams with b a r r i e r s t o salmon migration Lakes important t o anadromous f i s h Dolly Varden overwintering lakes Important s teelhead, cu t th roa t , and rainbow t r o u t areas
Even i n those systems t h a t were ra ted , the da ta was frequently incomplete (see Fisher ies Task Force Working Report, 1978). The r e a l i z a t i o n of the need f o r bas ic information about stream environments was a major f a c t o r i n shaping the current study (Hubartt, 1978).
During t h e course of the Starr igavan Study ( E l l i o t t , 1978), techniques f o r assessing t h e s t a t u s of populations of rearing salmonids i n small streams had been devised. One problem with these techniques was t h a t although they had worked well during the continuing study a t the Starr igavan watershed near S i tka , they hadn' t been t e s t e d i n the varying conditions associated with streams throughout Southeast Alaska. Because of t h e

press ing need fo:r the development of short- term stream survey techniques t h a t would provide quan t i f i ab le information about f i s h communities and stream environments, and t h a t could be used by various land managing agencies i n the decis ion making process; Sport Fish Land Use Pro jec t personnel decided t o apply the techniques and s k i l l s t h a t had been developed during t h e Star r igavan study t o severa l areas i n Southeast Alaska t o determine the f e a s i b i l i t y of obtaining r e l i a b l e information about f i s h and aquat ic i n s e c t s during short-term surveys.
In order t o t e s t t h e techniques f o r assess ing f i s h populations i n a wide v a r i e t y o f s i t u a t i o n s , a reas were se lec ted throughout Southeast Alaska which included anadromous and non-anadromous streams, s i n g l e and mul t ip le species streams, lake and non-lake systems, streams i n r u r a l and urban areas , and logged and unlogged streams. The areas s tudied a r e shown i n Figure 1. A l l species discussed i n t h i s r epor t a r e l i s t e d i n Table 1.
Research
1. A continued e f f o r t should be made t o i d e n t i f y waters important t o the s p o r t f i s h resources and provide recommendations t o p r o t e c t t h i s resource during land use a c t i v i t i e s . Cooperation with t h e U.S. Forest Serv.ice i s required and should be accomplished by:
a . Providing resource information during t h e land use a l l o c a t i o n process .
b. Monito.ring t h e a l l o c a t i o n and implementation phases of t h e planning process t o ensure the i d e n t i f i c a t i o n and p ro tec t ion of important s p o r t f i s h resources.
c. P a r t i c i p a t i n g i n interagency e f f o r t s t o improve techniques f o r obta in ing resource information necessary f o r proper land use management.
d. P a r t i c i p a t i n g i n f i e l d surveys as required t o determine rec rea t iona l p o t e n t i a l , access t o t h e spor t f i she ry , d i s t r i b u t i o n and abundance o f juvenile f i s h e s , c r i t i c a l h a b i t a t , and environmentally s e n s i t i v e areas.
2 . The e f f o r t t o develop and r e f i n e f i e l d techniques f o r the q u a n t i t a t i v e evaluat ion of populations of rear ing salmonids and aquat ic i n s e c t s should be continued by:
a. Determining i f catch pe r u n i t - e f f o r t da ta from minnow t r a p s can be used a s e i t h e r an index o r an est imator of the numbers of rear ing salmonids i n small streams.
b. Determining i f d i f ferences i n aquat ic product iv i ty e x i s t between streams i n logged and unlogged watersheds.
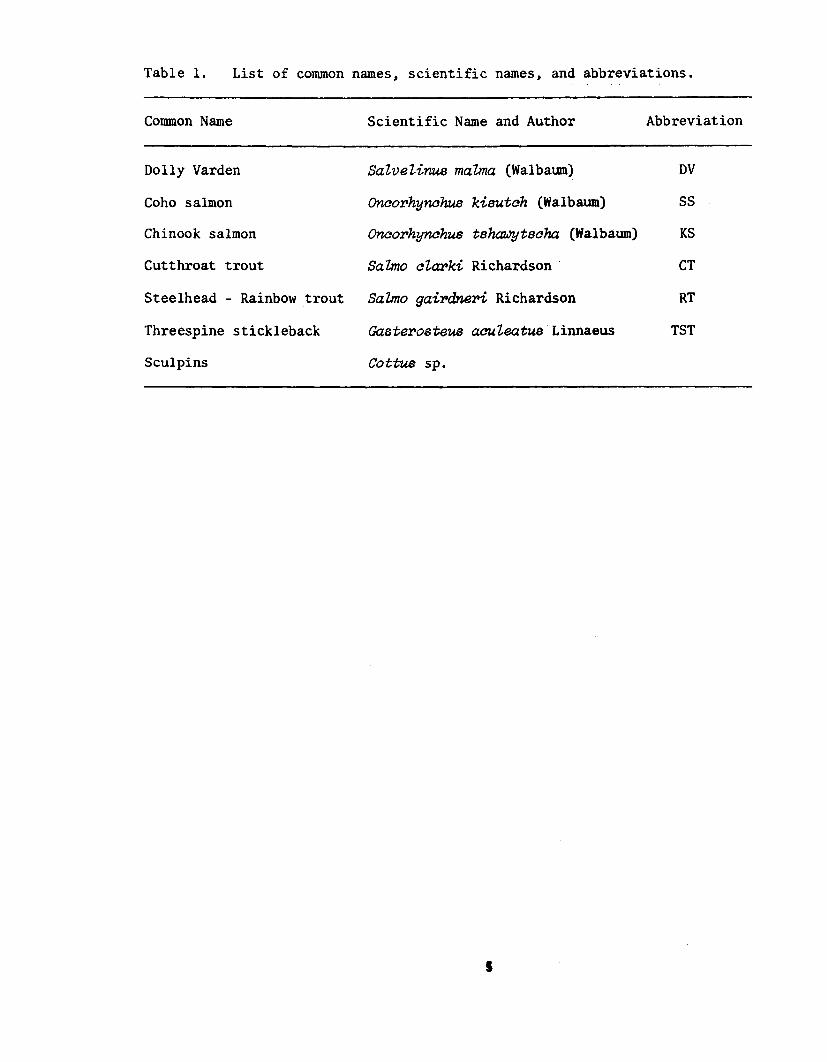
Table 1. L i s t of common names, sc ient i f ic names, and abbreviations. - - -- - --
Common Name Scienti f ic Name and Author Abbreviation
Dolly Varden
Coho salmon
Chinook salmon
Cutthroat trout
Steelhead - Rainbow trout
Threespine stickleback
Sculpins
. - - - - - -- -
SaZveZinus maha (Walbaum)
Oncorhynchus kisutch (Walbaum) SS
Oncorhynchus t s h t s c h a (Walbaum) KS
Saho clarki Richardson CT
SaZmo gairdneri Richardson RT
Casterosteus acuZecltus Linnaeus TST
Cottus sp.

N HOOD BAY
BIG BAY LAKE
j
KETA R I V E R
Figure 1. Locat ion o f Study S i t e s , 1978.

c. Determining i f d i f ferences i n overwinter survival e x i s t between streams i n logged and unlogged watersheds.
d. Determining t h e numbers of rear ing Dolly Varden i n Montana Creek.
3. Evaluation of the ef fec t iveness of recommendations and guidelines made ava i l ab le t o land managing agencies should be continued.
Management
1. Because of t h e continuing uncer ta in t i e s regarding t h e designations of lands i n Southeast Alaska, p ro jec t personnel should continue t o monitor such changes and provide re levant information t o a rea b io log i s t s .
2. Efforts should be continued t o develop an e f f i c i e n t d a t a f i l i n g and r e t r i e v a l system f o r spor t f i s h resources information i n cooperation with t h e Sport Fish Catalog and Inventory Projec t Leader, o t h e r d iv i s ions within t h e Department o f Fish and Game, and with Federal agencies.
3. Techniques which have been developed f o r assessing t h e s t a t u s o f populations of rear ing salmonids and aquat ic i n s e c t s should be applied t o s p e c i f i c management problems a s necessary, and should be cont inual ly t e s ted , improved, and modified t o f i t management needs.
OBJECTIVES
1. To designate waters important t o t h e spor t f i s h resources and make recommendations t o p ro tec t t h i s resource during land use a c t i v i t i e s .
2. To determine t h e ef fec t iveness of recommendations and guidelines made avai lable t o t h e land managing agencies.
3. To advise industry and t h e publ ic of t h e importance of f i s h h a b i t a t and the methods needed t o p ro tec t t h i s h a b i t a t during land use a c t i v i t i e s .
TECHNIQUES USED
S t a t i s t i c a l Design
Assessment o f Rearing Salmonids:
The sampling techniques used during t h e current study were developed t o provide quan t i t a t ive measurements of f i v e parameters t h a t a r e r e l a t e d t o populations o f rear ing salmonids i n small streams. These parameters a r e a s follows: (1) mean catch per un i t - e f fo r t , (2) species composition, (3) numerical

es t imates , (4) dens i ty es t imates , and (5) mean lengths. The mean catch pe r u n i t - e f f o r t , numerical est imates, and dens i ty est imates a r e r e l a t e d t o t h e abundance of rear ing f i s h . Species composition r e f l e c t s t h e instream community s t r u c t u r e , and mean lengths may r e f l e c t r e l a t ionsh ips between a populat ion of rear ing f i s h and the q u a l i t y o f the stream environment.
These parameters a r e quan t i f i ab le i n conjunction with various c o l l e c t i n g techniques. However, s tud ies a t Starr igavan Creek near S i tka , Alaska (see E l l i o t t , 1978) have indica ted t h a t the use o f minnow t r a p s ba i t ed with preserved salmon eggs is the most e f f e c t i v e and l e a s t detr imental method current ly ava i l ab le f o r quantifying a l l of these parameters i n small streams i n Southeast Alaska. The following s t a t i s t i c a l design has been employed t o quant i fy these parameters through t h e use o f ba i t ed minnow t r a p s .
Mean Catch Per Llnit-Effort. Since most previous s t a t i s t i c a l analyses o f catch p e r u n i t - e f f o r t da ta i n f i s h e r i e s research have been conducted t o evaluate removal-type f i s h e r i e s (see Ricker, 1975), d e t a i l e d s t a t i s t i c a l analyses o f catch pe r u n i t - e f f o r t da ta based on shor t term sampling of closed populations with replacement a r e unavailable i n the l i t e r a t u r e . One aspect o f catch per u n i t - e f f o r t t h a t is s p e c i f i c a l l y r e l a t e d t o t h i s study i s v a r i a b i l i t y of individual u n i t s of gear ( i . e . minnow t r a p s ) versus t h e number and d i s t r i b u t i o n o f gear u n i t s necessary t o minimize t h i s v a r i a b i l i t y . In order t o evaluate t h i s r e l a t ionsh ip t h e number and d i s t r i b u t i o n of gear u n i t s have been standardized as much as poss ib le and the followirlg formula has been used t o express the mean catch per u n i t - e f f o r t i n varying f i e l d s i t u a t i o n s :
5 - C CPUE = Ti
Where :
Mi := t o t a l number of salmonids captured by the i t h - t r a p
Ti := t o t a l time ( i n minutes) t h a t the i t h - t r a p was i n the water
n := t o t a l number of samples ( i . e . t r aps )
CPUE = mean catch per u n i t - e f f o r t (e.g. 1 fish/min)
This formula allows t h e ca lcu la t ion of the variance of CPUE r e su l t ing from t h e v a r i a b i l i t y of catch per u n i t - e f f o r t o f each u n i t o f gear .
Species Composition. Previous s tud ies ( E l l i o t t and Reed, 1973) have shown t h a t species composition of rearing salmonid communities a r e s i m i l a r t o the species composition o f salmonids captured i n minnow t raps . Although the re l a t ionsh ips between species composition and t h e o the r parameters considered i n t h i s study have not been quan t i t a t ive ly

evaluated; t h i s s t a t i s t i c , derived from minnow t r a p catches, i s recorded i n a n t i c i p a t i o n of fu tu re evaluation and a s a q u a l i t a t i v e index o f t h e instream community s t ruc tu re . This s t a t i s t i c i s expressed i n terms of t h e percent of each species present i n the t o t a l catch from one o r more sampling periods.
Numercial Estimates. The adjusted Peterson est imate a s described by Ricker (1975) has been used t o est imate the numbers of rear ing salmonids of a p a r t i c u l a r species i n sec t ions of small streams i n southeast Alaska. This est imation procedure requires two sampling periods. During the f i r s t period rear ing f i s h a r e captured, enumerated, marked, and released. During t h e second period t h e f i s h a r e captured, enumerated, examined f o r marks, and released. The following formula may then be used t o obta in an est imate of t h e t o t a l number f i s h i n t h e a rea sampled:
Where :
M = t o t a l number of marked f i s h released during t h e i n i t i a l capture period
C = t o t a l number of f i s h captured ( i . e . marked + unmarked) during the recapture period
R = t o t a l number of marked f i s h captured during t h e recapture period
N* = estimated t o t a l number of f i s h i n t h e area sampled (e.g. 500 Dolly Varden i n a 1,000 f t sec t ion of a stream)
Several assumptions must be met before t h i s est imate can be considered accurate. These assumptions as well as the attachment o f confidence i n t e r v a l s t o t h i s estimate a re discussed i n reference t o t h e current s tudy i n a l a t e r sec t ion of t h i s repor t .
Density Estimates. Once a reasonable est imate of t h e numbers of rear ing f i s h i n a sec t ion of a stream has been obtained it may be des i rab le t o compare t h i s est imate with a s imi la r est imate from another stream. In order t o make such comparisons the est imates must be r e l a t e d t o some u n i t o f measurement common t o both streams. In the present study t h e surface area of the sec t ion of the stream examined was used. Because of logist i 'cal problems and varying time const ra in ts two methods were used t o obta in approximate surface areas of t h e stream sect ions studied.
The simplest and l e a s t accurate method was t o pace o f f the length and severa l widths of the stream sect ion under considerat ion and multiply t h e length times the average width. Density est imates using t h i s approxi- mation o f t h e surface area a r e re fe r red t o as "rough density estimates" i n the remainder of t h i s repor t . The second method used a tape measure

t o measure 15.24 in (50 f t ) i n t e r v a l s p a r a l l e l t o the streambanks and t o measure t h e width of t h e stream a t each i n t e r v a l . From these measurements a s e r i e s of t rapezoids can be obtained and t h e sum of t h e i r a reas w i l l g ive an approximation of t h e surface area . The "density estimates" presented i n t h i s repor t include t h e use o f t h i s method t o est imate t h e surface a rea o f the stream sec t ion under considerat ion. The rough dens i ty es t imates and dens i ty est imates recorded i n t h i s r epor t a r e expressed as numbers o f f i s h ( i . e . N* as defined above) p e r u n i t a r e a ( i . e . sur face a rea a s determined by one of t h e two methods described above).
Mean Lengths. This s t a t i s t i c i s derived from fork length measurements t o t h e nea res t mi l l imeter of f i s h captured i n minnow t raps during a s i n g l e t rapping period.
Assessment o f Aquatic Insects :
Quant i ta t ive methods f o r assess ing communities o f aquat ic i n s e c t s were s tud ied by Carle (1976) and a s t a t i s t i c a l design was described which involved deple t ion o r removal sampling techniques and a s p e c i a l l y designed sampling device termed a c i r c u l a r deple t ion sampler (CDS). The sampling techniques involved placing t h e CDS i n t o the subs t ra t e , co l l ec t ing i n s e c t s by a g i t a t i n g the s u b s t r a t e f o r one minute, removing the co l l ec ted specimens from the CDS, and then repeating the process u n t i l t h ree samples had been col lec ted . Car le and Strub (1978) d iscuss the necessary assumptions and the theory leading t o t h e development o f maximum l ike l ihood est imation o f population s i z e s from removal da ta . Provided t h e assumptions a r e met t h e following inequa l i ty may be used t o est imate t h e t o t a l number o f individual organisms within t h e a rea encompassed by the CDS where th ree removal periods a r e used:
Where : A
N = t he estimated number of individuals i n t h e sample area
K = 3 T = C Ci = t he sum of the individuals captured during a l l t h ree
i = 1 removal periods
Ci = the number o f individuals co l l ec ted during t h e i t h removal - period
This inequal i ty may ke solved i t e r a t i v e l y with a desk ca lcu la to r o r a computer by l e t t i n g N = T, T + 1, T + 2 . . . and continuing t o i t e r a t e u n t i l t h e inequal i ty i s s a t i s f i e d ( i . e . when the value of the l e f t s i d e of t h e inequa l i ty i s a s c lose t o 0 as poss ib le ) .

Methods
F ie ld work was c a r r i e d out i n t h r e e phases: (1) s i t e se lec t ion , (2) b io log i - c a l assessment, and (3) physical assessment. The primary f a c t o r s a f fec t ing s i t e s e l e c t i o n were t h e a c c e s s i b i l i t y o f the a rea and t h e s i z e o f t h e stream. Because the sampling procedure f o r examining rear ing f i s h had been designed pr imar i ly f o r small streams, a general guidel ine f o r t h e s e l e c t i o n of study s i t e s was t o loca te a sec t ion of t h e stream t h a t averaged 6 m (20 f t ) o r l e s s i n width and 1.2 m (4 f t ) o r l e s s i n depth. Occasionally l imi ted time and/or access problems d i c t a t e d the s e l e c t i o n of l a r g e r stream sec t ions f o r study. When stream sec t ions wi th in t h e preceding s i z e range were located, beach se ines were placed upstream and downstream o f t h e study s i t e t o prevent major movements o f r ea r ing f i s h i n t o o r out of t h e area. This was impract ical f o r l a r g e r stream sec t ions .
Biological assessment cons is ted pr imar i ly o f sampling populations of r ea r ing f i s h , although aquat ic i n s e c t samples were a l s o co l l ec ted i n one area. The sampling procedure f o r rear ing f i s h cons is ted o f an i n i t i a l capture period and a recapture period. During the i n i t i a l capture period, minnow t r a p s ba i t ed with preserved salmon eggs were placed a t 15 m (50 f t ) i n t e r v a l s u n t i l 18-20 t r a p s had been s e t . Se t times were recorded. Af te r a minimum time period of two hours, the t r a p s were pulled. Times were recorded and captured f i s h were t r ans fe r red t o a bucket containing stream water and a small amount of MS 222 ( t r i c a i n e methane-sulfonate). Fish were then i d e n t i f i e d , enumerated, measured, marked with a caudal c l i p ( i . e . a small notch was made i n e i t h e r t h e upper o r lower lobe of t h e caudal f i n ) , and then t r ans fe r red t o another bucket containing f resh stream water and allowed t o recover. When a l l t h e f i s h had recovered, they were returned t o the stream a t the point of capture. This process was repeated u n t i l a l l t he t r a p s were checked.
The study sec t ion was l e f t i n an undisturbed s t a t e f o r a t l e a s t 24 hours, and then t r a p s were r e s e t i n the same manner and i n t h e same locat ions a s during the i n i t i a l capture period. Procedures during t h e recapture period were the same a s during the i n i t i a l capture per iod , except t h a t the number of marked f i s h was a l s o recorded and no measure- ments were taken.
Aquatic i n s e c t s were co l l ec ted by using a c i r c u l a r deple t ion samfiler (CDS) and techniques described by Carle (1976). The procedure involved p lac ing the sampler i n t o the s u b s t r a t e and co l l ec t ing aquat ic inve r t eb ra tes by vigorously a g i t a t i n g the s u b s t r a t e t o a depth of approximately 20 cm (8 i n ) f o r one minute. A t t he end o f t h i s period a l l loose debr is and organisms were removed from the c o l l e c t o r o f the CDS and placed i n separa te containers t o be so r t ed a t a l a t e r time. The one minute z g i t a t i o n period was repeated u n t i l t h ree samples had been co l l ec ted from the same locat ion . The organisms were separated from the debr is i n the f i e l d and placed i n 95% ethyl alcohol and were i d e n t i f i e d and enumerated i n t h e lab. Numbers col lec ted , percent composition, and numerical est imates were then ca lcula ted with respect t o the major taxa present .

Because of the time involved i n s i t e s e l e c t i o n and b io log ica l assessment (two t o th ree days), t h e physical assessment phase was l imi ted t o general observations o f the major f ea tu res o f the stream and t h e immediate v i c i n i t y , recording weather condit ions and teniperatures, and measurements of t h e su r face a rea o f t h e sample s i t e s .
Equipment
The following equipment was used t o evaluate populations o f rear ing salmonids and aquat ic i n s e c t s :
Twenty double-ended minnow t r a p s Preserved salmon eggs Two p l a s t i c buckets Tr ica ine methanesulfonate (MS 222) A 200 mm (8 in ) metr ic r u l e r A marking device Two 6 ~n (20 f t ) beach se ine - 6.35 mm (0.25 in) mesh A 15.24 m (50 f t ) tape measure A pocket thermometer Several 500 m l (0.132 g a l ) p l a s t i c b o t t l e s Several small v i a l s 95% ethyl alcohol A timepiece Flagging mater ia l C i rcu la r deple t ion sampler (see Carle 1976) Two f l a t pans Tweezers
FINDINGS
Results
Switzer Creek (111-40-007) :
Location. Lat. 58°21145ffN, long. 134°3011011~ - 8 km (5 mi) Northwest of Juneau.
Descript ion (Reed and Armstrong, 1971)
Switzer Creek i s a r e l a t i v e l y small stream about one mile i n length (average width of 3 f e e t and depth of 2 1/2 f e e t ) . I t drains a watershed o f about 3/4 square miles and meanders across a l a rge t i d a l a rea before emptying i n t o Gastineau Channel. The water is c l e a r and t h e cprrent i s genera l ly moderate. The stream i s crossed by the Glacier Highway j u s t above t h e i n t e r t i d a l a rea . The f i r s t approximate 1/4 mile i s i n t e r t i d a l a rea . The stream meanders through t h i s a rea , with a gravel bottom f o r most p a r t s , and large pools in ter -d ispersed throughout. The banks a r e mud with a heavy grass cover. Af ter crossing under the highway, the stream

winds through an open meadow area f o r about another 1/4 mile. In t h i s sec t ion t h e stream i s slough-l ike with mud banks heavi ly covered with grass . The bottom is mainly s i l t with small a reas o f gravel . About 3/8 miles from the mouth, a t r i b u - t a r y is encountered. This fork o r i g i n a t e s i n a wooded a rea and has a b a r r i e r f a l l s about 3/8 mile from i ts mouth. Af te r winding through the meadow area , Switzer Creek en te r s t h e woods about 1/2 mile from i ts mouth. J u s t a s t h e Creek en te r s t h e woods, a l a rge pond about 5-8 f e e t deep and about 35' x 80' i n s i z e is encountered. The stream continues through t h e wooded a rea f o r about 1/4 mile. The creek o r i g i n a t e s i n a f a i r l y l a rge marsh pond located i n a logged area. In general , t h e stream i s very access ib le . Access s t a t u s t o t h e meadow sec t ion i s l imi ted due t o p r i v a t e property bordering the creek. Switzer Creek has been closed t o salmon f i sh ing s ince 1962. A second small t r i b u - t a r y was encountered about 1/2 mile from t h e mouth, but it was not surveyed.
Barr iers . None on mainstream.
Species Present . Dolly Varden, cu t th roa t t r o u t , coho salmon, chum salmon, c o t t i d .
Species Composition and Abundance (Juveniles) . Rearing salmonids were captured i n a sec t ion of t h i s stream wi th in the boundaries o f t h e logged a rea on th ree occasions--April 20, 1978, Apri l 24, 1978, and June 29, 1978. The means f o r catch pe r u n i t - e f f o r t of Dolly Varden during these periods were .023 DV/min. , .026 DV/min. , and .025 DV/min. ; and the t o t a l catches were 95 DV, 96 DV, and 140 DV, respect ive ly . The only o t h e r species captured during these th ree trapping periods were one coho salmon and one cu t th roa t t r o u t . The species composition derived from t h e t o t a l numbers of f i s h captured was 99.4% Dolly Varden, 0.3% coho salmon, and 0.3% cu t th roa t t r o u t .
The area sampled was 289.6 m (950 f t ) i n length and widths were measu ed a t 15.24 m (50 f t ) i n t e r v a l s . The estimated surface a r e a was 631.7 m 5 (6,800 sq f t ) . The estimated number o f rear ing Dolly Varden i n t h i s a rea was 353 with a 95% confidence i n t e r v a l from 260 t o 552. An es t imate o f t h e dens i ty of Dolly Varden i n t h i s area was 0.56 D V / ~ ~ (. 05 DV/sq ft) . A t o t a l of 96 Dolly Varden were measured during the Apri l 24, 1978 trapping period; they had a mean length of 77.8 mm (3.06 i n ) with a s tandard devia t ion of 15.5 mm (0.61 i n ) .
Jordan Creek (111-50-062) :
Location. Lat. 58°21'251'N, long. 134°34'10"~ - 14.5 km (9 mi) northwest of Juneau.
Description. Jordan Creek i s approximately 5 km ( 3 mi) long and flows along t h e south s i d e o f the Mendenhall Valley p r i o r t o emptying i n t o a

lagoon near the Juneau Airport on Gastineau Channel. This stream i s subjec t t o a wide range of flows with pe r iod ic flooding during ra iny periods and with some por t ions of the stream drying up during long hot periods. However, numerous pools throughout the length of the stream provide good rear ing h a b i t a t even during dry per iods . Much of t h e upper por t ion of t h i s stream flows through o r is adjacent t o r e s i d e n t i a l l o t s and t h e lower por t ion flows through commercially developed property. Some rechannelizat ion has occurred i n t h i s lower port ion.
Barr iers . None.
Species Present . Dolly Varden, coho salmon, cu t th roa t t r o u t , rainbow t r o u t , s t ickleback, c o t t i d s .
Species Composition and Abundance (Juveniles) . During 1978 rea r ing f i s h were captured in, a sec t ion of t h i s stream near t h e end o f Dudley S t r e e t about 3- km (2 mi) upstream from t h e mouth on f i v e occasions--May 4, May 5, J u l y 20, August 10, and August 11. The means f o r catch p e r un i t - e f f o r t o f Dolly Varden during these periods were ,008 D~/min., .003 DV/min., .020 DV/min., .032 DV/min., and .030 ~V/min.; and the t o t a l catches were 47 DV, 16 DV, 90 DV, 153 DV, and 127 DV, respect ive ly . The means f o r ca tch per u n i t - e f f o r t of coho salmon >55 mm (2.17 in ) i n length were 0.110 SS/min., ,058 SS/min., .037 SS/min., .054 SS/min., and .049 SS/min; and the t o t a l catches were 558 SS, 281 SS, 170 SS, 263 SS, and 208 SS, respect ive ly . I:n addi t ion 33 coho fry ( i . e. < 55 mm o r 2.17 i n ) , one rainbow t r o u t , one cu t th roa t t r o u t , 18 s t i c k l ~ b a c k , and 37 c o t t i d s were captured. The species composition derived from these catches was 21.6% Dolly Varden, 75.5% coho salmon, .05% rainbow t r o u t , .05% cu t th roa t t r o u t , 1% st ickleback, and 1.8% c o t t i d s .
The area sampled was 289.6 m (950 f t ) i n length, and widths were measur d a t 15.24 m (50 f t ) i n t e r v a l s . The estimated surface a rea was 2,097.2 m 5 (22,575 sq f t ) . Estimates of the numbers of r ea r ing Dolly Varden and coho salmon >55 mm (2.17 i n ) were obtained during t h e May and August t rapping period:;. The estimated numbers o f Dolly Varden were 102 i n May with a 95% confidence i n t e r v a l from 68 t o 204, and 221 i n August with a 95% confidence i n t e r v a l from 199 t o 256. The estimated numbers of coho salmon were 2,074 i n May with a 95% confidence i n t e r v a l from 1,713 t o 2,543, and 606 i n August with a 95% confidence i n t e r v a l from 531 t q 726. Density est imates were .05 D V / ~ ~ (.005 DV/sq f t ) i n May, 0.11 DV/m (. 01 D V / s f t ) i n August; 0.99 ss/m2 (. 09 SS/sq f t ) i n May and 3 0.29 SS/m (.03 SS/sq f t ) i n August.
A t o t a l of e igh t Dolly Varden were measured during t h e May 4 , 1978 trapp- ing period; they had a mean length of 88.9 mm (3.50 in ) with a s tandard devia t ion of 14.0 mm (0.55 in ) 90 DV were measured during the Ju ly 20, 1978 trapping period and had a mean length of 117.5 mm (4.63 in) with a s tandard devia t ion of 19.5 mm (0.77 in ) 72 DV were measured during the August 10, 1978 trapping period; they had a mean length of 119.6 mm (4.71 i n ) with a s tandard devia t ion of 24.0 mm (0.94 i n ) . A t o t a l of 171 coho salmon .55 mm (2.17 in) were measured during the May 4, 1978 trapping

period and had a mean length of 84.4 mm (3.32 i n ) with a s tandard devia t ion o f 18.1 mm (0.71 i n ) , 168 SS >55 mm (2.17 i n ) were measured during t h e J u l y 20, 1978 trapping period and had a mean length of 80.0 mm (3.15 i n ) with a s tandard devia t ion of 8.7 mrn (0.34 i n ) and 131 SS >55 mm (2.17 in ) were measured during the August 10, 1978 trapping period and had a mean length of 80.9 mm (3.19 in ) with a s tandard devia t ion o f 7.6 mm (0.30 in ) . Montana Creek (111-50-052) :
Location,. Lat. 58°22t5411N, long. 134°35 '47w~ - 13 km (8 mi) northwest o f Juneau.
Descript ion (Reed and Armstrong, 1971) :
Montana Creek, the l a r g e s t t r i b u t a r y t o t h e Mendenhall River, o r ig ina tes i n a mountain meadow a r e a and flows approximately seven miles, draining a watershed of about 15 square miles. The upper reaches o f t h e stream a r e charac- t e r i z e d by numerous rapids and small pools. The streambed c o n s i s t s of small gravel t o l a r g e boulders and t h e banks have good growth. About t h r e e miles o f t h e stream a r e a a r e e a s i l y access ib le by a well defined t r a i l running p a r a l l e l t o t h e stream and o r ig ina t ing a t t h e end of the Montana Creek Road. The next 2 1/2-mile sec t ion is read i ly access ib le by t h e Montana Creek Road, which p a r a l l e l s it. This sec t ion cons i s t s of rapids and numerous deep pools. A t t he lower reaches of t h i s sec t ion , the stream flows through a canyon, which provides probably good f l y f i sh ing . Leaving the canyon, it en te r s a swamp-like area where numerous anabranches a r e formed. This a r e a has very poor a c c e s s i b i l i t y due t o i t s swamp-like charac- t e r i s t i c s and numerous blow-downs. The stream becomes slow flowing and deep. Af ter the stream crosses the Mendenhall Loop Road it has a shor t sec t ion (2 1/4 miles) e a s i l y access ib le t o fishermen. I t appears t h e banks have been graded; however, t h e land on both s ides appears t o be p r i v a t e l y owned. The f i n a l 1 1/2-2 mile sec t ion flows through a very poorly access ib le area. The banks a r e mud and overgrown with dense underbrush cons i s t ing pr imar i ly of d e v i l ' s club. The stream i s too deep f o r wading. The stream mouth is access ib le f o r f i sh ing by a t r a i l s t a r t i n g a t the Brotherhood Bridge and following the Mendenhall River. The flow of system has been estimated a t 150 c f s . . .
Barr iers . None.
Species Present . Dolly Varden, s tee lhead t r o u t , cu t th roa t t r o u t , coho salmon, chum salmon, c o t t i d s .
Species Composition and Abundance (Juveniles) . Rearing f i s h were captured i n a sec t ion of t h i s stream upstream of the bridge crossing on the Glacier Loop Road on August 7- and 8, 1978. The means f o r catch pe r

u n i t - e f f o r t o f Dol.ly Varden were .003 DV/min. and .020 ~ ~ / m i n . , and t h e ca tches were 16 D\l and 69 DV, r e spec t ive ly .
The means f o r ca t ch p e r u n i t - e f f o r t of coho salmon >55 mm (2.17 i n ) were .019 SS/min. and .015 SS/min., and t h e ca tches were 95 SS and 52 SS, r e s p e c t i v e l y . In add i t i on , 61 coho f r y ( i . e . 4 5 mm o r 2.17 i n . i n length) and 46 c o t t i d s were captured during t h e two t rapping per iods . Species composition as der ived from t h e s e ca tches was 27% Dolly Varden, 60% coho salmon, and 13% c o t t i d s .
The a r e a sampled was 304.8 m (1,000 f t ) i n l eng th and widths were mealured a t 15.24 m (50 f t ) i n t e r v a l s . The es t imated s u r f a c e a r e a was 3,770 m (40,575 sq f t ) . 'The es t imated number o f r e a r i n g Dolly Varden i n t h i s a r e a was 149 wi th a 95% confidence i n t e r v a l from 85 t o 397, and t h e es t imated number o f coho salmon >55 mm (2.17 i n ) i n length i n t h i s a r e a was 363 with a 95% confidence i n t e r v a l from 242 t o 636. Density e s t ima te s f o r Dolly Varden were -04 D V / ~ ~ (. 004 DV/sq f t ) , and f o r coho salmon were 0.10 ss/m2 (. 009 SS/sq f t ) . A t o t a l o f 16 Dolly Varden were measured during t h e August 7, 1978 t rapping per iod; they had a mean l eng th o f 105.7 mm (4.16 i n ) wi th a s t anda rd dev ia t ion o f 27.4 mm (1.08 i n ) . A t o t a l o f 94 coho salmon >55 mm (2.17 i n ) were a l s o measured during t h i s per iod; they had a mean length o f 79.6 mm (3.13 i n ) wi th a s tandard dev ia t ion o f 7.9 mm (0.31 i n ) .
Peterson Creek (111-50-010):
Location. Lat. ~ 8 ~ 2 9 ' 4 5 " ~ , long. 1 3 4 ° 4 6 f 4 5 " ~ - 31 km (19 mi) northwest of Juneau.
Descr ip t ion (Reed and Armstrong, 1979):
Pe terson Creek has i t s headwaters on Auke Mountain. A f t e r flowing i n a nor thwes ter ly d i r e c t i o n f o r approximately seven mi l e s , it empties i n t o S a l t Lake, a s a lwa te r lagoon on Favor i t e Channel. Pe te rson Lake i s t h e major lake on t h e stream. The lower reaches o f t h e creek flow through open f i e l d s , and t h i s creek s e c t i o n is slow flowing and deep. Access i s r e s t r i c t e d because o f t h e surrounding p r i v a t e d land. About 3/4 mi l e from i t s mouth, t h e stream flows under t h e G l a c i e r Highway. The s t ream e n t e r s t h e t r e e s about one mi le upstream and widens out ( t o about 1 2 f e e t ) and becomes shallow (about one food deep). For about t h e next 1 /4 mi le , it c o n s i s t s of r i f f l e a r eas with f i n e t o medium grave l cover . The bank cover i s good, however, i t does not impede a c c e s s i b i l i t y . Following t h e r i f f l e s e c t i o n , t h e stream e n t e r s a canyon headed by a f a l l s . The only a r e a o f d i f f i c u l t a c c e s s i b i l i t y i s t h e canyon. S i x small t o medium t r i b u t a r i e s were encountered bu t none were surveyed. Feterson Creek was named f o r John G . Peterson, a Juneau businessman and miner . . .

Barr iers . Total f i s h block approximately 2 1/2 km (1 1/2 mi) upstream from t h e mouth i n t h e form of a 15 m (50 f t ) f a l l s .
Species Present . Dolly Varden, s teelhead t r o u t , cu t th roa t t r o u t , coho salmon, chum salmon, pink salmon, s t ickleback, and c o t t i d s .
Species Composition and Abundance (Juveniles) . Rearing f i s h were captured i n a sec t ion of t h i s stream i n t h e v i c i n i t y of t h e Glacier Highway bridge on August 2 and 3, 1978. The means f o r catch p e r u n i t - e f f o r t of Dolly Varden were .0006 DV/min. and .0008 DV/min.; and t h e catches were 3 DV and 3 DV, respect ively . The means f o r catch p e r u n i t - e f f o r t of coho salmon >55 mm (2.17 in ) i n length were .019 SS/min. and .029 SS/min.; and the catches were 96 SS and 107 SS, respect ively . The means f o r catch per u n i t - e f f o r t of rainbow t r o u t (probably rear ing s tee lhead t r o u t ) were ,002 RT/min. and .004 RT/min.; and t h e catches were 11 RT and 13 RT, respectively. In addi t ion , 528 coho f r y ( i .e . <55 mm o r 2.17 i n ) , one st ickleback, and 25 cott ids. were captured. Species c o ~ p o s i t i o n a s derived from these catches was 0.8% Dolly Varden, 92.9% coho salmon, 3% rainbow t r o u t , 3.2% c o t t i d s , and 0.1% st ickleback.
The area sampled was 304.8 m (1,000 f t ) i n length and widths were measured a t 15.24 m (50 f t ) in te rva l s . The estimated surface a rea was 3,233 m2 (34,800 sq f t ) . The estimated numbers of rear ing coho salmon (>55 mm o r 2.17 in . i n length) i n t h i s a rea was 476 with a 95% confidence i n t e r v a l from 338 t o 748. Because of low recapture r a t e s no o the r est imates were obtained. The densi ty est imate f o r coho salmon was 0.15 ss/m2 (.01 SS/sq f t ) .
A t o t a l of 91 coho salmon >55 mm (2.17 i n ) were measured during t h e August 2, 1978 trapping period and had a mean length of 79.9 mm (3.15 i n ) with a standard deviat ion of 16.0 nnn (0.63 i n ) .
North Hood Bay, unnamed stream (112-72-005) :
Location. Lat. 57O23'36ItN, long. 134°21t36"W - 1.6 km (1 mi) from t h e head of North Hood Bay on the north s ide o f t h e bay on t h e west coast of Admiralty Island.
Description. This small stream is about 5 km (3 mi) long and averages 6 m (20 f t ) i n width and 1/2 m (1 1/2 f t ) i n depth. The water i s c l e a r and t h e current i s moderate, but there was some evidence of f luc tuat ions i n flows. There was a l imi ted amount of spawning area i n the lower por t ion of the stream; but the remainder of the stream was characterized by t h e following pa t t e rn : small debr is jams with associated pools, a s e r i e s of shallow r i f f l e s , and another debr is jam and pool. A few adu l t pink salmon were seen i n the lower por t ion of t h e stream.
Barr iers . Several p a r t i a l b a r r i e r s and debris jams, but no t o t a l b a r r i e r s were noted i n the sec t ion surveyed.
Species Present. Dolly Varden, coho salmon, pink salmon, cut throat t r o u t , and c o t t i d s .

Species Composition and Abundance (Juveniles) . Rearing f i s h were captured i n a sec t ion o f t h i s stream about 152 m (500 f t ) upstream from t h e mouth on August 29 and 30, 1978. The means f o r catch p e r u n i t - e f f o r t of Dolly Varden were .033 DV/min. and .032 DV/min; and t h e catches were 167 DV and 176 DV, respect ive ly . The means f o r catch p e r u n i t - e f f o r t f o r coho salmon :.55 mm (2.17 i n ) i n length were .006 SS/min and .007 SS/min, and t h e catches were 27 SS and 33 SS, respect ive ly . In addi t ion , 42 coho f r y ( i .e . <55 mm o r 2.17 i n ) , t h ree cu t th roa t t r o u t , and 283 c o t t i d s were capturez. The species composition as derived from these catches was 46.9% Dolly Varden, 14% coho salmon, 0.4% cu t th roa t t r o u t , and 38.7% c o t t i d s .
The area sampled was 304.8 m (1,000 f t ) i n length, and widths were measured a t 15.23 m (50 f t ) i n t e r v a l s . The estimated surface a rea was 1,760.5 m2 (18,950 sq f t ) . The estimated number o f rear ing Dolly Varden i n t h i s a r e a was 354 with a 95% confidence i n t e r v a l from 307 t o 425. The estimated number o f coho salmon >55 mm (2.17 in) i n length was 136 with a 95% confidence i n t e r v a l from 79 t o 476. Density es t imates were 0.20 D V / ~ ~ (. 019 DV/sq f t ) and .08 ss/m2 (. 007 SS/sq f t ) . A t o t a l o f 167 Dolly Varden were measured during t h e August 29, 1978 trapping period. They have a mean length of 88.6 mm (3.49 i n ) with a s tandard devia t ion o f 21.1 mm (0.83 i n ) . A t o t a l o f 27 coho salmon >55 mm (2.17 i n ) were a l s o measured during t h i s period; they had a mean length of 64.0 mm (2.52 in ) and a s tandard devia t ion o f 9.5 mm (0.37 i n ) .
Big Bay - Upper Lake I n l e t s (113-31-003):
Location. Lat. 56°50140"N, long. 134°17115"~ - 32 km (20 mi) South o f S i t k a on t h e west coast of Baranof Is land.
Descript ion. The Big Bay system cons i s t s of an o u t l e t stream (113-31-003) approximately 4 1/2 krn (2 3/4 mi) i n length which dra ins i n t o Big Bay, a shallow lower lake approximately 1 km (1/2 mi) i n length and l e s s than 1/2 lan (1/4 mi) i n width, an interconnecting stream approximately 1/2 km (1/4 mi) i n length containing a b a r r i e r f a l l s , t h e upper lake which is approximately 1 km (1/2 mi) i n length and l e s s than 1/2 km (1/4 mi) i n width, and an i n l e t stream which i s approximately 6 1/2 km (4 mi) i n length with an average width o f 24 m (80 f t ) . The water was coffee colored i n the i n l e t stream but v i s i b i l i t y was good t o depths of about i 1 / 2 m (5 f t ) .
Barr iers . A f a l l s extends' f o r 24 m (80 f t ) a t a 30' angle between the upper and lower lakes.
Species Present . Upper lake, Dolly Varden and cu t th roa t t r o u t .
Species Composit.ion and Abundance (Juveni les) . Rearing f i s h were captured i n the main i n l e t ( i n l e t 1) t o the upper lake on June 20 and 21, 1978, and i n a smallel* i n l e t stream ( i n l e t - 2 ) on June 22 and 23, 1978. The means f o r catch per u n i t - e f f o r t on the main i n l e t f o r Dolly Varden were .016 DV/min. and .017 DV/min. and on the smaller i n l e t were .017 DV/min.

and .020 DV/min. The catches of Dolly Varden were 84 and 76 on t h e main i n l e t and 67 and 68 on t h e smaller i n l e t . The means f o r catch p e r u n i t - e f f o r t of cu t th roa t t r o u t were .006 CT/min. and .003 CT/min. on t h e main i n l e t , and .008 CT/min. and ,005 CT/min. on the smaller i n l e t . The catches of cu t th roa t t r o u t were 30 and 11 on t h e main i n l e t and 30 and 18 on the smaller i n l e t . The species composition derived from these catches was 80% Dolly Varden and 20% cu t th roa t t r o u t i n t h e main i n l e t and 74% Dolly Varden and 26% cu t th roa t t r o u t i n t h e smaller i n l e t .
The a rea trapped on the main i n l e t was 800 m (2,625 f t ) i n length with an average width o f 21.3 m (70 f t ) . A rough est imate of t h e surface area of t h i s sec t ion ( i . e. length x average width) was 17,070 m2 (183,750 sq f t ) . The estimated number of Dolly Varden i n t h i s sec t ion was 595 with a 95% confidence i n t e r v a l from 364 t o 1,309. The rough densi ty est imate was .03 D V / ~ ~ (.003 W/sq f t ) . No marked cu t th roa t t r o u t were trapped during t h e recapture period, and an est imate of t h e i r numbers was not obtained.
The area trapped i n the smaller i n l e t was 304.8 m (1,000 f t ) i n length with an average width o f 1.524 m (5 f t ) . A rough est imate o t h e surface I area o f t h i s sec t ion ( i .e . length x average width) was 465 m (5,000 sq f t ) . The estimated number of Dolly Varden i n t h i s sec t ion was 151 with a 95% confidence i n t e r v a l from 120 t o 213. The rough densi ty est imate was 0.32 D V / ~ ~ (. 03 DV/sq f t ) . The estimated number o f cu t th roa t t r o u t i n t h i s sec t ion was 98 with a 95% conf i ence i n t e r v a l from 54 t o 295. The 9 rough densi ty estimate was 0.21 CT/m (.02 CT/sq f t ) .
During t h e June 20, 1978 trapping period on t h e main i n l e t , 84 Dolly Varden were measured. They had a mean length of 81.7 mm (3.22 i n ) with a standard deviat ion of 22.5 mm (0.89 i n ) ; and 30 cut throat t r o u t were measured and had a mean length of 88.0 mm (3.46 in ) with a standard devia t ion of 23.3 mm (0.92 i n ) . During the June 22, 1978 trapping period on the smaller i n l e t , 66 Dolly Varden were measured and had a mean length o f 81.8 rnrn (3.22 i n ) with a standard deviat ion o f 18.0 mm (0.71 i n ) , and 30 cut throut t r o u t were measured and had a mean length of 91.7 mm (3.61 in ) with a standard deviat ion of 12.2 mm (0.48 i n ) .
Olive Cove (unnamed stream):
Location. Lat. 56°10t45tN, long. 132°19t30t'W - 40 km (25 mi) sou th of Wrangell on the e a s t coast of Etol in Island.
Description. This stream i s approximately 4 km (2 1/2 mi) i n length and dra ins i n t o Olive Cove l e s s than 1/2 km (1/4 mi) from the mouth of Snake Creek (107-30-070). The water is c l e a r , the average width is 9 m (30 f t ) , and pools over 1 m (4 f t ) i n depth occur per iodical ly .
Barr iers . A p a r t i a l b a r r i e r i s located about 1 km (1/2 mi) upstream from the mouth.
Species Present. Dolly Varden, coho salmon, and pink salmon.

Species Composition and Abundance. Rearing f i s h were captured i n a s e c t i o n o f t h i s s t ream approximately 1 1/2 km (1 mi) upstream from t h e mouth on J u l y 6 and 7, 1978. The only spec i e s captured were Dolly Varden. The means f o r ca tch p e r u n i t - e f f o r t were .044 DV/min. and .079 DV/min.; and t h e ca tches were 223 and 275, r e spec t ive ly .
The a rea sampled was 304.8 m (1,000 f t ) i n l eng th and widths were measured a t 15.24 m (50 f t ) i n t e r v a l s . The es t imated s u r f a c e a r e a was 2,094.9 m2 (22,550 sq f t ) . The es t imated number o f r e a r i n g Dolly Varden i n t h i s a r e a was 695 with a 95% confidence i n t e r a1 from 594 t o 847. Y The es t imated d e n s i t y i n t h i s a r e a was 0.33 DV/m ( - 0 3 DV/sq f t ) .
A t o t a l of 223 Dolly Varden were measured during t h e J u l y 6, 1978 t r app ing per iod and had a mean length o f 96.0 mm (3.78 i n ) with a s tandard dev ia t ion of 14.8 mm (0.58 i n ) .
Luck Lake, Eagle Creek (106- 10-030) :
Location. Lat. 5S057 '42"~, long. 132O43'13"W - approximately 80 km (50 mi) southwest of Wrangell on t h e e a s t coas t o f Pr ince of Wales I s l and .
Descr ip t ion . This system c o n s i s t s o f Eagle Creek, which i s t h e o u t l e t stream o f Luck Lake; Luck Lake; and Luck Creek, t h e major i n l e t t o Luck Lake. Eagle Creek i s approximately 3 km ( 1 3/4 mi) long and 24 m (80 f t ) wide. Luck Lake i s approximately 3 km (2 mi) i n length and averages 1 /2 km (1/4 mi) i n width. Luck Creek and i t s a s soc i a t ed t r i b u t a r i e s a r e nea r ly 32 km (20 mi) i n length and t h e mainstream averages 15 m (50 f t ) i n width. This watershed was roaded and logged i n t h e e a r l y 1970's and l a r g e po r t ions o f t h e system were a f f e c t e d by t h e s e a c t i v i t i e s .
B a r r i e r s . There is a f a l l s on Luck Creek about 1 1/2 km (1 mi) above t h e lake . The major drop i s about 1 m (4 f t ) i n he igh t and is followed by a s e r i e s o f shallow drops. I t i s not a t o t a l b a r r i e r t o f i s h passage. A f i s h l adde r was i n s t a l l e d by t h e U.S. Forest Serv ice i n t h e e a r l y 1970's bu t was subsequent ly washed ou t . An add i t i ona l s e t o f f a l l s i s loca t ed about 2 1/2 km (1 1/2 mi) above t h e lake on Luck Creek and it c o n s i s t s o f two drops about 1 m (4 f t ) i n he igh t . Rearing coho salmon were captured upstream o f t h e s e f a l l s .
Species Present . Dolly Varden, s t ee lhead t r o u t , c u t t h r o a t t r o u t , coho salmon, r e d salmon, pink salmon, chum salmon.
Species Composition and Abundance. Rearing f i s h were captured i n two s e c t i o n s of t h e Luck Creek dra inage system on June 13, 14, 15, 1978. A s e c t i o n o f t h e Luck Creek mainsiream approximately 3 km- (2 mi) above Luck Lake was t rapped on two occasions--June 13 and 14, 1978; and a s e c t i o n o f a t r i b u t a r y t o Luck Creek below t h e f i r s t f a l l s and 1 1/2 km (1 mi) above t h e lake was t rapped on June 14 and 15, 1978.
During t h e mainstream t rapping per iods t h e means f o r catch pe r u n i t - e f f o r t o f Dolly Varden were .032 DV/min. and .023 DV/min., and t h e

catches were 197 DV and 73 DV. The means f o r catch p e r u n i t - e f f o r t of coho salmon were .022 SS/min. and .021 SS/min., and t h e catches were 130 SS and 67 SS. The means f o r catch pe r u n i t - e f f o r t o f rainbow and cu t th roa t t r o u t combined were .010 RT + CT/min. and .003 RT + CT/min., and the catches were 61 RT + CT and 10 RT + CT. The species composition as derived from these catches was 50% Dolly Varden, 37% coho salmon and 13% rainbow and cu t th roa t t r o u t combined.
The area sampled on t h e mainstream was approximately 411.5 m (1,350 f t ) i n length and had an average width o f 15.24 m (50 f t ) . A rou h es t imate 5 of t h e surface a r e a ( i . e. length x average width) was 6,271 m (67,500 sq f t ) . The estimated number of r ea r ing Dolly Varden i n t h i s a r e a was 729 with a 95% confidence i n t e r v a l from 521 t o 1,121, and a rough dens i ty es t imate was 0.12 D V / ~ ~ ( .01 DV/sq f t ) . The estimated number o f rear ing coho salmon was 491 with a 95% confidence i n t e r v a l from 340 t o 804, and a rough dens i ty est imate was .08 sS/m2 (.01 SS/sq f t ) . The recapture of marked rainbow and cu t th roa t t r o u t was too small t o obta in an est imate of t h e i r numbers.
During the June 13, 1978 trapping period on t h e mainstream, 196 Dolly Varden were measured and had a mean length o f 75.9 mm (2.99 i n ) with a s tandard devia t ion o f 16.0 mm (0.63 i n ) , 130 coho salmon were measured and had a mean length of 69.4 mm (2.73 i n ) with a s tandard devia t ion of 7.4 mm (0.29 i n ) , and 61 rainbow and cu t th roa t t r o u t were measured and had a mean length of 77.4 mm (3.05 i n ) with a s tandard devia t ion of 21.5 mm (0.85 i n ) .
During the t r i b u t a r y trapping periods the means f o r catch pe r un i t - e f f o r t f o r Dolly Varden were .022 DV/min. and .033 DV/min., and the catches were 95 DV and 69 DV. The means f o r catch pe r u n i t - e f f o r t o f coho salmon were .013 SS/min. and .011 SS/min., and t h e catches were 54 SS and 43 SS. The means f o r catch pe r u n i t - e f f o r t o f rainbow and cu t th roa t t r o u t combined were .005 RT + CT/min. and .002 RT + CT/min., and t h e catches were 20 RT + CT and 7 RT + CT. The species composition i n the t r i b u t a r y as derived from these catches was 57% Dolly Varden, 34% coho salmon, and 9% rainbow and cu t th roa t t r o u t combined.
The areas sampled on the t r i b u t a r y was approximately 365.8 m (1,200 f t ) i n length and the average width was 3.05 m (10 f t ) . A rough est imate o f t h e su r face a r e a was 1,115 m2 (12,000 sq f t ) . The estimated number o f rear ing Dolly Varden i n t h i s a rea was 448 with a 95% confidence i n t e r v a l from 305 t o 840, and a rough dens i ty est imate was 0.40 D V / ~ ~ (.04 DV/sq f t ) . The estimated number of coho salmon i n t h i s a rea was 202 with a 95% confidence i n t e r v a l from 127 t o 346, and a rough dens i ty est imate was 0.18 ss/m2 1.02 SS/sq f t ) . The recapture of marked rainbow and cu t th roa t t r o u t combined was i n s u f f i c i e n t t o obta in an accurate est imate of t h e i r numbers.
During the June 14, 1978 trapping period on the t r i b u t a r y , 94 Dolly Varden were measured and had a mean length of 69.8 mm (2 3/4 i n ) with a standard devia t ion of 12.8 mm (0.5 i n ) ; 54 coho salmon were measured and

had a mean l eng th of 69.1 mm (2.72 i n ) wi th a s t anda rd dev ia t ion o f 9.1 mm (0.36 i n ) ; and 20 rainbow and c u t t h r o a t were measured and had a mean length of 82.1 mm (3.23 i n ) with a s tandard dev ia t ion o f 16.7 mm (0.66 i n ) .
Aquat ic In sec t s , Species Composition and Abundance. Aquatic i n s e c t s were c o l l e c t e d i n t h e mainstream o f Luck Creek on June 15, 1978. Nineteen t a x a were c o l l e c t e d and t h e numbers c o l l e c t e d , pe rcen t composition, and dens i ty e s t ima te s a r e presented i n Table 2.
Red Lake I n l e t (106-41-030) :
Location. Lat. 56°15 t46"~ , long. 133°19150"~ - approximately 80 km (50 mi) southwest o f Petersburg on t h e no r th coas t o f p r ince of Wales I s l and .
Descr ip t ion . The Red Lake watershed inc ludes t h e o u t l e t s t ream which d r a i n s i n t o Red Bay, Red Lake, and t h e i n l e t stream. The o u t l e t s t ream is l e s s than 1 1/2 km (1 mi) i n length from t h e l a k e t o t h e i n t e r t i d a l a r e a and averages 30 m (100 f t ) i n width. I t i s a l s o f e d by a t r i b u t a r y t h a t i s approximately 7 km (4 1/2 mi) i n length . Red Lake i s over 3 km (2 mi) i n length and about 1/2 km (1/4 mi) i n width. The main i n l e t i s over 3 km (2 mi) i n l eng th with an average width of 4 m (13 f t ) . There has been some logging and roadbuilding a c t i v i t y i n t h e a r ea , b u t t h e only known a c t i v i t y d i r e c t l y a f f e c t i n g t h e watershed i s a b r idge c ross ing s i t e on t h e o u t l e t stream nea r t h e i n t e r t i d a l a r ea .
Species Present . Dolly Varden, s t ee lhead t r o u t , rainbow t r o u t , c u t t h r o a t t r o u t , coho salmon, r ed salmon, pink salmon, chum salmon, s t i ck l eback , and c o t t i d s .
Species Composition and Abundance. Rearing f i s h were captured on a s e c t i o n o f t h e main i n l e t s t ream on J u l y 11 and 12. 1978. The means f o r ca tch p e r u n i t - e f f o r t o f Dolly Varden wkre .018 ~ v j m i n . and .023 DV/min., and t h e ca tches were 108 DV and 104 DV. The means f o r ca tch p e r u n i t - e f f o r t o f coho salmon were .033 SS/min. and .045 SS/min., and t h e ca tches were 179 SS and 192 SS. Approximately 21% o f t h e s e r ea r ing coho were <55 mm (2.17 i n ) and t h e ad jus t ed means f o r ca tch p e r u n i t - e f f o r t excluding - t h e s e f i s h were approximately .025 SS/min. and .035 SS/min. The means f o r catch p e r u n i t - e f f o r t o f rainbow t r o u t were .008 R T / m i n . and .006 R T / m i n . , and t h e ca tches were 52 RT and 27 RT. In add i t i on t h r e e c u t t h r o a t t r o u t , 18 s t i ck l eback , and n ine c o t t i d s were captured during t h e two per iods . The spec i e s composition as der ived from t h e s e catches was 30.6% Dolly Varden, 53.6% coho salmon, 11.4% rainbow t r o u t , 0.4% c u t t h r o a t t r o u t , 2.6% s t i ck l eback , and 1.3% c o t t i d s .
The a rea sampled was 274.3 m (900 f t ) i n length and widths were measured a t 15.24 m (50 f t ) i n t e r v a l s . Thus, an es t imate o f t h e su r f ace a r e a was 1,135.7 m2 (12,225 s q f t ) . An es t imate o f t h e numbers o f Dolly Varden i n t h i s a r e a was 369 with a 95% confidence i n t e r v a l from 286 t o 545, and a dens i ty e s t ima te was 0.32 D V / ~ ' ( .03 DV/sq f t ) . An e s t ima te o f t h e numbers o f coho salmon was 620 with a 95% confidence i n t e r v a l

Table 2. Data from circular depletion sampling of aquatic insects in Luck Creek (June 15, 1978).
TAXA =
NUMBER PERCENT NUMERICAL COLLECTED COMPOSITION ESTIMATE
AZZoperZa sp.
Baetis pamus
Baetis bicaudatus
Chironomidae (larvae)
CinygmuZa sp.
Ep hemere Z Za t ib ia Zis
Ephemere Z Za doddsi
Epeorus grandis
Epeorus a Zbertae
Epeoms sp.
Dicrmrota sp.
Rithrogena grandis
AmeZetus sp.
PamZeptophZebia sp . Leuctra sp.
~hyacophi la sp . Limnephil idae
~oederoides sp . G Zossosoma sp .
TOTAL

from 503 t o 790 and a dens i ty e s t ima te was 0.55 ss/m2 (.05 SS/sq f t ) . An e s t ima te of t h e numbers o f rainbow t r o u t was 212 with a 95% confidence i n t e r v a l from 124 t o 495 and a dens i ty e s t ima te was 0.19 R T / ~ ~ ( .01 RT/sq f t ) .
A t o t a l of 108 Dolly Varden were measured during t h e J u l y 11, 1978 t rapping pe r iod and t h e mean l eng th was 86.3 mm (3.40 i n ) wi th a s tandard dev ia t ion of 18.8 mm (0.74 i n ) ; 174 coho salmon were measured and had a mean l eng th o f 78.8 mm (3.10 i n ) wi th a s tandard dev ia t ion of 22.0 mrn (0.87 i n ) . Excluding 42 o f t h e s e coho which were <55 mm (2.17 i n ) i n length g ives a mean o f 88.4 mrn (3.48 i n ) wi th a s tandard dev ia t ion o f 15.9 mm (0.63 i n ) . Also 52 rainbow t r o u t were measured and had a mean length of 90.1 mm (3.55 i n ) wi th a s tandard dev ia t ion of 20.3 mm (0.80 i n ) .
F l i c k e r Creek (106-41-045):
Location. Lat. 56O20' 2 0 " ~ , long. 133' 32'00ttW - approximately 80 km (50 mi) southwest o f Petersburg on t h e no r th end o f Pr ince o f Wales I s l and between Exchange Cove and Red Bay.
Descript ion. F l i c k e r Creek is n e a r l y 10 km (6 mi) i n length and approxi- mately 15 km (50 f t ) wide. I t j o ins Alder Creek (106-41-044) a t t h e i n t e r t i d a l a rea . There has been some r ecen t logging and roading a c t i v i t i e s i n t h e a r e a , b u t d e t a i l e d surveys of t h i s stream have no t been conducted.
Species Present . Dolly Varden, coho salmon, rainbow t r o u t , c o t t i d s .
Spec ies Composition and Abundance. Rearing f i s h were captured on J u l y 31, 1978 i n a 304.8 m (1,000 f t ) s e c t i o n o f t h e mainstream approximately 1 1/2 km (1 mi) upstream from t h e mouth and about 1/2 km (1/4 mi) upstream from a br idge c ross ing s i t e . The means f o r ca tch p e r u n i t - e f f o r t recorded during t h i s t rapping pe r iod were ,026 DV/min. f o r Dolly Varden and .015 SS/min. f o r coho salmon >55 mm (2.17 i n ) i n length . The t o t a l number o f f i s h captured was 116 Dolly Varden, 157 coho salmon, 2 rainbow t r o u t and one c o t t i d . The spec i e s composition der ived from t h e s e ca tches was 42% Dolly Varden, 56.9% coho salmon, 0.7% rainbow t r o u t , and 0.4% c o t t i d s .
A t o t a l o f 116 Dolly Varden were measured and had a mean length o f 77.9 mm (3.07 i n ) with a s tandard dev ia t ion of 12.0 mm (0.47 i n ) . Also 88 coho salmon f r y ( i . e . <55 mrn o r 2.17 i n ) were captured. A t o t a l of 69 coho salmon >55 mm (2.17 i n ) were measured and had a mean length o f 83.4 mm (3.28 i n ) wi th a s tandard dev ia t ion of 6.5 mm (0.26 i n ) .
Populat ion numbe'rs were no t est imated.
Keta River (101-30-030) :
Location. Lat . C;5°20t10't~, long. 130°28'29"W - approximately 97 km (60 mi) e z s t o f Ketchikan.

Description. The Keta River is the mainstream of a f a i r l y l a rge watershed t h a t d ra ins i n t o Boca de Quadra approximately 97 km (60 mi) e a s t o f Ketchikan. The main r i v e r is over 22 1/2 km (14 mi) long and f requent ly exceeds 30 m (100 f t ) i n width. There a r e a few braided areas , but s i d e sloughs l e s s than 15 m (50 f t ) i n width and f requent ly over 305 m (1,000 f t ) i n length occur a t i n t e r v a l s along t h e mainstream. Studies were begun i n the summer of 1977 t o assess t h e poss ib le impacts of a proposed molybdenum mine s i t e and r e l a t e d construct ion a c t i v i t i e s i n the area . A r epor t on these s t u d i e s w i l l be published i n t h e fu tu re , and a summary o f a c t i v i t i e s t o da te is beyond t h e scope o f t h i s r epor t .
Species Present . Pink salmon, chum salmon, coho salmon, king salmon, red salmon, s tee lhead t r o u t , rainbow t r o u t , and Dolly Varden.
Species Composition and Abundance. F-earing f i s h were captured i n t h r e e sloughs of t h e Keta River within a 1 1/2 km (1 mi) radius of H i l l Creek-- a major t r i b u t a r y located approximately 11 km (7 mi) from the mouth of the r i v e r . For purposes o f i d e n t i f i c a t i o n , these areas have been named Cabin Slough, H i l l Creek Slough, and Logjam Slough. Cabin Slough is an anabranch of t h e Keta River approximately 457 m (1,500 f t ) i n length and averaging 15 m (50 f t ) i n width. This slough is located approximately 1 / 2 km (1/4 mi) upstream of the confluence o f H i l l Creek and t h e Keta River. Because of the width of t h i s slough the sampling procedure was modified so t h a t 20 minnow t r a p s were s e t a t 7 112-m (25-ft) i n t e r v a l s with each t r a p s e t on a l t e r n a t e s ides of t h i s slough. In t h i s manner a 152 m (500 f t ) sec t ion of t h i s slough was sampled on October 20 and 21, 1978.
The means f o r catch per u n i t - e f f o r t of Dolly Varden were .008 DV/min. and .010 DV/min., t he means f o r catch pe r u n i t - e f f o r t of coho salmon (>55 mm o r 2.17 i n . i n length) were .027 SS/min. and .028 SS/min., and the means f o r catch per u n i t - e f f o r t of chinook salmon were ,003 KS/min. and .005 KS/min. Tota ls of 35 and 39 Dolly Varden, 119 and 109 coho salmon >55 mm (2.17 i n ) , and 16 and 22 chinook salmon, respect ive ly , were captured during the two sampling periods. In addi t ion , 230 and 176 coho salmon f r y ( i . e . 4 5 mrn o r 2.17 in ) were captured. Species composition derived from these catyhes was 10% Dolly Varden, 85% coho salmon, and 5% chinook salmon.
The area sampled was 152.4 m (500 f t ) i n length and averaged 15 m (50 f t ) i n width. A rough est imate o f the surface a rea ( i . e . length x average width) was 2,323 m2 (25,000 sq f t ) . The estimated number o f coho salmon >55 mrn (2.17 in ) was 825 with a 95% confidence i n t e r v a l from 550 t o 1,467, and a rough dens i ty est imate was 0.36 SS/m2 (.03 SS/sq f t ) . Because o f the low numbers of recaptured, marked Dolly Varden and chinook salmon, reasonable est imates of t h e i r numbers could not be obtained.
H i l l Creek slough is a branch of H i l l Creek t h a t en te r s t h e Keta River below the main confluence of H i l l Creek and the Keta River. Rearing f i s h were captured on a 304.8 m (1,000 f t ) sec t ion o f t h i s slough on August 16 and 17, 1978 and October 24, 1978. The means f o r catch per

u n i t - e f f o r t o f Dolly Varden were .058 DV/min., .047 DV/min., .076 DV/min.; and t h e means f o r ca tch p e r u n i t - e f f o r t o f coho salmon >55 mm (2.17 i n ) were .042 SS/min., .051 SS/min., and 0.151 SS/min., r e spec t ive ly . The t o t a l ca tches during t h e s e per iods were 259, 173, and 247 Dolly Varden; 199, 202, and 512 coho salmon >55 mm mm (2.17 i n ) ; and 254, 487, and 536 coho salmon f r y ( i . e . <55 mm o r 2.17 i n ) ; r e spec t ive ly . I n add i t i on a t o t a l of 49 chinook saimon and 17 c o t t i d s were captured during t h e t h r e e per iods . Species composition a s der ived from t h e s e ca tches was 23.1% Dolly Varden, 74.6% coho salmon, 1.7% chinook salmon and 0.6% c o t t i d s .
The a r e a sampled was 304.8 m (1,000 f t ) i n length , and widths were measured a t 15.24-m (50-f t ) i n t e r a l s . The es t imated su r f ace a r e a of 5 t h e s e c t i o n sampled was 2,965.8 m (31,925 sq f t ) . Est imates o f numbers of f i s h were obta ined during t h e August sampling per iods only. The es t imated number o f Dolly Varden was 1,131 with a 95% confidence i n t e r v a l from 870 t o 1,560. An approximate dens i ty e s t ima te f o r Dolly Varden was 0.38 D V / ~ ~ (. 04 DV/sq f t ) . The es t imated number o f coho salmon >55 mm (2.17 i n ) i n l eng th was 1,081 with a 95% confidence i n t e r v a l from 833 t o 1,538. An approximate dens i ty e s t ima te f o r coho salmon was 0.36 ~ S / m 2 ( .03 SS/sq f t ) .
During t h e August 16, 1978 t r app ing per iod , 259 Dolly Varden were measured and had a mean l eng th o f 86.6 mm (3.41 i n ) wi th a s tandard dev ia t ion of 17.3 mm (0.68 i n ) ; and 198 coho salmon >55 mm (2.17 i n ) were measured and had a mean l eng th o f 75.2 mm (2.96 i n ) with a s tandard dev ia t ion o f 11.6 mm (0.46 i n ) . During t h e October 24, 1978 t rapping pe r iod , 142 Dolly Varden were measured and had a mean length of 61.4 mm (2.42 i n ) with a s tandard dev ia t ion of 12.5 mm (0.49 i n ) ; 252 coho salmon >55 mm (2.17 i n ) were measured and had a mean length of 62.3 mm (2.45 i n ) wi th a s tandard dev ia t ion o f 6.4 mm (0.25 i n ) ; and 31 chinook salmon were measured and had a mean length o f 70.6 mm (2.78 i n ) with a s tandard dev ia t ion o f 5.4 mm (0.21 i n ) .
Logjam Slough is an anabranch o f t h e Keta River about 1/2 km (1/4 mi) down- s t ream from t h e confluence o f H i l l Creek and t h e Keta River. Rearing f i s h were captured i n a s e c t i o n o f t h i s slough on August 18 and 19, 1978. The means f o r cat.ch p e r u n i t - e f f o r t o f Dolly Varden were .004 DV/min. and .009 DV/min., and t h e ca tches were 18 and 34, r e spec t ive ly . The means f o r catch p e r u n i t - e f f o r t o f coho salmon >55 mm (2 .17 i n ) were .021 SS/min and .019 SS/min., and t h e ca tches were 85 and 72, r e s p e c t i v e l y . In a d d i t i o n a t o t a l o f 901 coho salmon f r y <55 mm (2.17 i n ) and one c o t t i d were captured during t h i s t rapping per iod . The spec i e s composition, as der ived from t h e s e ca tches , was 4.7% Dolly Varden, 95.2% coho salmon, and 0.1% c o t t i d s .
The a r e a sampled was 304.8 m (1,000 f t ) i n length and t h e average width was 12.19 m (40 f t ) . A rough e s t ima te o f t h e su r f ace a rea ( i . e . l ength x average width) was 3,716 m2 (40,000 sq f t ) . The est imated numbers o f coho salmon >55 mm (2.17 i n ) i n t h i s s e c t i o n was 785 with a 95% confidence i n t e r v a l from 448 t o 2,093. The rough dens i ty e s t ima te was 0.21 sS/m2 (.02 SS/sq f t ) . An i n s u f f i c i e n t number o f marked Dolly Varden were recaptured s o an e s t ima te of t h e i r numbers was not obtained.

During the August 18, 1978 trapping period, 18 Dolly Varden were measured and found t o have a mean length of 75.0 mm (2.95 i n ) with a s tandard devia t ion of 24.1 mm (0.95 i n ) and 85 coho salmon >55 mm (2.17 in ) were measured and found t o have a mean length of 66.2 mm (2.61 in ) with a s tandard devia t ion o f 8.6 mm (0.34 i n ) .
Discussion
The reason f o r studying d i f f e r e n t watersheds throughout Southeast Alaska was t o determine i f t h e sampling technique would y i e l d r e l i a b l e r e s u l t s i n varying h a b i t a t s and f i e l d condit ions and t o determine t h e l i m i t s of i t s a p p l i c a b i l i t y . In general the r e s u l t s a r e very encouraging. Quanti- t a t i v e values f o r the f i v e parameters were obtained a t a l l o f t h e areas s tudied . The range of values f o r each o f t h e f i v e parameters with respect t o Dolly Varden and coho salmon a r e presented i n Table 3 and s p e c i f i c values from each study a rea a r e recorded i n Tables I-IV i n t h e Appendix.
Several f ac to r s must be considered i n the i n t e r p r e t a t i o n o f t h e values of t h e f i v e parameters considered. Some o f these a r e inherent i n t h e sampling technique and o the r s a r e the r e s u l t o f na tu ra l va r i a t ions r e l a t i n g t o the environment and community in te rac t ions . One f a c t o r a f fec ted both by the sample design and by na tu ra l va r i a t ions was t h e s i z e of t h e r ea r ing f i s h t h a t were sampled.
The s i z e range o f the two major species sampled by the minnow t r a p s were from 48 mm (1.89 i n ) t o 205 mm (8.07 in ) f o r Dolly Varden and from 43 mm (1.69 in ) t o 132 mm (5.20 in ) f o r coho salmon. In general these s i z e s coincide with severa l age c la s ses t h a t represent t h e major por t ion of the rear ing f i s h population. Dolly Varden come i n t o t h e catchable s i z e range during the second season i n f r e sh water, o r a s one-year-old f i s h . Heiser (1966) gives a s i z e range from 21 mm (0.83 in ) t o 44 mm (1.73 in ) with a mean of 31.4 mm (1.24 in ) f o r zero-aged ( i .e . young-of-the-year) Dolly Varden i n Eva Creek on the e a s t coast o f Baranof Island. Thus zero-aged Dolly Varden a r e not included i n da ta obtained through t h e use of minnow t raps . Heiser 's study a l s o indica ted t h a t Dolly Varden usual ly migrate t o sea during t h e i r t h i r d o r four th year of l i f e , so the assumption was made t h a t Dolly Varden sampled by minnow t r a p s f e l l i n t o age groups I , 11, I11 and IV. Whether o r not t h i s assumption.holds f o r r e s iden t populations of Dolly Varden i n streams has not been determined.
A study by Crone (1968) indica ted t h a t coho salmon come i n t o the catchable s i z e range during t h e i r first year of l i f e , o r a s zero-aged coho f r y . This was apparent during the current study, s ince l a rge numbers of coho salmon from 45 mm (1.77 i n ) t o 50 mm (1.97 in ) appeared i n the minnow t r a p catches i n mid-July. In order t o el iminate most o f the zero-aged coho from the sample data , coho salmon <55 mm (2.17 in ) i n length were recorded separa te ly and were not includgd i n the ca lcu la t ion of any of the f ive parameters covered i n t h i s r epor t . According t o Crone's da ta
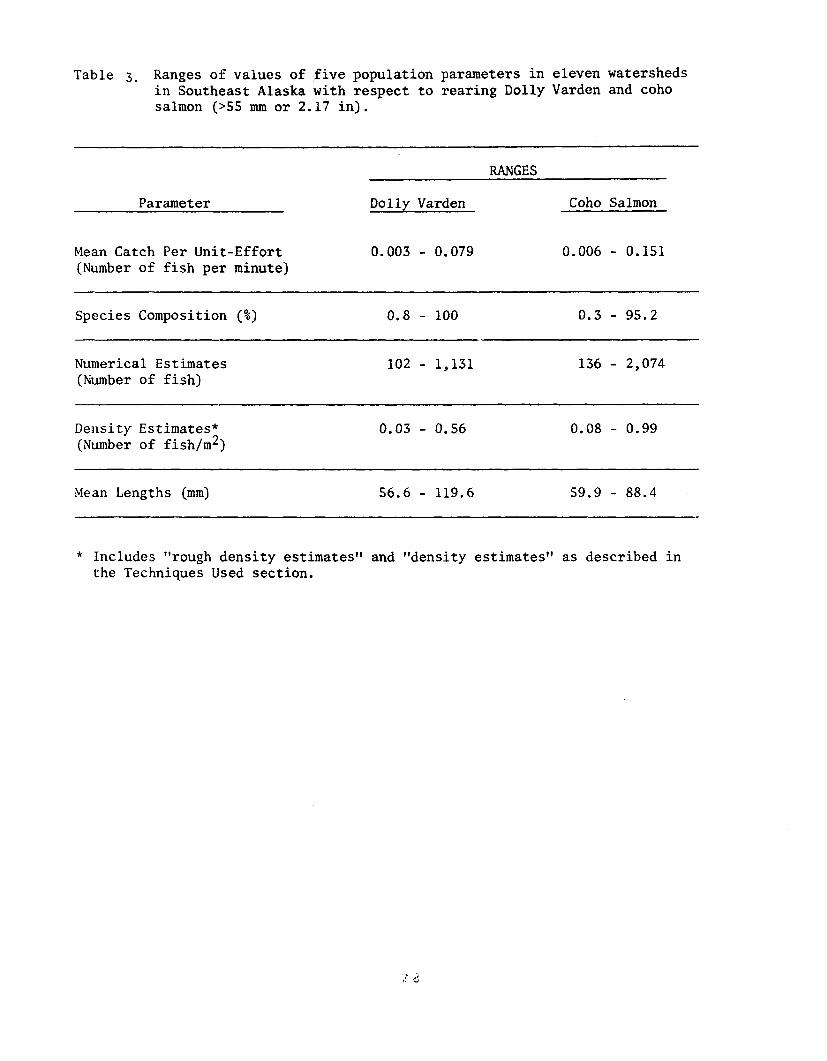
Table 3. Ranges of values of five population parameters in eleven watersheds in Southeast Alaska with respect to rearing Dolly Varden and coho salmon (~55 rnm or 2.17 in).
RANGES
Parameter Dolly Varden Coho Salmon
Mean Catch Per Unit-Effort 0.003 - 0.079 0.006 - 0.151 (Number of fish per minute)
- - -- --
Species Composition (%)
Numerical Estimates (Number of fish)
Density Estimates* (Number of fish/m2)
Mean Lengths (mm) 56.6 - 119.6 59.9 - 88.4
* Includes t'rough density estimatest1 and "density estimates" as described in the Techniques Used section.
from Sashin Creek on Baranof Is land the 55 mm (2.17 i n ) length e f f e c t i v e l y separa tes most zero-aged coho from one-year-old coho u n t i l t h e f a l l period, but from September on t h e r e was considerable overlap i n the lengths of zero-aged and one-year-old coho salmon. This overlap i n the f a l l months is probably one o f t h e reasons t h a t low mean lengths f o r coho salmon ( i . e . <67 mm o r 2.64 i n ) were recorded from the Keta River s tudy areas i n October.
An advantage o f el iminating zero-aged f i s h from t h e parameters evaluated i n t h i s r epor t is t h a t it reduces some o f t h e v a r i a b i l i t y i n t h e measurements t h a t would r e s u l t from the inc lus ion of the r e l a t i v e l y l a rge numbers of zero-aged f i s h which a r e present i n t h e stream during t h e summer months. Since one o f t h e main reasons f o r developing a short-term survey technique was t o obta in r e l i a b l e information t h a t was c lose ly r e l a t e d t o t h e product iv i ty o f a stream, the exclusion of t h e h ighly va r i ab le da ta associa ted with zero-aged f i s h was j u s t i f i e d and focused the e f f o r t s of t h e survey on the most s t a b l e por t ion of the rear ing f i s h populations. The concept t h a t one- and two-year-old coho salmon numbers represent a f a i r l y s t a b l e por t ion of the population i s supported by Crone's (1968) s tudy i n which t h e numbers o f re turning adu l t cohos and t h e numbers o f coho f r y var ied considerably from year t o year , while the numbers of one and two-year-old f inger l ings and the numbers o f emigrating coho smolt were r e l a t i v e l y s t a b l e from year t o year. Also, a s tudy by Chapman (1962) ind ica tes t h a t numbers of coho f r y occurring i n a stream during the spr ing , summer and f a l l periods may vary considerably because of downstream migration. The previous comments regarding t h e 55 mm (2.17 in ) length a s a reasonable dividing l i n e between zero-aged and one-year-old coho a r e a l s o supported by growth curves presented by Chapman.
The current study has assumed, the re fo re , t h a t the da ta obtained from the use of minnow t r a p s was representa t ive o f t h e most s t a b l e por t ion o f the popula- t i o n o f rear ing f i s h and r e f l e c t s the b io logica l product iv i ty of t h e stream.
Since one o f the major components of the sampling techniques involved the use of the Peterson method f o r est imating numbers of f i s h within the study area , an understanding o f the underlying assumptions necessary f o r t h e appl ica t ion o f the formula f o r ca lcu la t ing the adjus ted Peterson est imate was required. Ricker (1975) indica ted t h a t the following condit ions should be s a t i s f i e d :
1. The marked f i s h s u f f e r the same na tu ra l mor ta l i ty as t h e unmarked.
2. The marked f i s h a r c as vulnerable t o the f i sh ing being ca r r i ed on a s a r e the unmarked ones.
3. The marked f i s h do not lose t h e i r mark.
4 . The marked f i s h become randomly mixed with the unmarked; o r the d i s t r i b u t i o n of f i sh ing e f f o r t ( i n subsequent sampling) i s proport ional t o the number of f i s h present i n d i f f e r e n t p a r t s of the body of water.

5. A l l marks a r e recognized and reported on recovery.
6 . There is a neg l ig ib le amount of recruitment t o t h e catchable populat ion during the time the recoveries a r e being made.
In terms o f the sampling techniques employed during t h e current study d i f f e r e n t i a l e f f e c t s of na tu ra l mor ta l i ty with respect t o marked and unmarked f i s h were presumed t o be negl ig ib le . The b r i e f dura t ion of t h e capture-recapture periods ( i . e . two days) , e f f o r t s t o ensure t h a t marked f i s h f u l l y recovered from the anes the t i c before being returned t o t h e stream, and exclusion of zero-aged f i s h from t h e ca lcu la t ions helped t o minimize poss ib le e f f e c t s of d i f f e r e n t i a l mor ta l i ty .
The use of a caudal notch as a mark was f e l t t o have l i t t l e e f f e c t on the vu lne rab i l i ty of f i s h t o capture. The mark was temporary and became completely obscured by regenera t ive growth a f t e r a month o r two. A f a c t o r having g r e a t e r e f f e c t on t h e c a t c h a b i l i t y of f i s h during the recapture period is the amount o f salmon eggs used during the i n i t i a l capture period. I f too many eggs a r e used some of the f i s h may become s a t i a t e d during the i n i t i a l capture period and w i l l be l e s s inc l ined t o e n t e r t h e minnow t r a p s a second time. To avoid t h i s problem the b a i t s i z e used during the i n i t i a l capture period was l imi ted t o skein sec t ions l e s s than 38 mm (1 1 / 2 i n ) i n diameter, and a period o f 24 hours was allowed t o e lapse between the i n i t i a l capture period and the recapture period.
Because of the shor t time durat ion between trapping periods, l o s s o f marks was not a problem.
The four th condit ion l i s t e d by Ricker is the most d i f f i c u l t requirement t o be t e s t e d and more rigorous examipation w i l l be applied t o t h i s problem during fu tu re s tud ies . I t was assumed t h a t the appl ica t ion of a measured sampling design ( i . e . the placement of t r a p s a t 15.24 m o r 50 f t . i n t e r v a l s ) t o the presumably random d i s t r i b u t i o n o f rear ing h a b i t a t within a stream produced a random sample o f the population of r ea r ing f i s h . Conclusive s t a t i s t i c a l evidence f o r t h i s assumption was not obtained, howeve:r. An e f f o r t was made t o maximize the degree of mixing by re turning marked f i s h t o the same a rea from which they were taken.
Since the caudal notch was e a s i l y recognized, l i t t l e i f any e r r o r occurred because o f f a i l u r e t o record marked f i s h .
The s i x t h condit ion presented l i t t l e source of e r r o r i n terms of the present study because o f the r e l a t i v e l y instantaneous nature of the es t imate , because the sample s i t e s were usually blocked o f f during the trapping per iods , and because of the exclusion o f zero-aged f i s h . Recruitment could become a problem, however, i f repeated est imates were t o be made i n a stream over a long period of time.
One of t h e b e s t ind ica to r s o f the v a l i d i t y o f t h e Peterson est imates was the v a r i a t i o n expressed by the ca lcu la t ion of t h e 95% confidence i n t e r v a l s . These were determined by following t h e guidel ines out l ined by Seber (1973 pgs 62-64). Since most of t h e values associa ted with the calcula- t i o n of t h e Peterson est imates obtained during t h e current study indica ted t h a t t h e binomial d i s t r i b u t i o n was most appropriate f o r t h e approxi- mation o f confidence i n t e r v a l s , a l l o f t h e confidence i n t e r v a l s presented were obtained by ca lcu la t ing t h e two values o f R (number o f marked f i s h captured during the second trapping period) t h a t e s t ab l i shed t h e l i m i t s of 95% of the area under the binomial curve and then s u b s t i t u t i n g these values o f R i n t h e equation f o r the adjusted Peterson est imate t o obta in the 95% confidence i n t e r v a l . Examination o f t h e numerical es t imates and t h e i r confidence i n t e r v a l s obtained during t h e current s tudy ind ica ted t h a t , i n general , d i f ferences between population l eve l s were not de tec table using the s t a t i s t i c a l methods and the sampling techniques described i n t h i s r epor t unless one population est imate was a t l e a s t twice t h e s i z e of the o ther . This genera l iza t ion is made with respect t o the wide range of streams and h a b i t a t s t h a t were included i n t h e current s tudy. Smaller d i f ferences should be detec table i f comparisons a r e made between s i m i l a r streams with s i m i l a r h a b i t a t s during t h e same time period.
Several attempts were made t o c o r r e l a t e the population est imates with t h e o the r parameters measured. There were no s t a t i s t i c a l l y s i g n i f i c a n t l i n e a r co r re la t ions between the numerical es t imates and species composition, surface area , o r mean lengths. This was not su rp r i s ing s ince each o f these parameters were a f fec ted by a v a r i e t y o f f ac to r s associa ted with each stream, i t s ecology, and environment; and no attempt was made t o equalize o r evaluate a l l o f these e f f e c t s .
One p o t e n t i a l l y useful co r re la t ion d id emerge from t h i s study, however, and t h a t was t h e r e l a t ionsh ips between numerical est imates and mean ca tch pe r u n i t e f f o r t . I t must be emphasized t h a t t h i s r e l a t ionsh ip i s very t e n t a t i v e i n terms of the da ta t h a t is cur ren t ly ava i l ab le and t h a t extensive f i e l d t e s t i n g and de ta i l ed s t a t i s t i c a l analys is w i l l be required before any d e f i n i t e conclusion can be made.
However, with the r e l a t i v e l y small sample s i z e s i n the current study ( i . e . n=10 f o r Dolly Varden and n = l l f o r coho salmon) co r re la t ion of mean catch per u n i t - e f f o r ~ and the Peterson est imates yielded coef f i c i en t s o f determination ( i .e . , r values) o f 0.75 and 0.84, respect ive ly . Although d e t a i l e d analys is of t h i s r e l a t ionsh ip must await f u r t h e r study, these values point t o a l i n e a r r e l a t ionsh ip between t h e two parameters. I f fu tu re s tud ies subs tan t i a t e t h i s r e l a t ionsh ip , then a s t a t i s t i c a l model couid be developed which would enable the f i s h e r i e s b i o l o g i s t t o est imate numbers of rear ing f i s h from catch per u n i t - e f f o r t da ta . The p r a t i c a l benef i t s o f such a model would be a subs tan t i a l reduction ( a t l e a s t 1/2) o f the time and labor current ly required t o est imate the numbers o f rear ing f i s h i n streams i n Southeast Alaska.

LITERATURE CITED
Carle, F.L. 1976. An evalua t ion of t h e removal method f o r es t imat ing benth ic populat ions and d i v e r s i t y . Unpublished t h e s i s , Virg in ia Polytechnic I n s t i t u t e and S t a t e Universi ty, Blacksburg, Virg in ia .
Carle , F.L. and M.R. Strub. 1978. A new method f o r es t imat ing populat ion s i z e from removal da ta . Biometrics 34, 621- 630.
Chapman, D.W. 1962. Aggressive behavior i n juveni le coho salmon a s a cause of emigration. Jour . Fish. Res. Bd. Canada. 19(6): 1047-1080.
Crone, R.A. 1968. Behavior and su rv iva l o f coho salmon, Oncorhynchus kisutch (Walbaum), i n Sashin Creek, Southeastern Alaska. Unpublished t h e s i s , Oregon S t a t e Universi ty, Corva l l i s , Oregon.
Dinneford, W.B. 1975. Establishment o f guide l ines f o r p ro tec t ion o f t h e s p o r t f i s h resources during logging opera t ions . Alaska Dept. of Fish and Game. Federal Aid i n Fish Res tora t ion , Annual Performance Report, 1974-1975, Projec t F-9-7, 16(D-I-A) : 1-22.
. 1976. Establishment of guide l ines f o r p ro tec t ion of t h e s p o r t f i s h resources during land use a c t i v i t i e s . Alaska Dept. of Fish and Game. Federal Aid i n Fish Restorat ion, Annual Performance Report, 1975-1976, P ro jec t F-9-8, 17(D-I-A): 1-20.
E l l i o t t , S.T. 1978. Ecology of r ea r ing f i s h . Alaska Dept. o f Fish and Game. Federal Aid i n Fish Restorat ion, Annual Performance Report, 1977-1978, P ro jec t F-9-10, 19(D-I-B) : 39-51.
E l l i o t t , S.T. and R. Reed. 1973. Ecology o f r ea r ing f i s h . Alaska Dept. of Fish and Game. Federal Aid i n Fish Restorat ion, Annual Report of Progress, 1972-1973, P ro jec t F-9-5, 4(D-I-B) : 12-92.
Heiser , D.W. 1966. Age and growth of anadromous Dolly Varden char , SaZveZinus maha (Walbaun), i n Eva Creek, Baranof Is land, Southeastern Alaska. Alaska Dept. of Fish and Game, Research Report No. 5. 29 pp.
Hubart t , D. 1977. Establishment of guide l ines f o r p ro tec t ion of t h e spor t f i s h resources during land use a c t i v i t i e s . Alaska Dept. of F ish and Game. Federal Aid i n Fish Restorat ion, Annual Performance Report, 1976-1977, P ro jec t F-9-9, 18(D-I-A) : 1-23.
. 1978. Establishment o f guide l ines f o r p ro tec t ion of t h e spor t f i s h resources during land use a c t i v i t i e s . Alaska Dept. of Fish and Game. Federal Aid i n Fish Restorat ion, Annual Performance Report, 1977-1978, F-9-10, 19(D-].-A) : 1-38.
Reed, R. 1974. Establishment of guide l ines f o r p ro tec t ion of t h e s p o r t f i s h resources during logging operat ions. Alaska Dept. of Fish and Game. Federal Aid i n Fish Restorat ion, Annual Performance Report, 1973-1974, Projec t F-9-6, 15(D-I-A) : 1-8.
Reed, R. and R.H. Arnstrong. 1971. Effects o f logging on Dolly Varden. Alaska Dept. of Fish and Game. Federal Aid i n Fish Restorat ion, Annual Report o f Progress, 1970- 1971, Projec t F-9-3, 12CR-IV-B) : 13-21.
. 1971 Dolly Varden s p o r t f i sh ing - Juneau area . Alaska Dept. of Fish and Game. Federal Aid i n Fish Restorat ion, Annual Report of Progress, 1970-1971, Projec t F-9-3, 12(R-IV-C): 1-105.
Reed, R. and S.T. E l l i o t t . 1972. Effects o f logging on Dolly Varden. Alaska Dept. o f Fish and Game. Federal Aid i n Fish Restorat ion, Annual Report of Progress, 1971-1972, Projec t F-9-4, 13(R-IV-B): 1-62.
. 1973. Establishment of guidel ines f o r protec t ion of s p o r t f i s h resources during logging operat ions. Alaska Dept. of Fish and Game. Federal Aid i n Fish Restorat ion, Annual Report o f Progress, 1972-1973, Projec t F-9-5, 14(D-I-A) : 1- 11.
Ricker, W.E. 1975. Computation and i n t e r p r e t a t i o n o f b io log ica l s t a t i s t i c s of f i s h populations. Jour . Fish Res. Bd. Canada. Bull. No. 191. 382 pp.
Seber, G.A.F. 1973. The est imation o f animal abundance. Hafner Press, New York, N.Y. 506 pp.
U.S. Dept. o f Agriculture, Forest Service. 1978. Fisher ies t a sk force working repor t . Juneau, Alaska. 39 pp.
U.S. Dept. of Agriculture, Forest Service; Alaska Dept. of Fish and Game; and Alaska Dept. o f Natural Resources. 1973. Logging and Fish Habitat . Juneau, Alaska. 22 pp.
Prepared by : Approved by :
Dennis Hubartt Fishery Biologis t
Rupert E . Andrews, Director Sport Fish Division
Mark C. Warner, Ph.D. Sport Fish Research Chief

APPEND I X

- Table I . Mean catch per u n i t - e f f o r t (CPUE) from minnow trapping d a t a , 1978
- CPUE FOR EACH SPECIES (no. fish/min)
Study Area Date DV SS - CT - RT
... ... ... Switzer Creek Apri l 20 0.023 ... ... Apri l 24 0.026 ... ... ... June 29 0.025 ... ... ... Jordan Creek May 4 0.008 0.110 ... ... May 5 0.003 0.058 ... ... J u l y 20 0.020 0.037 ... ... Aug. 10 0.032 0.054 ... ... Aug. 11 0.030 0.049
... ... Montana Creek Aug. 7 0.003 0.019 ... ... Aug. 8 0.020 0.015
Peterson Creek Aug. 2 Aug. 3
North Hood Bay Aug. 29 Aug. 30
Big Bay I n l e t #1 June 20 June 21
Big Bay I n l e t #2 June 22 June 23
... ... Olive Cove J u l y 6 0.044 ...
... ... Ju ly 7 0.079 ... C.T. & R.T. COMBINED
Luck Creek June 13 0.032 0.022 0.010 June 14 0.023 0.021 0.003
Luck Creek Tributary June 14 0.022 0.013 0.005 June 15 0.033 0.011 0.002
C.T. R.T. ... Red Lake I n l e t J u l y 11 0.018 0.025 0.008 July, 12 0.023 0.035 . . . 0.006
... ... Fl icker Creek July, 13 0.026 0.015
H i l l Creek Slough Aug. 16 0.058 0.042 ... ... Aug. 17 0.047 0.051 ... . . . Oct. 24 0.076 0.151 ... ...
Logjam Slough Aug. 18 0.004 0.021 ... ... Aug. 19 0.009 0.019 ... ...
K.S. - Cabin Slough Oct. 2 0 0.008 0.027 0.003
Oct. 2 1 0.010 0.028 0.005
- * Does not include coho salmon <_55 mm (2.17 in ) in length.

Table I . Mean ca tch pe r u n i t - e f f o r t (m) from minnow t rapp ing d a t a , 1978
- CPUE FOR EACH SPECIES (no. f ishlmin)
Study Area Date DV - SS - CT - RT -
Switzer Creek Apr i l 20 Apr i l 24 June 29
Jordan Creek May 4 May 5 J u l y 20 Aug. 10 Aug. 11
... ... Montana Creek Aug. 7 0.003 0.019 ... ... Aug. 8 0.020 0.015
... Peterson Creek Aug. 2 0.001 0.019 0.002 ... Aug. 3 0.001 0.029 0.004
... ... North Hood Bay Aug. 29 0.033 0.006 ... ... Aug. 30 0.032 0.007
... ... Big Bay 1n.let # 1 June 20 0.016 0.006 ... June 21 0.017 ... 0.003
... ... Big Bay I n l e t #2 June 22 0.017 0.008 ... June 23 0.020 ... 0.005
... ... ... Olive Cove! J u l y 6 0.044
... ... ... J u l y 7 0.079
C.T. & R.?. COMBINED Luck Creek: June 1 3 0.032 0.022 0.010
June 14 0.023 0.021 0.003
Luck Creek Tr ibu ta ry June 14 0.022 0.013 0.005 June 15 0.033 0.011 0.002
C.T. R.T. ... Red Lake I n l e t Ju ly 1 1 0.018 0.025 0.008 ... Ju ly 1 2 0.023 0.035 0.006
... F l i c k e r Creek J u l y 13 0.026 0.015 . .
... ... H i l l Creek Slough Aug. 16 0.058 0.042 ... ... Aug. 17 0.047 0.051 ... Oct. 24 0.076 0.151 ... ... ... Log j an1 S.lough Aug. 18 0.004 0.021
Aug. 19 0.009 0.019 ... ... K.S.
Cabin Slough Oct. 20 0.008 0.027 0.003 Oct. 21 0.010 0.028 0.005
Does not include coho salmon 255 mm (2.17 i n ) i n length.

Table 11. Species composition from minnow trapping data.
Percent Percent Percent Percent Percent Percent Percent Study Area - DV SS CT RT SB SC KS -- --
... ... ... ... Switzer Creek 99.40 0.30 0.30
... Jordan Creek 21.60 75.50 0.05 0.05 0.90 1.80
... ... ... ... Montana Creek 27.00 60.00 13.00
... ... Peterson Creek 0.80 92.90 3.00 0.10 3.20
... ... ... North Hood Bay 46.90 14.00 0.40 38.70
... ... ... ... Big Bay In le t 1 80.00 ... 20.00
... ... ... ... Big Bay In l e t 2 74.00 ... 26.00
... ... ... ... ... Olive Cove 100.00 ... ... Luck Creek SO. 00 37.00 13.00 (CT & RT) ... ...
Luck Creek Tributary 57.00 34.00 9.00 (CT & RT) ... ... ... Red Lake In l e t 30.60 53.60 0.40 11.40 2.60 1.30 ... Flicker Creek 42.00 56.90 ... 0.70 ... 0.40 ...
... H i l l Creek Slough 23.10 74.60 ... ... 0.60 1.70
Logjam Slough 4.70 95.20 ... ... ... 0.10 ... Cabin Slough 10.00 85.00 ... ... ... ... 5.00
----- -..-- - Note: Includes coho salmon (55 mm (2.17 in) in length.

Table 111. Estimates of numbers of Dolly Varden and coho salmon with 95% confidence intervals.
DOLLY VARDEN - COHO SALMON* Study Area -- Estimate Confidence ~nterF! - -- Estimate~ ~nterva~
Switzer Creek 353 260 - 552 ... ... ... Jordan Creek (blayj 102 68 - 204 2.074 1,713 - 2,543 Jordan Creek (Aug) 221 199 - 256 606 531 - 726
Montana Creek 149 85 - 397 363 242 - 636
Peterson Creek ... ... ... 476 338 - 748
North tlood Bay
Big Bay Inlet #I
Big Bay Inlet #2 151 120 - 213 ... ... . . Olive Cove
Luke Creek
Luck Lake Tributary 448 305 - 840 202 127 - 346
Red Lake Inlet 369 286 - 545 620 503 - 790
Flicker Creek ... ... ... ... ... ... Hill Creek Slough 1,131 870 - 1.560 1,081 833 - 1,538 Logjam Slough ... ... ... 785 448 2,093
Cabin Slough ... ... ... 825 550 - 1,467 -- --
* Does not include coho salmon 5 5 mm (2.17 in) in length.

Table IV. Estimated surface areas of sample sites and density estimates of populations of rearing Dolly Varden and coho salmon.
Study
Switzer Creek*
Jordan Creek (May)* Jordan Creek (Aug)*
Montana Creek
Peterson Creek
North Hood Bay*
Big Bay Inlet 1**
Big Bay Inlet 2**
Olive Cove*
Luck Creek**
Luck Creek Tributary**
Red Lake Inlet*
Hill Creek Slough*
Logjam Slough**
Cabin Slough**
SURFACE AREA DENSITY ESTIMTES (fish/m2)
DV - SS *** -
0.56 ... 0.05 0.99 0.11 0.29
0.04 0.10
... 0.15
0.20 0.08
0.03 . . . 0.32 ... 0.33 . . . 0.12 0.08
0.40 0.18
0.32 0.55
0.38 0.36
*.. 0.21
... 0.36
* Surface area'estimated using measured trapezoids.
* * Surface area estimated using paces (see Techniques Used section).
*** Does not include coho salmon - <55 m (2.17 in) in length.

Table V. Mean lengths and standard deviat ions of Dolly Varden and coho salmon from minnow trapping data .
DOLLY VARDEN COHO SALMON* Mean Mean
Sample Length Standard Sample Length Standard Study Area s i z e (mm) Deviation s i z e (mm) Deviation
Switzer Creek (April) 96 77.8 15.5 ... ... ... Jordan Creek (May) 8 88.9 14.0 171 84.4 18.1 Jordan Creek (July) 90 117.5 19.5 168 80.0 8.7 Jordan Creek (August) 72 119.6 24.0 131 80.9 7.6
Montana Creek (August) 16 105.7 27.4 94 79.6 7.9
Peterson Creek (August) ... ... ... 91 79.9 16.0
North Hood Bay (August) 167 88.6 21.1 27 64.0 9.5
Big Bay I n l e t #1 (:June) 84 81.7 22.5 ... ... . . Big Bay I n l e t #2 (:June) 66 81.8 18.0 ... ... ... Olive Cove (July) 223 96.0 14.8 ... ... ... Luck Creek (June) 196 75.9 16.0 130 69.4 7.4
Luck Creek Trib. (June) 94 69.8 12.8 54 69.1 9.1
Red Lake I n l e t (July) 108 86.3 18.8 132 88.4 15.9
F l icker Creek (July) 116 77.9 12.0 69 83.4 6.5
H i l l Creek Slough (Aug) 259 86.6 17.3 198 75.2 11.6 H i l l Creek Slough (Oct) 142 61.4 12.5 252 62.3 6.4
Logjam Slough (October) 18 75.0 24.1 85 66.2 8.6
Cabin Slough (October) 34 56.6 6.4 119 59.9 4.3
* Does not include coho salmon 5 5 mm (2.17 i n ) in length.