splunk enterprise for it troubleshooting hands-on
TRANSCRIPT

Copyright©2016SplunkInc.
DeliveringNewVisibilityandAnalyticsforITOperations
JulianHartyKirkHanson

2
Just1thing…
2
http://bit.ly/2fZzLu0

3
SessionObjectives
ü BasicSplunkNavigation– wheredoyoustart?
ü ExtractingFields
ü Alertingü Reportinganddashboarding
ü TroubleshootingwithSplunk

4
EscalatingITComplexity…
SaaS/PaaS
IaaS
VIRTUALIZATION
STORAGE
PACKAGEDAPPLICATIONS
CUSTOMAPPLICATIONS
HR
Finance
AppSvrDB
WebSvr
INFRASTRUCTUREAPPLICATIONS
VPN
IPPhoneIdentify
SERVERS NETWORKING
4
5
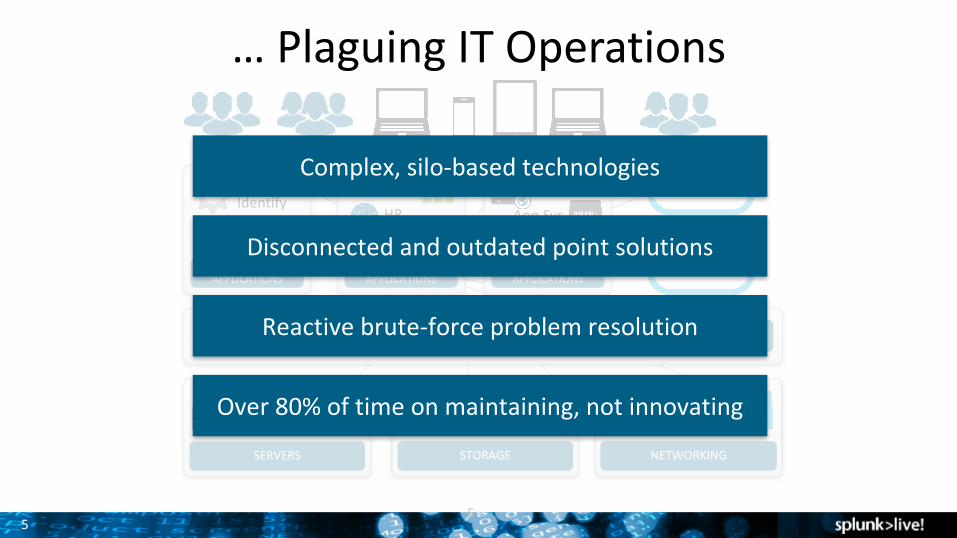
…PlaguingITOperations
SaaS/PaaS
IaaS
VIRTUALIZATION
STORAGE
PACKAGEDAPPLICATIONS
CUSTOMAPPLICATIONS
HR
Finance
AppSvrDB
WebSvr
INFRASTRUCTUREAPPLICATIONS
VPN
IPPhoneIdentify
SERVERS NETWORKING
Complex,silo-basedtechnologies
Disconnectedandoutdatedpointsolutions
Reactivebrute-forceproblemresolution
Over80%oftimeonmaintaining,notinnovating
5

6
EnterpriseScalability
Industry-LeadingPlatformforMachineDataAnyMachineData OperationalIntelligence
OnlineServices Web
Services
ServersSecurity GPS
Location
StorageDesktops
Networks
PackagedApplications
CustomApplicationsMessaging
TelecomsOnline
ShoppingCart
WebClickstreams
Databases
EnergyMeters
CallDetailRecords
SmartphonesandDevices
RFID
PrivateCloud
PublicCloud
SearchandInvestigation
ProactiveMonitoring
OperationalVisibility
Real-TimeBusinessInsights
6
Datacenter
Containers

7
EnterpriseScalability
AnyMachineData OperationalIntelligence
OnlineServices Web
Services
ServersSecurity GPS
Location
StorageDesktops
Networks
PackagedApplications
CustomApplicationsMessaging
TelecomsOnline
ShoppingCart
WebClickstreams
Databases
EnergyMeters
CallDetailRecords
SmartphonesandDevices
RFID
Datacenter
PrivateCloud
PublicCloud
Containers
SearchandInvestigation
ProactiveMonitoring
OperationalVisibility
Real-TimeBusinessInsights
Industry-LeadingPlatformforMachineData
Anyamount,anylocation,anysource
Schema-on-the-fly
Universalindexing
NobackendRDBMS
Noneedtofilterdata
7

8
TheFocus
ApplicationDelivery
ITOperations
Security,ComplianceandFraud
BusinessAnalytics
InternetofThingsandIndustrialData
DeveloperPlatform(RESTAPI,SDKs)
8

9
TurningMachineDataIntoOperationalIntelligence
Reactive
Proactive
9
ProactiveMonitoringandAlerting
Real-TimeBusinessInsightOperational
Visibility
Searchand
Investigate

10
IndexandAnalyzeDataAcrossYourTechnologyStackSplunkAdd-Ons,TemplatesandAppsAccelerateValueFromMachineData
Norigidschemas– addindatafromanyothersource.
APISDKs UI
Server,Storage,Network
Virtualization,Containers
OperatingSystems+Databases
CustomApplications
BusinessApplications CloudServices
WebIntelligence
MobileApplications
Stream
OperationsandServiceDesks
AppPerformanceMonitoring
DBConnect
10

11
TroubleshootingWithSplunkØ InstallSplunk(installersonUSBkeys)Ø StartSplunk
Ø splunk start--accept-license--answer-yes--no-prompt
Ø LoginØ http://localhost:8000Ø Defaultcredentials:admin/changeme
Ø InstallappØ Clickthewidgetnextto“Apps”Ø InstallappfromfileØ ChoosetheappfromtheUSBkey
Ø RestartSplunk

12
LogintoSplunk
ClickSearch&ReportingtogetstartedusingSplunk!

13
SearchingwithSplunk
Startbytyping*inthesearchbar!

14
SearchResults
Exploretheresults!
ClickonhostClickonsourcetype
Lookattheotherfields
Next,we’llextractnewfields!

15
ExtractingFields
15
Startwiththissearch:sourcetype=customlog
ThenscrolldownandclickonExtractNewFields atthebottomofthefieldlist.

16
ExtractingFields
Clickonanyeventinthelist
Fieldsthatarealreadybeingextractedarehighlighted.
ClickNexttocontinue

17
ExtractingFields
Choose RegularExpression
Don’tworry– wewon’tbewritinganyregexes!
ClickNext

18
ExtractingFields
Clickanddragtohighlightthelastfield(itwillbeOKorNSF)
Typestatus_descriptionintheFieldNamebox
ClickAddExtraction

19
ExtractingFields
19
Checkoutthestatus_descriptioncolumn!
ClickNext

20
ExtractingFields
20
NoticethePermissions
(Youdon’tneedtochangeanythingnow,butyoumayneedtolookthisupondocs.splunk.comlaterifyouhavetrouble!)
ClickFinish
YournewfieldisnowEXTRACTED!

21
ExtractingFields
21
ClickonExplorethefieldsIjustcreatedinSearch
Whenyoursearchresultsshowup,expandaneventbyclickingon the>
Checkoutyournewfield!

22
Yah…
…showmehowtosearch...Andshowmehowtosearchfor“statusdescription”

23
TroubleshootingInfrastructureWehavereportsofproblemsonthewebsite,solet’ssearchsourcetype=access*
Lookattheavailablefields–feelfreetoexplore!
Clickonthestatus fieldtoseethetopvalues
ClickonTopvaluesbytime

24
TroubleshootingInfrastructure
24
ChangethegraphfromaLine toaColumn
ChangeFormat toStacked
Nowwecanseethedistributionofstatuscodesoverthelasthour!
Clickon503 inthelegendonthefarright

25
TroubleshootingInfrastructure
25
Nowwecanseealltheeventswitha503status!
Add |statscountbyhosttoyoursearchtoseehowmany503statuscodeseachserverhas
sourcetype=access*status=503|statscountbyhost
Nowwecanseethatwebserver-01hasmoreerrors!
Click webserver-01thenclickNewSearch

26
TroubleshootingInfrastructure
26
Noticethatyoursearchisnow*host=“webserver-01”
Clickonsourcetype toseewhatkindsofdatawehave
Let’sstartbycheckingfordiskspaceproblems– clickondf

27
TroubleshootingInfrastructure
27
Noticethatyoursearchisnow*host=“webserver-01”sourcetype=df
Scrolldownandclick on thefieldPercentUsedSpace
ClickonMaximumvalueovertime
Thiswillhelpusseeifwehaveadiskfullproblem!

28
TroubleshootingInfrastructure
28
Nodiskspaceissueshere– themaximumdoesn’tgomuchover70%!
Let’schangeoursearchtolookforadifferentsourcetype– modifythesearchtolookforCPUdata
Yoursearchshouldlooklikethis:*host=“webserver-01”sourcetype=cpu
29
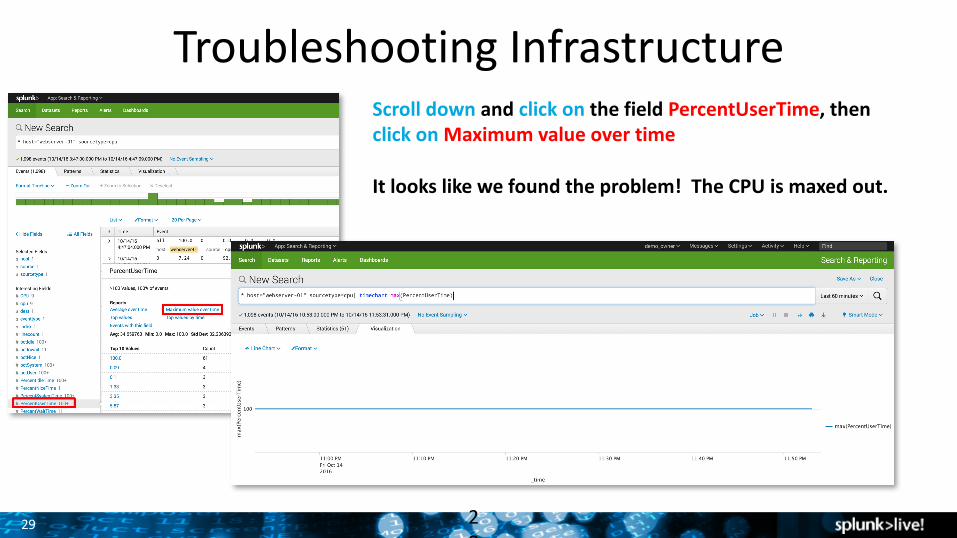
TroubleshootingInfrastructure
29
ScrolldownandclickonthefieldPercentUserTime,thenclickonMaximumvalueovertime
Itlookslikewefoundtheproblem!TheCPUismaxedout.

30
TroubleshootingApplications
30
Nowsearch for error
Manyresultsarecomingfromatestmachine– onanyeventwherehost=test-01,click test-01,thenclickExcludefromsearch
Yoursearchwillnowbeerrorhost!=“test-01”
TheeventsthatremainindicateaproblemwithoneoftheMySQLservers–whichone?

31
TroubleshootingApplications
31
Itlookslikemysql-02istheserverhavingissues
Theerrorsshowaproblemwritinglogfiles,solet’scheckfordiskspaceissues
Search for host=mysql-02sourcetype=df
Click on PercentUsedSpace andchoose Maximumvalueovertime

32
Yah…
…fixwhat’swrong!

33
CreatinganAlert
33
Wefoundtheproblem– afulldisk!
Butwouldn’tanalertbebetter?
Timechart isgreatfordataovertime,butlet’schangethesearchtousestats,whichwillgiveusasinglenumberontheStatisticstab
Tomakeiteasiertoread,we’llrenamethefieldmax(PercentUsedSpace)tomaxused byaddingasmaxused totheendyoursearch
Nowyoursearchshouldbehost=mysql-02sourcetype=df |statsmax(PercentUsedSpace)asmaxused

34
CreatinganAlert
34
Click SaveAsandchoose Alert tobringupthesettings
Add a Title
Set a scheduleor choose Real-time
Set TriggerConditions– use themaxused field thatwecreated
Throttlealertstoreducenoise
Set anActionforthealert
That’sit!

35
Yah…
…makeitsothatneverhappensagain

36
CreatingReportsStartwiththesamesearchasforthealert:host=mysql-02sourcetype=df |statsmax(PercentUsedSpace)asmaxUsed
OntheVisualization tab,choose RadialGaugeasthecharttype
Youcanchangethecolorthresholdsbychoosing ColorRangesunderFormat
Click SaveAsandchoose Report

37
CreatingaDashboardFromyourreport,click AddtoDashboard tocreateanewdashboard
Click Editsowecanaddmoreinformationtothisdashboard
Click AddPanel,thenchoose ASamplePanelfromAddPrebuiltPanel
Thispanelshowsthediskspaceforanotherserver– mysql-03
Rearrangepanelsbydragginganddropping
38
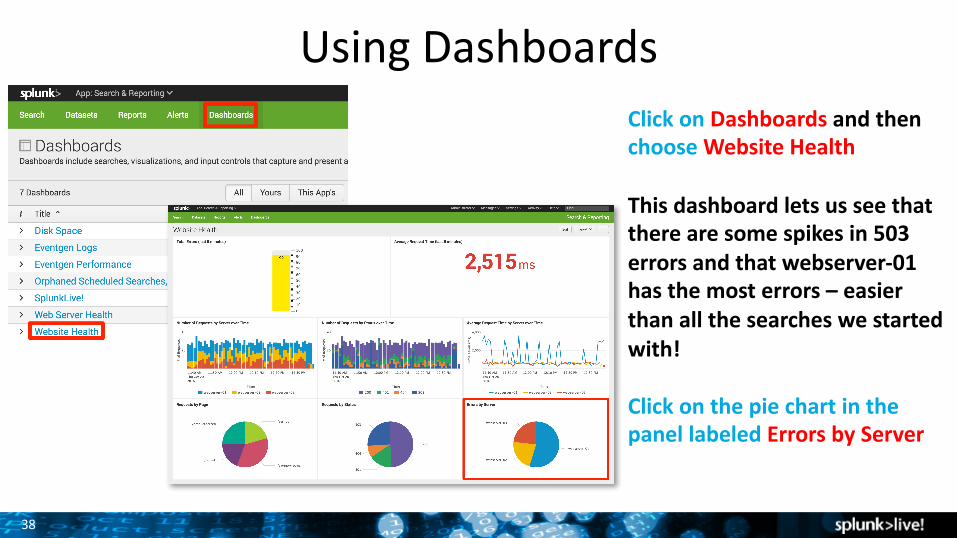
UsingDashboardsClick on Dashboards andthenchoose WebsiteHealth
Thisdashboardletsusseethattherearesomespikesin503errorsandthatwebserver-01hasthemosterrors– easierthanallthesearcheswestartedwith!
Click onthepiechartinthepanellabeledErrorsbyServer

39
UsingDashboards
ThisdashboardshowsussomeOSstatistics,andwecanseetheCPUissuewithwebserver-01intheMaximumCPUbyServeroverTimepanel
Dashboardsletustroubleshootcommonproblemsfaster!

40
Yah…
…thatwasgreeeatttbutitwasn’tprettyenoughcanyoumakemeadashboard?
41
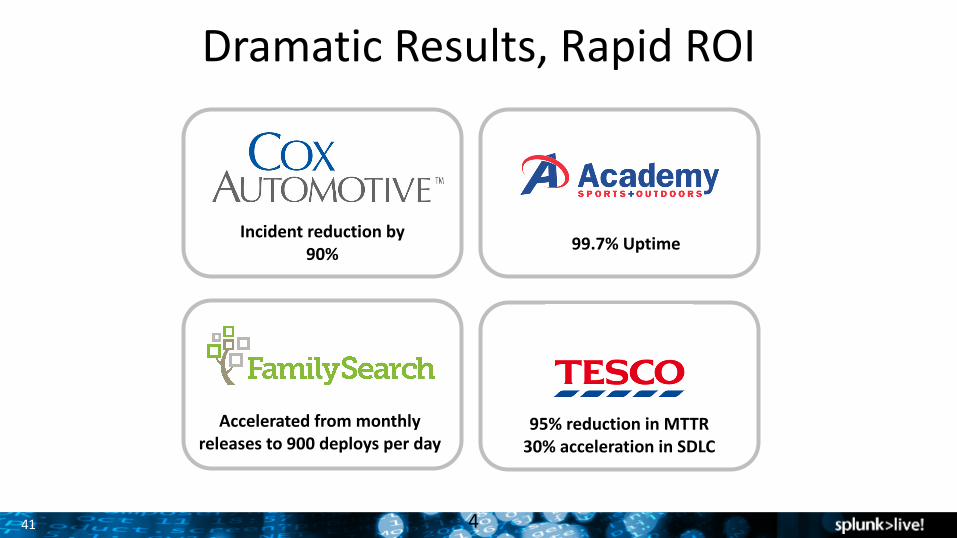
DramaticResults,RapidROI
41
99.7%Uptime
Acceleratedfrommonthlyreleasesto900deploysperday
Incidentreductionby90%
95%reductioninMTTR30%accelerationinSDLC

42
Nowwhat?
42
Full-featuredplatformforreal-timeOperationalIntelligenceDownloadSplunk Enterpriseforfree!
SplunkEnterpriseasacloudserviceTryoutSplunk Cloud withafreetrial!
FeelfreetokeepworkingwiththedatafromyourUSBkey!
LearnmorewithSplunk Education!

43
SessionObjectives- Reviewed
ü BasicSplunkNavigation– wheredoyoustart?
ü ExtractingFieldsü Alertingü Reportinganddashboarding

44
Andremember.....
IfyouuseSplunk youwillNEVERhearthisagain!

45
ThankYou

46
MarkYourCalendars!• .conf2017isgoingtoDC!• Sept25-28,2017• WalterEWashingtonConventionCenter
• 5,000+ITandBusinessProfessionals• 175+Sessions• 80+CustomerSpeakers
PLUSSplunk University• Threedays:Sept23-25,2017• GetSplunk CertifiedforFREE!• GetCPEcreditsforCISSP,CAP,SSCP