splunk architecture guide - cstor innovative it solutions...
TRANSCRIPT

Worldwide Consulting Solutions | WHITE PAPER | Managing Citrix with Splunk
www.citrix.com
Managing a Citrix Desktop
Virtualization Architecture with
Splunk
Page 2
Contents
Overview ............................................................................................................................................................. 3
An Introduction to Splunk ............................................................................................................................... 4
How Splunk works ............................................................................................................................................ 4
Deploying Splunk inside virtual environments .......................................................................................................... 6
Features ............................................................................................................................................................... 7
Sample architectures ........................................................................................................................................ 13
Scenario 1 – XenApp / XenDesktop mixed ............................................................................................................ 13
Scenario 2 – Multiple Data Centers ........................................................................................................................... 17

Page 3
Overview
Monitoring a XenDesktop, XenApp or Provisioning Services environment is critical – to proactively
address issues before impact to the user community, to gain an in-depth understanding of current
and expected behavior and to track the normal vs. abnormal operations of your environment to
trend and plan for capacity.
To get the most value out of your data, correlations must be made between the various components
of the solution stack. For instance, a typical XenDesktop solution encompasses Desktop Brokers,
Microsoft Windows Operating Systems, Microsoft SQL Servers, Hypervisors, web servers, Citrix
Netscalers, network switching infrastructure, shared storage, etc. Each of these components
produces machine data that can be very valuable to the organization for troubleshooting, capacity
planning, risk mitigation, chargeback, real-time visibility and operational intelligence.
Correlating events among the various components allows the organization to get an end-to-end
perspective of their operational environment. The various components produce data in a variety of
formats. Some components may produce a syslog, others write Windows Events, while other events
may only be available via scriptable output. Furthermore, data may be structured or unstructured;
demanding a monitoring solution like Splunk that can make correlations of any machine data. A
light-weight solution with no database schema or custom connectors, Splunk easily turns machine
data into searchable, visual, and meaningful entities that can be used to gain meaningful insights
critical to maintaining uptime and guaranteeing performance and achieving operational visibility and
business intelligence, .
VDI failures often occur in production due to improper capacity planning and monitoring. In this
whitepaper we will discuss how Splunk takes the guesswork out XenDesktop, network, storage,
hypervisor, NetScaler and more.
Page 4
An Introduction to Splunk
Splunk is an engine for machine data that efficiently and effectively collects indexes and harnesses
machine data generated by IT systems and infrastructure, providing powerful benefits to IT and the
business. Splunk can ingest data from just about any source, such as network traffic, custom
applications, application servers, hypervisors, GPS systems, PBXs and IP telephony systems, stock
market feeds, systems metrics, social media, file systems, including pre-existing structured databases,
if necessary.
Splunk helps to make sense of machine data. Splunk handles both the form and the semantics of
machine data. It accomplishes this through a unique approach of universally indexing any machine
data from across any element of the infrastructure. Splunk does this without requiring costly
connectors or agents or filtering or parsing the data to load it into a database. By providing users an
index of all the machine data generated by all systems and infrastructure, Splunk enables users to ask
any question and find answers quickly to the most simple or strategic propositions and develop role-
based views and dashboards for real-time visibility and analytics for operational intelligence.
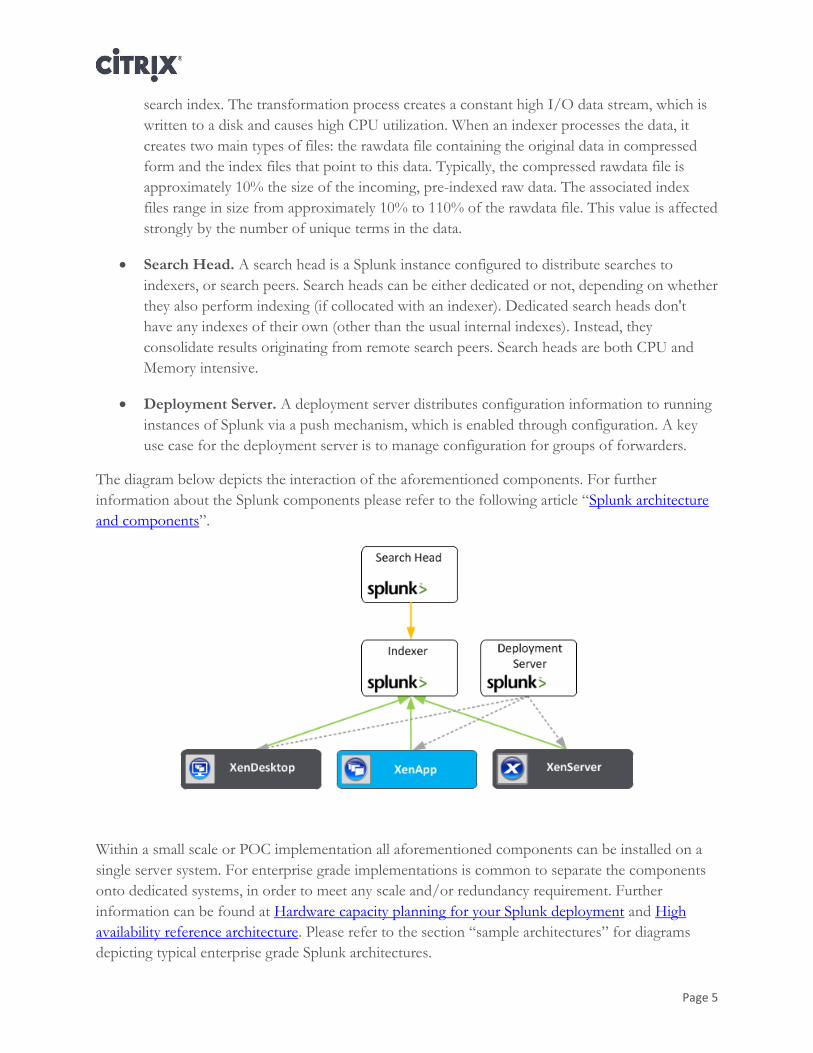
How Splunk works
The Splunk architecture is made up of four components, which can be installed on a large variety of
operating systems:
Forwarder. The Forwarder agent is installed wherever data needs to be collected directly
from endpoints in real-time. It can monitor local application logfiles, capture the output of
status commands on a schedule, grab performance metrics from virtual or non-virtual
sources or watch the file system for configuration, permissions and attribute changes.
Forwarders come in two flavors.
o The Universal Forwarder is a lightweight agent, which just can forward data to an
indexer or another forwarder (intermediate forwarding)
o The Heavy Forwarder has a smaller footprint than a Splunk indexer but retains
most of the capability, except that it lacks the ability to perform distributed searches.
Unlike the universal forwarder, a heavy forwarder parses data before forwarding it
and can route data based on criteria such as source or type of event. It can also index
data locally while forwarding the data to another Splunk indexer.
Note: Splunk also provides agentless solutions to send data to Splunk. Read more here.
Note: Please follow the steps outlined here, when deploying the forwarder as part of a
shared image (PVS/MCS scenarios).
Indexers. Splunk indexers, or index servers, provide indexing capability for local and remote
data and host the primary Splunk data store, as well as the Splunk Web interface. The main
duty of these systems is transforming raw data into events and placing the results into a
Page 5
search index. The transformation process creates a constant high I/O data stream, which is
written to a disk and causes high CPU utilization. When an indexer processes the data, it
creates two main types of files: the rawdata file containing the original data in compressed
form and the index files that point to this data. Typically, the compressed rawdata file is
approximately 10% the size of the incoming, pre-indexed raw data. The associated index
files range in size from approximately 10% to 110% of the rawdata file. This value is affected
strongly by the number of unique terms in the data.
Search Head. A search head is a Splunk instance configured to distribute searches to
indexers, or search peers. Search heads can be either dedicated or not, depending on whether
they also perform indexing (if collocated with an indexer). Dedicated search heads don't
have any indexes of their own (other than the usual internal indexes). Instead, they
consolidate results originating from remote search peers. Search heads are both CPU and
Memory intensive.
Deployment Server. A deployment server distributes configuration information to running
instances of Splunk via a push mechanism, which is enabled through configuration. A key
use case for the deployment server is to manage configuration for groups of forwarders.
The diagram below depicts the interaction of the aforementioned components. For further
information about the Splunk components please refer to the following article “Splunk architecture
and components”.
Within a small scale or POC implementation all aforementioned components can be installed on a
single server system. For enterprise grade implementations is common to separate the components
onto dedicated systems, in order to meet any scale and/or redundancy requirement. Further
information can be found at Hardware capacity planning for your Splunk deployment and High
availability reference architecture. Please refer to the section “sample architectures” for diagrams depicting typical enterprise grade Splunk architectures.
Page 6
Deploying Splunk inside virtual environments
There are several performance factors to consider when deploying Splunk as virtual machines.
These considerations are disk, storage, CPU and memory resources.
Disk. Splunk indexers are usually CPU-and disk I/O intensive, so disk exposed to these
indexers within virtual machines should be capable of 800-1000 I/O operations / second
(IOPS). In virtual environments, with virtual machines moving from one type of storage to
another, there is less control or guarantee over the type of disk that Splunk virtual machines
can access. In VMware environments specifically, VMFS introduces another layer of latency
in disk I/O and can impact Splunk performance by as much as 30%.
CPU. Since Splunk search heads and indexers are CPU intensive, sharing CPU with other
virtual machines running on the same host can result in high wait times, which might impact
Splunk performance. CPU sharing should be restricted or Splunk indexer/search virtual
machines should be given higher priority to ensure good performance.
Memory. Available Memory is critical for Splunk search heads and indexers. Splunk virtual
machines should have reserved memory available to them. Hosts running Splunk should not
be configured with memory overcommit, as overcommitting memory might result in poor
performance.
Page 7
Features
One of the ways Splunk collects data about an environment is by utilizing a Technology Add-on
(TA). TA’s are responsible for collecting information about specific environments, such as XenApp and XenDesktop, and forwarding the information to a Splunk indexer. Splunk has pre-packaged
TAs for many components in a Citrix environment (XenApp, XenDesktop, XenServer, Netscaler).
These TAs are open-source and fully functional; however, they can easily be modified to custom-fit
a specific environment easily.
Once data is in a Splunk index, Splunk’s simple interface provides for a very powerful search
language, providing instant and rapid access to raw data in an easily consumable manner. The search
language also acts as the foundation for setting up alerts, creating reports and build visual
dashboards.
The Splunk Apps for Citrix solutions provide out-of-the-box reports that allow you to get complete
visibility into a virtualized Citrix environment. With these Apps,
- Build performance assurance into your Citrix environment to deliver performance, user
satisfaction and proactively manage uptime with pre-emptive alerts on the right performance
metrics
- Prevent common problems in storage, network, compute and memory tiers by correlating
multiple sources of data within Splunk
- Gain visibility into the real-time status of Citrix XenApp, XenDesktop, XenServer and
Netscaler environments for maximum reliability, performance and scalability
- Efficiently plan for capacity with usage and system metrics on the Xen* environments
In the example below, we will look at how to build a dashboard for XenApp server load and set up
an alert for a high server load.
Further information about the Splunk Search Language can be found within the Splunk Quick
Reference Guide:

Page 8
Step 1 – Search the raw data in a Splunk index
The figure below shows what the raw data for XenApp looks like in a Splunk index.
Page 9
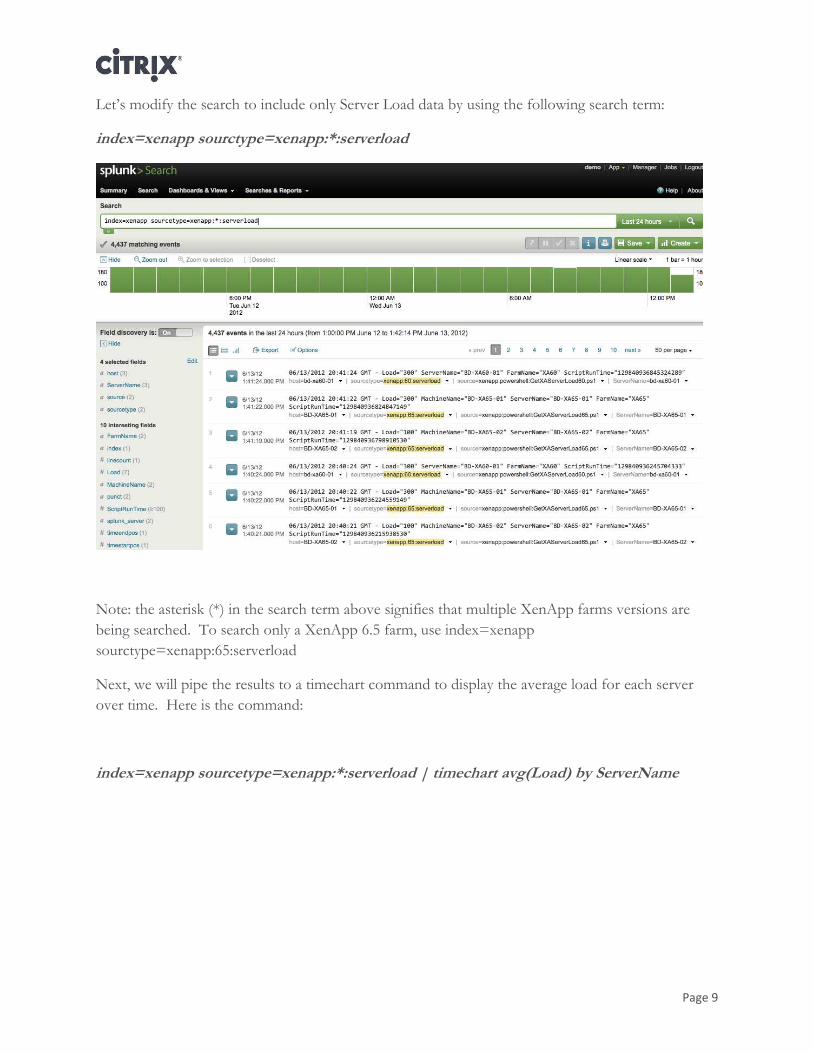
Let’s modify the search to include only Server Load data by using the following search term:
index=xenapp sourctype=xenapp:*:serverload
Note: the asterisk (*) in the search term above signifies that multiple XenApp farms versions are
being searched. To search only a XenApp 6.5 farm, use index=xenapp
sourctype=xenapp:65:serverload
Next, we will pipe the results to a timechart command to display the average load for each server
over time. Here is the command:
index=xenapp sourcetype=xenapp:*:serverload | timechart avg(Load) by ServerName

Page 10
Here are the results:
This information isn’t very consumable by a human, so let’s turn this information into an area chart. To do this, click the chart button option and choose “area chart”

Page 11
Now, from the visualization of the data, we can see the server named BD-XA65-02 was under high
load but dropped off a little after 8:00 AM.
It is easy to turn this search and chart into a dashboard panel that can be used as part of a Splunk
application. Simply, click the “Create” drop-down and select “Dashboard panel…”

Page 12
This action brings ups a wizard that can be used to save this search and visualization for later
viewing. After completion of the wizard, we can view the dashboard by clicking the link in the final
wizard step.

Page 13
Sample architectures
The following section outlines two sample Citrix architectures and how Splunk can be integrated.
Scenario 1 – XenApp / XenDesktop mixed
This sample architecture represents a common medium-large Citrix infrastructure. It is sized to
serve 1,000 concurrent users of pooled virtual Windows 7 desktops and 5,000 concurrent users
of a shared XenApp based desktop. This scenario involves the following components (all virtual
machines):
1,000 Windows 7 instances
100 XenApp Worker Servers
6 XenApp Controller / XML Broker Servers
1 License Server
4 Storefront Servers
1 Microsoft SQL Server Cluster with 2 nodes
5 Provisioning Servers
50 XenServers
2 NetScalers
1 Storage System with two Controllers

Page 14
The estimated amount of data, which is produced within this infrastructure, is:
100 MB / day per monitored system
o 1,000 Win7 + 118 W2K8 servers + 50 XenServers + 2 NetScalers + 1 Storage
= 1,171 systems * 100 MB/day
= 117,100MB/day = 117.1 GB/day (not included AD, DNS, DHCP, etc.)
1 MB / day per user session
o 1,000 XenDesktop sessions + 5,000 XenApp sessions
= 6,000 user sessions * 1MB/day
= 6,000 MB/day = 6GB/day
A total of 123.1GB/day is expected (please note that this may vary in your environment)
Furthermore a maximum of 4 concurrent Splunk users is anticipated.
In order to support this environment, the following Splunk instances (virtual machines) are
required:
6 Indexers (2 cores / 4 GB RAM)
1 Search Head (2 cores / 4 GB RAM)
o The search head also run the deployment server role
Further information about scaling a Splunk infrastructure can be found within the article
“Hardware capacity planning for your Splunk deployment” and “Deploying Splunk inside virtual
environments”.

As depicted below all Windows based instances will run the Splunk Universal Forwarder and use the build-in load balancing functionality to
distribute the load equally in between the two indexer servers. Operational intelligence for XenApp and XenDesktop is provided by the
respective Splunk Apps (click links for more information). The NetScaler appliances will leverage their internal auditing system and a
forwarding policy in order to send the data to one of the indexers (please refer to CTX132533 for more information).

In order to simplify management of the forwarders, the following server classes will be
configured:
Windows 7
o Members: All Windows 7 desktops
Windows Server 2008 R2
o Members: All Windows 2008 R2 Servers
XenApp
o Members: All XenApp Servers (Controllers and Workers)
XenDesktop
o Members: All XenDesktop Controllers
Because no Splunk components are installed on the NetScaler appliances, XenServer Hosts and
the storage systems, specific server groups are not required.

Page 17
Scenario 2 – Multiple Data Centers
This scenario is based on the architecture outlined within scenario 1, but is distributed across
three data centers and intended to support a total of 18,000 concurrent users. For this sample a
linear scalability of all components has been assumed. Therefore this scenario involves the
following components.
3,000 Windows 7 desktops
354 Windows 2008 R2 servers
150 XenServers
6 NetScalers
3 Storage systems
The estimated amount of data, which is produced within this infrastructure, is:
Systems: 351,3 GB / day (100 MB / day per monitored system)
Users: 18 GB / day (1 MB/day per user session)
A total of 369.3GB/day is expected (please note that this may vary in your environment)
Furthermore a maximum of 12 concurrent Splunk users is anticipated, which are located at the
head quarters (data center 2).
In order to support this environment, the following Splunk instances (virtual machines) are
required:
18 Indexers (2 cores / 4 GB RAM)
o 6 per data center
o One indexer per data center will host the deployment server role in addition
3 Search Heads (2 cores / 4 GB RAM)
As depicted below all systems within a data center will report their data to local Splunk indexers.
Doing so significantly reduces the amount of data send across the WAN connections.
Please note: In order to be able to perform distributed searches it is required to allow all search
heads connecting to all indexers on port 8089 (TCP).


As indicated it is required to implement a minimum of three search heads (horizontal scaling) to
cope with the expected load. This is known as search head pooling. With search head pooling, it
doesn't matter which search head a user is accessing, since all the search heads share the same
configuration information and search artifacts. Search head pooling also helps reduce the impact if a
search head becomes unavailable. For more information about this topic, please refer to the article
“Configure search head pooling”.

Page 20
Revision History
Revision Change Description Updated By Date
1.0 Finalized Document Jason Conger, Brandon Shell, Thomas Berger With feedback / input from:
- Priya Balakrishnan - Lisa Green
July 30, 2012
About Citrix
Citrix Systems, Inc. (NASDAQ:CTXS) is a leading provider of virtual computing solutions that help
companies deliver IT as an on-demand service. Founded in 1989, Citrix combines virtualization,
networking, and cloud computing technologies into a full portfolio of products that enable virtual
workstyles for users and virtual datacenters for IT. More than 230,000 organizations worldwide rely
on Citrix to help them build simpler and more cost-effective IT environments. Citrix partners with
over 10,000 companies in more than 100 countries. Annual revenue in 2011 was $2.20 billion.
©2012 Citrix Systems, Inc. All rights reserved. Citrix®, Access Gateway™, Branch Repeater™, Citrix Repeater™, HDX™, XenServer™, XenApp™, XenDesktop™ and Citrix Delivery Center™ are trademarks of Citrix Systems, Inc. and/or one or more of its subsidiaries, and may be registered
in the United States Patent and Trademark Office and in other countries. All other trademarks and
registered trademarks are property of their respective owners.