speed or greed: does automated traffic enforcement improve ... · speed or greed: does automated...
TRANSCRIPT

Ideas that change your world | www.fcpp.org
SPEED OR GREED:DOES AUTOMATED TRAFFIC ENFORCEMENT IMPROVE
SAFETY OR GENERATE REVENUE?BY H I R O KO S H I M I Z U A N D P I E R R E D E S R O C H E R S | D E C E M B E R 2 0 1 5

Media Inquiries and Information:Deb SolbergTel: (403) 919-9335
Development Inquiries:Samantha LeclercTel: (403) 400-6862
Disclaimer:The opinions expressed in this paper are exclusively those of the independent author(s) and do not reflect the opinions of the Frontier Centre for Public Policy, its Board of Directors, staff and/or donors.
ISSN # 1491-78 ©2015
Research conducted by the Frontier Centre for Public Policy is conducted under the highest ethical and academic standards. Research subjects are determined through an ongoing needs assessment survey of private and public sector policymakers. Research is conducted independent of Frontier Centre donors and Board of Directors and is subject to double-blind peer review prior to publication.

ABOUT THE FRONTIER CENTRE FOR PUBLIC POLICY
The Frontier Centre for Public Policy is an innovative research and education charity registered in both Canada and the United States.
Founded in 1999 by philanthropic foundations seeking to help voters and policy makers improve their understanding of the economy and public policy, our mission is to develop the ideas that change the world.
Innovative thought, boldly imagined. Rigorously researched by the most credible experts in their field. Strenuously peer reviewed. Clearly and aggressively communicated to voters and policy makers through the press and popular dialogue.
That is how the Frontier Centre for Public Policy achieves its mission.
HIROKO SHIMIZU
PIERRE DESROCHERS
Hiroko Shimizu is a policy analyst who writes extensively on energy, food, and environmental issues with a special emphasis on globalization. She holds a Master’s of International Public Policy from Osaka University. She has studied at and worked for several academic institutions and private companies in Canada, Japan, China, and the United States. She is an Associate Researcher of the Molinari Economic Institute in Brussels, Belgium (www.institutmolinari.org) and was, among others appointments, an International Fellow at the Johns Hopkins University’s Institute for Policy Studies. Her academic, policy and popular writings have been published in Japanese, English and French. She co-authored the book The Locavore’s Dilemma: In Praise of the 10,000-Mile Diet (PublicAffairs, 2012).
Pierre Desrochers is Associate Professor of Geography at the University of Toronto. His main research interests are economic development, technological innovation, environmental, energy and food policy. He has published widely on these and other topics in academic, policy and popular outlets. He is the co-author of The Locavore’s Dilemma: In Praise of the 10,000-Mile Diet (PublicAffairs, 2012). His website can be found at http://geog.utm.utoronto.ca/desrochers/.

TABLE OF CONTENTS
Executive SummaryIntroductionRoad Safety in CanadaSpeed, Collisions, and the Case for ATEQuestionable Implementation of ATEIncreased Safety or Revenue Generation?Speed LimitsAutomated Enforcement and Road SafetyCost Benefit Analysis of ProgramsUnintended ConsequencesConclusionEndnotesBibliography
5678
101114182024272836

[5]
F R O N T I E R C E N T R E F O R P U B L I C P O L I C Y
EXECUTIVE SUMMARY
Better engineered cars along with the adoption of seat belts and other road safety measures and legislation have contributed to a 58% decline in road fatalities in Canada between 1970 and 2009. The fatality rate is now so low that almost twice as many Canadians die from falling accidents than traffic collisions. Between 1994 and 2009, the number of traffic-related serious injuries and total injuries also decreased drastically in spite of increased numbers of registered vehicles and licensed drivers. Despite historically low fatality and injury rates, however, many voices in municipal governments, police forces, and activist groups argue, based on “speed kills” rhetoric and alleged social costs of traffic collisions, that these numbers could be further reduced through ever more ubiquitous automated traffic enforcement (ATE) technologies which are already used widely in about 25 Canadian municipalities, most prominently Calgary, Edmonton, and Winnipeg.
Despite ATE supporters’ contention that artificially low speed limit settings, increased fines, and rigorous enforcement can deter dangerous driving behaviours and improve public safety, little credible evidence actually supports this argument. On the other hand, there is some evidence that the implementation of proven engineering practices (such as better signage, speed limit setting more in tune with actual driving practices and slightly longer yellow light times) are the most effective way of reducing traffic violations and collisions.
Whatever the jurisdictional or regulatory context in which they are implemented, ATE programs all have the potential to create perverse incentives and conflicts of interests over revenue generation, especially when municipal and police budgets are facing shortfalls. Much evidence also suggests that many government institutions systematically underestimate the actual costs of ATE programs and
often justify their existence on inflated social benefits. Program cost overruns, in turn, are ultimately shouldered by otherwise law-abiding drivers and other taxpayers. And even though in most cases a relatively small fraction of provincial and municipal revenues is derived from such fines and penalties, one must ask about the ethics of budgeting fines and penalties as regular revenue sources when they are often imposed for very minor offences and justified as public safety measures.
In Manitoba, where fines are so large as to be unaffordable, traffic tickets become an extremely regressive form of covert taxation, as it disproportionally affects people of lesser means. Also, a deliberate attempt to move traffic enforcement towards targeting the majority of careful drivers rather than dangerous individuals can only result in growing public distrust towards governmental authorities and politicians.
The ultimate goal of governmental authorities towards road transportation should be to promote safety, not revenue generation for its own sake. This can best be achieved through fact-based engineering approaches (e.g., design and maintenance of the road, adequate signage, speed limit setting), education, and sensible enforcement (which would include ATE program operations). And in the end, the additional revenues generated by ATE programs should be dedicated to further promoting road safety by being invested in improved infrastructure rather than become a permanent revenue generation fixture in governmental budgets.

[6]
F R O N T I E R C E N T R E F O R P U B L I C P O L I C Y
INTRODUCTION
On August 26, 2015, Wise Up Winnipeg, a group created nearly six years earlier to oppose what it termed unjust and deceptive traffic enforcement, presented a petition with nearly 2,000 signatures to Winnipeg Mayor Brian Bowman and announced it would repeat the gesture with Steve Ashton, provincial transportation minister.1 Group founder Todd Dube’s main complaint was that city officials had not used standard engineering and signalization practices when setting up speed limits and automated ticketing systems in several locations. As a result, “many people are tricked into speeding” and, because of excessive fines, many find it “hard…to pay.” Photo and radar enforcement, the group argued, served more as a revenue generation tool than an instrument of public safety. “Getting ticketed for speeding,” it was argued, “needs to mean you were actually driving dangerously and were given a chance to know the limit.”2
In order to address these issues, Wise Up Winnipeg demanded that the city and the province:
1. Replace all [allegedly] removed speed limit signs;2. Place speed limit signs before all speed camera
locations;3. Place all speed limit signs on both sides of all divided/
one-way roads;4. Allow engineers to do a city-wide assessment and
report of speed limits.
The case of Winnipeg is but the latest round in a long and contentious debate that typically pits government authorities who promote photo and radar enforcement as a means of improving road safety against critics who decry them as nothing more than an additional revenue stream for public bureaucracies.
The goal of this policy paper is to provide a relatively concise summary of the key facts and debates on this topic. In the first section, we review Canadian traffic collision data and put them
in a broader geographical and historical perspective. This is followed by a discussion of the traditional arguments for and against automated traffic enforcement (ATE) programs. We then examine the revenue generation aspect of these programs, the standard “speed kill” rhetoric often invoked to justify them and alternative factors responsible for traffic collisions in more detail. The effectiveness of ATE programs in a few locations, including Winnipeg and Alberta are discussed, along with some cost benefit analysis on the topic. In the last section, we discuss some unintended consequences of high fines and rigorously enforced ATE programs.

[7]
F R O N T I E R C E N T R E F O R P U B L I C P O L I C Y
ROAD SAFETY IN CANADA
According to a 2013 World Health Organization (WHO) report, approximately 1.24 million people were killed and between 20 and 50 million injured in road traffic crashes worldwide in 2010.3 Road traffic injuries are estimated to be the eighth leading cause of death globally, with a toll comparable to malaria.4 Somewhat similar to infectious diseases, 91% of road fatalities occur in low-income and middle-income countries, even though only approximately half of the world’s vehicles are found in these locations.5 The highest annual road traffic fatality rates (on average 20.1 per 100,000 individuals) are found in middle-income countries, but the rate in low-income countries is not far behind (18.3 per 100,000). By contrast, it is much lower (8.7 per 100,000) in high-income countries.6 Also worth noting is the fact that, according to the International Traffic Safety Data and Analysis Group (IRTAD),7 the number of road fatalities in 32 advanced economies (mostly members of the Organisation for Economic Co-operation and Development [OECD]) declined by 42% overall between 2000 and 2013.8
Canada is a case in point. Needless to say, the country is huge, as it contains nearly 900,000 kilometres of road—
enough to circle the globe 22 times.9 Canadians also typically drive longer distances and are often confronted with much harsher weather conditions than citizens of other advanced economies. In 2013, Canadian authorities reported 1,923 fatalities and 10,315 serious injuries (requiring hospitalization overnight).10 According to IRTAD, Canada ranked 17th among 32 advanced countries in terms of road traffic fatality rate (5.5 per 100,000 population) and 13th in terms of vehicle kilometres travelled (5.6 fatalities per billion vehicle kilometres).11 Canada also achieved a historically low rate of 8.9 fatalities per 10,000 registered vehicles,12 well enough for the 18th position.13 Similar to what has been observed in other advanced economies, road fatalities in the country declined by 58% between 1970 and 2009 (Figure 1),14 an outcome attributable to factors including mandatory introduction of seat belts in all new cars (1971), other road safety legislation, and ever safer cars (i.e., better able to withstand collisions and equipped with better brakes, tires, airbags, etc.).15 Between 1994 and 2009, traffic-related serious injuries decreased 52.1% and total injuries by 31.7%16 in spite of increased numbers of registered vehicles (+ 34.25%) and licensed drivers (+ 40.4%).17
Figure 1: Motor vehicle-related mortality in Canada 1950–200718
Selected Age Groups, Standardized rates/100,000 Persons
1950 1955 1960 1965 1970 1975 1980 1985 1990 1995 2000 2005
Rate
s/10
0,00
0 pe
rson
s
0
10
20
30
40
50
60
Note: Rates are standardized to the 1991 Canadian population, and adjusted with a three-point central moving average.
0-24 All ages 0-14 15-19 20-24
AA
B
C DE
F GH
Benchmarks of select road safetylegislation in Canada
1971: Seat belts required in all new vehicles
B 1976: Ontario is the first juristiction to pass the manditory seat belt law
C 1985: Ammendments to the Criminal Code resulted in tougher penalties for impared drivers
H 2010: By 2010, hand-held cell phone use while driving banned in: British Columbia, Saskatchewan, Ontario, Quebec, Prince Edward Island, Nova Scotia, and Newfoundland and Labrador. Canada Motor Vehicle Safety Standard 126 requires Electronic Stability Control on all passenger cars, multi-purpose vehicles, trucks and buses with a Gross Vehicle Weight Rating of 4536 kg or less, and manufactured on or after September 1st, 2011
G 2008: New Criminal Code provisions on impaired driving give police better tools to detect and investigate alcohol- and drug-impaired driving. These changes increase the maximum sentences and toughen mandatory penalties
F 1994-2005: Graduated licensing programs introduced in most Canadian jurisdictions
E 1991: Seat belt legislation enacted in all jurisdictions
D 1990: Canadian Motor Vehicle Safety Standard 108 (CMVSS 108) requires daytime running lights on all vehicles made or imported after January 1st, 1990

[8]
F R O N T I E R C E N T R E F O R P U B L I C P O L I C Y
SPEED, COLLISIONS, AND THE CASE FOR ATE
Many Canadians lose their lives each year because of road-related incidents, yet these numbers need to be put in perspective. In 2011, Canada registered 242,074 deaths. Cancer was the leading cause (30%), followed by heart diseases (20%), and strokes (6%). Unintentional injuries, including transport incidents, came in fifth place (4.4%).19 Within this last category, falling was the leading cause of death (1.6% of total deaths) while traffic fatalities were blamed for only 0.8% of total deaths.20 In other words, almost twice as many Canadians died from falling accidents as from traffic collisions. It is also worth noting that a traffic fatality rate of 5.6 per billion vehicle kilometres meant one death per 178 million kilometres travelled. In other words, the average Canadian driver commuting 50 km per day would make 232 round trips to the moon before being expected to be involved in a fatal accident.21
Despite historically low fatality and injury rates, many voices in municipal governments, police forces, and activist groups argue these numbers could be further reduced through automated traffic enforcement technologies. Two main reasons are invoked in this respect.22
First, speed zoning enforcement would decrease traffic collisions, since “speed kills.” For instance, Road Safety in Canada (2011) indicated that 27% of fatalities and 19% of serious injuries involved speeding, while 30% of fatalities and 40% of serious injuries occurred at intersections.23 As argued in a research paper displayed on the City of Edmonton’s website, “Thirty per cent of fatal collisions were related to speeding. Since there is a clear link between speeding and collisions, it is of great importance to develop effective speed management strategies.”24
Second, traffic collision costs are said to fall not only on drivers, but also on the public purse because of the nature of our health care system and additional losses in labour
productivity. A 2010 Canadian study thus estimated the social costs ultimately attributable to traffic incidents at $4.3 billion, with direct and indirect costs each accounting for about half of this amount.25
In the United States, the National Highway Traffic Safety Administration (NHTSA) reports that speeding is one of the most prevalent factors contributing to traffic crashes, and that it creates significant costs. In 2012, speeding was said to be a contributing factor in 30% of all fatal crashes, while 10,219 lives were lost in speeding-related crashes. NHTSA further estimates the annual economic cost to society of speeding-related crashes at $40.4 billion.26 (Although another detailed crash causation survey by NHTSA attributed 13.3% of speeding-related crashes to be due to drivers’ decision error.27) In 2006, a European Conference of Ministers of Transport (ECMT) report stated that “speeding on the roads is a serious societal and public health issue in all countries.’’28 The report urged government intervention to address speeding issues and further commented that “reduced speeding will immediately reduce the number of fatalities and injuries and is a guaranteed way to make real progress towards the ambitious road safety targets set by OECD/ECMT countries.”
ATE is one speed management approach used by governmental authorities to monitor and enforce compliance with traffic safety laws, penalize aggressive drivers and curb dangerous behaviours. Red light cameras and speed cameras are its main tools. Red light cameras are activated when a vehicle remains in an intersection for a set amount of time after the light turns red, while speed cameras are triggered when a passing vehicle exceeds the speed limit. Vehicle photos are taken (from either the rear or both the rear and front), and the system registers and stores data including the date, time, location, and speed of the vehicle. Tickets are then issued to the owner of the vehicle.

[9]
F R O N T I E R C E N T R E F O R P U B L I C P O L I C Y
Other reasons put forward by ATE proponents include the following:
1. Resource saving: ATE frees police resources to address violent crimes and other more pressing matters. Reducing the number of traffic collisions also reduces emergency response time and cost, along with health care expenditure.
2. Improved safety for law enforcement officials: It is often both difficult and dangerous for law enforcement officials to pull over bad drivers in congested or high-speed traffic areas.29
3. Fair and impartial enforcement: ATE operates in a consistent and impartial manner on a 24/7 basis.30
4. Self-financing: ATE programs generate enough revenues from speed and signalization violators to be self-sustaining.31
In short, ATE is said to reduce fatalities and injuries by preventing and reducing traffic collisions and violations and modifying aggressive drivers’ behaviour. Furthermore, because tickets issued through such a system fall entirely on drivers who exhibit risky behaviour, they do not interfere with John Stuart Mill’s harm principle, according to which individual freedom can’t be limited unless the conduct of one individual harms other people.32

[10]
F R O N T I E R C E N T R E F O R P U B L I C P O L I C Y
QUESTIONABLE IMPLEMENTATION OF ATE
In Canada, speeding and red light running falls within the jurisdiction of provincial and municipal governments. According to the Canadian Council of Motor Transport Administrations, in 2010 photo radars for speed zoning had been implemented in Alberta, Manitoba, and Quebec, while Intersection Safety Cameras (ISCs), which provide photo enforcement of speed using red light cameras, were operated in Alberta and Manitoba. Red light cameras were further used in six provinces (Alberta, British Columbia, Saskatchewan, Manitoba, Ontario, and Quebec).33 According to data available on the website GPS POI Directory, these technologies are deployed and used widely in about 25 municipalities, most prominently Calgary, Edmonton, and Winnipeg.34 There is no uniform enforcement models or operational guidelines among provinces and municipalities; thus ATE program implementation and operation vary among municipalities.35
Opposition to ATE has been especially vocal in Winnipeg and Edmonton, where many otherwise law-abiding drivers have raised concerns about current practices. Groups such as Wise Up Winnipeg,36 Safety by Education Not Speed Enforcement (SENSE) in Vancouver, 37 and Stop100.ca38 in Toronto have echoed complaints long made in the United States by organizations such as the National Motorists Association.39 The main points raised by ATE critics can be summarized as follows:40
1. Despite being marketed as a safety program, ATE is really about revenue generation for the benefit of municipal and law enforcement coffers.
2. Many infractions occur in the context of questionable infrastructure setting (e.g., insufficient yellow light duration, insufficient road signage, improper speed limit setting).
3. Many infractions occur in the context of questionable locations, such as when ATE cameras are positioned
in transition zones between maximum allowed driving speeds, in areas where the maximum speed limit is set artificially and arbitrarily low (e.g., construction and school zones), and hidden under bridges or at the tops of hills.
4. There is improper and insufficient public notice before the introduction of ATE programs.
5. Unnecessarily strict enforcement targets a majority of otherwise good drivers rather than the small minority of really dangerous drivers.
6. Equipment may or may not be accurate. 7. Issuance of tickets is unduly delayed.41
8. Taking dangerous drivers’ pictures does not change their behaviour, nor does photo enforcement get seriously impaired, reckless, or otherwise dangerous drivers off the road when they are a threat to others.
9. No independent credible evidence proves that ATE actually improves highway and road safety, reduces overall accident numbers, or improves traffic flow.

[11]
F R O N T I E R C E N T R E F O R P U B L I C P O L I C Y
INCREASED SAFETY OR REVENUE GENERATION?
Taxes are compulsory contributions to state revenue levied on a wide range of incomes and profits or added to the cost of goods, services, and transactions. While never popular, so-called “sin taxes” on behaviour deemed reprehensible (or at least questionable) such as tobacco and alcohol consumption have always enjoyed the most support (or the least opposition). Fines are charged when one commits an illegal act or breaks the law, while fees are applied when one individual uses particular services.42 Not surprisingly, raising fees and fines rather than property or income taxes has always proved more politically marketable, as such costs can be avoided if one does not use a service or break a law.43 (Of course, none of these are more politically expedient than borrowing money to be repaid at a future date.)
When faced with budgetary shortfalls, elected officials are always tempted to raise sin taxes, fines, and fees. For example, in a new budget announced in March 2015, the cash-strapped Alberta government increased sin (tobacco, alcohol and fuel) taxes and various user fees (health care contributions, certifications, court filing fees, etc.).44 It also implemented a (on average) 35% increase in traffic fines, including increasing the penalty for running a red light from $287 to $388, and for failing to yield to pedestrians from $172 to $233.45 According to a news report, Alberta’s then Justice minister Jonathan Denis justified costlier traffic fines on the grounds that they would deter offenders and that “Frankly, they lose their punch otherwise…If people are concerned about increased fines, my suggestion is: Don’t break the law.” 46 Conveniently, Advertisementthe new fines would also add to the province’s bottom line, as government officials projected fine revenues to increase by $55.3 million to over $158.3 million by the end of March 2016.47
Needless to say, traffic fines have long been tempting (and in some cases significant) revenue streams for public officials facing budgetary shortfalls. According to National
Highway Traffic Safety Administration (NHTSA) data published by StatisticBrain.com, each year in the United States approximately 41 million Americans are issued speeding tickets (approximately one in five drivers) and pay fines totallling $6.2 billion (approximately US$31.80 dollars per licensed driver).48
As expected by some critics and cynics, a 2009 study that examined data over a 13-year period in North Carolina counties found a statistically significant correlation between a drop in local government revenue and a subsequent (following year) increase in the number of traffic tickets, thus suggesting that the primary goal of traffic tickets is sometimes revenue generation rather than public safety.49 A similar study in Massachusetts found that municipal economic characteristics are determinants of traffic fines, and that the likelihood of receiving a speeding ticket was higher in towns that experienced a fiscal crunch blamed on voters’ rejection of increased property taxes.50 In municipalities where fines represent a not insignificant portion of the operating budget of public safety departments, very few checks and balances seem to stand in the way of ever more frequent and significant tickets and fines.
In this context, ATE programs are but the latest iteration of a much older revenue generation strategy that benefits mainly municipal governments, police forces, and private sector service providers. Not surprisingly, the issue has often generated much political controversy, such as in the 1995 Ontario and 2001 British Columbia provincial elections. In both cases, photo radar traffic enforcement was defended by the government as a safety improvement measure while being dismissed by the opposition as a “cash grab.” Although other issues were obviously at play, in both cases ATE opponents won the election.51

[12]
F R O N T I E R C E N T R E F O R P U B L I C P O L I C Y
In light of the remarkable progress achieved in terms of reducing collision fatalities and injuries over the last few decades, it seems doubtful that the scale of the increased fines—even as recently witnessed in Alberta— will have much impact on aggressive driving behaviour or enjoy much voter support. As such, they are better thought of as revenue generating mechanisms. The City of Winnipeg seems a case in point.
Is Winnipeg addicted to traffic ticket revenues?
Upon activating the traffic cameras in January 2003, Winnipeg city officials projected that photo radar fines would bring in over $57 million in additional revenues over the next five years—and although he admitted this, the mayor was at least adamant he “wanted that cash to go back into policing.”52 Manitoba’s speeding fines were also significantly higher than those in other provinces (Table 1). In fact, on average they were almost double those of five other provinces, while minor violations such as driving 10 km/h over the speed limit were fined $181.50 in Manitoba compared to $40.00 in Ontario.
In 2014, through its 50 Intersection Safety Camera (ISC for both red-light running and speed offence) locations and 10 mobile photo radars (that under current provincial legislation can only be used to enforce speeding violations in school, playground, and construction zones), the City of Winnipeg handed out 128,820 citations and generated $14.6 million in revenues, a 25% increase over previous years.54 To put things in perspective, these numbers were equivalent to one in every five residents being issued a traffic ticket and every resident being burdened with an additional $2155 on top of (tax-financed) police costs of $361.35 per city resident.56 According to police statistics, in the last five years the number of tickets traced back to ISCs has been declining, but the citations from mobile photo radars went up 94% (from 48,043 in 2010 to 93,116 in 2014).57 This happened partly in the wake of the introduction of a new digital technology camera called Dragon Cam in 2012.58 According to the Winnipeg Police Service’s annual report, in 2014 the total expense for the Photo Enforcement Program was $4.7 million. This amount was divided between the salaries and benefits of the Winnipeg Police Service members assigned to it on a full-time basis (8.54%), contractors (Xerox and operators) (91.38%), and other
Type of infraction
Speeding overthe limit
Construction (double fine area)/Ontario—communitysafety zones
Other offences
Over speedlimit
10 km/h
20 km/h
30 km/h
49 km/h
50 km/h
10 km/h
20 km/h
30 km/h
50 km/h
Red light running
distracted driving
138.0
138.0
196.0
368.0
368.0
196.0
196.0
253.0
368.0
167
167
105.0
167.0
239.0
462.0
474.0
211.0
407.0
478.0
949.0
388
287
61
95
166
323
323
110
171
293
530
154
115-145
40.0
95.0
220.0
359.0
490**
65.0
180.0
450.0
court
325
300-1000
181.5
312.3
442.8
692.0
705.3
312.5
573.5
835.8
1359.5
203.8
200
105.10
161.45
252.75
440.80
374.05
178.9
305.5
462.0
641.3
173%
193%
175%
157%
189%
175%
188%
181%
212%
Five provinceaverage
Manitobapremium
BC AB QC ON* MB
Table 1: Traffic fines in five provinces53

[13]
F R O N T I E R C E N T R E F O R P U B L I C P O L I C Y
miscellaneous expenses, including training (0.08%). The net surplus of $9.9 million was incorporated into the overall budget to fund other policing activities.59
Wise Up Winnipeg has raised a number of valid questions about the city’s ATE program.60 For example, traffic enforcement often took place in construction zones where city workers failed to display speed limit signs at the appropriate height. Construction zone signs were also sometimes either missing or tipped over, thus failing to adequately warn drivers.61 In 2012, 206 school zone signs were apparently missing, along with 32 warning signs on streets without schools.62 In some areas, speed limits were kept low in spite of engineering studies that suggested increasing them.63
In May 2014 the Manitoba provincial government doubled speeding fines in designated construction zones regardless of whether workers were on site or not, while four months later the City of Winnipeg lowered the school zone speed limit from 50 km/h to 30 km/h.64 Without being overtly cynical, one could assume that since drivers had already adapted their behaviour to the presence of fixed cameras at intersections, it was now up to mobile photo radar units in school, playground, and construction zones to bring in additional revenues. Indeed, according to police service statistics, almost 6,000 photo radar speeding tickets were mailed to drivers across the city in February 2015 alone, with more than 80% of these tickets having been issued for speeding in a school zone.65 According to Wise Up Winnipeg members, inconvenient and inappropriate road infrastructure and signalization created “ticket hot spots” for police enforcement.66
Meanwhile, the number of fatal collisions in Winnipeg between 2009 and 2014 ranged from a low of eight to a high of 21 annually.67 In 2014, there were 10 fatal collisions, meaning that about 13,000 traffic tickets were issued per fatality. In light of these numbers, can a reasonable case be made that traffic tickets are really issued in the name of public safety?
Ticketing and behavioural change
Among the benefits claimed by proponents of traffic enforcement are modifying aggressive drivers’ behaviour and deterring driving infractions.68 One must then wonder whether traffic tickets are effective in this respect. A detailed U.S. empirical study of more than three million Maryland drivers found that speeding citations by traditional police enforcement have limited deterrent effects in the context of the current traffic enforcement system.69
Among other observations, the authors found that drivers who received a speeding citation in May 2002 were more likely to be young males and to be cited for driving under the influence or driving while intoxicated (DUI/DWI) during follow-up periods.70 They concluded: “Drivers who received a speeding citation during May 2002 had almost twice the risk of receiving a speeding citation during the follow-up period than drivers who did not receive a speeding citation during that month….Receiving fines and points had no significant impact on the risk of repeat citations.”71
The authors suggest the possibility that ATE programs would increase drivers’ awareness of being caught and that this perception may have greater deterrence potential.72 However, it could be argued that since in Maryland automated speed enforcement violations are considered civil violations, and no licence points are deducted in the wake of ticketing,73 it seems reasonable to assume that ATE citations would have almost no deterrent effect on repeat traffic law offenders.
In short, while increased fines and penalties are often justified in light of their alleged capacity to deter illegal driving behaviours and improve public safety, there simply isn’t much evidence to back up this argument.

[14]
F R O N T I E R C E N T R E F O R P U B L I C P O L I C Y
SPEED LIMITS
“Speed kills” is a slogan that has long been accepted rather uncritically outside of traffic engineering circles. Yet, while relatively low speed limits are sensible in areas such as school zones, increased speed in itself is not necessarily problematic. If this were the case, highways with the highest speed limits would have the worst fatality rates. This, however, is not so as was amply documented in the (extreme) case of the German Autobahn system (the federally controlled access highway system).
With a total length of 12,879 kilometres in 2013, the Autobahn system accounted for about 5% of Germany’s highway network in terms of interstate traffic and 31% of its motorized vehicle mileage.74 According to a 2008 estimate, 52% of the network only displayed the advisory speed limit of 130 km/h, 15% had temporary speed limits due to weather or traffic conditions, and 33% had permanent speed limits.75 In 2013, it carried 31% of motorized road traffic (in travel kilometres) while accounting for 13% of Germany’s traffic deaths. The fatality rate was 1.9 deaths per billion travel kilometres compared to a national rate of
4.6 and 6.6 for national roads and rural areas.76 This low fatality rate actually made the Autobahn system one of the safest road networks in the world.77
The problem with the “speed kills” rhetoric is that it puts too much emphasis on one of the many factors that contributes to road collisions. As much evidence suggests, “excessive speed” should not actually mean that an arbitrary speed limit has been exceeded, but rather that a driver is going at an “unreasonable speed” in the context of specific road, weather, visibility, traffic volume, and vehicle conditions.78 Of course, excessive and inappropriate speed obviously increases the risks of a crash, and the relationship between vehicle speed and crash severity is unequivocal and based on the laws of physics.
Driving at high speeds also increases demands on a driver, who must react more quickly to a given situation as the distance needed to stop increases with speed while the time available for stopping or taking evasive actions diminishes. For example, the distance needed to stop a car while driving
Braking Distance
Figure 2: Total stopping distance in ideal weather conditions on dry asphalt79
41.7
37.5
33.3
29.2
25.0
20.8
56.2
45.5
38.5
27.5
20.2
14.0
97.9 m
83.0 m
72.0 m
56.7 m
45.2 m
34.8 m
25.7 m9.016.7
100.080.060.040.020.0
40
50
60
70
80
90
100
0.0
Reaction Time
Total stopping distance (Reaction + Braking)
Spe
ed (k
m/h
)
The length of a Canadian football field is 101 metres. If you’re driving 100km/h on a clear day, you would travel from one end of the field to another before coming to a stop.

[15]
F R O N T I E R C E N T R E F O R P U B L I C P O L I C Y
at 50 km/h is 34.8 metres, while 97.9 m are required at 100 km/h (Figure 2). In short, the faster a vehicle is travelling, the longer it will take to slow or come to a complete stop. In an emergency situation, those few extra seconds can mean the difference between life and death.
Internationally validated research on the relationship between changes in average traffic speed and crash outcomes suggests that a 5% speed increase leads to approximately a 15% increase in serious injury crashes and a 22% increase in fatal crashes.80 Again, though, speed is but one of many risk factors. For instance, according to a NHTSA report, in 2012, 42% of speeding American drivers had blood alcohol concentrations (BACs) of .08 grams per deciliter (g/dl) or higher in fatal crashes, compared to only 16% of non-speeding drivers involved in fatal crashes.81
Human errors and collisions
According to 2013 Alberta data, 86.5% of total collisions involved at least one driver error.82 Other factors that contributed to the 141,638 collisions reported that year included drivers with a physical condition (e.g., intoxication, fatigue, medical condition), who accounted for 29.6% of fatal collisions. Speed—defined in police reports as a speed that is too high given the driving conditions—accounted for only 6.4% of total collisions. Also worth noting is that 13.5% of collisions where the driver was “driving properly” included situations such as pedestrian error, sun glare, unexpected objects in the roadway (e.g., an animal), and extreme weather conditions. The most frequently identified improper driver actions that caused collisions were following too closely (30.3%), running off the road (13.9%), a left turn across a path (12.9%), stop sign violation (7.8%), disobeying a traffic signal (7.2%), and failing to yield right of way to a pedestrian (4.8%).83
Factors that contribute to collisions and crashes are thus varied and can be complex. Many cases have nothing to do with cruising speed and should be given adequate consideration by government officials if they are truly
motivated by safety considerations. An undue focus on speed because of emotional rhetoric and revenue generation considerations is unlikely to improve safety when more holistic approaches are required.
Solomon curve
In a classic 1964 study, David Solomon studied the relationship between average speed and collision rates of automobiles on rural highways (Figure 3).84 Among other findings, his report suggested the following:
1. There is a U-shaped relationship between vehicle speed and crash incidence.
2. Crash rates were lowest for drivers travelling around 10 km/h above the average speed (90th percentile), and increased with deviations above and below the mean.
3. Low-speed drivers were more likely to be involved in crashes than relatively high-speed drivers.
4. The more speed variability between the cars, the higher possibility of accidents.
For example, a driver travelling at 60 km/h with surrounding traffic travelling at an average speed of 96 km/h has a substantially greater chance of being involved in an accident than a driver travelling at the average speed.
Figure 3: Solomon Curve85
40
100
1,000
10,000
Invo
lvem
ent R
ate
per 1
00 M
illio
n Ve
hicl
e-M
iles
Deviation From Average Speed (km/h)
40 -30 -20 -10 0 10 20 30 40
Crash Risk C
urve
lowest crash risk(90th percentile)
drivers atgreatest risk
(slowest 30%)
Average Speed

[16]
F R O N T I E R C E N T R E F O R P U B L I C P O L I C Y
Subsequent research refined Solomon’s findings, but his key arguments still hold. For instance, the National Motors Association recently cited an Institute of Transportation Engineers’ study, according to which those driving about 15 km/h slower than the prevailing traffic are six times as likely to be involved in an accident.86 Thus, to go with the traffic flow is the best driving strategy, since the less variability of speeds between the cars, the fewer accidents will happen.
Setting the appropriate speed limit
For traffic safety purposes, roads can be divided into three main usage categories: 1) built-up urban streets with slower speeds and dense and diverse road users; 2) non-built-up rural roads with higher speeds; and 3) major highways (motorways, interstates, freeways, autobahns, etc.) reserved for motor vehicles and designed to minimize and attenuate crashes. An underappreciated reality is that most casualties occur on urban streets and rural roads, while motorways are much safer in relation to distance travelled. While this fact alone disproves the widespread belief that “speed kills,” the relationship between speed and road safety—and especially the notion of “appropriate speed limits”—needs to be discussed in more detail.
Determining the appropriate speed limit in a particular context is an essential element of road and highway safety, yet in practice the numbers settled upon by governmental authorities are often driven more by emotional considerations and subsequent political responses than by actual engineering knowledge and experience. Be that as it may, according to an IRTAD report, in most urban areas worldwide the default speed limit for passenger cars is 50 km/h, while lower speed limits (typically 30 km/h) are often enforced in residential areas or in proximity to schools. Higher default speed limits (60 km/h) are found in Poland (during the nighttime), Chile, and Korea.87 Speed limits on roads outside built-up areas typically vary between 80 and 100 km/h. The lowest speed limits among IRTAD members and observers are found in Jamaica (50 km/h)
and Japan (50–60 km/h), while the highest speed limits—up to 120 km/h—are observed in Chile and Poland. Several countries differentiate speed limits according to the type of road, weather, or pavement. On motorways speed limits vary between 90 and 140 km/h, although on much of the German highway system drivers observe a recommended limit of 130 km/h.88 Canada’s speed limits range from 40 to 70 km/h in urban areas, 80 to 90 km/h on rural roads and 100 to 110 km/h on highways (one of the lowest among developed countries).89
In the United States, a Federal Highway Administration (FHWA) study reviewed the principles and practices used to set speed limits in all states, and 44 cities and counties. One recommendation was that the “speed limit should be set at the speed driven by 85 to 90% of the free-moving vehicles rounded up to the next 5 mph increment. This method results in speed limits that are not only acceptable to a large majority of motorists, but also fall within the speed range where accident risk is lowest as illustrated in the Solomon curve. Allowing a 5 mph tolerance, enforcement would be targeted at drivers who are clearly at risk.” 90
However, the FHWA authors pointed out that it is fairly common for state and local governments to set the speed limit much lower than the 85th percentile speed of the free-flowing traffic because of a range of subjective considerations and factors like roadside development, accident experience, roadway geometrics, average test run speed, pedestrian (and bicycle) volumes, and (not surprisingly) politics.91 The most commonly reported lower level of the speed limit is 5 mph (8 km/h) below the 85th percentile, with 10 mph (16 km/h) below being the extreme (Figure 4).92 Apart from recommending that speed limit settings should reflect actual traffic speed, the authors of the report further observed that speed zoning should be about the establishment of reasonable and safe speed limits based on engineering studies. When this is not the case, as when the limit is set too low, drivers are unlikely to comply.

[17]
F R O N T I E R C E N T R E F O R P U B L I C P O L I C Y
According to the authors, “No other factors need to be considered since they are reflected in the drivers’ speed choice. If there are unusual hazards not readily apparent to drivers, then a warning sign could be installed giving the nature of the hazard and, if necessary, supplemented with a realistic advisory speed.”94
In some cases, setting a higher speed limit delivers safer results. According to the National Motorists Association, “If a speed limit is raised to actually reflect real travel speed, traffic flow improves, and there are fewer accidents. Speed alone is rarely the cause of accidents. Differences in speed are the main problem. Reasonable speed limits help traffic to flow at a safer, more uniform pace.”95 For instance, in 2003 the B.C. government conducted a review of speed settings where speed limits were raised during the years 1997 and 1998 from 90 km/h to 100 km/h. The report concluded that increased speed limits resulted in an 8.6% to 12.9% reduction in crashes.96
According to the FHWA report, ultimately neither raising nor lowering the speed limit has much effect on vehicle speeds. The majority of motorists did not drive 8–16 km/h above the posted speed limit when speed limits were raised, nor did they reduce their speed by 8–16 km/h when speed limits were lowered.97 Changing posted speed limits alone without additional enforcement, educational programs, or
Figure 4: Speed limit setting93
0 -10 Average +10
2
4
6
Acc
iden
t Ris
k
mph
10th percentilespeed
90th percentilespeed
Reasonable and Safe SpeedsTolerance
MINIMUMSPEED
XX
MAXIMUMSPEED
XX
other engineering measures, the authors concluded, only has a minor effect on actual average driving speed.
In short, much evidence suggests that setting the speed limit at the 85th percentile speed of free-flowing traffic will likely:
1. Reduce speed variance, resulting in reduced numbers of crashes;
2. Increase speed limit compliance;3. Provide greater consistency of speed limits; and4. Focus enforcement on dangerous drivers, not revenue
collection.
Moreover, if the road and its new speed limit are mismatched, lowering the posted speed limit might not result in a reduced driving speed, as drivers tend to respond poorly to such incompatible interventions.

[18]
F R O N T I E R C E N T R E F O R P U B L I C P O L I C Y
AUTOMATED ENFORCEMENT AND ROAD SAFETY
Justifying automated enforcement programs by invoking greater road safety is a widespread rhetorical strategy. By and large, however, the evidence on the issue is at best inconclusive.
In 2007, NHTSA published a worldwide review on automated enforcement programs. It concluded that “existing research indicates that automated enforcement systems can result in measurable safety improvements at high crash locations.” The authors then added a cautionary note to the effect that “the magnitude of the effect, and how much is due to the desired behavior change (decrease in speed or red light running) versus other behavior changes (e.g., choosing alternate routes), remains uncertain.”98
A Virginia Transportation Research Council report analyzed seven years of crash data (from January 1, 1998, to December 31, 2004) in six Virginia jurisdictions that operated red light cameras.99 The authors concluded that “the study did not show a definitive safety benefit associated with camera installation with regard to all crash types, all crash severities, and all crash jurisdictions.” The study did show a net safety benefit for some jurisdictions (such as in the cities of Vienna and Alexandria), but not in others (such as Arlington). There is evidence to suggest that this difference might have more to do with variation among intersections than among jurisdictions. Finally, it may be said that the cameras were associated with a clear decrease in red light running crashes and a clear increase in rear-end crashes. The report recommended that red light cameras be implemented on a case-by-case basis and only after a careful review of the crash patterns (rear-end crashes, red light running crashes, and injury crashes) and geometric/operational characteristics (e.g., approach speeds, intersection visibility, signing, and driveways) at each intersection.100
Winnipeg
In 2009 the City of Winnipeg Police Service contracted with the Traffic Injury Research Foundation to conduct an evaluation of the city’s Photo Enforcement Program.101 The installation of red light running camera locations was said to have decreased dangerous right-angle collisions at intersections by 46%, but less serious rear-end collisions were up by 42%.102 The red light running camera program was thus said to have had a positive net effect on traffic safety. However, this result was only valid for 12 cameras, while the remaining 36 showed inconclusive results.103 In the case of speeding cameras, the net effect on injury crashes and property damage only crashes was virtually nil.104 Interestingly, the report stated that, in terms of photo enforcement effectiveness, speeding cameras might actually be less effective in preventing serious speeding violations.105 Overall, the report concluded that, due to the lack of information or documentation regarding the criteria used in selecting locations for cameras, it was difficult to determine the portion of observed results attributable to photo enforcement.106
Alberta
Red light cameras have been used by various municipalities in Alberta since January 1, 1999. Following amendments to the Traffic Safety Act on January 1, 2009, the use of Intersection Security Cameras (ISC) in locations where collision and violations were deemed frequent was authorized. Alberta Transportation later published a report on intersection safety devices that identified an overall positive net benefit from the use of such technologies.107 Data was thus collected in six municipalities, including Calgary, Edmonton, Red Deer, Fort Saskatchewan, and Strathcona County. Unfortunately, insufficient data made it difficult to analyze the impacts of both red light cameras and ISCs. According to the authors of the report, the municipalities did not collect basic required data on factors such as speed violation, travel speed, and completion

[19]
F R O N T I E R C E N T R E F O R P U B L I C P O L I C Y
date before the activation of automated systems, which would have been necessary to analyze the impact of these programs. The overall effect of automated traffic enforcement programs in Alberta is therefore not clear.
Causes of inconclusive studies
On red light running behaviour, the Traffic Injury Research Foundation report discussed one systematic review that supported the conclusion that photo enforcement reduces right-angle crashes while increasing rear-end crashes, but further suggested that the overall effects on total crashes, specific collision types, and violations data analysis is not conclusive.108 Variations across studies, the authors explained, could be attributable to several factors, such as the fact that a program’s size will often determine the magnitude of the benefits. Typically, the larger the program and the more public awareness results from it, the larger the benefits.109 Variations among studies in terms of research design and methodology also explained much in terms of conflicting results, most notably that:110
1. Results might be site specific;2. Site selection bias might have resulted in “regression
towards the mean” and an overestimation of the effects of camera enforcement on crashes on selected sites; and
3. Due to the complexity of the accident, it is often difficult to distinguish target crashes from other collisions caused by alcohol and other factors. 111
Sometimes, different approaches and variance in analysis ended up in heated exchanges among scholars.112 Arguably the biggest problem in terms of measuring the effect of automated traffic enforcement is the “speed kills” assumption. Suffice it to say that, apart from the previously discussed issues (driver errors, physical road conditions, traffic volumes, inadequate signage, lighting, and visibility), a B.C. document on red light running cameras stated that the technical challenge of installing ISCs was “customizing
each camera installation,” since “no two intersections are configured exactly alike. For example, crosswalks often intersect a street at an oblique or crooked angle: two vehicles travelling side-by-side down a street in adjacent lanes will not reach such an intersection at exactly the same time…To record violations accurately, each camera installation must be custom-fit to its particular intersection.”113
According to evidence from the state of Georgia, the implementation of proven engineering practices is the most effective way of reducing red light running, and photo enforcement is not an effective deterrent to improve intersection safety, especially for intentional red light runners.114 In 2010 a state provision for adding one second to the minimum federal yellow light duration at photo-enforced intersections went into effect. Within 90 days of this new law being in effect, red light running violations dropped 72% at camera sites. This significant drop of violations resulted in a reduction of revenues for many local governments. In 12 Georgia cities, 57 red light cameras were removed and a state bill required that local governments implement engineering changes at dangerous intersections before resorting to photo enforcement, then file an application with concrete evidence that the intersection was dangerous and the cameras were needed for a genuine safety purpose.115 Invoking the Georgia experience, a Just One Second campaign was launched by Wise Up Winnipeg with the goal of having yellow light duration determined by engineering formulas and practices.116
Also worth noting is that the U.S. FHWA now emphasizes determining adequate yellow light duration through the equation calculated by the Institute of Transportation Engineers, according to which a one-second increase in yellow light time results in a 40% decrease in severe red light-related crashes, while shorter yellow light times result in more red light violations and higher crash rates.117 If safety is the major goal, engineering countermeasures should be taken before enforcement is increased.

[20]
F R O N T I E R C E N T R E F O R P U B L I C P O L I C Y
COST BENEFIT ANALYSIS OF PROGRAMS
Apart from improved road safety, automated enforcement programs are often justified in the name of greater, if indirect, social benefits. Yet the analytical frameworks used to make this case are not based on actual reductions in the number of collisions, but on assumed benefits such as prevented fatalities and injuries, reduction in health care and emergency services costs, property damage collision costs, improved traffic flows, reduced insurance claims, and other claims that can arguably be estimated (and inflated) in many ways.118 Suffice it to say that government documents often attribute all positive road safety trends to automated traffic enforcement programs, a dubious rationale that can inflate alleged benefits.
On the cost side of the ATE ledger, a recurring problem is that governments often underestimate the complexity of setting up automated systems and do not plan adequately for project implementation. The results are (often huge) budget overruns and insufficient revenues to cover operating costs. Moreover, as time passes, drivers adjust their behaviour and the number of traffic tickets decreases. To keep these programs going, governments must then expand them and/or increase fines.
The case of ATE in Toronto and southern Ontario illustrates both kinds of problems.
Toronto and southern Ontario
In 2004 a Toronto city council memo stated:
[The] framework established by the Ministry of Transportation, Ontario was used to establish the cost
to society in terms of human consequences (fatalities and injuries, property damage, time and material expended) as a result of collisions. The benefit from a reduction in collisions is the avoidance of these costs. If a collision can be avoided the resources consumed by that collision could be used elsewhere for the benefit of society. The resulting benefit to cost ratio was 1.57:1 indicating that the benefits resulting from the combined use of red-light cameras and police enforcement were greater than the project costs.119
The red light running program was introduced in Toronto in the pilot stage in 2000 and became permanent in 2004. According to a city auditor report, from 2000 to 2009 the program was a net cost to the city.120 In recent years, however, “the program has shown progressively improving financial results to the extent that in 2010 the program resulted in net revenue of $800,000. This improvement appears to be a result of program expansion and an increase in the fine for red light violations.”121 Indeed, between 2000 and 2011, the number of intersections covered by the program increased from 38 to 114, while fines were raised from $190 to $325 (Table 2).122
According to the report, the annual cost for the program was over $3 million, and fine revenues barely covered it until 2010. Instead of recommending its abolition, the auditor called for additional revenue generation (Table 3).
The report added that “while the purpose of the Red Light Camera program is not to generate additional annual revenue for the city, conservatively we estimate an additional annual revenue amount of $2.5 million could be attained by implementing the recommendations in this report.”125 In terms of cost benefit analysis it was argued
$190 $180 $325
Total Fine
$0
$5
$5
Court Costs
$35
$25
$60
Victim Surcharge
$155
$150
$260
Set Fine
December 1998
June 2005
January 2010
Date
Table 2: Red light camera fine increase in Ontario123

[21]
F R O N T I E R C E N T R E F O R P U B L I C P O L I C Y
that “while the City has no legal obligation to operate a Red Light Camera program, its benefits should not be judged solely on its financial results. There are significant other benefits associated with the program which should be considered. These benefits are considerable although difficult to quantify.”126
A 2003 evaluation study commissioned by the Ontario Ministry of Transportation on 48 red light camera pilot projects in six participating municipalities over a two-year period concluded that jurisdictions using photo enforcement experienced 6.8% and 25.3% reductions, respectively, in all collision types and angle collisions resulting in fatalities and injuries (Table 4). On the other hand, the data showed fatal and injury rear-end collisions up by 4.9% and property damage only rear-end collisions up by 49.9% (Table 4).127
These numbers are based on the Empirical Bayes (EB) method, which uses computer modeling to calculate the expected number of collisions had the measures not been implemented (i.e., the EB estimators) and compares these calculated numbers with the actual number of collisions after automated enforcement measurements are
implemented. If the estimation is reliable and ATE is effective, the EB estimators are much higher than the actual number of collisions. However, there are some flaws with this method, especially if there is not enough data over a certain period.129 Nevertheless, considering the results in Table 4, which shows the red light camera program actually increased rear-end and property damage collisions based on the EB analysis, how can we conclude that the red light camera program actually improved safety?
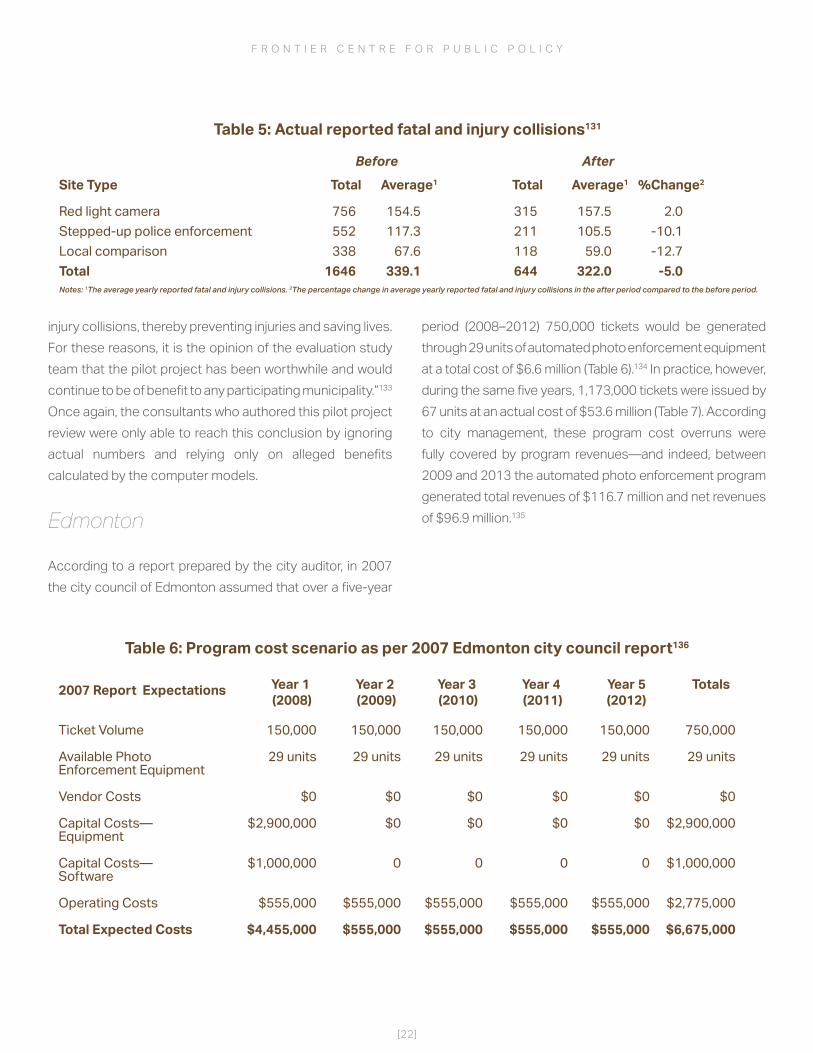
The actual number comparisons before and after the implementation of red light running cameras (Table 5) illustrate that the camera-free local sites (used as a control group) fared much better (12.7% reduction of fatal and injury collisions) than the red light camera sites (2% increase) (Table 5).130
Actually, the non-camera intersections fared better than the camera intersections in every accident category. The report’s overall accident conclusions would have appeared significantly worse had the camera-free intersections been excluded from the final results.132 The authors nonetheless concluded that “based on the results presented in this report, the Red Light Camera Enforcement Pilot Project has been shown to be an effective tool in reducing fatal and
$0.4 $0.2
$(0.8)
Net Cost/(Revenue) $ million
$(2.8)*
$(3.2)
$(5.1)
Revenue $ million
$3.2
$3.4
$4.3
Costs $ million
2008
2009
2010
Table 3: Red Light Program Costs and Revenues 2008–2010 in Toronto124
Notes: 1The signalized intersections consisted of nineteen red light camera, seventeen stepped-up police enforcement and twelve local comparison sites.
+18.5
-17.9
+49.9
Property Damage Only
-6.8
-25.3
+4.9
Percentage difference between expected and observed collisions
Fatal and InjurySignalized intersections1
All collision types
Angle collisions
Rear-end collisions
Table 4: Safety effectiveness of pilot programs128
[22]
F R O N T I E R C E N T R E F O R P U B L I C P O L I C Y
injury collisions, thereby preventing injuries and saving lives. For these reasons, it is the opinion of the evaluation study team that the pilot project has been worthwhile and would continue to be of benefit to any participating municipality.”133 Once again, the consultants who authored this pilot project review were only able to reach this conclusion by ignoring actual numbers and relying only on alleged benefits calculated by the computer models.
Edmonton
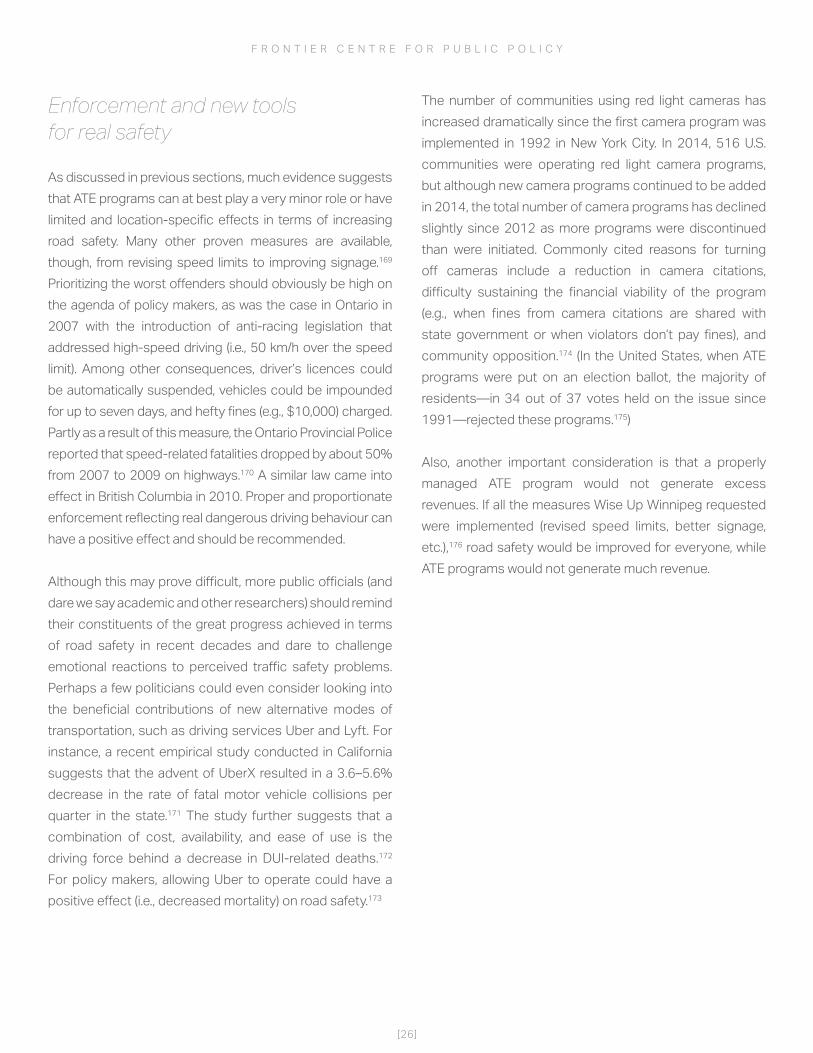
According to a report prepared by the city auditor, in 2007 the city council of Edmonton assumed that over a five-year
period (2008–2012) 750,000 tickets would be generated through 29 units of automated photo enforcement equipment at a total cost of $6.6 million (Table 6).134 In practice, however, during the same five years, 1,173,000 tickets were issued by 67 units at an actual cost of $53.6 million (Table 7). According to city management, these program cost overruns were fully covered by program revenues—and indeed, between 2009 and 2013 the automated photo enforcement program generated total revenues of $116.7 million and net revenues of $96.9 million.135
Notes: 1The average yearly reported fatal and injury collisions. 2The percentage change in average yearly reported fatal and injury collisions in the after period compared to the before period.
2.0
-10.1
-12.7
-5.0
%Change2
157.5
105.5
59.0
322.0
Average1
315
211
118
644
After
Total
154.5
117.3
67.6
339.1
Average1
756
552
338
1646
Before
TotalSite Type
Red light camera
Stepped-up police enforcement
Local comparison
Total
Table 5: Actual reported fatal and injury collisions131
750,000
29 units
$0
$2,900,000
$1,000,000
$2,775,000
$6,675,000
TotalsYear 5(2012)
Year 4 (2011)
Year 3 (2010)
150,000
29 units
$0
$0
0
$555,000
$555,000
150,000
29 units
$0
$0
0
$555,000
$555,000
150,000
29 units
$0
$0
0
$555,000
$555,000
150,000
29 units
$0
$0
0
$555,000
$555,000
Year 2 (2009)
150,000
29 units
$0
$2,900,000
$1,000,000
$555,000
$4,455,000
Year 1 (2008)
2007 Report Expectations
Ticket Volume
Available PhotoEnforcement Equipment
Vendor Costs
Capital Costs―Equipment
Capital Costs―Software
Operating Costs
Total Expected Costs
Table 6: Program cost scenario as per 2007 Edmonton city council report136

[23]
F R O N T I E R C E N T R E F O R P U B L I C P O L I C Y
Synthesis
Much evidence suggests that many government institutions systematically underestimate the actual costs of automated enforcement programs and often justify their existence on inflated alleged social benefits.138 Program cost overruns, however, are ultimately shouldered by otherwise law-abiding drivers and other taxpayers. The primary—and arguably only—beneficiaries of higher fines and larger programs are government entities, police services, and private providers of the equipment and attending services for these programs.
Moreover, many municipalities and provinces soon incorporate these fines and penalties in their regular budgetary process. For instance, according to the 2014–2015 Alberta’s fiscal plan, $136 million (2.7%) of the provincial revenues of $49 billion were expected to come from fines and penalties, a sum that was expected to increase significantly to $204 million in 2015–2016 (up 50% from previous year) and even more in later years.139 At the municipal level, in 2013 Calgary’s operating revenues were $3.7 billion, $69.5 million (2%) of which came from fines and penalties. These figures were respectively $2.4 billion and $78.5 million (3.2%) for Edmonton, and $4.8 billion and $195 million (4%) for Montreal.140
Even though in final analysis a relatively small fraction of provincial and municipal revenue is derived from fines and penalties, one must ask about the ethics of budgeting fines and penalties as regular revenue sources when they are often imposed for very minor offences and justified as public safety measures.
1,173,000
67 units3
$19,152,902
$10,739,152
$1,376,718
$22,361,043
$53,629,815
TotalsYear 5(2012)
Year 4 (2011)
Year 3 (2010)
240,299
67 units
$3,765,124
$1,256,403
$621,718
$4,124,760
$9,768,005
190,685
63 units
$3,047,992
$1,792,566
$755,000
$4,400,128
$9,995,686
355,774
60 units
$5,818,012
$2,867,461
0
$5,639,667
$14,325,140
166,956
24 units
$3,723,774
$4,209,692
0
$3,878,488
$11,811,954
Year 2 (2009)
219,286
29 units
$2,798,000
$613,030
$0
$4,318,000
$7,729,030
Year 1 (2008)
2007 Report Expectations
Ticket Volume
Available PhotoEnforcement Equipment
Vendor Costs
Capital Costs―Equipment
Capital Costs―Software
Operating Costs
Total Actual Costs
Table 7: Actual program cost and size137

[24]
F R O N T I E R C E N T R E F O R P U B L I C P O L I C Y
UNINTENDED CONSEQUENCES
Financial incentives and conflict of interests
The City of Chicago, home to the biggest U.S. ATE program with more than 300 active cameras, has been at the centre of a significant scandal over the use of these technologies in the last few years.141 The program’s revenues rose from $21,600 in 2003 to $68.4 million in 2013.142 A series of alleged scandals plagued the program, from corruption charges to faulty (or human-tampered) cameras,143 and a reduction in yellow light time below federal guidelines that resulted in 77,000 tickets.144 The first proper annual report on the ATE program was finally published in 2015 after more than a decade passed since the program introduction.145
Because of different (and often complex) layers of jurisdictions and regulations, ATE programs often have different guidelines, yet they all have the potential to create perverse incentives and conflicts of interests over revenue generation, especially when municipal and police budgets are facing shortfalls or when, as in Edmonton, private equipment and service providers are paid both a fixed cost and an additional sum based on the number of tickets issued. As the University of Manitoba’s transportation and logistics specialist Barry Prentice wrote on the Winnipeg case, “If governments start to depend on fine collection as a source of revenue, like taxes, an undesirable conflict of interest and distortion of priorities arise.”146
Of course, the crucial issue in terms of perverse financial incentives and ATE is arguably as old as traffic tickets. In Toronto and elsewhere,147 citizens have long complained about what they believe are quotas imposed on police services by cash-strapped municipal governments or about the fact that some police services, such as in Winnipeg, are allowed to keep the fine money for their own use.148 This discussion was even aired publicly in Montreal when, during a difficult negotiation where municipal officials complained
about a fall in traffic ticket revenues, the police union urged the municipality to relent on the (verbally agreed upon) ticket quotas so that its members could “arrest people, build relationships with citizens, and prevent crimes.” Indeed, the union even asked local politicians to follow the lead of 22 U.S. states that have passed laws against such quotas.149 So far, though, the issue is apparently not widespread enough to warrant the attention of the Canadian Association of Chiefs of Police.150
Another potential conflict of interest (at least in appearance) can be observed in Edmonton, where revenues from automated enforcement were used not only to support program expenditures and traffic safety initiatives, but also to endow to the tune of $1.5 million a permanent Urban Traffic Safety Research Chair in the University of Alberta’s Department of Civil and Environmental Engineering.151 Some research papers produced under the leadership or with the collaboration of the holder of that endowed chair,152 which also sometimes benefitted from the additional sponsorship of the Office of Traffic Safety of the City of Edmonton,153 are now posted on the city’s website and seem to, by and large, validate the effectiveness of mobile speed enforcement in reducing severe collisions.154 While we do not imply anything as to the quality of the research produced under this arrangement, a more arm’s length process (say, asking for one-time evaluations or projects from academics based in other jurisdictions) would perhaps have been more desirable.
Finally, regarding payments to private contractors, the minimal procedural standard required to avoid conflicts of interest and perverse incentives is provided by the FHWA and the National Cooperative Highway Research Program, which recommend that municipalities avoid letting private contractors determine installation locations while favouring flat fee payments rather than a sum based on the number of tickets issued.155

[25]
F R O N T I E R C E N T R E F O R P U B L I C P O L I C Y
Regressive taxation
ATE fines are typically levied on otherwise law-abiding citizens who already pay property, income, gas, and other taxes, yet can probably in most cases afford a few traffic tickets provided their cost is reasonable. Of course, many citizens consider the monetary amounts of traffic fines excessive, and perhaps occasionally feel tempted to invoke the Magna Carta clause that “…all fines [the authorities] have exacted unjustly, shall be entirely remitted….” 156
In the United States, excessive fines are considered under the Excessive Fines Clause of the 8th Amendment of the Constitution, which reads, “Excessive bail shall not be required, nor excessive fines imposed, nor cruel and unusual punishments inflicted.” Interestingly, a number of law enforcement officials seem to share this sentiment, such as, for instance, half of the officers surveyed on that subject two decades ago by the Institute of Police Technology and Management in Florida.157 It is also widely acknowledged that one of the main reasons why traffic tickets are not paid in California is that the fines are simply too high and unaffordable for a large number of people.158 (Interestingly, in 2012 Californian authorities offered a half-off traffic ticket amnesty on the grounds that a small fraction of unpaid fines was better than nothing or additional enforcement costs. The amnesty did not apply to tickets issued for parking violations and drunken and reckless driving.)159
As one American commentator put it: “Aggressive arbitrary policing of minor and petty infractions is effectively a regressive tax disproportionally affecting the poor, who often do not have the means to pay or contest tickets…the poor often face dire consequences when penurious cities turn to ticketing as a reliable revenue system.”160
Distrust issue between authority and public
Trust between citizens and political authorities (and their enforcers) can in the end only be established and maintained
through just, fair, and transparent policy implementation and program operation. Using traffic tickets as a somewhat obvious and contested revenue generation tool undermines these foundations.161 Without public support, the benefits of ATE programs definitely cannot be achieved.162
In Edmonton in 2015, one article asked if citizens could “trust city bureaucrats and politicians to run our photo radar?”163 Since the City of Edmonton’s Office of Traffic Safety took over the operation of the photo radar program from the Edmonton Police Service in early 2013, the number of speeding tickets issued more than tripled from 162,996 in 2012 to 509,993 in 2014, while revenues during this period increased from $13.4 million to $34.5 million.164 Especially notable was that the tickets issued for exceeding speed limits by 6–10 km/h increased from 3,252 in 2012 to 66,847 in 2014.165 City officials denied that changes in enforcement policy were to blame and defended the program, saying it resulted from more rigorous enforcement in lower speed zones, such as in proximity to schools.166 According to a news article, though, one significant change was that the threshold for handing out tickets was dropped to 10 km/h over the speed limit in many locations from 15 km/h over the speed limit which was implemented by the police service.167 As Edmonton collision data indicated that fatal and injury collision rates had been going down for more than a decade,168 this more rigorous enforcement of speed limits was arguably not targeting truly dangerous and aggressive drivers and resulted in growing public distrust towards city officials and politicians.
While the stated policy focus of traffic tickets should determine their monetary amount, as was argued in previous sections, the line between a deterrent and an itemized budgetary revenue tool is extremely thin. True, a financial penalty that will equally dissuade law-breakers and secure revenue will always prove elusive, but a process based on a patent lie can only erode public trust. In the end, while ticketing revenues may fill temporary gaps in governmental budgets, they should never be relied upon as stable income streams, and government should be responsive to the financial hardships of otherwise law-abiding citizens.
[26]
F R O N T I E R C E N T R E F O R P U B L I C P O L I C Y
Enforcement and new tools for real safety
As discussed in previous sections, much evidence suggests that ATE programs can at best play a very minor role or have limited and location-specific effects in terms of increasing road safety. Many other proven measures are available, though, from revising speed limits to improving signage.169 Prioritizing the worst offenders should obviously be high on the agenda of policy makers, as was the case in Ontario in 2007 with the introduction of anti-racing legislation that addressed high-speed driving (i.e., 50 km/h over the speed limit). Among other consequences, driver’s licences could be automatically suspended, vehicles could be impounded for up to seven days, and hefty fines (e.g., $10,000) charged. Partly as a result of this measure, the Ontario Provincial Police reported that speed-related fatalities dropped by about 50% from 2007 to 2009 on highways.170 A similar law came into effect in British Columbia in 2010. Proper and proportionate enforcement reflecting real dangerous driving behaviour can have a positive effect and should be recommended.
Although this may prove difficult, more public officials (and dare we say academic and other researchers) should remind their constituents of the great progress achieved in terms of road safety in recent decades and dare to challenge emotional reactions to perceived traffic safety problems. Perhaps a few politicians could even consider looking into the beneficial contributions of new alternative modes of transportation, such as driving services Uber and Lyft. For instance, a recent empirical study conducted in California suggests that the advent of UberX resulted in a 3.6–5.6% decrease in the rate of fatal motor vehicle collisions per quarter in the state.171 The study further suggests that a combination of cost, availability, and ease of use is the driving force behind a decrease in DUI-related deaths.172 For policy makers, allowing Uber to operate could have a positive effect (i.e., decreased mortality) on road safety.173
The number of communities using red light cameras has increased dramatically since the first camera program was implemented in 1992 in New York City. In 2014, 516 U.S. communities were operating red light camera programs, but although new camera programs continued to be added in 2014, the total number of camera programs has declined slightly since 2012 as more programs were discontinued than were initiated. Commonly cited reasons for turning off cameras include a reduction in camera citations, difficulty sustaining the financial viability of the program (e.g., when fines from camera citations are shared with state government or when violators don’t pay fines), and community opposition.174 (In the United States, when ATE programs were put on an election ballot, the majority of residents—in 34 out of 37 votes held on the issue since 1991—rejected these programs.175)
Also, another important consideration is that a properly managed ATE program would not generate excess revenues. If all the measures Wise Up Winnipeg requested were implemented (revised speed limits, better signage, etc.),176 road safety would be improved for everyone, while ATE programs would not generate much revenue.

[27]
F R O N T I E R C E N T R E F O R P U B L I C P O L I C Y
CONCLUSION
Over the past 40 years in Canada, advances in vehicle engineering and measures other than speeding tickets have contributed to a reduction of road fatalities by a factor of 3 despite a doubling of the population.177
While speed limits obviously have their role and ATE can help in this and other (e.g., red light violation) respects, much evidence suggests that they are far from crucial in terms of their contribution to greater road safety, that they are more often implemented on emotional rather than engineering grounds, and that their capacity to generate revenues makes them irresistible to a large number of elected officials. In light of the available evidence, law-abiding and taxpaying citizens have a right to ask for more effective traffic enforcement methods that target really dangerous drivers and for fines and other penalties to be proportionate to the seriousness of the violations.
While many politicians and citizens view lower speed limits and rigorous traffic enforcement as panaceas for improved road safety, much scientific evidence tells otherwise. Proper engineering (e.g., design and maintenance of the road), education, and proper enforcement (which would include sensible ATE programs) must be a part of a holistic approach whose clear goal must be improved safety rather than revenue generation. From a motorist’s perspective, revenue generated from ATE programs should be used on improving infrastructure rather than adding to the municipalities’ coffers and expanding ATE programs to punish law-abiding citizens unfairly and unjustifiably.

[28]
F R O N T I E R C E N T R E F O R P U B L I C P O L I C Y
ENDNOTES
1 Dave Baxter, “Wise Up Winnipeg takes their street fight to the city and province: Group says speed enforcement unfairly targets drivers,” Metro (August 26, 2015), http://www.metronews.ca/news/winnipeg/2015/08/26/wise-up-winnipeg-takes-their-street-fight-to-the-city-and-provin.html; andGlen Dawkins, “Wise Up Winnipeg says public pressure pushed city to change tune,” Winnipeg Sun (August 22, 2015), http://www.winnipegsun.com/2015/08/22/wise-up-winnipeg-says-public-pressure-pushed-city-to-change-tune.
2 Christian Sweryda, Fix Winnipeg’s Speed Limit Signs and Review Speed Limits. Petition created on March 30, 2015, accessed August 30, 2015, https://www.change.org/p/mayor-brian-bowman-mit-minister-ron-kostyshyn-fix-winnipeg-s-speed-limit-signs-and-review-speed-limits/sponsors/new.
3 World Health Organization, Global status report on road safety 2013: supporting a decade of action (Geneva: World Health Organization, 2013), 1, http://www.who.int/violence_injury_prevention/road_safety_status/2013/en/.
4 Ibid.
5 World Health Organization, “Road Traffic Injuries,” Fact sheet N°358, accessed May 2015, http://www.who.int/mediacentre/factsheets/fs358/en/.
6 World Health Organization, Global status report on road safety 2013: supporting a decade of action, 4.
7 The International Traffic Safety Data and Analysis Group (IRTAD) is a permanent working group of the Joint Transport Research Centre of the Organisation for Economic Co-operation and Development (OECD) and the International Transport Forum. Its key outputs are the IRTAD database, which currently publishes safety data from 32 countries, and its annual report on road safety performance (http://internationaltransportforum.org/irtadpublic/coverage.html).
8 IRTAD, Road Safety Annual Report 2015 Summary (Paris: OECD/ITSF, 2015), 7, http://www.internationaltransportforum.org/Pub/pdf/15IRTAD_Summary.pdf.
9 Transport Canada, Road Safety in Canada (Ottawa: Transport Canada, 2011), http://www.tc.gc.ca/eng/motorvehiclesafety/tp-tp15145-1201.htm#f1.
10 Transport Canada, Canadian Motor Vehicle Collision Statistics 2013 (Ottawa: Transport Canada, 2013), http://www.tc.gc.ca/media/documents/roadsafety/cmvtcs2013_eng.pdf.
11 IRTAD, Road Safety Annual Report 2015 Summary, 12, 18.
12 Transport Canada, Canadian Motor Vehicle Collision Statistics 2013.
13 IRTAD, Road Safety Annual Report 2015 Summary, 15.
14 Public Health Agency of Canada, Injury in Review 2012 Edition: Spotlights on Road and Transport Safety (Ottawa: Public Health Agency in Canada, 2012), 20, http://www.parachutecanada.org/downloads/research/reports/InjuryInReview2012_EN.pdf.
15 Ibid., 19.
16 Transport Canada, Canadian Motor Vehicle Collision Statistics 2013. “Serious Injuries” include persons admitted to hospital for treatment or observation. Serious injuries were estimated from 1994 to 2013 because several jurisdictions under-reported these numbers.
17 Transport Canada, Canadian Motor Vehicle Collision Statistics 2013, 3, 5.
18 Public Health Agency of Canada, Injury in Review 2012 Edition: Spotlight on Road and Transport Safety (Ottawa: Public Health Agency of Canada, 2012), 20.
19 Statistics Canada, “The 10 leading causes of death in 2011,” http://www.statcan.gc.ca/pub/82-625-x/2014001/article/11896-eng.htm.
20 Number of traffic collision fatalities in 2011 was 2,023, based on Transport Canada, Canadian Motor Vehicle Collision Statistics 2013.
21 Another interpretation is: Assuming that a typical Canadian’s daily commute is 25 km one way, thus adding up to about 12,000 km per year, one fatal accident would be expected to happen to her/him per 14,880 years of commuting.
22 World Health Organization, Global status report on road safety 2013: supporting a decade of action, 1.
23 Transport Canada, Road Safety in Canada.
24 Ran Li, Karim El-Basyouny, and Amy Kim, A City-Wide Safety Analysis of Mobile Speed Enforcement (Edmonton, AB: City of Edmonton), http://www.edmonton.ca/transportation/City_Wide_Safety_Analysis_of_Mobile_Speed_Enforcement.pdf.This article was cited in: Karim El-Basyouny, “Research shows photo radar makes road safer,” Transforming Edmonton (October 7, 2014), https://transformingedmonton.ca/research-shows-photo-radar-makes-roads-safer/.

[29]
F R O N T I E R C E N T R E F O R P U B L I C P O L I C Y
25 Parachute, The Cost of Injury in Canada (Toronto: Parachute, 2015), 6, http://www.parachutecanada.org/downloads/research/Cost_of_Injury-2015.pdf.
26 National Highway Traffic Safety Administration (NHTSA), “Speeding,” Traffic Safety Facts 2012 Data (Washington, DC: U.S. Department of Transportation/NHTSA, May 2014), http://www-nrd.nhtsa.dot.gov/Pubs/812021.pdf.
27 NHTSA, National Motor Vehicle Crash Causation Survey: Report to Congress (Washington, DC: U.S. Department of Transportation/NHTSA, July 2008), 25, http://www-nrd.nhtsa.dot.gov/Pubs/811059.PDF.
28 European Conference of Ministers of Transport (ECMT), Speed Management (Paris: OECD/ECMT, 2006), http://www.internationaltransportforum.org/Pub/pdf/06Speed.pdf.
29 U.S. House of Representatives, Subcommittee on Highways and Transit of the Committee on Transportation and Infrastructure, Utilization and impacts of automated traffic enforcement, 111th Cong., 2nd session (Washington, DC: U.S. GPO, June 30, 2010), xii.
30 Ibid.
31 Ibid.
32 John Stuart Mill, On Liberty, 4th ed. (London: Longmans, Roberts, & Green Co., 1859), http://www.econlib.org/library/Mill/mlLbty.html.
33 Canadian Council of Motor Transport Administrators (CCMTA), Speed and Intersection Safety Management Annual Monitoring Report 2010 (Ottawa: Canadian Council of Motor Transport Administrators, 2011), http://ccmta.ca/en/publications/resources-home/item/annual-monitoring-report-2010.
34 GPS Data Team, “GPS POI for Canada,” https://poidirectory.com/poifiles/canada/safety/.
35 CCMTA, Speed and Intersection Safety Management Annual Monitoring Report 2010, 8.
36 Wise Up Winnipeg, https://www.facebook.com/groups/157907491221/.
37 SENSE, http://www.sense.bc.ca/.
38 Stop100.ca, http://www.stop100.ca/.
39 National Motorists Association, http://www.motorists.org/.
40 See, among others, National Motorists Association, “NMA Objections To Speed Cameras,” http://www.motorists.org/speed-cameras/objections; various documents available at Wise Up Winnipeg, https://www.facebook.com/groups/157907491221/files/; and Edmonton citizens’ comments on Karim El-Basyouny, “Research shows photo radar makes road safer.”
41 See, for instance, Office of the Ombudsman, An Investigation into the Administration and Collection of Traffic Camera Fines (Victoria, B.C.: Office of the Ombudsman, Province of British Columbia, 2004), http://www.sense.bc.ca/doc/traffic_camera.pdf.
42 Barry Prentice, “Ambushing drivers in speed trips must stop,” Winnipeg Free Press (January 19, 2013), http://www.winnipegfreepress.com/opinion/analysis/ambushing-drivers-in-speed-traps-must-stop-187569521.html.
43 Daniel Hummel, “Traffic Tickets: Public Safety Concerns or Budget Building Tools,” Administration & Society 47(3) (2015): 298–319.
44 Pamela Roth, “Some Alberta traffic fines to increase,” Edmonton Sun (March 26, 2015), http://www.edmontonsun.com/2015/03/26/some-alberta-traffic-fines-to-increase. The Government of Alberta announced the revised 2015 budget on October 27, 2015, and increased the sin taxes (tobacco and liquor). See “Budget 2015: Revenue” at http://www.alberta.ca/budget-revenue-explained.cfm.
45 Roth, “Some Alberta traffic fines to increase.”
46 Jason Van Rassel. “Budget: Drivers face much steeper fraffic fines,” Calgary Herald (March 26, 2015), https://calgaryherald.com/news/politics/budget-drivers-face-much-steeper-traffic-fines-as-budget-brings-in-first-higher-penalties-in-more-than-a-decade.
47 Ibid.
48 Drive citation statistics based on National Highway Traffic Safety Administration data. Statistics Brain Research Institution, “Driving Citation Statistics,” http://www.statisticbrain.com/driving-citation-statistics/.
49 T. A. Garrett and G. A. Wagner, “Red ink in the rear view mirror: Local fiscal conditions and the issuance of traffic tickets,” Journal of Law & Economics 52(1) (2009): 71–90.

[30]
F R O N T I E R C E N T R E F O R P U B L I C P O L I C Y
50 M. D. Makowsky and T. Stratmann, “Political economy at any speed: What determines traffic citations?” American Economic Review 99(1) (2009): 509–527.
51 Laura Kane, “Photo radar: Ontario vetoes Bill Blair’s plan to cut costs by catching speeders,” Toronto Star (January 9, 2013), http://www.thestar.com/news/gta/2013/01/09/photo_radar_ontario_vetoes_bill_blairs_plan_to_cut_costs_by_catching_speeders.html. In Ontario, a photo radar program was introduced on highways in 1994 under the NDP government and earned more than $19 million in revenues. Eleven months later, the newly elected Conservative government abolished the program as promised during the campaign. Since then there has been no photo radar program approved in any Ontario municipality. In British Columbia, the B.C. Liberals under Gordon Campbell scrapped the existing photo radar program in 2001. Canadian Press, “B.C. politicians want return of photo radar,” Global News (August 27, 2013), http://Globalnews.ca/news/.
52 Bruce Owen, “Red light? Green light? City, province stuck at confusion corner over controversial cameras,” Winnipeg Free Press (February 18, 2012), http://www.winnipegfreepress.com/local/red-light-green-light-139567903.html.
53 AB: Victim surcharge 15% rounded down to the nearest dollar.ON: Construction zone speeding fine amount applies when workers are present; if there are no workers, the amount is the same as a general speeding fine. *Victim surcharge and court fee ($5) included. **50 km/h+ only for photo radar tickets; others are settled in court for over 50km/h.MB: Fees include costs (45% of base fee), victim surcharge (25% of base fee), and justice service surcharge ($50). Sources: DriveSmartBC, Quick Reference Guide (2014), http://drivesmartbc.ca/where-can-i-find-list-bc-traffic-ticket-fine-amounts; Government of Alberta, “Procedures (Traffic Safety) Amendment Regulation,” (2015), http://www.qp.alberta.ca/documents/orders/orders_in_council/2015/315/2015_113.html; Société de l’assurance automobile Québec, “Fines,” last updated April 8, 2014, http://www.saaq.gouv.qc.ca/en/road_safety/behaviour/speed/speeding/penalties.php; Ontario Court of Justice, “Schedule 43,” (2015), http://www.ontariocourts.ca/ocj/how-do-i/set-fines/set-fines-i/schedule-43/; Proffer.ca, “How your traffic tickets and speeding tickets fine are calculated,” http://proffer.ca/Canada/Ontario/how-your-traffic-tickets-and-speeding-tickets-fine-are-calculated-ontario/; Government of Manitoba, Brown Book 2015, http://www.gov.mb.ca/justice/fines/pdf/brownbook.pdf; Canadian Automobile Association (CAA), “Distracted Driving Laws in Canada,” http://distracteddriving.caa.ca/education/distracted-driving-laws-in-canada.php.
54 Winnipeg Police Service, Photo Enforcement Program 2014 Annual Report (Winnipeg Police Service, 2015), http://winnipeg.ca/police/safestreets/docs/2014_photo_enforcement_ar.pdf.
55 Ibid.
56 Ibid.
57 Winnipeg Police Service, Annual statistical report 2014 (Winnipeg Police Service, 2015), http://winnipeg.ca/police/AnnualReports/2014/2014_wps_annual_report_english.pdf.
58 Winnipeg Police Service, Photo Enforcement Program 2014 Annual Report.
59 Ibid., 5.
60 Tristin Hopper, “Is Winnipeg addicted to traffic tickets?” National Post (April 9, 2015), http://news.nationalpost.com/news/canada/winnipeg-traffic-tickets.
61 Ibid.
62 Hopper, “Winnipeg is hiding school zone signs so it can raise more cash with speeding tickets,” National Post (October 31, 2012), http://news.nationalpost.com/news/canada/winnipeg-is-hiding-school-zone-signs-so-it-can-bring-in-more-cash-from-speeding-tickets-activist.
63 Hopper, “Is Winnipeg addicted to traffic tickets?”
64 Ibid. The reduced school zones were in effect from Monday to Friday, 7:00 a.m. to 5:30 p.m., from September 1 to June 30. “Winnipeg police crackdown in new school zone speed limits,” CBC News (September 2, 2014), http://www.cbc.ca/news/canada/manitoba/winnipeg-police-crack-down-in-new-school-zone-speed-limits-1.2752998.
65 Kristin Annable, “Cops ticket thousands for speeding in school zones,” Winnipeg Sun (April 6, 2015), http://www.winnipegsun.com/2015/04/06/cops-ticket-thousands-for-speeding-in-school-zones.
66 Hopper, “Is Winnipeg addicted to traffic tickets?” and Dawkins, “Wise Up Winnipeg says public pressure pushed city to change tune.” According to the article, the 50 km/h speed sign was reinstalled at a proper visual range in May 2012 by the municipality, at a location close to the intersection camera on Grant Avenue at Wilton Street, the third highest ticket issuance location in the city since 2003. The number of tickets issued dropped from 2,231 in 2012 to 117 in 2014. Though the violations included both red light running and speeding, appropriate signage must have affected this massive 94% ticket reduction. Winnipeg’s top five ticketed intersections since installation of cameras can be found at Winnipeg Police Service, Photo Enforcement Program, 11.
67 Winnipeg Police Service, Annual statistical report 2014.
68 Saranath Lawpoolsri, Jingyi Li, and Elisa R. Braver, “Do Speeding Tickets Reduce the Likelihood of Receiving Subsequent Speeding Tickets? A Longitudinal Study of Speeding Violators in Maryland,” Traffic Injury Prevention 8(1) (March 2007): 26–34, 32.

[31]
F R O N T I E R C E N T R E F O R P U B L I C P O L I C Y
69 Ibid., 31.
70 Ibid., 28.
71 Ibid., 32.
72 Ibid., 33.
73 Maryland State, “Managing Speed and Reducing Speed Related Crashes,” FAQs, http://www.safezones.maryland.gov/faqs.html#q14.
74 Bundesanstalt für Straßenwesen (BASt) (Federal Highway Research Institute), Traffic accident data: summary statistics—Germany (Bergisch Gladbach, October 2014), http://www.bast.de/EN/Publications/Media/Unfallkarten-national-englisch.pdf?__blob=publicationFile.
75 European Transport Safety Council, “German Autobahn: the speed limit debate,” Speed fact sheet No. 1 (Brussels: ETSC, February 2008), http://etsc.eu/wp-content/uploads/Speed_Fact_Sheet_1.pdf.
76 Bundesanstalt für Straßenwesen (BASt) (Federal Highway Research Institute), Traffic accident data: summary statistics—Germany.
77 IRTAD, Road Safety Annual Report 2015 Summary, 7.
78 Government of Alberta, Traffic Safety Act: Use of Highway and Rules of the Road Regulation Alberta, regulation 204/2002 (Government of Alberta), 8, http://www.qp.alberta.ca/documents/Regs/2002_304.pdf.
79 Manitoba Public Insurance, Put the Brakes on Speeding, July 2014, 3, https://www.mpi.mb.ca/en/PDFs/PuttingBrakesSpeed.pdf.
80 G. Nilsson, “Traffic safety dimensions and the power model to describe the effect of speed on safety,” Bulletin 221 (Lund, Sweden: Lund Institute of Technology, 2004).
81 NHTSA, “Speeding,” Traffic Safety Facts 2012 Data.
82 Alberta Transportation Office of Traffic Safety, Alberta Traffic Collisions—Driver error pie 2013 (Government of Alberta, October 2014), http://www.transportation.alberta.ca/Content/docType47/Production/DriverErrorPie2013.pdf.
83 Alberta Transportation Office of Traffic Safety, Alberta Traffic Collision Statistics 2013 (Government of Alberta, 2014), 20, http://www.transportation.alberta.ca/Content/docType47/Production/AR2013.pdf.
84 David Solomon, Accidents on main rural highways related to speed, driver, and vehicle (Washington, DC: U.S. Department of Commerce/Bureau of Public Roads, July 1964). This classic study was based on 11 states, 600 miles of main rural highways, the accident records of nearly 10,000 drivers, speed observations, and interviews with 290,000 highway users.
85 SENSE, “Speed Stats,” http://www.sense.bc.ca/speed-kills/.
86 National Motorists Association, “Speed Limit Fact Sheet,” https://www.motorists.org/wp-content/uploads/2015/05/speed-limit-fact-sheet.pdf.
87 IRTAD, Road Safety Annual Report 2015 Summary.
88 Ibid.
89 Ibid., 31.
90 M. R. Parker, Jr., Synthesis of Speed Zoning Practices, FHWA/RD-85/096 (Washington, DC: Federal Highway Administration, July 1985), http://www.ibiblio.org/rdu/sl-synth.html.
91 Anonymous, “Traffic engineering council report summary: Survey of speed zoning practices,” ITE Journal 71(5) (Washington, DC: Institute of Transportation Engineers, May 2001): 54–55.
92 Parker, Synthesis of Speed Zoning Practices.
93 Federal Highway Administration, Synthesis of Speed Zoning Practices, FHWA/RD-85/096 (Washington, D.C., July 1985).
94 Ibid.
95 National Motorists Association, “Speed Limit Fact Sheet.” The NMA is an American member-supported driver advocacy organization founded in 1982 to combat the 55 mph national maximum speed limit. It has written and lobbied much on the issue of speed cameras, red light cameras, and unreasonable low speed limits. See http://www.motorists.org/about/.

[32]
F R O N T I E R C E N T R E F O R P U B L I C P O L I C Y
96 Martin R. Parker, Jr., Huey-Yi Sung and Lori J. Dereniewski, Review and Analysis of Posted Speed Limits and Speed Limit Setting Practices in British Columbia: Final Report (Victoria, B.C.: British Columbia Ministry of Transportation, Spring 2003).
97 Parker, Synthesis of Speed Zoning Practices, 87.A more detailed literature review on speed limit changes can be found in J. Stuster and Z. Coffman, Synthesis of Safety Research Related to Speed and Speed Management, FHWA-RD-98-154 (Washington, DC: Federal Highway Administration, July 1998).
98 Lawrence E. Decina et al., Automated Enforcement: A Compendium of Worldwide Evaluations of Results, DOT HS 810 763 (Washington, DC: U.S. Department of Transportation/NHWSA, September 2007), 3.
99 N. J. Garber et al., The Impact of Red Light Cameras (Photo-Red Enforcement) on Crashes in Virginia (Charlottesville, VA: Virginia Transportation Research Council, 2007), http://www.virginiadot.org/vtrc/main/online_reports/pdf/07-r2.pdf.
100 Ibid., xvi.
101 Ward Vanlaar, Robyn Robertson, and Kayla Marcoux, Evaluation of the photo enforcement safety program of the city of Winnipeg: Final report (Ottawa, ON: Traffic Injury Research Foundation, July 2011), http://www.tirf.ca/publications/project_show.php?pid=13.
102 Ibid., viii, 97, 157.
103 In the report, the 46% reduction was cited in the executive summary (p. viii). This result, however, was associated only with the second instalment of 12 camera sites, while the other three instalments for 36 camera sites had non-significant increases and decreases in right-angle accidents. The actual number of right-angle crashes at 48 intersections with cameras from January 1994 through December 2008 in Winnipeg varied from single digits to close to 30 monthly (p. 88). In other words, there was less than one right-angle accident per camera site in even the worst month. Also, the series data on the camera-free sites for the same period was rather flat with a weak downward trend (p. 108). Furthermore, the national trend in terms of accident rates has been significantly down since 1970, as discussed in the “Road Safety in Canada” section of this report. Therefore, the 46% reduction number was not appropriate data to be used in terms of evaluating the effectiveness of the cameras, unless the authors were to clearly state something along the lines of “a maximum of” or “up to” 46%. It is very challenging to identify the specific effects of red light cameras as opposed to other (environmental, infrastructure change, etc.) effects.
104 Vanlaar, Robertson, and Marcoux, Evaluation of the photo enforcement safety program of the city of Winnipeg: Final report, 158.
105 Ibid., 182.
106 Ibid., 158.
107 Aecom Canada Ltd., Intersection Safety Device Program Evaluation: Red light Camera Analysis (Edmonton, AB: Alberta Transportation, March 2014). http://www.transportation.alberta.ca/3992.htm.
108 Vanlaar, Robertson, and Marcoux, Evaluation of the photo enforcement safety program of the city of Winnipeg: Final report, 13.
109 Ibid., 14.
110 Ibid.
111 Ibid., 15.
112 Max Cameron and Alan Buckingham, “Speed Off,” Policy 19(4) (2003), 60-64.There have been many disagreements on the effectiveness of photo enforcement among the studies. Please refer to the details:Vanlaar, Robertson, and Marcoux, Evaluation of the photo enforcement safety program of the city of Winnipeg: Final report, 17–20.
113 British Columbia Attorney General, “Two red-light cameras go live in Kamloops next week” (Government of British Columbia, July 4, 2000), http://www2.news.gov.bc.ca/archive/pre2001/2000/3401.asp.
114 U.S. House of Representatives, Subcommittee on Highways and Transit of the Committee on Transportation and Infrastructure, Utilization and impacts of automated traffic enforcement, 111th Cong., 2nd session (Washington, DC: U.S. GPO, June 30, 2010), 221–222.
115 Ibid.
116 Melissa Martin, “Just a sec, say traffic activists,” Winnipeg Free Press (August 16, 2010), http://www.winnipegfreepress.com/local/just-a-sec-say-traffic-activists-100747014.html.
117 FHWA, “Red-Light Running” (presentation material), Slide 28, last modified September 4, 2014, http://safety.fhwa.dot.gov/intersection/redlight/outreach/marketing/rlr_pps022509/long/.

[33]
F R O N T I E R C E N T R E F O R P U B L I C P O L I C Y
118 Jeffrey Griffiths, Red Light Camera Program: Although Red Light Cameras Have Contributed to a Reduction in Accidents, Opportunities Exist to Improve Financial Results and Program Effectiveness (Toronto: City of Toronto Auditor General, August 25, 2011), 17, http://www.toronto.ca/audit/2011/redlightcam-aug25.pdf.
119 Toronto City Council, Consolidated Clause in Works Committee, Report 6, Clause 5 (Toronto: City of Toronto, City Council on July 20, 21, and 22), 5, http://www.toronto.ca/legdocs/2004/agendas/council/cc040720/wks6rpt/cl005.pdf.
120 Griffiths, Red Light Camera Program: Although Red Light Cameras Have Contributed to a Reduction in Accidents, Opportunities Exist to Improve Financial Results and Program Effectiveness, 14.
121 Ibid.
122 Ibid., 5. The set fine for running red lights is established by the Chief Justice of the Ontario Court of Justice, while the victim surcharge fee and court costs are determined by the province and added to the set fine amount. The final fine amount is paid and court costs are retained by the City, while the victim surcharge amount is remitted to the province.
123 City of Toronto Auditor General, “Red Light Camera Program: Although Red Light Cameras Have Contributed to a Reduction in Accidents, Opportunities Exist to Improve Financial Results and Program Effectiveness” (August 25, 2011), 5.
124 Ibid., 15.
125 Griffiths, Red Light Camera Program: Although Red Light Cameras Have Contributed to a Reduction in Accidents, Opportunities Exist to Improve Financial Results and Program Effectiveness, 3.
126 Ibid., 17.
127 Toronto, Hamilton, Ottawa, Halton, Peel, and Waterloo in the pre-camera period from 1995 to 1999 and the post-camera accident history from 2000 to 2002—in total 48 red light camera locations. See Synectics Transportation Consultants Inc., Evaluation of the Red Light Camera Enforcement Pilot Project: Final Technical Report (Toronto: Ontario Ministry of Transportation, December 2003), http://www.thenewspaper.com/rlc/docs/2003-ontario.pdf.
128 Ontario Ministry of Transportation, “Evaluation of the Red Light Camera Enforcement Pilot Project: Final Technical Report” (2003), 39.
129 Synectics Transportation Consultants Inc., Evaluation of the Red Light Camera Enforcement Pilot Project: Final Technical Report, 16. Traffic safety engineers have been using Bayesian statistical tools for analyzing crash data for decades. As more sophisticated computer models and capacity became available, more advanced Full Bayes (FB) analysis with the potential for more reliable assessments (as long as data were abundant over a few years) had advantages over the Empirical Bayes (EB) analysis. Please refer to detailed comparisons between Full Bayes and Empirical Bayes approaches in: Alicia L. Carriquiry and Michael Pawlovich, “From Empirical Bayes to Full Bayes: Methods for Analyzing Traffic Safety Data,” Crash Analysis (Iowa Department of Transportation, October 25, 2004), accessed October 24, 2015, http://www.iowadot.gov/crashanalysis/pdfs/eb_fb_comparison_whitepaper_october2004.pdf.
130 Synectics Transportation Consultants Inc., Evaluation of the Red Light Camera Enforcement Pilot Project: Final Technical Report, 21.
131 Ontario Ministry of Transportation, “Evaluation of the Red Light Camera Enforcement Pilot Project: Final Technical Report” (2003), 21.
132 Ibid., 21–25.
133 Ibid., v.
134 Office of City Auditor, Automated Enforcement Review (Edmonton, AB: City of Edmonton, August 27, 2014), http://www.edmonton.ca/city_government/documents/14374_Automated_Photo_Enforcement_Review.pdf.
135 Ibid.
136 City of Edmonton, “Automated Enforcement Review” (August 27, 2014), 5.
137 Ibid.
138 Griffiths, Red Light Camera Program: Although Red Light Cameras Have Contributed to a Reduction in Accidents, Opportunities Exist to Improve Financial Results and Program Effectiveness, 3.
139 Government of Alberta, Budget 2015 (Edmonton, AB).
140 All data from the respective city’s 2012 financial reports.

[34]
F R O N T I E R C E N T R E F O R P U B L I C P O L I C Y
141 Chicago Department of Transportation, 2014 Annual Report City of Chicago Automated Enforcement Program (Chicago: City of Chicago, June 2015), http://www.cityofchicago.org/content/dam/city/depts/cdot/Speed%20Enforcement/2014AutomatedEnforcementReport06.17.2015.pdf. Editorial. “Ban Red Light Cameras? Not So Fast.” Chicago Tribune. April 27, 2015.
142 “Timeline of Red Light Cameras,” Chicago Tribune, http://graphics.chicagotribune.com/news/local/red-light-timeline/.
143 David Kidwall and Alex Richards, “Red light cameras tag thousands for undeserved tickets,” Chicago Tribune (July 18, 2014), http://www.chicagotribune.com/news/ct-red-light-camera-ticket-spikes-met-20140717-story.html.
144 “Illinois: Chicago Defends Use of Illegally Short Yellow Times,” TheNewsPaper.com, http://www.thenewspaper.com/news/47/4752.asp.Kidwall, “Experts: Chicago’s short yellow light times, red light cameras a risky mix,” Chicago Tribune (December 23, 2014), http://www.chicagotribune.com/news/watchdog/redlight/ct-yellow-light-timing-met-20141223-story.html.
145 Chicago Department of Transportation, 2014 Annual Report City of Chicago Automated Enforcement Program. This is the first annual report published after the re-elected mayor started the program reform as a part of the election campaign held in February 2015.“A Referendum on Red Light Cameras? Candidates Try to Fetch Votes by Promising to Remove Them,” Chicago Tribune (January 25, 2015).
146 Prentice, “Ambushing drivers in speed trips must stop.”
147 Marni Soupcoff, “Think police really don’t have ticket quotas? Check out these leaks,” National Post (May 2, 2012), http://news.nationalpost.com/full-comment/marni-soupcoff-think-police-really-dont-have-ticket-quotas-check-out-these-leaks.
148 W5 staff, Are police handing out traffic tickets to meet quotas? CTV W5 (on air January 26, 2013), http://www.ctvnews.ca/w5/are-police-handing-out-traffic-tickets-to-meet-quotas-1.1129762.
149 Robert Rocha, “End Ticket Quotas, Montreal Police Union Urges,” Montreal Gazette (November 19, 2014), http://montrealgazette.com/news/local-news/end-ticket-quotas-montreal-police-union-urges.
150 W5 staff, Are police handing out traffic tickets to meet quotas?
151 National Cooperative Highway Research Program (NCHRP), “Automated Enforcement for Speeding and Red Light Running,” NCHRP Report 729 (2012), 76, http://onlinepubs.trb.org/onlinepubs/nchrp/nchrp_rpt_729.pdf.
152 Dr. Karim El-Basyouny has been the Urban Traffic Safety Chair at the University of Alberta since 2011. See http://www.civil.engineering.ualberta.ca/en/Research/ResearchAreas/Transportation/KarimElBasyouny.aspx.
153 Li, El-Basyouny, and Kim, A Before-and-After Empirical Bayes Evaluation of Automated Mobile Speed 1 Enforcement on Urban Arterial Roads (Submitted for presentation at the 94th Annual Meeting of Transportation Research Board and for publication in Transportation Research Record: Journal of Transportation Research Board on July 31, 2014), 14, http://www.edmonton.ca/transportation/Evaluation_of_Speed_Enforcement_on_Urban_Arterial_Roads.pdf.
154 Li, El-Basyouny, and Kim, A City-Wide Safety Analysis of Mobile Speed Enforcement. Li, El-Basyouny, and Kim, A Before-and-After Empirical Bayes Evaluation of Automated Mobile Speed 1 Enforcement on Urban Arterial Roads.
155 NCHRP, “Automated Enforcement for Speeding and Red Light Running,” 76.
156 British Library, “English Translation of Magna Carta,” http://www.bl.uk/magna-carta/articles/magna-carta-english-translation.
157 Cited in Daniel Hummel, “Traffic Tickets: Public Safety Concerns or Budget Building Tools,” Administration & Society 47(3) (2015): 298–319.
158 Bob Egelko, “State offers 50% traffic ticket amnesty in 2012,” San Francisco Chronicle (October 13, 2011), http://www.sfgate.com/bayarea/article/California-plans-half-off-traffic-ticket-amnesty-2327240.php#ixzz1an0Ye75o.
159 Ibid.
160 Lucian McMahon, “D.C. Lines City Coffers with Arbitrary Traffic Tickets,” Reason Magazine (September 9, 2014), https://reason.com/blog/2014/09/09/dont-call-it-highway-robbery.
161 Helen Wells, The fast and the furious: drivers, speed cameras and control in a risk society (Farnham, Surrey: Ashgate, 2012), 139.
162 Leonard Evans, Traffic Safety (Bloomfield Hills: Science Serving Society, 2004), 420.
163 David Staples, “Evening read: This former photo radar worker says the city’s aggressive enforcement is ‘greasy,’” Edmonton Journal (October 22, 2015), http://edmontonjournal.com/storyline/evening-read-this-former-photo-radar-worker-says-the-citys-aggressive-enforcement-is-greasy.
164 Ibid.

[35]
F R O N T I E R C E N T R E F O R P U B L I C P O L I C Y
165 Office of Traffic Safety, Mobile Speed Enforcement Tickets (Edmonton, AB: City of Edmonton, March 2015), http://www.edmonton.ca/transportation/OTS_SpeedEnforcementData2014_March2015.pdf.
166 Emily Mertz, “Huge spike in photo radar tickets for 6-10 km/h over speed limit,” Global News (January 30, 2015), http://globalnews.ca/news/1803298/last-year-saw-huge-spike-in-photo-radar-tickets-for-6-10kmh-over-speed-limit.
167 Staples, “Evening read: This former photo radar worker says the city’s aggressive enforcement is ‘greasy.’”
168 Office of Traffic Safety, Motor Vehicle Collisions 2014 (Edmonton, AB: City of Edmonton, 2014), 4.
169 FHWA and NHTSA support a comprehensive approach to incorporate road engineering, driver’s education, and effective enforcement.
170 Transport Canada, Road Safety in Canada.
171 Brad N. Greenwood and Sunil Wattal, “Show Me The Way To Go Home: An Empirical Investigation of Ride Sharing and Alcohol Related Motor Vehicle Homicide,” Fox School of Business Research Paper No. 15-054 (January 2015), 22, http://ssrn.com/abstract=2557612.
172 Ibid.
173 Ibid., 23.
174 Insurance Institute for Highway Safety, “Red light running,” accessed August 30, 2015, http://www.iihs.org/iihs/topics/t/red-light-running/qanda.
175 “List of Public Voters Against Red Light Cameras and Speed Cameras,” TheNewsPaper.com, updated November 2015, http://www.thenewspaper.com/news/36/3655.asp.
176 Sweryda, Fix Winnipeg’s Speed Limit Signs and Review Speed Limits.
177 Transport Canada, Road Safety in Canada.

[36]
F R O N T I E R C E N T R E F O R P U B L I C P O L I C Y
BIBLIOGRAPHY
Aecom Canada Ltd. Intersection Safety Device Program Evaluation: Red light Camera Analysis. Edmonton, AB: Alberta Transportation, March 2014. http://www.transportation.alberta.ca/3992.htm.
Alberta Transportation Office of Traffic Safety. Alberta Traffic Collisions—Driver error pie 2013. Government of Alberta, October 2014. http://www.transportation.alberta.ca/Content/docType47/Production/DriverErrorPie2013.pdf.
Annable, Kristin. “Cops ticket thousands for speeding in school zones.” Winnipeg Sun, April 6, 2015. http://www.winnipegsun.com/2015/04/06/cops-ticket-thousands-for-speeding-in-school-zones.
Baxter, Dave. “Wise Up Winnipeg takes their street fight to the city and province: Group says speed enforcement unfairly targets drivers.” Metro, August 26, 2015. http://www.metronews.ca/news/winnipeg/2015/08/26/wise-up-winnipeg-takes-their-street-fight-to-the-city-and-provin.html.
British Columbia Attorney General. “Two red-light cameras go live in Kamloops next week.” Province of British Columbia, July 4, 2000. http://www2.news.gov.bc.ca/archive/pre2001/2000/3401.asp.
British Library. “English Translation of Magna Carta.” http://www.bl.uk/magna-carta/articles/magna-carta-english-translation.
Bundesanstalt für Straßenwesen (BASt) Federal Highway Research Institute. Traffic accident data: summary statistics—Germany. Bergisch Gladbach, October 2014. http://www.bast.de/EN/Publications/Media/Unfallkarten-national-englisch.pdf?__blob=publicationFile.
Cameron, Max, and Alan Buckingham. “Speed Off.” Policy 19(4) (2003): 60-64.
Canadian Automobile Association (CAA). “Distracted Driving Laws in Canada.” http://distracteddriving.caa.ca/education/distracted-driving-laws-in-canada.php.
Canadian Council of Motor Transport Administrators (CCMTA). Speed and Intersection Safety Management Annual Monitoring Report 2010. Ottawa: Canadian Council of Motor Transport Administrators, 2011. http://ccmta.ca/en/publications/resources-home/item/annual-monitoring-report-2010.
Canadian Press. “B.C. politicians want return of photo radar.” Global News, August 27, 2013. http://Globalnews.ca/news/.
Carriquiry, Alicia L., and Michael Pawlovich. “From Empirical Bayes to Full Bayes: Methods for Analyzing Traffic Safety Data.” Iowa Department of Transportation, October 25, 2004. Accessed October 24, 2015. http://www.iowadot.gov/crashanalysis/pdfs/eb_fb_comparison_whitepaper_october2004.pdf.
CBC News. “Winnipeg police crackdown in new school zone speed limits.” September 2, 2014. http://www.cbc.ca/news/canada/manitoba/winnipeg-police-crack-down-in-new-school-zone-speed-limits-1.2752998.
Chicago Department of Transportation. 2014 Annual Report City of Chicago Automated Enforcement Program. Chicago: City of Chicago, June 2015. http://www.cityofchicago.org/content/dam/city/depts/cdot/Speed%20Enforcement/2014AutomatedEnforcementReport06.17.2015.pdf.
Chicago Tribune. “Ban Red Light Cameras? Not So Fast.” Editorial, April 27, 2015.
———. “A Referendum on Red Light Cameras? Candidates Try to Fetch Votes by Promising to Remove Them.” Editorial, January 25, 2015.
———. “Timeline of Red Light Cameras.” http://graphics.chicagotribune.com/news/local/red-light-timeline/.
City of Edmonton. “Automated Enforcement Review.” August 27, 2014.
City of Toronto Auditor General. “Red Light Camera Program: Although Red Light Cameras Have Contributed to a Reduction in Accidents, Opportunities Exist to Improve Financial Results and Program Effectiveness.” August 25, 2011.
Dawkins, Glen. “Wise Up Winnipeg says public pressure pushed city to change tune.” Winnipeg Sun, August 22, 2015. http://www.winnipegsun.com/2015/08/22/wise-up-winnipeg-says-public-pressure-pushed-city-to-change-tune.
Decina, Lawrence E., Libby Thomas, Raghavan Srinivasan, and Loren Staplin. Automated Enforcement: A Compendium of Worldwide Evaluations of Results. Washington, DC: U.S. Department of Transportation/NHWSA, September 2007.
DriveSmartBC. Quick Reference Guide. 2014. http://drivesmartbc.ca/where-can-i-find-list-bc-traffic-ticket-fine-amounts.
Egelko, Bob. “State offers 50% traffic ticket amnesty in 2012.” San Francisco Chronicle, October 13, 2011. http://www.sfgate.com/bayarea/article/California-plans-half-off-traffic-ticket-amnesty-2327240.php#ixzz1an0Ye75o.
El-Basyouny, Karim. “Research shows photo radar makes road safer.” Transforming Edmonton, October 7, 2014. https://transformingedmonton.ca/research-shows-photo-radar-makes-roads-safer/.

[37]
F R O N T I E R C E N T R E F O R P U B L I C P O L I C Y
European Conference of Ministers of Transport (ECMT). Speed Management. Paris: OECD/ECMT, 2006. http://www.internationaltransportforum.org/Pub/pdf/06Speed.pdf.
European Transport Safety Council. “German Autobahn: the speed limit debate.” Speed fact sheet No. 1. Brussels: ETSC, February 2008. http://etsc.eu/wp-content/uploads/Speed_Fact_Sheet_1.pdf.
Evans, Leonard. Traffic Safety. Bloomfield Hills: Science Serving Society, 2004.
Federal Highway Administration (FHWA). “Red-Light Running.” Presentation material, Slide 28. Last modified September 4, 2014. http://safety.fhwa.dot.gov/intersection/redlight/outreach/marketing/rlr_pps022509/long/.
Garber, Nicholas J., John S. Miller, R. Elizabeth Abel, Saeed Eslambolchi, and Santhosh K. Korukonda. The Impact of Red Light Cameras (Photo-Red Enforcement) on Crashes in Virginia. Charlottesville, VA: Virginia Transportation Research Council, 2007. http://www.virginiadot.org/vtrc/main/online_reports/pdf/07-r2.pdf.
Garrett, T.A., and G. A. Wagner. “Red ink in the rear view mirror: Local fiscal conditions and the issuance of traffic tickets.” Journal of Law & Economics 52(1) (2009): 71–90.
Government of Alberta. “Budget 2015: Revenue.” http://www.alberta.ca/budget-revenue-explained.cfm.
———. “Procedures (Traffic Safety) Amendment Regulation.” 2015. http://www.qp.alberta.ca/documents/orders/orders_in_council/2015/315/2015_113.html.
———. Traffic Safety Act: Use of Highway and Rules of the Road Regulation Alberta. Regulation 204/2002. http://www.qp.alberta.ca/documents/Regs/2002_304.pdf.
Government of Manitoba. Brown Book 2015. http://www.gov.mb.ca/justice/fines/pdf/brownbook.pdf.
GPS Data Team. “GPS POI for Canada.” https://poidirectory.com/poifiles/canada/safety/.
Greenwood, Brad N., and Sunil Wattal. “Show Me The Way To Go Home: An Empirical Investigation of Ride Sharing and Alcohol Related Motor Vehicle Homicide.” Fox School of Business Research Paper No. 15-054. January 2015. http://ssrn.com/abstract=2557612.
Griffiths, Jeffrey. Red Light Camera Program: Although Red Light Cameras Have Contributed to a Reduction in Accidents, Opportunities Exist to Improve Financial Results and Program Effectiveness. Toronto: City of Toronto Auditor General, August 25, 2011. http://www.toronto.ca/audit/2011/redlightcam-aug25.pdf.
Hopper, Tristin. “Is Winnipeg addicted to traffic tickets?” National Post, April 9, 2015. http://news.nationalpost.com/news/canada/winnipeg-traffic-tickets.
———. “Winnipeg is hiding school zone signs so it can raise more cash with speeding tickets.” National Post, October 31, 2012. http://news.nationalpost.com/news/canada/winnipeg-is-hiding-school-zone-signs-so-it-can-bring-in-more-cash-from-speeding-tickets-activist.
Hummel, Daniel. “Traffic Tickets: Public Safety Concerns or Budget Building Tools,” Administration & Society 47(3) (2015): 298–319.
Institute of Transportation Engineers. “Traffic engineering council report summary: Survey of speed zoning practices.” ITE Journal 71(5) Washington, DC: Institute of Transportation Engineers, May 2001.
Insurance Institute for Highway Safety. “Red light running.” Accessed August 30, 2015. http://www.iihs.org/iihs/topics/t/red-light-running/qanda.
International Traffic Safety and Data Analysis Group (IRTAD). Road Safety Annual Report 2015 Summary. Paris: OECD/ITSF, 2015. http://www.internationaltransportforum.org/Pub/pdf/15IRTAD_Summary.pdf.
Kane, Laura. “Photo radar: Ontario vetoes Bill Blair’s plan to cut costs by catching speeders.” Toronto Star, January 9, 2013. http://www.thestar.com/news/gta/2013/01/09/photo_radar_ontario_vetoes_bill_blairs_plan_to_cut_costs_by_catching_speeders.html.
Kidwall, David. “Experts: Chicago’s short yellow light times, red light cameras a risky mix,” Chicago Tribune, December 23, 2014. http://www.chicagotribune.com/news/watchdog/redlight/ct-yellow-light-timing-met-20141223-story.html.
Kidwall, David, and Alex Richards. “Red light cameras tag thousands for undeserved tickets.” Chicago Tribune, July 18, 2014. http://www.chicagotribune.com/news/ct-red-light-camera-ticket-spikes-met-20140717-story.html.
Lawpoolsri, Saranath, Jingyi Li, and Elisa R. Braver. “Do Speeding Tickets Reduce the Likelihood of Receiving Subsequent Speeding Tickets? A Longitudinal Study of Speeding Violators in Maryland.” Traffic Injury Prevention 8(1) (March 2007): 26–34.
Li, Ran, Karim El-Basyouny, and Amy Kim. A City-Wide Safety Analysis of Mobile Speed Enforcement. Edmonton, AB: City of Edmonton. http://www.edmonton.ca/transportation/City_Wide_Safety_Analysis_of_Mobile_Speed_Enforcement.pdf.

[38]
F R O N T I E R C E N T R E F O R P U B L I C P O L I C Y
———. “A Before-and-After Empirical Bayes Evaluation of Automated Mobile Speed 1 Enforcement on Urban Arterial Roads.” Submitted for presentation at the 94th Annual Meeting of Transportation Research Board and for publication in Transportation Research Record: Journal of Transportation Research Board on July 31, 2014. http://www.edmonton.ca/transportation/Evaluation_of_Speed_Enforcement_on_Urban_Arterial_Roads.pdf.
Makowsky, M. D., and T. Stratmann. “Political economy at any speed: What determines traffic citations?” American Economic Review 99(1) (2009): 509–527.
Manitoba Public Insurance. Put the Brakes on Speeding. July 2014, 3. https://www.mpi.mb.ca/en/PDFs/PuttingBrakesSpeed.pdf.
Martin, Melissa. “Just a sec, say traffic activists.” Winnipeg Free Press, August 16, 2010. http://www.winnipegfreepress.com/local/just-a-sec-say-traffic-activists-100747014.html.
Maryland State. “Managing Speed and Reducing Speed Related Crashes.” FAQs. http://www.safezones.maryland.gov/faqs.html#q14.
McMahon, Lucian. “D.C. Lines City Coffers with Arbitrary Traffic Tickets.” Reason Magazine, September 9, 2014. https://reason.com/blog/2014/09/09/dont-call-it-highway-robbery.
Mertz, Emily. “Huge spike in photo radar tickets for 6-10 km/h over speed limit,” Global News, January 30, 2015. http://globalnews.ca/news/1803298/last-year-saw-huge-spike-in-photo-radar-tickets-for-6-10kmh-over-speed-limit.
Mill, John Stuart. On Liberty. 4th ed. London: Longmans, Roberts, & Green Co., 1859. http://www.econlib.org/library/Mill/mlLbty.html.
National Highway Traffic Safety Administration (NHTSA). “Speeding.” Traffic Safety Facts 2012 Data. Washington, DC: U.S. Department of Transportation/NHTSA, May 2014. http://www-nrd.nhtsa.dot.gov/Pubs/812021.pdf.
———. National Motor Vehicle Crash Causation Survey: Report to Congress. Washington, DC: U.S. Department of Transportation/NHTSA, July 2008. http://www-nrd.nhtsa.dot.gov/Pubs/811059.PDF.
National Cooperative Highway Research Program (NCHRP). “Automated Enforcement for Speeding and Red Light Running,” NCHRP Report 729 (2012). http://onlinepubs.trb.org/onlinepubs/nchrp/nchrp_rpt_729.pdf.
National Motorists Association. http://www.motorists.org/.
———. “NMA Objections To Speed Cameras.” http://www.motorists.org/speed-cameras/objections
———. “Speed Limit Fact Sheet.” https://www.motorists.org/wp-content/uploads/2015/05/speed-limit-fact-sheet.pdf.
TheNewspaper.com. “Illinois: Chicago Defends Use of Illegally Short Yellow Times.” July 22, 2015. http://www.thenewspaper.com/news/47/4752.asp.
———. “List of Public Voters Against Red Light Cameras and Speed Cameras.” November 2015. http://www.thenewspaper.com/news/36/3655.asp.Nilsson, Goran. “Traffic safety dimensions and the power model to describe the effect of speed on safety.” Bulletin 221. Lund, Sweden: Lund Institute of Technology, 2004.
Office of City Auditor. Automated Enforcement Review. Edmonton, AB: City of Edmonton, August 27, 2014. http://www.edmonton.ca/city_government/documents/14374_Automated_Photo_Enforcement_Review.pdf.
Office of the Ombudsman. An Investigation into the Administration and Collection of Traffic Camera Fines. Victoria, B.C.: Office of the Ombudsman, Province of British Columbia, 2004). http://www.sense.bc.ca/doc/traffic_camera.pdf.
Office of Traffic Safety. Mobile Speed Enforcement Tickets. Edmonton, AB: City of Edmonton, March 2015. http://www.edmonton.ca/transportation/OTS_SpeedEnforcementData2014_March2015.pdf.
Ontario Court of Justice. “Schedule 43.” 2015. http://www.ontariocourts.ca/ocj/how-do-i/set-fines/set-fines-i/schedule-43/.
Ontario Ministry of Transportation. “Evaluation of the Red Light Camera Enforcement Pilot Project: Final Technical Report.” 2003.
Owen, Bruce. “Red light? Green light? City, province stuck at confusion corner over controversial cameras.” Winnipeg Free Press, February 18, 2012. http://www.winnipegfreepress.com/local/red-light-green-light-139567903.html.
Parachute. The Cost of Injury in Canada. Toronto: Parachute, 2015. http://www.parachutecanada.org/downloads/research/Cost_of_Injury-2015.pdf.
Parker, M.R., Jr. Synthesis of Speed Zoning Practices. FHWA/RD-85/096. Washington, DC: Federal Highway Administration, July 1985. http://www.ibiblio.org/rdu/sl-synth.html.
Parker, Martin R., Jr., Huey-Yi Sung, and Lori J. Dereniewski. Review and Analysis of Posted Speed Limits and Speed Limit Setting Practices in British Columbia: Final Report. Victoria, B.C.: British Columbia Ministry of Transportation, Spring 2003.

[39]
F R O N T I E R C E N T R E F O R P U B L I C P O L I C Y
Prentice, Barry. “Ambushing drivers in speed trips must stop.” Winnipeg Free Press, January 19, 2013. http://www.winnipegfreepress.com/opinion/analysis/ambushing-drivers-in-speed-traps-must-stop-187569521.html.
Proffer.ca. “How your traffic tickets and speeding tickets fine are calculated.” http://proffer.ca/how-your-traffic-tickets-and-speeding-tickets-fine-are-calculated-ontario/.
Public Health Agency of Canada. Injury in Review 2012 Edition: Spotlights on Road and Transport Safety. Ottawa: Public Health Agency in Canada, 2012. http://www.parachutecanada.org/downloads/research/reports/InjuryInReview2012_EN.pdf.
Rocha, Robert. “End Ticket Quotas, Montreal Police Union Urges.” Montreal Gazette, November 19, 2014. http://montrealgazette.com/news/local-news/end-ticket-quotas-montreal-police-union-urges.
Roth, Pamela. “Some Alberta traffic fines to increase.” Edmonton Sun, March 26, 2015. http://www.edmontonsun.com/2015/03/26/some-alberta-traffic-fines-to-increase.
SENSE. http://www.sense.bc.ca/.
———. “Speed Stats.” http://www.sense.bc.ca/speed-kills/.
Société de l’assurance automobile Québec. “Fines.” Last updated April 8, 2014. http://www.saaq.gouv.qc.ca/en/road_safety/behaviour/speed/speeding/penalties.php.
Solomon, David. Accidents on main rural highways related to speed, driver, and vehicle. Washington, DC: U.S. Department of Commerce/Bureau of Public Roads, July 1964.
Soupcoff, Marni. “Think police really don’t have ticket quotas? Check out these leaks.” National Post, May 2, 2012. http://news.nationalpost.com/full-comment/marni-soupcoff-think-police-really-dont-have-ticket-quotas-check-out-these-leaks.
Staples, David. “Evening read: This former photo radar worker says the city’s aggressive enforcement is ‘greasy’.” Edmonton Journal, October 22, 2015. http://edmontonjournal.com/storyline/evening-read-this-former-photo-radar-worker-says-the-citys-aggressive-enforcement-is-greasy.
Statistics Brain Research Institute. “Driving Citation Statistics.” http://www.statisticbrain.com/driving-citation-statistics/.
Statistics Canada. “The 10 leading causes of death in 2011.” http://www.statcan.gc.ca/pub/82-625-x/2014001/article/11896-eng.htm.
Stop100.ca. http://www.stop100.ca/.
Stuster, J., and Z. Coffman. Synthesis of Safety Research Related to Speed and Speed Management. No. FHWA-RD-98-154. Washington, DC: Federal Highway Administration, July 1998.
Sweryda, Christian. Fix Winnipeg’s Speed Limit Signs and Review Speed Limits. Petition created on March 30, 2015. Accessed August 30, 2015. https://www.change.org/p/mayor-brian-bowman-mit-minister-ron-kostyshyn-fix-winnipeg-s-speed-limit-signs-and-review-speed-limits/sponsors/new.
Synectics Transportation Consultants Inc. Evaluation of the Red Light Camera Enforcement Pilot Project: Final Technical Report. Toronto: Ontario Ministry of Transportation, December 2003. http://www.thenewspaper.com/rlc/docs/2003-ontario.pdf.
Toronto City Council. Consolidated Clause in Works Committee. Report 6, Clause 5. Toronto: City of Toronto, City Council on July 20, 21, and 22. http://www.toronto.ca/legdocs/2004/agendas/council/cc040720/wks6rpt/cl005.pdf.
Transport Canada. Road Safety in Canada. Ottawa: Transport Canada, 2011. http://www.tc.gc.ca/eng/motorvehiclesafety/tp-tp15145-1201.htm#f1.
———. Canadian Motor Vehicle Collision Statistics 2013. Ottawa: Transport Canada, 2013. http://www.tc.gc.ca/media/documents/roadsafety/cmvtcs2013_eng.pdf.
U.S. House of Representatives, Subcommittee on Highways and Transit of the Committee on Transportation and Infrastructure. Utilization and impacts of automated traffic enforcement, 111th Cong., 2nd session. Washington, DC: U.S. GPO, June 30, 2010.
Vanlaar, Ward, Robyn Robertson, and Kayla Marcoux. Evaluation of the photo enforcement safety program of the city of Winnipeg: Final report. Ottawa, ON: Traffic Injury Research Foundation, July 2011. http://www.tirf.ca/publications/project_show.php?pid=13.
Van Rassel, Jason. “Budget: Drivers face much steeper traffic fines.” Calgary Herald, March 26, 2015. https://calgaryherald.com/news/politics/budget-drivers-face-much-steeper-traffic-fines-as-budget-brings-in-first-higher-penalties-in-more-than-a-decade.
W5 staff. Are police handing out traffic tickets to meet quotas? CTV W5, January 26, 2013. http://www.ctvnews.ca/w5/are-police-handing-out-traffic-tickets-to-meet-quotas-1.1129762.

[40]
F R O N T I E R C E N T R E F O R P U B L I C P O L I C Y
Wells, Helen. The fast and the furious: drivers, speed cameras and control in a risk society. Farnham, Surrey: Ashgate, 2012.
Winnipeg Police Service. Photo Enforcement Program 2014 Annual Report. Winnipeg Police Service, 2015. http://winnipeg.ca/police/safestreets/docs/2014_photo_enforcement_ar.pdf.
Wise Up Winnipeg. https://www.facebook.com/groups/157907491221/.
World Health Organization. Global status report on road safety 2013: supporting a decade of action. Geneva: World Health Organization, 2013. http://www.who.int/violence_injury_prevention/road_safety_status/2013/en/.
———. “Road Traffic Injuries.” Fact sheet N°358. Accessed May 2015. http://www.who.int/mediacentre/factsheets/fs358/en/.