speed maintenance under cognitive load – implications … et al 2011 - speed maintenance...
TRANSCRIPT

Speed maintenance under cognitive load – Implications for theories of driver
behaviourBen Lewis-Evans*, Dick De Waard, & Karel A. Brookhuis
Traff ic and Environmental Psychology Group, Neuropsychology, University of Groningen, Grote Kruisstraat 2/1, 9712 TS, The Netherlands
*Corresponding author. Tel.: +31 50 363 3190; fax: +31 50 363 6304.E-mail addresses: [email protected]
Previouisly published as Lewis-Evans, B., De Waard, D., & Brookhuis, K.A. (2011). Speed maintenance under cognitive load - Implications for theories of driver behaviour. Accident Analysis and Prevention, 43, 1497-1507 that can be accessed at:
http://dx.doi.org/10.1016/j.aap.2011.02.030
Authors archived copy

2
Speed maintenance under cognitive load – Implications for theories of driver behaviour
Abstract
No model of driver behaviour has yet managed to achieve widespread acceptance and use in the f ield of traff ic psychology, par tly due to the diff iculty in testing many of the theories. However, one class of theories, the motivational theories, can be usefully split into two groups, and the differences between them can then be examined. One group posits the constant monitoring and targeting of a cer tain subjective variable, often risk, as the controlling factor in driving. The other group however states that subjective variables such as risk are only relevant once a cer tain threshold has been passed.
In this study we aimed to examine this difference by manipulating both speed of travel and the amount of cognitive load par ticipants were under. Par ticipants were asked to initially drive at their preferred speed for 1 minute in a driving simulator. Par ticipants’ speed was then automatically increased or decreased by 10, 20, 30 km/h or left unchanged. Par ticipants were then required to maintain the new speed for 1 minute. After this 1 minute, the speed was again automatically changed and had to be maintained for one more minute, but this time par ticipants also carried out a secondary mental arithmetic task. Finally, par ticipants were asked to again drive for another 1 minute at their preferred speed. This procedure was repeated seven times, once for each speed manipulation; -30, -20, -10, +0, +10, +20 and +30 km/h. After each 1 minute interval, verbal ratings of task diff iculty, effor t, feeling of risk, and the typicality of the speed, were collected
The results show a threshold effect in ratings of task diff iculty, effor t and feeling of risk, with no signif icant difference given between the ratings during the baseline period and the experimentally decreased speed periods until after par ticipant’s preferred speed of travel had been exceeded. Fur thermore, even when under cognitive load the threshold relationship was still apparent, if somewhat diminished. Finally, it appears that when under cognitive load drivers have diff iculty maintaining a travelling speed which is lower than the speed at which they would prefer to drive. However, driving at a speed in excess of their preferred speed appears to be easier to maintain, at least in the shor t term.

3
Speed maintenance under cognitive load – Implications for theories of driver behaviour
1. Introduction
Motivational theories of driver behaviour can be roughly split into two groups. The f irst group is made up of those theories which state that drivers are constantly aware of, monitor, and seek to maintain a set level or range of a variable, such as risk. Whereas the second group of theories, claims that variables such as a perception or feeling of risk are only relevant, and only experienced, at cer tain times during driving, i.e. when a cer tain threshold is exceeded (Michon, 1989; Ranney, 1994; Rothengatter, 2002).
The classic example of the monitoring type of motivational model is Risk Homeostasis Theory (RHT) which was f irst put forward by Wilde (1976). RHT states that individuals have a target level of risk which they seek to maintain. This target level of risk is created through a motivational cost/benef it trade off, where the benef its and costs of risky behaviours are weighed against the benef its and costs of safer behaviours. RHT also states that unless these costs and benef its are altered, target risk will stay the same, and drivers will act in a fashion that means they are constantly monitoring and always attempting to return to this target level of risk. This process, called risk compensation by Wilde (1988), led to an extreme claim that road safety engineering measures, such as widening roads, would have no effect on safety; individuals would just use up the safety gained by widening the road, by speeding for example, in order to maintain their preferred level of risk. This extreme risk compensation has been discounted to a large extent, however, as it seems clear that many non-motivational road safety measures, such as the general improvement in car safety designs over time, have managed to have a positive impact on road safety (e.g. McKenna, 1990; OECD, 1990).
While complete risk compensation may not occur, negative behavioural adaptation, where drivers act in a fashion that reduces the safety which could otherwise be gained through an intervention, is a well accepted phenomenon (OECD, 1990). It should be noted, however, that behavioural adaptation is essentially just a way of saying that people change their behaviour in reaction to changes in the environment. This is hardly revolutionary. Behavioural adaptation can also act in a positive fashion to increase safety, for example, people drive slower on narrower roads (Godley, Triggs, & Fildes, 2004; Lewis-Evans & Charlton, 2006). Given the acceptance of behavioural adaptation, most modern theories of driver behaviour have concentrated not on trying to show if this phenomenon occurs, but why it does.
Other examples of theories that f it within the f irst monitoring and target maintaining group, include Risk Allostasis Theory (RAT)(Fuller, McHugh et al., 2008), and the Monitor Model (Vaa et al., 2000). RAT differs from RHT in that it specif ies that individuals maintain

4
Speed maintenance under cognitive load – Implications for theories of driver behaviour
a target range of a feeling of risk, rather than a single target level of crash risk put forward by RHT. Also RAT states that this target range is a lot more f lexible and open to change than the target level of risk within RHT, which was seen as quite f ixed and stable (Fuller & Santos, 2002; Fuller, 2005; Fuller et al., 2008; Wilde, 1988). Within the theoretical underpinnings of RAT, Fuller is quite clear that “the effects of risk on decision making are not binary” and that “task diff iculty and feelings of risk are continuously present variables which inform driver decisions” (Fuller et al., 2008, p. 31).
The Monitor Model differs from the previous two examples of monitoring theories in that it suggests that multiple subjective variables are monitored and maintained, leading to an overall target best feeling (Vaa et al., 2000; Vaa, 2003; Vaa, 2007). Although, within the framework of the Monitor Model the monitoring of feelings of risk is given high importance due to the assumed evolutionary value of being able to reliably detect risk (Vaa, 2003; Vaa, 2007).
Interestingly, both the Monitoring Model and RAT reference the Somatic Marker Hypothesis of Damasio as supporting their view of risk, or some other feeling, as being constantly monitored (Damasio, 1994; Damasio, 2003; Fuller, 2007; Fuller, 2008; Vaa, 2003; Vaa, 2007). However, the Somatic Marker Hypothesis does not seem to support this interpretation. Rather, it specif ically classif ies feelings, such as the feeling of risk central to RAT, as conscious perceptions of an internal body state. These feelings are therefore not seen as continuously present, and similarly the underlying internal body states, or emotions, are reactions to cer tain learnt or innate stimuli and also not continuously present for monitoring (Damasio, 1994; Damasio, 2003). It would seem therefore, in conf lict with the statements of Fuller et al. (2008; 2008), that the Somatic Marker Hypothesis does view the effect of risk on decision making as binary, in that it is either there or not. To be clear what is available in most cases, for constant monitoring, according to Damasio (1994; 2003) is the body itself. It is changes in the general body state caused by cer tain stimuli that can be detected, or that can inf luence behaviour unconsciously. These changes therefore only occur when cer tain thresholds have been crossed, i.e. if stimuli present or not, or present in a cer tain required quantity (Damasio, 1994, 2003).
This leads on to the threshold class of theories. The classic example of this is zero-risk theory (Näätänen & Summala, 1974; Summala, 1988). Zero-risk theory claims that risk is only perceived occasionally. Specif ically, zero-risk theory states that drivers only experience risk once cer tain safety margins have been exceeded. Only once this threshold is crossed, and risk is experienced, do drivers take action to reduce this risk back to zero if possible, unless they are otherwise motivated not to do so. It is worth pointing out here that while zero-risk theory does contain a component called the “Subjective Risk Monitor” this component is only triggered during the relatively rare situations when a driver’s safety margins have been

5
Speed maintenance under cognitive load – Implications for theories of driver behaviour
exceeded. This means that there is an aspect of the monitoring of risk in zero-risk theory, but this only occurs once a threshold has been crossed, and not continuously as claimed by monitoring models such as RAT (Fuller et al., 2008; Fuller, McHugh et al., 2008; Näätänen & Summala, 1974; Summala, 1988).
Other examples of threshold models are threat avoidance theory (Fuller, 1984) and the multiple comfort zone model (Summala, 2005). Threat avoidance theory (Fuller, 1984) is a behavioural model which suggests that people learn to associate risk with cer tain situations and only respond to risk when those situations arise. It also suggests that since the road environment is quite forgiving, associations between objectively risky driving and subjective impressions of risk are not often made and, therefore, not often experienced, and in fact this disconnect acts to encourage objectively risky behaviour.
The multiple comfort zone model (Summala, 2005) can be viewed as an evolution of the earlier zero-risk theory. It states that the maintenance of performance based safety margins are the primary controlling factors behind driver behaviour, but adds that there may be additional feelings, along with or instead of risk, which arise when these margins are exceeded. This creates an uncomfortable or unpleasant feeling that drivers will seek to remove. Ultimately the most important factor that separates the threshold models from the monitoring models is that in threshold models the relevant variable, often risk, acts as a warning and as a sensation that should be removed. In monitoring models, however, this subjective variable is constantly present and constantly guiding driver behaviour.
Unfortunately experiments aimed at testing specif ic models of driver behaviour have been relatively rare due to the diff iculties of coming up with valid, testable hypotheses that would effectively falsify the individual theories. However, it may be possible to at least examine the difference between the constant monitoring of subjective variables versus threshold perception of subjective variables and then perhaps the number of competing theories could be somewhat narrowed down.
Some previous experiments have found support for the constant monitoring of feeling of risk and task diff iculty in reaction to speed changes while driving (Fuller, McHugh et al., 2008; Kinnear et al., 2008), but others have challenged this and instead found evidence for threshold perception of these variables (Lewis-Evans & Rothengatter, 2009; Lewis-Evans, de Waard, & Brookhuis, 2010). What these studies do agree on is that there seems to be a strong relationship between how people perceive and rate a feeling of risk, and how they perceive and rate task diff iculty.

6
Speed maintenance under cognitive load – Implications for theories of driver behaviour
In this paper we seek to add to the previous experiments (Fuller, McHugh et al., 2008; Kinnear et al., 2008; Lewis-Evans & Rothengatter, 2009; Lewis-Evans et al., 2010) in two ways. Firstly, we again examine the relationship between speed and subjective ratings of task diff iculty, feeling of risk, and effor t. If accounts of constant monitoring are accurate, then ratings of task diff iculty, risk and required effor t should systematically increase with speed, as was found in the experiment of Fuller, McHugh et al. (2008). This would mean that ratings at speeds lower and higher than individuals preferred speed should be different from ratings drivers give when driving at their preferred speed. Conversely if a threshold account holds, then ratings of task diff iculty, feeling of risk and effor t should initially be low, stable, and no different from the ratings given during a baseline period where drivers are allowed to drive at the speed they prefer. Then once the speed at which drivers prefer to drive has been surpassed, ratings of task diff iculty, feeling of risk, and effor t, will increase. Idealised predicted differences between theoretical accounts, using ratings of task diff iculty as an example, are shown in Figure 1.
Figure 1. Idealised predictions of the relationship between ratings of task diff iculty and speed based on monitoring and threshold theories.
Mea
n Ra
ting
of Ta
sk D
i�cu
lty
Speed (km/h)
Monitoring TheoryThreshold Theory7
6
5
4
3
2
1
20 30 40 50 60 70 80 90

7
Speed maintenance under cognitive load – Implications for theories of driver behaviour
Secondly, we seek to fur ther explore the relationship between individuals’ repor ted perceptions of risk and their ratings of task diff iculty. These two variables have previously been found to be strongly related to each other (Fuller, McHugh et al., 2008; Kinnear et al., 2008), and also to ratings of effor t (Lewis-Evans & Rothengatter, 2009; Lewis-Evans et al., 2010). This is not surprising given that risk, diff iculty, and effor t are often linked naturalistically. In fact it is very diff icult to think of any way of increasing the diff iculty of driving without also increasing the risk. In this experiment the diff iculty of the task being performed has been increased through the addition of a secondary task.
The hypotheses related to the addition of the secondary task are twofold. Firstly, it was expected that the addition of a secondary task would increase ratings of effor t, task diff iculty, and feeling of risk. So in other words, if Figure 1 is examined, a rating of 1 would increase to a rating of 2 for example. The second hypotheses is that if a threshold type relationship, such as the one shown in Figure 1 was found, then it is possible that the presence of the threshold would be removed, or perhaps shifted to an earlier speed. This is based on the idea that simply the extra loading nature of the secondary task would cause the threshold to either be crossed right away, resulting in a monitoring type reaction as shown in Figure 1, or that it would be crossed earlier, for example at 40 km/h rather than 60 km/h in Figure 1.
2. Method
2.1. Participants
Par ticipants were recruited from students enrolled in the English Bachelors in Psychology at the University of Groningen and given course credit for par ticipation. To comply with the University’s ethical requirements, they provided informed consent before being admitted to the experiment. In order to take par t, par ticipants had to have had at least one year driving experience on a valid drivers’ licence. A total of 56 par ticipants were recruited in this way, 22 male and 34 female. However, one of the male par ticipants consistently drove at speeds in excess of 130 km/h during the experiment and was a clear outlier. As such, he was removed from the experiment. In addition, two female par ticipants experienced feelings of nausea when using the simulator and did not complete the experiment. This left 21 males and 32 females in the f inal dataset. The females on average were 20.4 years old (SD = 1.2) and had held a drivers’ licence for an average of 2.7 years (SD = .9). The males were 21.9 years old on average (SD = 2.9) and had held a drivers’ licence for an average of 3.6 years (SD = 2.6).

8
Speed maintenance under cognitive load – Implications for theories of driver behaviour
2.2. Materials
The experiment was carried out using the University of Groningen driving simulator. The simulator is on a f ixed base, running software by STSoftware and uses three LCD screens to give par ticipants a 210-degree view of the road environment. In order to hide the speed information, and force par ticipants to rely on their own perception of speed, a cardboard cutout was placed over the instrument panel. A winding rural road was created in the simulator with lane widths of 3.0 m in both the right and left hand lanes. The road also had the same surface proper ties and road marking for the entire drive and never altered in elevation. There was no traff ic in the simulation and information about par ticipants’ speed was collected at a rate of 10 Hz. The secondary task chosen, was the Paced Auditory Serial Addition Test (PASAT, Gronwall & Sampson, 1974) created using E-Prime software and run on a Windows XP laptop with an USB powered external speaker system.
2.3. Procedure
The experiment required many different steps and trials, and is somewhat complex. Therefore the procedure is summarised in Table 1 below.
Par ticipants provided consent to par ticipate and then f illed in a shor t questionnaire which collected information on their age, gender, and how long they had held their drivers’ licence. Par ticipants then completed a practice drive in the simulator for 5 minutes during which no data was recorded on their driving performance. If par ticipants were uncomfor table with the simulator they could continue to drive after this initial 5 minutes, however none of the par ticipants took this oppor tunity. If at this point, or at any other time during the experiment, the par ticipants star ted to feel nauseous or unwell they were asked to stop and did not progress in the study.
After the practice drive, the PASAT task was explained to the par ticipants and they were given a chance to practice it for 3 minutes, without driving. During the PASAT task, par ticipants heard a string of numbers from 1 to 9 being read out, with 1.8 seconds between each number. Par ticipants then had to verbally respond by adding the number they just heard to the number that they had heard preceding it. For example if they f irst heard the number 1, and then next heard the number 4, they were required to call out “5” (1 + 4), and then if the next number they heard was 3 then they had to reply “7” (4 + 3) and so on. The par ticipants were told to answer verbally as quickly as possible, and that their accuracy was being assessed, although no data was recorded during the PASAT practice session. Outside of the practice session,

9
Speed maintenance under cognitive load – Implications for theories of driver behaviour
Table 1. Summary of the procedure, detailing when speed, subjective and PASAT data were collected. The Practice Drive and PASAT practice only occurred once per par ticipant, then each par ticipant completed the trial blocks 7 times, once for each speed category (-30,-20,-10, +0,+10,+20+30 km/h).
Stage & Condition Data Recorded
Duration Speed PASAT Subjective
Pre-trial
1. Practice drive 5 minutes NO N/A NO
2. PASAT practice 3 minutes N/A NO N/A
Trial blocks - Repeated 7 times (-30,-20,-10,0,+10,+20+30 km/h) in random order for each participant
1. Baseline condition Duration Speed PASAT Subjective
1.1 Par ticipants instructed to star t the vehicle and drive at the speed they f ind most comfor table. Variable NO N/A NO
1.2 Par ticipants notify the experimenter that they have reached the speed they f ind most comfor table. Then they continue driving at this speed for 1 minute.
1 minute YES N/A NO
1.3 Par ticipants instructed to continue to drive in a fashion that maintains their control of the vehicle and take their time and to verbally answer 4 subjective questions about the last minute of driving (period 1.2). During this time par ticipants are free to vary their speed.
Variable NO N/A YES
2. No load condition Duration Speed PASAT Subjective
2.1 Using the average speed driven during step 1.2 of the Baseline condition as a reference point the control of speed is taken away from the par ticipant, and given to the simulator and increases or decreases by 10, 20, or 30 km/h or remains unchanged. Par ticipants must continue to control steering at this point but have no way of altering the speed.
Variable NO N/A NO
2.2 Par ticipants notify the experimenter that they could take control of speed back, and maintain the speed they are currently travelling at (the speed set in step 2.1)
Variable NO N/A NO
2.3 Speed control is given back to the par ticipants, returning them once again to full control. Par ticipants notify the experimenter when they believe they are trav-elling at the new speed that was set for them in step 2.1
Variable NO N/A NO
2.4 Par ticipants are asked to maintain their current speed for 1 minute 1 minute YES N/A NO
2.5 Par ticipants instructed to continue to drive in a fashion that maintains their control of the vehicle and take their time and to verbally answer 4 subjective questions about the last minute of driving (period 2.4). During this time par ticipants are free to vary their speed.
Variable NO N/A YES

10
Speed maintenance under cognitive load – Implications for theories of driver behaviour
3. Load condition Duration Speed PASAT Subjective
3.1 Using the average speed driven during step 1.2 of the Baseline condition as a reference point the control of speed is taken away from the par ticipant, and given to the simulator and increases or decreases by 10, 20, or 30 km/h or remains unchanged. Par ticipants must con-tinue to control steering at this point but have no way of altering the speed.
Variable NO N/A NO
3.2 Par ticipants then the experimenter that they could take control of speed back, and maintain the speed they are currently travelling at (the speed set in step 3.1)
Variable NO N/A NO
3.3 Speed control is given back to the par ticipants, returning them once again to full control. Par ticipants notify the experimenter when they believe they are trav-elling at the new speed that was set for them in step 3.1
Variable NO N/A NO
3.4 Par ticipants are asked to maintain their current speed for 1 minute and to simultaneously carry out the PASAT task to the best of their ability while maintaining control of the vehicle.
1 minute YES YES NO
3.5 Par ticipants instructed to continue to drive in a fash-ion that maintains their control of the vehicle and take their time and to verbally answer 4 subjective questions about the last minute of driving (period 3.4). During this time par ticipants are free to vary their speed.
Variable NO N/A YES
4. Return to baseline condition Duration Speed PASAT Subjective
4.1 Par ticipants instructed to drive at the speed they f ind most comfor table. Variable NO N/A NO
4.2 Par ticipants notify the experimenter that they have reached the speed they f ind most comfor table. Then they continue driving at this speed for 1 minute.
1 minute YES N/A NO
4.3 Par ticipants instructed to continue to drive in a fash-ion that maintains their control of the vehicle and take their time and to verbally answer 4 subjective questions about the last minute of driving (period 4.2). During this time par ticipants are free to vary their speed.
Variable NO N/A YES
4.4 Par ticipants are asked to stop the vehicle, and then the simulation is reset to the star t in order to run a new block.
Variable NO N/A NO
3.5 Par ticipants instructed to continue to drive in a fash-ion that maintains their control of the vehicle and take their time and to verbally answer 4 subjective questions about the last minute of driving (period 3.4). During this time par ticipants are free to vary their speed.
Variable NO N/A YES

11
Speed maintenance under cognitive load – Implications for theories of driver behaviour
the correct and incorrect answers were recorded by the experimenter but no feedback was given to the par ticipants as to the accuracy of their answers. During the experiment, while driving, par ticipants were instructed to perform the PASAT task to the best of their ability, while still maintaining control of the vehicle and the vehicle’s speed.
After practicing the PASAT task, the f irst trial block was star ted. The f irst condition was always a baseline (condition 1 in Table 1): in the baseline condition par ticipants were instructed to star t the vehicle and drive at a speed that they found most comfor table. They could take however long they wished to do so, and once they had reached a comfor table driving speed they then notif ied the experimenter. Only then, after being notif ied, was information on their driving speed recorded by the simulator for 1 minute, to establish a baseline average speed. During this 1 minute, par ticipants were simply instructed to continue to drive at whatever speed they found comfor table. After 1 minute was up the par ticipants continued to drive but had to give four verbal ratings to the following questions, asked in the order presented below by the experimenter:
How diff icult did you f ind it to drive this section of road at this speed?
1 2 3 4 5 6 7
Extremely Easy Extremely Diff icult
How much risk did you experience driving this section of road at this speed?
1 2 3 4 5 6 7
Maximum Risk No Risk
How much effor t did it take to drive this section of road at this speed?
1 2 3 4 5 6 7
No Effor t Maximum Effor t
Would you typically, in these conditions, drive at this speed
1 2 3 4 5 6 7
Always Never

12
Speed maintenance under cognitive load – Implications for theories of driver behaviour
It was stressed to the par ticipants that they should take their time to answer the above questions, and that remaining in control of the vehicle was the most impor tant factor. Ratings of feeling of risk were later reversed for data analyses.
The next step was the no load condition (condition 2 in Table 1): the par ticipants were informed, while still driving, that control of their speed would be taken away from them and given to the simulator, much like cruise control being engaged. Only speed control was taken away however, and par ticipants had to continue to steer. Using the average speed collected in the baseline condition, the speed of the vehicle was then increased or decreased by 10, 20, or 30 km/h or was set to the previous average speed. So if the par ticipant had driven 52 km/h on average during the baseline condition, then, in the plus 30 km/h trial the new speed would be set to 82 km/h. After the new speed was set, par ticipants were then asked to tell the experimenter when they thought they could take control of the speed back and continue to drive at the new speed they were currently travelling at. As with every step where the par ticipants were asked to notify the experimenter, par ticipants could take as much time as they liked to carry out this step. Once the par ticipants indicated that they could take control, then the experimenter switched speed control from the simulator back to manual. Since par ticipants could not see exactly the speed at which they were travelling from the speedometer, they had to rely on their own perception, which meant when speed was transferred back to the par ticipants it would sometimes increase or decrease. Therefore, par ticipants were instructed to say when they thought they were driving at the speed they had just observed. Once the par ticipants did indicate they were travelling at the appropriate speed, they were asked to attempt to maintain their speed of travel. Again, par ticipants had no feedback from the speedometer and had to rely on their own perception of speed to make this judgment. Speed data were then recorded for the next minute, after which par ticipants again had to give verbal ratings as described in the baseline condition. While giving these ratings par ticipants could vary their speed freely.
The next condition was the load condition (condition 3 in Table 1): this condition was nearly completely identical to the no load condition, including using the same average speed data from the baseline condition (condition 1 in Table 1). The only change is that par ticipants were required to complete the PASAT task as well as maintaining their speed during the 1 minute period before subjective impressions were collected.
The f inal condition in each trial was the return to baseline (condition 4 in Table 1) that was simply a repeat of the baseline condition. Once the return to baseline condition was completed in a trial, par ticipants were asked to stop the vehicle and the simulation was reset so that

13
Speed maintenance under cognitive load – Implications for theories of driver behaviour
another trial could begin. Each par ticipant completed 7 blocks of trials, each containing the 4 conditions described above. Each block represented one speed manipulation, and the blocks were presented in a randomly generated order for every par ticipant. This means that each par ticipant experienced driving at 10, 20, and 30 km/h faster and slower than their baseline periods, as well as one condition where the target speed set was the same as the average speed they drove during the baseline period. Fur thermore, the load and no load conditions were counter balanced across the par ticipants. This means that 26 par ticipants (11 males, 15 females) carried out the task as described in Table 1, and 27 par ticipants (10 males, 17 females) carried out the load condition (condition 3 in Table 1) of each trial before the no load condition (condition 2 in Table 1). On average the whole experiment took around one and a half hours to complete.
2.4. Analysis
The ratings of task diff iculty, effor t, feeling of risk, and typical driving speed were collected and averaged across all par ticipants for each speed category (+/- 0, 10, 20, 30 km/h) and condition (baseline, no load, load, return to baseline). For the analysis of the ratings of feeling of risk, the scores were reversed to bring them in line with the other ratings used. Analyses were also carried out for the objective data on the speeds travelled by the par ticipants. The independent variables in this experiment, therefore, are the speed conditions (+/- 0, 10, 20, 30 km/h) and the four trial conditions; baseline, no load, load, and return to baseline. The dependent variables are the actual speed driven and the subjective ratings of task diff iculty, feeling of risk, effor t, and the typical driving speed question. Accuracy on the PASAT task was the f inal dependent variable assessed. The programs used for analysis were SPSS 16 for Windows and IBM SPSS 18 for Macintosh.
14
Speed maintenance under cognitive load – Implications for theories of driver behaviour
3. Results
3.1. Ratings of task diff iculty, risk, effort and typical driving speed
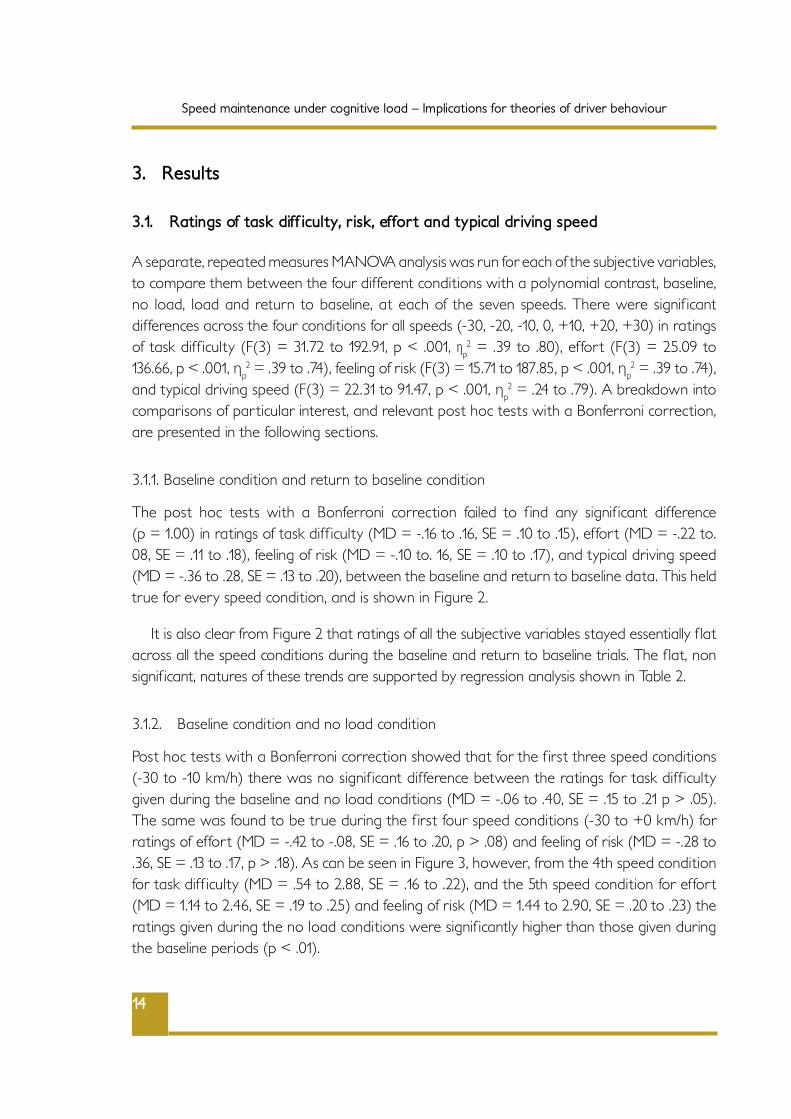
A separate, repeated measures MANOVA analysis was run for each of the subjective variables, to compare them between the four different conditions with a polynomial contrast, baseline, no load, load and return to baseline, at each of the seven speeds. There were signif icant differences across the four conditions for all speeds (-30, -20, -10, 0, +10, +20, +30) in ratings of task diff iculty (F(3) = 31.72 to 192.91, p < .001, ηp
2 = .39 to .80), effor t (F(3) = 25.09 to 136.66, p < .001, ηp
2 = .39 to .74), feeling of risk (F(3) = 15.71 to 187.85, p < .001, ηp2 = .39 to .74),
and typical driving speed (F(3) = 22.31 to 91.47, p < .001, ηp2 = .24 to .79). A breakdown into
comparisons of par ticular interest, and relevant post hoc tests with a Bonferroni correction, are presented in the following sections.
3.1.1. Baseline condition and return to baseline condition
The post hoc tests with a Bonferroni correction failed to f ind any signif icant difference (p = 1.00) in ratings of task diff iculty (MD = -.16 to .16, SE = .10 to .15), effor t (MD = -.22 to. 08, SE = .11 to .18), feeling of risk (MD = -.10 to. 16, SE = .10 to .17), and typical driving speed (MD = -.36 to .28, SE = .13 to .20), between the baseline and return to baseline data. This held true for every speed condition, and is shown in Figure 2.
It is also clear from Figure 2 that ratings of all the subjective variables stayed essentially f lat across all the speed conditions during the baseline and return to baseline trials. The f lat, non signif icant, natures of these trends are supported by regression analysis shown in Table 2.
3.1.2. Baseline condition and no load condition
Post hoc tests with a Bonferroni correction showed that for the f irst three speed conditions (-30 to -10 km/h) there was no signif icant difference between the ratings for task diff iculty given during the baseline and no load conditions (MD = -.06 to .40, SE = .15 to .21 p > .05). The same was found to be true during the f irst four speed conditions (-30 to +0 km/h) for ratings of effor t (MD = -.42 to -.08, SE = .16 to .20, p > .08) and feeling of risk (MD = -.28 to .36, SE = .13 to .17, p > .18). As can be seen in Figure 3, however, from the 4th speed condition for task diff iculty (MD = .54 to 2.88, SE = .16 to .22), and the 5th speed condition for effor t (MD = 1.14 to 2.46, SE = .19 to .25) and feeling of risk (MD = 1.44 to 2.90, SE = .20 to .23) the ratings given during the no load conditions were signif icantly higher than those given during the baseline periods (p < .01).

15
Speed maintenance under cognitive load – Implications for theories of driver behaviour
Figure 2. Average ratings of task diff iculty, effor t, feeling of risk, and I would typically drive at this speed across all speed categories (-30 to +30 km/h) for the baseline and return to baseline conditions. Speed category ‘0’ is the preferred speed.
Mea
n Ra
ting
Task Di�
culty
Variable
7.0
6.0
5.0
4.0
3.0
2.0
1.0
BaselineReturn to Baseline
E�ort
7.0
6.0
5.0
4.0
3.0
2.0
1.0
Feeling of Risk
7.0
6.0
5.0
4.0
3.0
2.0
1.0
I would typically
drive at this speed
7.0
6.0
5.0
4.0
3.0
2.0
1.0
-30 -20 -10 0 +10 +20 +30
Speed Category (km/h)
Error bars: 95% CI
Figure 3. Average ratings of task diff iculty, effor t, feeling of risk, and I would typically drive at this speed across all speed categories (-30 to +30 km/h) for the baseline and no load conditions. Speed category ‘0’ is the preferred speed.
Mea
n Ra
ting
Task Di�
culty
Variable
7
6
5
4
3
2
1
BaselineExperimental
E�ortFeeling of Risk
I would typically
drive at this speed
-30 -20 -10 0 +10 +20 +30
Speed Category (km/h)
Error bars: 95% CI
7
6
5
4
3
2
1
7
6
5
4
3
2
1
7
6
5
4
3
2
1

16
Speed maintenance under cognitive load – Implications for theories of driver behaviour
Speed Categories – Baseline
-30 to -10 km/h 0 to 30 km/h
r2 Beta t p r2 Beta t p
Task Diff iculty .00 .00 -.04 .97 .00 -.03 -.42 .67
Effor t .00 .00 -.03 .98 .00 .02 .35 .73
Feeling of Risk .00 .04 .43 .67 .00 -.06 -.80 .42
Typical Driving Speed .01 -.07 -0.85 .39 .00 -.02 -.34 .74
Speed Categories – Return to Baseline
-30 to -10 km/h 0 to 30 km/h
r2 Beta t p r2 Beta t p
Task Diff iculty .00 -.05 -.66 .51 .00 .06 .87 .38
Effor t .00 .01 .10 .92 .01 .09 1.26 .21
Feeling of Risk .00 -.03 -.35 .73 .00 -.02 -.34 .74
Typical Driving Speed .00 -.04 -.51 .61 .00 .04 .58 .56
Table 2. Regression analysis of the ratings of task diff iculty, effor t, feeling of risk, and typical driving speed for the baseline and return to baseline conditions.
Conversely ratings of whether the par ticipants would typically drive at the speed they were experiencing were signif icantly higher (p < .01) during the no load condition than those given during the baseline condition for all speed categories (MD = .98 to 3.12, SE = .20 to .31). As seen in Figure 3, ratings of typicality of speed appear to follow a somewhat U-shaped curve, with the bottom of the U being at the no speed change category. This means that par ticipants indicated that speeds were more and more typical as they approached no speed change, and then less so as they moved away from it. The trends described above are suppor ted by the results of the regression analysis for the no load condition, as shown in Table 3. There is no signif icant trend for ratings of task diff iculty and effor t between the -30 and -10 km/h speed categories (r2 = .00, p > .45) and then there is an increasing trend from the preferred speed category onwards (r2 = .26 and .25, p < .001).
17
Speed maintenance under cognitive load – Implications for theories of driver behaviour
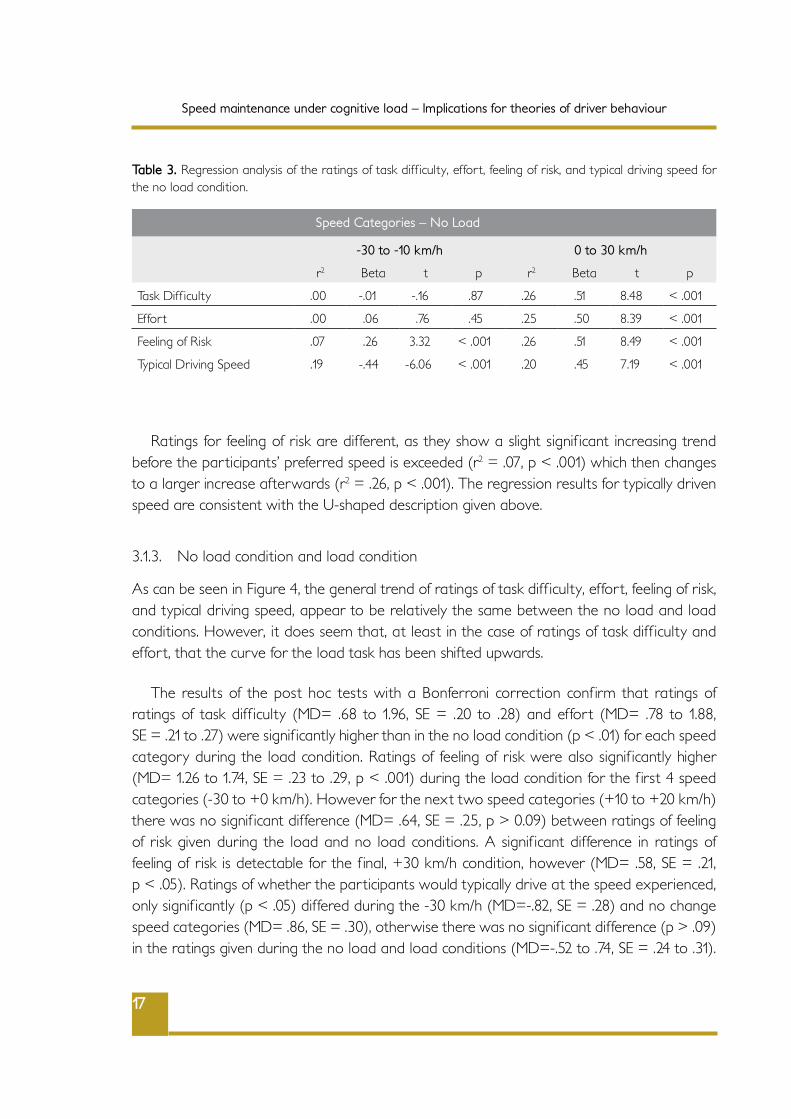
Table 3. Regression analysis of the ratings of task diff iculty, effor t, feeling of risk, and typical driving speed for the no load condition.
Speed Categories – No Load
-30 to -10 km/h 0 to 30 km/h
r2 Beta t p r2 Beta t p
Task Diff iculty .00 -.01 -.16 .87 .26 .51 8.48 < .001
Effor t .00 .06 .76 .45 .25 .50 8.39 < .001
Feeling of Risk .07 .26 3.32 < .001 .26 .51 8.49 < .001
Typical Driving Speed .19 -.44 -6.06 < .001 .20 .45 7.19 < .001
Ratings for feeling of risk are different, as they show a slight signif icant increasing trend before the par ticipants’ preferred speed is exceeded (r2 = .07, p < .001) which then changes to a larger increase afterwards (r2 = .26, p < .001). The regression results for typically driven speed are consistent with the U-shaped description given above.
3.1.3. No load condition and load condition
As can be seen in Figure 4, the general trend of ratings of task diff iculty, effor t, feeling of risk, and typical driving speed, appear to be relatively the same between the no load and load conditions. However, it does seem that, at least in the case of ratings of task diff iculty and effor t, that the curve for the load task has been shifted upwards.
The results of the post hoc tests with a Bonferroni correction conf irm that ratings of ratings of task diff iculty (MD= .68 to 1.96, SE = .20 to .28) and effor t (MD= .78 to 1.88, SE = .21 to .27) were signif icantly higher than in the no load condition (p < .01) for each speed category during the load condition. Ratings of feeling of risk were also signif icantly higher (MD= 1.26 to 1.74, SE = .23 to .29, p < .001) during the load condition for the f irst 4 speed categories (-30 to +0 km/h). However for the next two speed categories (+10 to +20 km/h) there was no signif icant difference (MD= .64, SE = .25, p > 0.09) between ratings of feeling of risk given during the load and no load conditions. A signif icant difference in ratings of feeling of risk is detectable for the f inal, +30 km/h condition, however (MD= .58, SE = .21, p < .05). Ratings of whether the par ticipants would typically drive at the speed experienced, only signif icantly (p < .05) differed during the -30 km/h (MD=-.82, SE = .28) and no change speed categories (MD= .86, SE = .30), otherwise there was no signif icant difference (p > .09) in the ratings given during the no load and load conditions (MD=-.52 to .74, SE = .24 to .31).

18
Speed maintenance under cognitive load – Implications for theories of driver behaviour
Figure 4. Average ratings of task diff iculty, effor t, feeling of risk, and I would typically drive at this speed across all speed categories (-30 to +30 km/h) for the no load and load conditions. Speed category ‘0’ is the preferred speed.
Task Di�
culty
7
6
5
4
3
2
1
PASATExperimental
E�ort
7
6
5
4
3
2
1
Feeling of Risk
7
6
5
4
3
2
1
I would typically
drive at this speed
7
6
5
4
3
2
1
Mea
n Ra
ting Variable
-30 -20 -10 0 +10 +20 +30
Speed Category (km/h)
Error bars: 95% CI
However, the U-shape for ratings of typical driving speed appears less acute during the load condition. The trends for the load condition are generally conf irmed by the results of a regression analysis as shown in Table 4. It can be seen that the trends are similar to those in the no load condition (see Table 3) but shallower.
Speed Categories – Load
-30 to -10 km/h 0 to 30 km/h
r2 Beta t p r2 Beta t p
Task Diff iculty .00 .00 -.05 .96 .11 .33 5.10 < .001
Effor t .01 .1 1.21 .23 .08 .28 4.22 < .001
Feeling of Risk .04 .20 2.51 < .05 .15 .39 6.00 < .001
Typical Driving Speed .03 -.16 -2.03 < .05 .14 .37 5.72 < .001
Table 4. Regression analysis of the ratings of task diff iculty, effor t, feeling of risk, and typical driving speed for the load condition.
19
Speed maintenance under cognitive load – Implications for theories of driver behaviour
3.2. Correlations between task diff iculty, effort and feeling of risk
Across all conditions, task diff iculty and effor t are highly correlated with each other (r = .69 to .85, p < .01). With the lowest correlations during the baseline and return to baseline periods (r = .69 and r = .71 respectively, p < .01), and the highest, during the no load and load conditions (r = .85 and r = .83 respectively, p < .01). Ratings of feeling of risk are moderately correlated with task diff iculty and effor t for the baseline (r = .60 and r = .56, p < .01) and return to baseline conditions (r = .65 and r = .62, p < .01). The no load condition (r = .81 and r = .75, p < .01) produced the highest correlations between task diff iculty, effor t and feeling of risk, with the load task also producing moderately high correlations (r = .69 and r = .70, p < .01).
3.3. PASAT accuracy
Accuracy at the PASAT task across all par ticipants ranged from an average of 67.24% (SD = 18.85) for the +30 km/h condition to 71.30% (SD = 14.21) for the -10 km/h condition, resulting in an average performance across all speed categories of 69.09% (SD = 12.81). Repeated measures MANOVA analysis found no signif icant differences between speed conditions (F(6) = 1.27, p > .27).
3.4. Speed differences between the baseline and return to baseline conditions
Repeated measures MANOVA with a polynomial contrast for condition, showed a clear effect on mean speed by condition for the -30, -20, -10, +10, +20 and +30 km/h speed trials (F(1) = 5.62–19.72, p < 0.05, ηp
2 = .11 to .30) but no signif icant effect during the no speed change category (F(1) = .61, p < .44, ηp
2 = .01). This can be seen in Figure 5 where the -30, -20, -10 km/h trials resulted in signif icantly lower speeds during the Return to Baseline condition, and the +10, +20 and +30 km/h categories resulted in signif icantly higher speeds. This was conf irmed through the use of a post hoc test with a Bonferroni correction, which again showed signif icantly different speeds (p < .001 to p < .05) for the -30, -20, -10, +10, +20 and +30 km/h conditions.

20
Speed maintenance under cognitive load – Implications for theories of driver behaviour
-30 -20 -10 0 10 20 30
Speed Category (km/h)Error bars: 95% CI
Mea
n Sp
eed
(km
/h)
100
90
80
70
60
50
40
30
20
10
0
Return to BaselineBaseline
Figure 5. Average speed travelled (km/h) during each speed category (-30 to +30 km/h) for the baseline and return to baseline conditions. Speed category ‘0’ is the preferred speed.
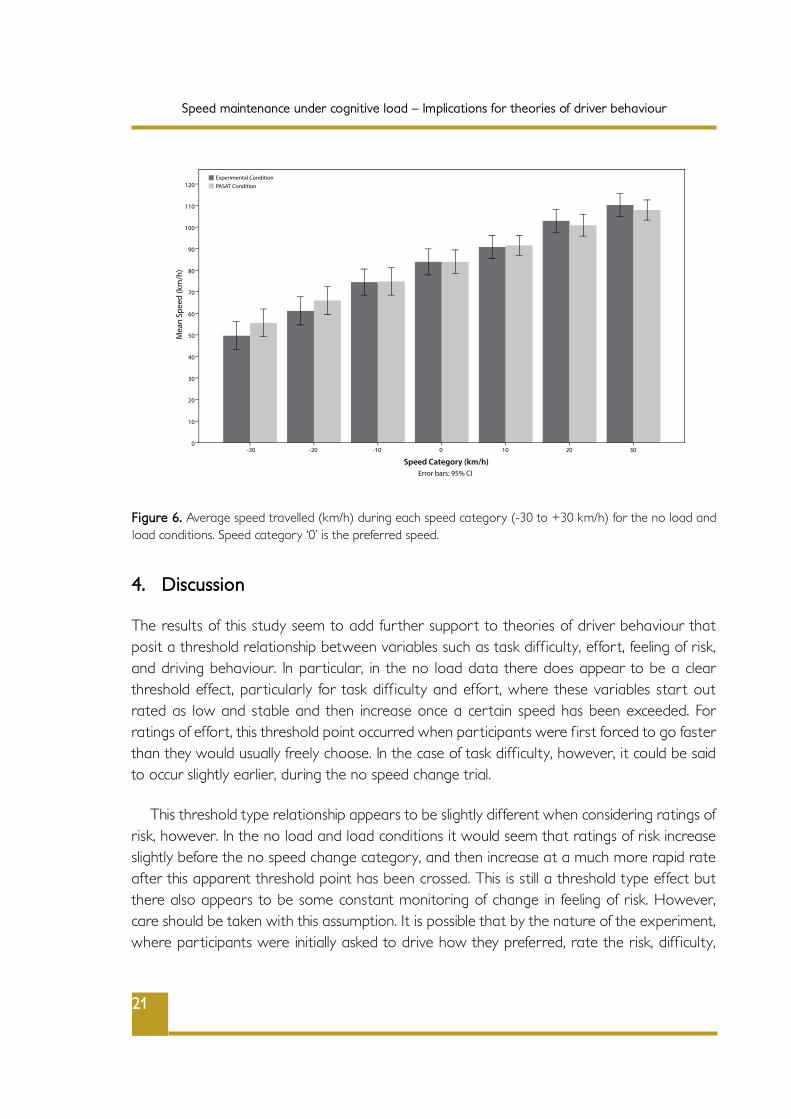
3.5. Speed differences between the no load and load conditions
The average speed during each speed category for the no load and load conditions are shown in Figure 6. While the speeds are generally similar it does appear that in the load condition par ticipants drove faster than during the no load condition during the -30 and -20 km/h speed categories, and slower during the +30 km/h condition. The use of a repeated measures MANOVA, with a polynomial contrast for condition, conf irms this with a signif icant main effect of speed during the -30 (F(1) = 6.26, p < .05, ηp
2= .13), -20 km/h (F(1) = 4.51, p < .05, ηp
2= .10) and +30 km/h (F(1) = 4.91, p < .05, ηp2 = .10) speed categories. There was
no signif icant difference between the average speed driven during the no load and load conditions for any of the other speed categories (F(1) = .02 to 2.4, p > .13). A post hoc test with a Bonferroni correction, conf irms these f indings, with a signif icant effect of load for the -30, -20 and +30 km/h conditions (p < .05) (Figure 6).
21
Speed maintenance under cognitive load – Implications for theories of driver behaviour
-30 -20 -10 0 10 20 30
Speed Category (km/h)Error bars: 95% CI
Mea
n Sp
eed
(km
/h)
120
110
100
90
80
70
60
50
40
30
20
10
0
PASAT ConditionExperimental Condition
Figure 6. Average speed travelled (km/h) during each speed category (-30 to +30 km/h) for the no load and load conditions. Speed category ‘0’ is the preferred speed.
4. Discussion
The results of this study seem to add fur ther suppor t to theories of driver behaviour that posit a threshold relationship between variables such as task diff iculty, effor t, feeling of risk, and driving behaviour. In par ticular, in the no load data there does appear to be a clear threshold effect, par ticularly for task diff iculty and effor t, where these variables star t out rated as low and stable and then increase once a cer tain speed has been exceeded. For ratings of effor t, this threshold point occurred when par ticipants were f irst forced to go faster than they would usually freely choose. In the case of task diff iculty, however, it could be said to occur slightly earlier, during the no speed change trial.
This threshold type relationship appears to be slightly different when considering ratings of risk, however. In the no load and load conditions it would seem that ratings of risk increase slightly before the no speed change category, and then increase at a much more rapid rate after this apparent threshold point has been crossed. This is still a threshold type effect but there also appears to be some constant monitoring of change in feeling of risk. However, care should be taken with this assumption. It is possible that by the nature of the experiment, where par ticipants were initially asked to drive how they preferred, rate the risk, diff iculty,

22
Speed maintenance under cognitive load – Implications for theories of driver behaviour
and effor t, and then explicitly saw an ar tif icial increase or decrease in their speed, and were then again asked to provide ratings for that new speed, that this could have introduced bias into their answers. Explicitly seeing the speed changes may have induced more rational comparative thinking when asked for ratings of risk than is likely to exist in normal driving.
The par ticipants’ average ratings of task diff iculty, effor t, and feeling of risk were found to be highly correlated with each other, although the correlations did differ somewhat between the conditions. This is in line with previous research and is likely due to the naturalistic linkage between these variables during most tasks (Fuller et al., 2008; Fuller, McHugh et al., 2008; Lewis-Evans & Rothengatter, 2009; Lewis-Evans et al., 2010).
The additional diff iculty of performing the PASAT task is clearly demonstrated by the higher ratings of task diff iculty, effor t, and feeling of risk given by the par ticipants during the load condition. In par ticular, the average ratings for task diff iculty and effor t during the minus 30 km/h trial are higher even than those given during the plus 10 km/h trial in the no load condition. However the threshold trend in the subjective ratings is still apparent in the load condition data, with an increasing trend in ratings of task diff iculty, effor t, and feeling of risk after the no speed change category has been exceeded. This highlights the impor tance of actual travelled speed, and par ticularly the usually travelled speed, rather than subjective impressions of task diff iculty, effor t, and feeling of risk in triggering this threshold effect.
There is one variable in the paper that could be described as constantly changing, and thus open to constant monitoring, and that is the rating of the typicality of the speed being experienced by the par ticipants. In the no load condition data, and to a lesser extent in the load condition data, ratings of how typical the speed experienced was, trends down towards where the threshold point for the other variables occurs and then trends upward after this point has been exceeded. This indicative nature of how typical the experience is, has also been found in previous studies of both speed (Lewis-Evans & Rothengatter, 2009) and close following behaviour (Lewis-Evans et al., 2010) where again, the ratings of this variable pointed to where the threshold point for ratings of task diff iculty, effor t, and feeling of risk would occur. This suggests that choosing a speed of travel could be based more on past experience and driving in a habitual, automatic fashion, rather than on aiming for a par ticular level of a subjective variable.
Fur ther suppor t for a tendency to move towards a habitual speed is in the recorded speed results for the no load and load conditions. During these tasks the par ticipants had to target and maintain a new speed initially set for them by the simulator. In most cases, they were able to do so, with or without the PASAT task. However, during the -30 and -20 speed categories
23
Speed maintenance under cognitive load – Implications for theories of driver behaviour
in the load condition, the par ticipants drove signif icantly faster than they did during the no load condition. This means that despite indicating that the task was more diff icult, more effor tful, and felt more risky than the in no load condition, the par ticipants actually drove faster in this condition and therefore technically increased the objective diff iculty and risk of the situation. This is in contrast to conventional thinking that when under load, action should be taken to objectively decrease load. The increase may be because the extra mental workload created by the PASAT task reduces a par ticipant’s ability to consciously control or monitor their speed, which leads to speed maintenance being handled more by lower level automated processes which work to increase the speed back towards a habitually learnt speed. However, increasing their speed does bring them back towards the speed they would choose to drive if freely able to. If this speed control is indeed somewhat habitual, and automatic, it is likely that it takes very little cognitive effor t to drive at your preferred speed (Rasmussen & Jensen, 1974), therefore, it could be claimed that by driving faster the par ticipants are in fact reducing the effor t needed to perform the task. There was only one signif icant drop in speed during the high speed categories while under the load condition, which occurred for the +30 km/h category. This suggests that people may be better at maintaining speeds in excess of what they prefer to drive when under secondary task load than they are at maintaining speeds which are lower than they would typically drive, at least for the shor t periods of time examined in this experiment. The above f indings are consistent with the accounts of threshold theories, as they suggest that driving, including speed choice, is often controlled by habitual, over learnt and often unconscious automated skills (Fuller, 1984; Näätänen & Summala, 1974; Summala, 2005).
A potential issue with the speed f indings is that in this experiment par ticipants did not have access to their exact speed through a speedometer. This is a threat to the ecological validity of the experiment and may mean that the results found here would not occur in real situations where drivers could check the speedometer at any time. However, Recar te and Nunes (2002) found a similar effect where their par ticipants increased their travelling speed when given additional mental tasks, but only if the par ticipants were driving at a slower speed than they would typically choose, otherwise no change in driving speed was found. The increase occurred irrespective of whether the par ticipants had access to a speedometer or not. Additionally, research on driver gaze patterns has found that drivers do not spend much time looking at their instruments. For example Harbluk et al. (2007) found that their subjects only devoted around 1.5% of their time gazing at their instruments, and that this signif icantly reduces to around .6% of their time when placed under cognitive load. This means that at other times drivers are likely to be relying on their own perception of the speed from the environment around them, much as they had to in this experiment. The f inding that

24
Speed maintenance under cognitive load – Implications for theories of driver behaviour
drivers are worse at maintaining lower speeds when under mental load also lends suppor t to the claim that some propor tion of speeding may be carried out unintentionally (Fuller et al., 2008; Fuller, McHugh et al., 2008). It may be the case that automatic, habitual, speed preferences have build up from a history of repeated intentional speeding, or it may be that par ticular elements of road design suggest an inappropriate speed to drivers when they are distracted, and is acted on by automatic processes despite the presence of contrary legal speed limits, temporary or permanent. This distinction could be investigated through fur ther study.
Finally, if ratings of all the subjective variables are compared between the after and baseline periods then there is no difference in the ratings given. However, in terms of the speed driven, the par ticipants drove signif icantly slower in the return to baseline conditions when they had previously been made to drive slower than they preferred in the no load and load conditions, and drove signif icantly faster if they had been made to drive faster in the no load and load conditions. This f inding points to a speed adaptation effect, where driving at the faster or slower speed has altered the par ticipants’ visual perception of speed (Schmidt & Tiff in, 1969). This f inding does not par ticularly add to the discussion around the two groups of driver behaviour models, but it is surprising that the apparent speed adaptation occurred so quickly, given that par ticipants were only driving at increased or decreased speed for a few minutes.
There are a few potential problems with this study which are worth noting. The f irst is the ar tif icial nature of the speed maintenance task. Speed choice is typically seen as being freely manipulated by drivers. Forcing drivers to pay attention and maintain a speed, rather than vary it naturally, may in itself have increased the diff iculty of the driving task and inf lated the subsequent subjective ratings. Similarly just by making the par ticipants aware that they had to provide ratings of task diff iculty, effor t, feelings of risk, and how typical the speed experienced was, may have made these variables more salient than they would usually be in day to day driving. Again, this would be expected to have perhaps inf lated their ratings of the subjective variables. Conversely, it is possible that the Liker t scale the par ticipants used to provide subjective impressions of task diff iculty, effor t, feeling of risk, and typical driving speed, was not sensitive enough to pick up small changes in these variables and, therefore, suppressed the ratings and changed the nature of the trends shown, especially at the speeds below the par ticipants’ preferred speed. The changes in speeds used in this experiment were quite large however, and the scales used were consistent with those appearing in previous studies (Fuller, McHugh et al., 2008; Kinnear et al., 2008; Lewis-Evans & Rothengatter, 2009; Lewis-Evans et al., 2010). Perhaps future research should investigate the use of a continuous scale, although these scales do carry the possibility of over exaggeration of values by par ticipants.
25
Speed maintenance under cognitive load – Implications for theories of driver behaviour
Another potential problem is that the distance covered by the individual participants was not constant across all speed categories. For example, during the minus 30 conditions, participants would have covered on average around 4.38 km across the four 1 minute periods in which data was collected. In the plus 30 condition this would have increased to an average of approximately 6.40 km travelled. This is further complicated because, as can be seen from Table 1 in Section 2, the participant’s own free choice of speed during the baseline condition was used as a reference point for setting speeds for the no load and load condition in each block of trials. This means that driving speed could vary across participants, and across trials within participants. Therefore, the distance covered could also vary. All of this means the ratings given for the higher speeds are confounded by the participants also having travelled more distance and, therefore, encountered more turns and twists of the road network, and vice versa for the slower speeds. Furthermore, as shown in Table 1, participants could also take however long they wanted to notify the experimenter that they are either at a comfortable speed, in the baseline or return to baseline condition, or that they can take control of the speed back in the load and no load conditions. During this time the participants continued to drive and, therefore, progress down the road. While participants were not asked about this time and no data was recorded, it could have also impacted on their subjective ratings, likely increasing them due to the increased diff iculty of the task in terms of deciding when to give control back. Given this, it is promising that we still f ind a threshold relationship. Also, it is hoped that the random order of speed trials helped to minimise any bias this introduced.
The f inding that performance in the PASAT task was constant across all speed categories is another potential problem. It would be expected that as the diff iculty of the main driving task increased then the accuracy of the secondary PASAT task should decrease with the increased external load caused by faster speeds due to there being only a limited amount of cognitive resources available at any one time (de Waard, 1996). This did not occur. One possible explanation is that the PASAT task was not diff icult enough, although on average participants did only have an accuracy of around 70% which suggests it was challenging for them, although consistently so. In future studies it may, therefore, be better to use a shorter time interval between presentations of the numbers, or perhaps modify the PASAT task so that, for example, participants are required to add the number they just heard to the number they heard two presentations ago. It is also possible that PASAT is not sensitive enough to changes in cognitive load brought about by changes in speed. It should also be said that simply by including a secondary task such as the PASAT lowers the ecological validity of the experiment. The PASAT task is not a realistic task that drivers will be typically carrying out while driving. Therefore, perhaps for future studies a more naturalistic secondary task should be chosen. However the PASAT task does have the advantage of creating a high level of load and is continuous, as well as easy to administer verbally, which is why it was selected for this experiment.

26
Speed maintenance under cognitive load – Implications for theories of driver behaviour
Finally, the par ticipants who took par t in this experiment were all of one age group. Specif ically, they were young psychology students at the University of Groningen. As such, this limits the generalisability of the f indings. Future research would be aided by examining a wider age group, and also individuals of varying experience. However, previous research in this area found no differences in ratings of task diff iculty and feeling of risk between learner, inexperienced and experienced drivers (Kinnear et al., 2008; Lewis-Evans et al., 2010).
1.1 Conclusion
This paper, while not conclusive, does present fur ther evidence for a threshold relationship in the perception of task diff iculty, effor t, and feeling of risk. It does not fully suppor t an idea that the perception of these variables is necessarily nil before this threshold point is crossed. But rather, that they only seem to alter in a clear and systematic fashion after a threshold point has been exceeded.
This paper also highlights the habitual control of speed with ratings of the typicality of the speed experienced being the most sensitive of all the subjective measures. Fur thermore, it seems that drivers who are under cognitive load are not as good at maintaining speeds lower than they would typically drive as they are at maintaining speeds higher than normal, at least for shor t periods. The result of this could be that, when distracted, drivers could speed up unconsciously and break speed limits without intending to. If some signif icant propor tion of speeding is indeed unintentional then the countermeasures aimed at preventing it will have to be different from those which could target intentional speeding. The paper also appears to show that speed adaptation can occur after only shor t periods of increased or decreased speed.

27
References
Damasio, A. R. (1994). Descar tes' Error: Emotion, Reason, and the Human Brain. New York: Putnam.
Damasio, A. R. (2003). Looking for Spinoza: Joy, sorrow, and the feeling brain. London: Heinemann.
de Waard, D. (1996). The measurement of drivers' mental workload. Thesis, University of Groningen.
Fuller, R. (1984). A conceptualization of driving behaviour as threat avoidance. Ergonomics, 27(11), 1139-1155.
Fuller, R. (2005). Towards a general theory of driver behaviour. Accident Analysis & Prevention, 37(3), 461-472.
Fuller, R. (2007). Motivational determinants of control in the driving task. In P. Cacciabue (Ed.), Modelling Driver Behaviour in Automotive Environments: Critical Issues in Driver Interactions with Intelligent Transpor t Systems (pp. 165-188). London: Springer.
Fuller, R. (2008). What drives the driver? Surface tensions and hidden consensus. Keynote at the 4th International Conference on Traff ic and Transpor t Psychology, Washington, DC.
Fuller, R., Bates, H., Gormley, M., Hannigan, B., Stradling, S., Broughton, P., Kinnear, N., & O’Dolan, C. (2008). The Conditions for Inappropriate High Speed: A Review of the Research Literature from 1995 to 2006. London: Depar tment for Transpor t.
Fuller, R., McHugh, C., & Pender, S. (2008). Task diff iculty and risk in the determination of driver behaviour. Revue Européenne De Psychologie Appliquée/European Review of Applied Psychology, 58(1), 13-21.
Fuller, R., & Santos, J. A. (2002). Psychology and the highway engineer. In R. Fuller, & J. A. Santos (Eds.), Human Factors for Highway Engineers (pp. 1-10) Pergamon.
Godley, S. T., Triggs, T. J., & Fildes, B. N. (2004). Perceptual lane width, wide perceptual road centre markings and driving speeds. Ergonomics, 47(3), 237-256.
Gronwall, D. M., & Sampson, H. (1974). The psychological effects of concussion. Auckland, New Zealand: Auckland University Press.

28
References
Harbluk, J. L., Noy, Y. I., Trbovich, P. L., & Eizenman, M. (2007). An on-road assessment of cognitive distraction: Impacts on drivers’ visual behavior and braking performance. Accident Analysis & Prevention, 39(2), 372-379.
Kinnear, N., Stradling, S., & McVey, C. (2008). Do we really drive by the seats of our pants. Driver Behaviour and Training, Vol. III (pp. 349-365). Andershot: Ashgate Publishing Limited.
Lewis-Evans, B., de Waard, D., & Brookhuis, K. A. (2010). That's close enough—A threshold effect of time headway on the experience of risk, task diff iculty, effor t, and comfor t. Accident Analysis & Prevention, 42(6), 1926-1933.
Lewis-Evans, B., & Rothengatter, T. (2009). Task diff iculty, risk, effor t and comfor t in a simulated driving task—Implications for Risk Allostasis Theory. Accident Analysis & Prevention, 41(5), 1053-1063.
Michon, J. A. (1989). Explanatory pitfalls and rule-based driver models. Accident Analysis & Prevention, 21(4), 341-353.
OECD. (1990). Behavioural Adaptation to Changes in the Road Transpor t Systems. Paris: OECD.
Rasmussen, J., & Jensen, A. (1974). Mental procedures in real-life tasks: A case study of electronic trouble shooting. Ergonomics, 17(3), 293-307.
Rothengatter, T. (2002). Drivers’ illusions––no more risk. Transpor tation Research Par t F: Traff ic Psychology and Behaviour, 5(4), 249-258.
Schmidt, F., & Tiff in, J. (1969). Distor tion of drivers' estimates of automobile speed as a function of speed adaptation. Journal of Applied Psychology, 53(6), 536-539.
Summala, H. (1988). Risk control is not risk adjustment: The zero-risk theory of driver behaviour and its implications. Ergonomics, 31(4), 491-506.
Summala, H. (2005). Traff ic psychology theories: Towards understanding driving behaviour and safety effor ts. In G. Underwood (Ed.), Traff ic and Transpor t Psychology (pp. 383-394). Amsterdam: Elsevier.
Vaa, T. (2003). Survival or deviance? A model for driver behaviour–Summary No. TOI repor t

29
References
666/2003.
Vaa, T. (2007). Modelling driver behaviour on basis of emotions and feelings: intelligent transpor t systems and behavioural adaptations. In C. Cacciabue (Ed.), Modelling Driver Behaviour in Automotive Environments (pp. 208-232) Springer.
Vaa, T. (2011). Proposing a driver behaviour model based on emotions and feelings: Exploring the boundaries of perception and learning. In M. Regan, T. Victor & J. Lee (Eds.), Driver Distraction and Inattention: Advances in Research and Countermeasures, Ashgate Publishing Limited.
Vaa, T., Glad, A., & Sagberg, F. (2000). Developing a model of driver behaviour: Introductory working papers. Summary No. TOI repor t 503/2000
Wilde, G. J. S. (1976). Social interaction patterns in driver behavior: An introductory review. Human Factors, 18(5), 477-492.
Wilde, G. J. S. (1988). Risk homeostasis theory and traff ic accidents: Propositions, deductions and discussion of dissension in recent reactions. Ergonomics, 31(4), 441-468.