speech at high ambient air-pressure · dept. for speech, music and hearing quarterly progress and...
TRANSCRIPT

Dept. for Speech, Music and Hearing
Quarterly Progress andStatus Report
Speech at high ambientair-pressure
Fant, G. and Sonesson, B.
journal: STL-QPSRvolume: 5number: 2year: 1964pages: 009-021
http://www.speech.kth.se/qpsr


1. Summary
The present s tudy was i n i t i a t e d a s an attempt t o
gain i n s igh t i n t h e physiological and acous t i c a l na ture of t h e
t y p i c a l d i s t o r t i o n of d ive r ' s speech a t deep underwater l eve l s .
A t a depth of more than 30 m , i .e. p ressures i n access of 4 a t a ,
t h e voice a t t a i n s a t y p i c a l "nasal" q u a l i t y and spectrographic
a n a l y s i s shows an increase of formant f requencies and of voice
fundamental frequency, Wathen-DuEn and Cope1 ( 6 ) , Holywell and
Harvey ( 5 ) , and o the r s have described these e f f e c t s but they have
been more concerned with problems of i n t e l l i g i b i l i t y and t h e tox-
i c e f f e c t s of absorbed gases than with t h e acous t ic problems. A s
f a r a s we know t h e mechanism underlying t h e "nasal qua l i t y " of
over-pressure speech has not been s a t i s f a c t o r i l y explained before.
Our s tudy s t a r t e d with speech recordings i n t h e de-
compression chamber of t h e Swedish Marine i n Karlskrona i n 1960
and 1962. Spectrographic ana ly s i s showed t h a t t h e frequency
s h i f t was p ropor t iona l ly g r e a t e r i n F, than i n higher formants.
A simple model of a l i n e a r frequency s h i f t , such a s assoc ia ted
with a change of t h e v e l o c i t y of sound, d id not f i t these experi-
ments. Furthermore it i s known t h a t t h e v e l o c i t y of sound i n a i r
i s almost independent of t h e pressure.
The most recent and conclusive s tudy was undertaken
i n April 1964 i n t h e decompression chamber on board HMS Belos i n
Stockholm. The l a t t e r f a c i l i t i e s include an X-ray o u t f i t which
made i t poss ible f o r u s t o study t h e v e l a r funct ion of a subject
dur ing phonation. Fron ta l and s a g i t t a l X-ray p i c tu r e s showed a
*' The experimental pa r t of t h i s s tudy was supported by t h e Swedish Medical Research Council Grant T 312 and W 267 and by a grant f o r speech communication research from t h e Swedish Technical Research Council. A summary w i l l be presented a t t h e 68th Meeting of t h e Bcoust ical Socie ty of America i n ~ u s t i n / ~ e x a s , October 1964,

normal s t a t u s of t h e velum a t 6 a t a pressure. dl though these
negat ive r e s u l t s excluded velo-pharyngeal opening a s t h e main
causs of t h e observed spectrum d i s t o r t i o n , t h e very na ture of
t h i s d i s t o r t i o n s t rong ly i nd i cz t e s t h e presence of some kind of
shunt ing mechanism i n vocal transmission.
A t h e o r e t i c a l ana ly s i s has now supplied conclusive
evidence t h a t t he shunt ing mechanism i s assoc ia ted with t h e vibra-
t i o n of t he wal ls of t h e vocal c a v i t i e s , e spec i a l l y t h e s o f t p a r t s
of t h e t h roa t . A s a by-product of t h i s study t h e r o l e of t h e cav-
i t y wal l s i n normal speech has been emphasized. These r e s u l t s t i e
i n wel l with recent experiments and ana ly s i s of vocal transmission
performed by D r . 0. Fujimura a t t h e Speech Transmission Laboratory.
2 . Spectrographic s tudy
The recording of speech i n t h e pressure t ank of HMS
Belos w a s c a r r i e d out with a b a t t e r y operated tape-recorder and
a dynamic microphone. A speaking d i s tance of 2 inches t o t h e
microphone was maintained. Recordings were made - t t I at z, i,z.
normal atmosphere p ressure , and a t 6 a t a , t he l a t t e r correspond-
i n g t o 50 meter d iv ing depth. A frequency standard tone of 1000
c/s was recorded a t each pressure l e v e l a s a means of ensur ing
r e l i a b l e frequency ca l i b r a t i on .
Four sub j ec t s spoke l i s t of CV nonsensz sy l la -
b l e s comprising a l l poss ible combinations of C = [ b ] , [ d l , [ g ] ,
[ml, [ n l , [ l ] , [v19 and V = [o : ] , [ E : ] ? [e :19 [ i : ] , [ b : ] toge ther with a sentence "I dsg v i l l jag v i l a p& min 5" .
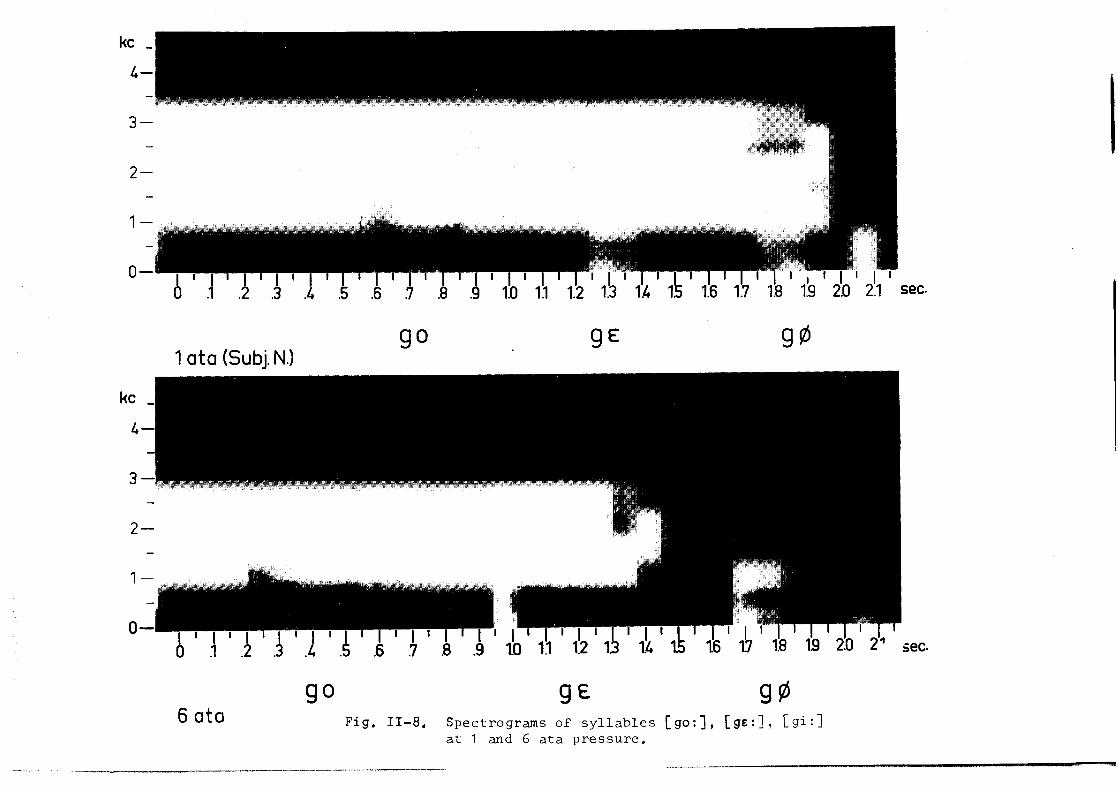
Representative spectrograms a t 1 and 6 a t a a r e shown
i n Figs. 11-6 t o 11-9, From these i t i s apparent t h a t a t 6 a t a
F1 is confined t o a frequency range above a lower l i m i t of
400-500 c/s and t h a t t h e dynamic range of v a r i a t i o n of F, i s much
r e s t r i c t e d . Voiced consonants and t h e vowels [ i ] and [ e l thus
ob ta in almost t h e same F a t very high a i r -pressures . 1
Formant f requencies f o r t h r e e of t h e sub j ec t s a r e
t abu l a t ed below.

lata (sub]. N)
6ata Fig. 11-6. Spectrograms of s y l l a b l e s [va], [ v e l , [v i ] u t t e r e d
i n a decompressi,on tank a t normal atmospheric , pressure , 1 a t a (above) and 6 a t a (below).
sec.


1 a ta (Subi. N.)
6 a to 9 0 g E g fl
Fig . 11-8, Spectrograms of s y l l a b l e s [ g o : ] , [ge :I, [gi:] a t 1 and 6 a t a p ressu re .
6 a t a 9 0 g E GI Pi
Fig. 11-8, Spectrograms of s y l l a b l e s [go:], [ge:] , [ g i : ] a t 1 and 6 a t a pressure.
"- A ' . l ' A ' I ' I ' I ' I ' I ' J ' l ' l ' l ' ~ ' l ' ~ ' l ' l ' l " ' " "
. .3 . .k .6 .7 -8 . la 11 1.2 1. 1L 1 1.6 1.7 1.8 1.9 2.0 2.1 set.
1 a t a (Subi. N.)
sec
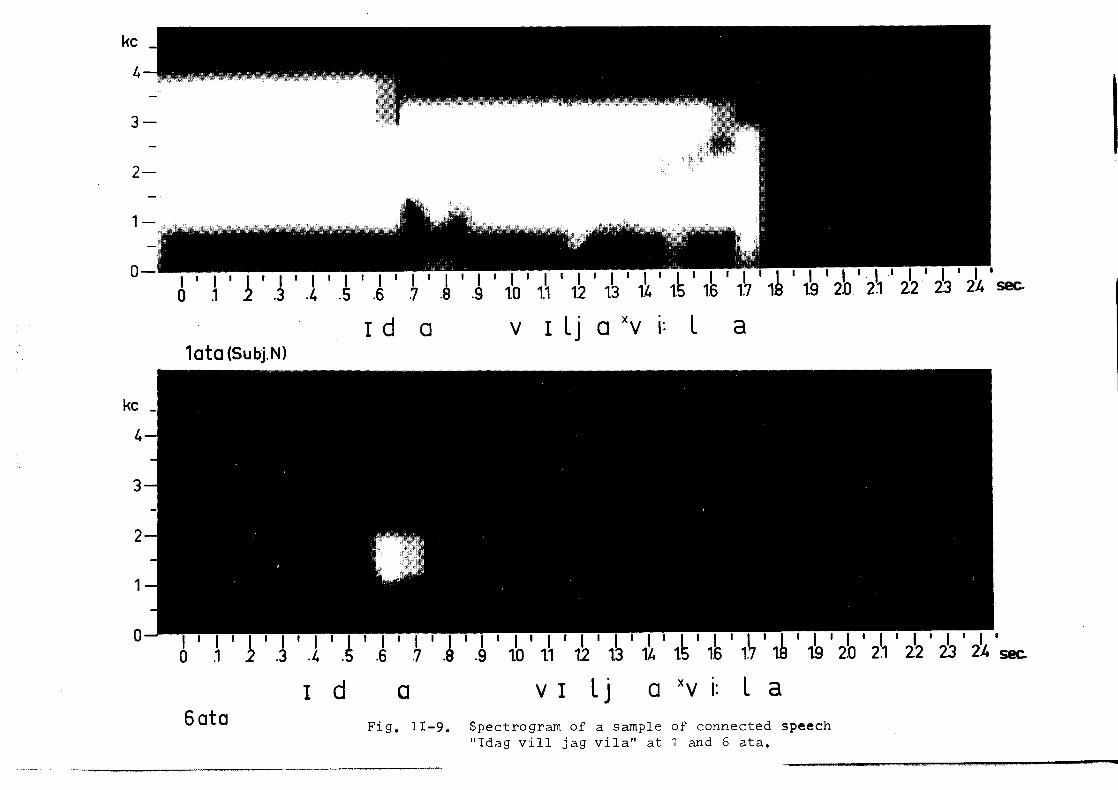
F i g . 11-9. S p e c t r o g r a m of a sample of c o n n e c t e d speech " I d a g v i l l j a g v i l a " a t 1 and 6 a t a .

Vowel
[ o : I
[ E : I
[+: I
[a: I
[e: I
[i: 1
TABLX 11-1
Formant frequencies a t 1 and 6 a t a
Subject ---- 1 1 a t a 1 6 a t a / A 1 a t a ' 6 a t a -4-r-
Ru = Rundblom Ni = Nilsson Ga = Garner

Samples were taken at t h e middle o r terminal par t of
t h e vowel whichever seemed more s t a t i o n a r y i n formant frequency
pa t t e rn . Data f o r a l l consonantal environments have been averaged
i n Table 11-1. The da t a on F have been excluded i n ins tances 3 where they were judged t o be l e s s r e l i a b l e . The s e r i e s N i I and
N i I1 pe r t a in t o t h e subject N i a t two d i f f e r e n t occasions.
There a r e t y p i c a l t r ends t o be observed. The F l - sh i f t
i s with few exceptions g r ea t e r i n magnitude than t h e s h i f t s i n F2
and F In vowels [ d l and [ i ] t h e observed F2-shif ts a r e of t h e 3 '
same order of magnitude a s t h e s tandard dev i a t i on , 50 c / s , o r l e s s .
It i s i n t e r e s t i n g t o note t h a t t h e d i s t i n c t i o n between t h e F1 of
[i] and [ e l tended t o be e l iminated a t t h e high pressure f o r sub-
j e c t s N i and Ru and t h a t accordingly t h e aud i t i ve d i s t i n c t i o n be-
tween these phonemes was almost l o s t .
The t y p i c a l d i s t o r t i o n of back vowels [o ] and [ Q ] at
high pressures i s t h a t of a r a i s e i n both FA and F2 but genera l ly
more i n F1 so t h a t F, comes r a t h e r c lo se t o F2. These a t t r i b u t e s
account f o r t he e s p e c i a l l y apparent na sa l q u a l i t y of t h e vowel
[ Q 1. Two of t he fou r speakers showed a moderate inc rease i n
voice fundamental frequency Fo.
Subject Average F 0
1 a t a 6 a t a
Ru 124 124
N i 114 132
Ga 127 163
An 187 182
Other general observat ions of speech a t high pressures
a r e an increase i n ove ra l l sound pressure l e v e l of voiced sounds
and a r e l a t i v e l o s s of spectrum i n t e n s i t y l e v e l a t high frequen-
c i e s . There i s a pronounced weakening of t h e energy of a l l un-
voiced consonants e s p e c i a l l y of t h e burs t i n t e r v a l of s t o p sounds.
Mo a c t u a l measurements of formant bandwidths were undertaken but
t h e general observation from t h e broad-band spectrograms was t h a t
bandwidths d id not inc rease except i n t h e low F1-range. The
speaking tempo was s u b s t a n t i a l l y reduced. Some but not a l l of t h e

speakers showed t y p i c a l s igns of d i s tu rbed voice source mechanism
i n terms of a randomization of subsequent p i t ch pu lse pos i t ions
and a general "nois iness" superimposed on t h e spectrogram.
3. Theory
It i s of i n t e r e s t t o no te t h a t observat ions of q u i t e
opposi te s igns have been made on speech at high a l t i t u d e s . K.C.
Clark e t a1 (2 ) repor ted a reduct ion of t h e f r e e f i e l d sound
pressure l e v e l of voiced sounds of t h e order of 10 dB a t 35000
f e e t a l t i t u d e , whi l s t t h e sound pressure l e v e l of unvoiced con-
sonants increased 5 dB and thus gained 15 dB r e l a t i v e t o voiced-sounds.
h l a c k of n a s a l i t y was pronounced.
Thus t h e r e is a cons i s ten t s e t of v a r i a t i o n s of ob-
served acous t ic c h a r a c t e r i s t i c s a s a func t ion of t h e a i r -pressure ,
i.e. t h e dens i t y from deep underwater t o high a l t i t u d e condit ions.
a. F r e ~ e n c g s h i f t s - - - - - - - Since dens i t y p i s propor t iona l t o p ressure P the
v e l o c i t y of sound
i s dependent on y, t h e r a t i o of s p e c i f i c hea t s a t constant pressure
and volume, only. A change of P from 1 a t a t o 6 a t a i s assoc ia ted
with e0.7 '$ change i n y (1.407 t o 1.417), and thus merely 0.35 % i n c.
Since a l l equations f o r c a l c u l a t i n g resonance frequen-
c i e s of an a r b i t r a r i l y complex vocal c a v i t y system contain t h e
f a c t o r c and i n add i t ion func t ions of c a v i t y dimensions only, it
i s obvious t h a t t h e detuning of c a v i t y resonances a s a r e s u l t of
a change i n a i r pressure e n t e r s through c alone and is in s ign i f i -
c a n t l y small. Thus t h e expression f o r t h e resonance frequency of
a Helmholtz resonance i s
where V is t h e volume, A t h e cross-sect ional a r e a of t h e neck and
le i t s e f f e c t i v e length . The f requencies of s t and ing wave

resonances i n a tube terminated d i f f e r e n t l y at t h e two ends (open
c i r c u i t a t one end and shor t c i r c u i t a t t h e o the r ) a r e
C F = - (2n-I ) n 41, ( 3 )
and when terminated equa l ly at both ends,
C F = - * n n 21
Now t o t h e e f f e c t of a f i n i t e c a v i t y w a l l impedance.
It was o r i g i n a l l y pos tu la ted by van den Berg ( ' I t h a t t h e s o f t
p a r t s of t h e vocal c a v i t y wal ls behave l i k e a mass element t o t h e
f i r s t approximation with a r e s i s t i v e element t o account f o r d i s s i -
pat ion. I n Fig. 11-1 0 t h e equivalent network elements of t h e
c a v i t y wal l s a r e denoted L and Rw. The r ad i a t i on impedance is W
denoted Roe
Assuming t h a t t h e v i b r a t i n g wal l s occupy an a r ea of 2
Aw 3 50 cm along a pharynx length of 8 cm and an i n t e r n a l volume 2
of 80 cm r ep re sen t a t i ve of a p a l a t a l tongue pos i t i on , t h e pharynx
wal l inductance is
where pw 9 1 g/cm3 i s t h e dens i t y and 1 = 1 cm i s t h e average W
th ickness of t he wal ls .
A t complete c losure of t h e vocal t r a c t t h e mass element
L resonates with t h e capacitance C of t h e e n t i r e a i r volume. The W
l i m i t i n g resonance frequency i s t hus
- A a s assumed above, and where Lw - - W
A t a pressure of 1 a t a and normal speaking condi t ions 3 c = 35000 cm/sec and p = pl = 1.2 g/cm . A t a pressure of
P a t a t h e dens i t y is p = P e p I and the l i m i t i n g value of F, i s

which amounts t o
Thus at P = 6 a t a t h e fundamental resonance F1 must exceed 370 c / s ,
which conforms with our observations. It i s a l s o known t h a t t h e
"voice bar t t F, of voiced consonants never goes below 150 c/s i n
normal speech.
The f i r s t formant of a voiced consonant o r of a c lo se
o r half-open vowel i s apparent ly tuned by L i n p a r a l l e l with L1. W
I f , f o r example, L1 = Lw, F~ would equal Si- F~~ = 2 1 0 c / s . In
general denoting the resonance of t h e system with Lw excluded as
F lay and F1 with due respect t o both L1 and Lw, and Flw with L,
excluded t he r e holds t h e r e l a t i o n
A t a pressure of P t h i s may be wr i t t en
By combining equat ions of t h i s type f o r P = 1 dnd P = 6 a t a we
ob ta in
which r e l a t e s t h e fundamental resonance of t h e c losed vocal t r a c t
at Flw(~.l ) t o t h e observed f requencies of t h e f i r s t formant
FI6 a t P = 6 a t a , and F l l a t P = 1 a t a .
I f t h e theory holds i t should be poss ible t o ca l cu l a t e
reasonable va lues of Flw a t 1 a t a from t h e observed frequency
s h i f t s . Calcula t ions on our mate r ia l gave t h e fol lowing data:


Fig. 11-10. A . Transmission l i n e analog of t h e vocal t r a c t with d i s t r i b u t e d inductance ~ ( x ) , capaci tance ~ ( x ) , and wal l inductance L ~ ( X ) per u n i t l eng th of t h e reso- n a t o r a t a coordinate x.
B. Helmholtz r e sona to r with t c t a l inductance Lw and r e s i s t a n c e R,,, of the c a v i t y wa l l s inc luded. Ro i s t h e r a d i a t i o n r e s i s t a n c e .
C. Equivalent c i r c u i t of B f o r c a l c u l a t i o n of F, of voiced consonants and c lose f r o n t vowels.

where w is the cu tof f frequency W
With no t a t i ons A f o r cross-sect ional a r ea of t h e resona tor and
As f o r t h e a rea per u n i t l eng th of t h e v i b r a t i n g wal l of th ickness
ds and dens i t y p
f
thus
The cutoff frequency i s propor t ional t o t h e dens i t y of t h e W
sir p , o r t o t he pressure P i n a t a . Under t h e spec i a l circum-
s tances of a uniform d i s t r i b u t i o n of t h e wall impedance along a
s i n g l e tube model i t i s found t h a t ww = 2wFl
A s a s p e c i f i c example assume a pharynx leng th of 8 cm
and a high p repa l a t a l a r t i cv . l s t ion i n which case F p of [ i ] could
be approximately ca l cu l a t ed a s
The c s v i t y wall co r r ec t i on f a c t o r a t 1 a t a i s 0.26 $ which i s neg-
l i g i b l e and 1.6 % o r 37 c/s a t P = 6 ata., The ca l cu l a t ed d i f f e r ence
37 - 6 = 31 compares well with the measured da ta .
A s another example t h e vocal t r a c t w i l l be considered
a s a s i n g l e homogeneous tube loaded with d i s t r i b u t e d wall inductance
and u = 21-rolGO before. Assuming a frequency of t h e Sirst W
f0rmar.t F = c/41e = 500 c/s t h e add i t ion of Ls causes a s h i f t of 1
AF1 = 1 3 5 c / s a t 6 a t d which l l s o r e f l e c t s t h e cor rec t order of
magnitude according t o measurements,
I n sho r t t h e e f f e c t s descr ibed above a r e a t t r i b u t a b l e
t o t h e high dens i ty p inc reas ing t h e c h a r a c t e r i s t i c impedance l e v e l
p c / ~ of t h e vocal c a v i t y s y s t e ~ a t high a i r -pressures thus making
t h i s system more suscep t ib le t o t h e shunt ing e f f e c t s of t h e c a v i t y

wal l s , t he l a t t e r being independent of t h e a i r -pressure . The in-
c rease of t h e a i r column load i n s e r i e s with t h e mechanical i m -
pedance of t h e vocal f o l d s could account f o r t h e phonatory source
dis turbances observed.
There remains t o map t h e r e l a t i v e conduc t iv i ty of t h e
c a v i t y walls . Thin f l e s h obviously has a more severe shunt ing ef-
f e c t than bony and t h i c k s t r u c t u r e s , One would t hus p r imar i ly
conceive of t h e s i d e s of t h e t h roa t and t h e cheeks of t h e mouth
t o permit v ib r a t i ons but a l s o t h e s o f t velum i t s e l f . The r e l a t i v e
in f luence of a shunt on t h e frequency of vocal resonance i s a l s o
dependent on t h e s p a t i a l d i s t r i b u t i o n of sound pressure i n t h e
vocal t r a c t . I n t h e frequency range of t h e first formant a c a v i t y
wall shunt i s thus t h e more e f f e c t i v e t h e c l o s e r i t comes t o t h e
g l o t t a l end of t h e system. In general t he e f f e c t of a shunt i s
l a r g e wherever t h e sound pressure i s high.
b. Formclnt bandwidths - - - - - - - - - - - A t h e o r e t i c a l s tudy of t h e extent t o which t h e dens i t y
of a i r e n t e r s expressions of formant bandwidth can be made from
r e f . ( 3 1 , pp. 300-310. The conclusion i s t h a t bandwidths a r e a l -
ways r e l a t e d t o express ions of t h e form R / ~ L o r I / ~ ~ R c . Acoustic
inductance a s well a s r e s i s t a n c e , even t h e r a d i a t i o n r e s i s t a n c e ,
a r e propor t ional t o dens i t y and acous t ic capacitance i s inverse ly
propor t ional t o dens i ty . Thus dens i t y i s cancel led out i n a l l
expressions above.
Xnergy l o s s e s assoc ia ted with vocal c a v i t y v ib r a t i ons
z r e of a g r ea t e r i n t e r e s t . Recently Fujimura has determined t ho
c losed condi t ion resonance F of t h e vocal t r a c t experimentally I w and found f requencies of t h e order of 150-200 c /s and bandwidths
of t h e order of 100 c/s. The bandwidth i s a t t r i b u t e d t o a r e s i s t -
ance element R i n s e r i e s with t h e wal l inductance L a s i n W W
Fig. 11-10 and we thus conclude t h a t
A t formant f requencies of i n t e r e s t fvLw > R, and w e compute a

p a r a l l e l r e s i s t ance
With a f i n i t e mouth opening of inductance L, p a r a l l e l t o L we W
have approximately
But
The con t r ibu t ion of c a v i t y wzll d i s s i p a t i o n t o f i r s t formant band-
width B i s thus i nve r se ly propor t ional t o t h e square of frequency, 1 1
I f f o r example L1 = L and F1 = ,/ 2 FI0 W which i s of t h e ordez
of 225 c / s , t h e bandwidth con t r ibu t ion i s B, = Bw/2 o r of t h e
order of 50 c/s. The formant d a t a of Fujimura, r e f . ( 4 confirms
t h i s frequency dependency of B1. Normally B,, ( f ) has a minimum a t
F, = 500 c / s of about B1 = 30 c/s .
A t t h e higher atmospharic pressures t h e only s i g n i f i -
cant change of t he equivalent c i r c u i t i s t he decrease of t he capac-
i t a n c e of t h e a i r and thus t he increase i n resonance frequency,
whi ls t t he bandwidth is t h a t of t h e corresponding resonance a t t h e
lower pressure , i.2. lower frequency. At L, = L and P = 6 a t a W
assuming F = 160 we thuc have F16 =KO f? 160 = 555 and Iw
B1 6 = Bw/2 = 50 c/s . I n add i t ion t h e r e is t h e r a d i a t i o n 2nd i r i c -
t i o n a l damping adCing sone 10-20 c/s more t o B,. Spectrograms
confirm the theory. A t 6 a t a t h e voice bar F1 of voiced consonants
i s a frequency transposed r e p l i c a of tho 160 c/s voica bar a t 1 a t a
with tho weak and t h i n vo ic ing s t r i a t i o n s t y p i c a l of a l a rge band-
width formant.
c . Sound pressure l e v e l s - - - - - - - - - - - A pos i t i ve s h i f t of a formant of constznt bandwidth i s
assoc ia ted with an increase of i t s Q and of t he spectrum l e v e l a t

f requencies above F., . This i s one f a c t o r con t r i bu t i ng t o an in-
c rease of sound pressure l e v e l s st higher ambient pressures . It
a f f e c t s pr imari ly voiced sounds of a narrow a r t i c u l a t i o n .
There 3re a l s o reasons f o r expecting an ove ra l l in-
c rease of t h e i n t e n s i t y of voiced sounds because of more e f f i c i e n t
r ad i a t i on . The b a s i s f o r t h i s cons iders t ion i s a phonation a t
constant subg lo t t a l overprzssure Ap, According t o r e f . ( 3 ) 9 P*
268, t h e volume v e l o c i t y of t h e source i s
U ( t ) = ~ ( t ) \iG- a
uo (. To t h i s we add t h e v o c i l t r a c t t r a n s f e r funct ion ~ ( w ) = q7-a and t h e r ad i a t i on t r a n s f e r ( u ) / u ~ r e l a t i n g sound pressure a t
1 cm i n f ron t of t h e speaker t o t h e volume v e l o c i t y st t h e l i p s ,
1 -
Thus t h e sound pressure p ( w ) i s propor t ional t o ,/ p o r t o 4 P . 1 A f a c t o r of ,E = , F f r o m P = 1 t o 6 a t 3 ) would thus cause an in-
c rease of t h e sound pressure l e v e l of ~ 6 ' o r 8 dB1 Our experi-
mental d a t ~ from HMS Belas showed an increase of on t h e average
5 dB, but t h i s i s not conclusive s i nce t h e microphone d i s tance was
not s u f f i c i e n t l y wel l con t ro l led . Sounds of low F, gained much
more than sounds of high PI a s could bs conceived from theory.
d. Unvoiced sounds - - - - - - - - - - What i s t h e rsason f o r t h e decreased r e l a t i v e l e v e l of
s t o p b u r s t s and f r i c d t i v e s a t high ambient pressures? Here t h e
theory i s not so well developed but i t may be of i n t e r e s t t o r e f e r
t o p. 273 of r e f . ( 3 ) . The sound pressure of f r i c a t i v e s i s propor-
t i o n a l t o t h e square of tha v e l o c i t y of t he genera t ing a i r s t r e a n
i n a vocal t r a c t c o n s t r i c t i o n o The r e l a t i o n of t h i s a i r ve loc i t y
u = U /A t o t h e pressure drop 4 p is 0
2 . where k i s a constant . Again assuming a constant Ap t h e U 1s 0

i nve r se ly propor t ional t o p . This c f f e c t i s probably counter-
acted by t h e p propo r t i ona l i t y of t h e r a d i a t i o n t r a n s f e r , eq. (24) .
A t high ambient a i r -pressures t he r e remains a decrease of t h e
sound pressure l e v e l of f r i c a t i v e s dnd s tops r e l a t i v e t o t h e
average l e v e l of voiced sounds.
Go Fant and B. SonessorPC
References:
(1 ) van den Berg, Jw. : Physica van dc stemvorming met t o e ass inpen, t h e s i s Univ. of Groningen --ge 1953).
( 2 ) Clark, K.C. , Rudmose, H.W., Eiscns t e in , J . C . , Carlson, F.D., and Walker, R,A.: "The e f f e c t s of high a l t i t u d e on speech", J.Acoust .Soc.Am. 20 (1 948), pp. 776-786. -
( 3 ) Fctnt , G. I Acoustic Theory of Speech Production, ( ' s - ~ r ~ v e n h a g e 1960),
(4 ) Fujimura, 0. and Lindqvist , J, s "The sinewave response of t h e vocal t r a c t " , STL-QPSH 1/1964, pp. 5-1 0.
( 5 ) Holywell, K. and ilarvey, G.: "Helium speech", J .kcoust . Soc.Am, 36 ( 1 9 6 4 ) ~ p* 2100
( 6 ) Wathen-hnn, W. 2nd Copel, M.: "Comparison of vo ic ing p e r i o d i c i t i e s and formant frequencies f o r one speaker i n a i r and i n 3 helium-oxygen mixture a t va r ious p ressures" , J .Acous-t ,Sot ,Amo 2 ( 1 963), p. 804 (A).
* Department of Annt omy, TJniversity of Lund, Sweden, and the Off ice of t h e Surgeon General, Naval S t a f f , R.S.N., Stockholm, Sweden.