spectrum width estimator problems and their impact on the ... · 28/03/2007 · spectrum width...
TRANSCRIPT

Informational Briefing:Informational Briefing:
Spectrum Width Estimator Problems and their Impact on Spectrum Width Estimator Problems and their Impact on the NEXRAD Turbulence Detection Algorithm (NTDA)the NEXRAD Turbulence Detection Algorithm (NTDA)
Greg Greg MeymarisMeymaris and John K. Williams, NCARand John K. Williams, NCAR
NEXRAD Technical Advisory Committee MeetingNEXRAD Technical Advisory Committee MeetingNorman, OKNorman, OK
March 28, 2007March 28, 2007

SW and NTDA, TAC, 27-28 March 2007 2
Outline• NTDA implementation update• Spectrum width impact on NTDA
– Spectrum width estimator problems make it difficult to discriminate null and light from moderate or greater turbulence
• Simulation results– The legacy R0/R1 pulse-pair estimator– A poly pulse-pair “hybrid” method
• Case-study results• Summary and request for TAC endorsement

SW and NTDA, TAC, 27-28 March 2007 3
NTDA implementation update• NTDA version 1 has been delivered and successfully
integrated into the WSR-88D software baseline for ORPG Build 10.
• NCAR/RAL’s experience with the ORPG technology transfer process has been very positive.
• Currently working through OSIP for approval of NTDA data collection and dissemination.
• Plan to develop NTDA-2 for ORPG Build 12– Will provide improved accuracy and greater coverage.– Will supply EDR even in low-dBZ conditions below 10 kft.

SW and NTDA, TAC, 27-28 March 2007 4
NTDA evaluation update• NTDA presentation at TAC telecon on November 1
showed disappointing evaluation results. Causes:– Imperfect aircraft/radar collocation– Spectrum width estimator inaccuracy – QC did not account for differences between VCPs
• Short-term solution– Modified NTDA QC to treat each VCP individually,
with interest maps based on worst-case SW simulation performance statistics for that VCP.
• Long-term solution may require ORDA implementation of an improved SW estimator.

SW and NTDA, TAC, 27-28 March 2007 5
NTDA-1: Spectrum width method
EDR estimate (turbulence)
measured spectrum widths
theoretical “scaling” factor for range r
NTDA SW to EDR “scaling” function f(r)(dependent on beam volume and windowing)
1/ 21/ 3 2( ) SW ( )r f rε =
localconf-wtd mean

SW and NTDA, TAC, 27-28 March 2007 6
EDR and turbulence severity
EDR SW (5 km) SW (150 km) Severity(m2/3 s-1) (m s-1) (m s-1)
0.0 – 0.1 0.0 – 0.4 0.0 – 1.2 Null
0.1 – 0.3 0.4 – 1.3 1.2 – 3.9 Light
0.3 – 0.5 1.3 – 2.2 3.9 – 6.6 Moderate
0.5 – 0.7 2.2 – 3.1 6.6 – 9.3 Severe
> 0.7 > 3.1 > 9.3 Extreme
Accurate estimation of small spectrum widths is essential for distinguishing null from light or moderate turbulence. This is not addressed by the current SW specification.

SW and NTDA, TAC, 27-28 March 2007 7
Distribution of aircraft EDRs
United Airlines average and peak EDR over 1-minute flight segments above 20 kftassociated with SNR > 10 dB (within 5 km horizontally and 500 m vertically).
77% null
21% light
1.3% moderate
0.10% severe or greater
91% null
8.6% light
0.13% moderate
0.00% severe or greater
Even very rare SW overestimates when turbulence is null or light may cause false alarms to exceed correct detections.

SW and NTDA, TAC, 27-28 March 2007 8
Pulse-pair R0/R1, 5000 realizations
(VCP 12)
True SW = 0.5 m/s
null (0-1)
light (1-3)
moderate(3-5)
severe or greater (> 5)
(at r = 70 km)
Simulation results: N = 40 pulses, Ts = 988 μs, SNR = 10 dB and PR = 50 dB

SW and NTDA, TAC, 27-28 March 2007 9True SW = 0.5 m/s
null (0-1)
light (1-3)
moderate(3-5)
severe or greater (> 5)
(at r = 70 km)
Pulse-pair R0/R1, 5000 realizations
(VCP 12)
Simulation results: N = 40 pulses, Ts = 988 μs, SNR = 30 dB and PR = 50 dB

SW and NTDA, TAC, 27-28 March 2007 10
NEXRAD Technical Requirement for SW• Spectrum width computation:
autocorrelation, pulse-pair (R0/R1 or R1/R2 for SZ-2)• Spectrum width estimate standard deviation (from 1996):
“For a true spectrum width of 4 m s-1 the standard deviation in the estimate of the spectrum width shall be less than or equal to 1.0 m s-1 including quantization errors, for S/N greater than 10 dB. Precision: 0.50 m s-1.Note 2: Spectrum widths of 1 to at least 10 m s-1 shall be calculated…. Significant biases introduced by the computational technique shall be minimized.Note 4: Precision is defined as the quantization, the smallest resolvable increment.”
• Number of pulses averaged: 29 to 280
• Deficiencies:– Doesn’t limit relative error for lower SWs– Doesn’t address estimator bias for lower SWs (bias cannot be
removed by averaging)– Doesn’t address saturation

SW and NTDA, TAC, 27-28 March 2007 11
Implications• NTDA now uses VCP-dependent interest
maps to remove SW data in conditions where simulations show it to be seriously compromised, but
• Better SWs could improve NTDA accuracy, reduce false alarms, and extend NTDA coverage into low-SNR regions at the edges of storms where aircraft commonly fly.
• The TAC could endorse an update to the spectrum width TR along with the research and development needed to meet it.

Spectrum Width Estimators for the NEXRAD Spectrum Width Estimators for the NEXRAD ORDAORDA
NCAR

1313NCARNCAR
R0/R1 PulseR0/R1 Pulse--Pair EstimatorPair Estimator
R0/R1 (used on NEXRAD, both on Legacy R0/R1 (used on NEXRAD, both on Legacy and ORDA):and ORDA):
1/ 2
010
1
2 logav RRπ
⎛ ⎞⎜ ⎟⎜ ⎟⎝ ⎠
Good:• Simple and fast• Generally good results• Saturation at large fraction
of Nyquist velocity• Saturates “gracefully”
Bad:• Assumes exactly 1
Gaussian shaped signal• Sensitive to estimate of
Noise Power PN (leads to bad performance for low SNR or small widths)
• Sometimes R0<R1
0 T NR P P= −
PT – total powerPN – noise power

1414NCARNCAR
Autocorrelation Lag
Auto
corr
elat
ion M
agnitude
PulsePulse--Pair R0/R1: Pair R0/R1: Simulated AC, SNR 10 dB, W=1 Simulated AC, SNR 10 dB, W=1 m/sm/s

1515NCARNCAR
Autocorrelation Lag
Auto
corr
elat
ion M
agnitude
PulsePulse--Pair R0/R1: Pair R0/R1: Simulated AC, SNR 10 dB, W=1 Simulated AC, SNR 10 dB, W=1 m/sm/s

1616NCARNCAR
Autocorrelation Lag
Auto
corr
elat
ion M
agnitude
PulsePulse--Pair R0/R1: Pair R0/R1: Simulated AC, SNR 10 dB, W=1 Simulated AC, SNR 10 dB, W=1 m/sm/s

1717NCARNCAR
Evaluation MethodologyEvaluation Methodology
Simulation StudiesSimulation Studies•• Used I&Q simulator as detailed by R. Used I&Q simulator as detailed by R.
FrehlichFrehlich and M. J. and M. J. YadlowskyYadlowsky**
•• Varied Varied SNRSNR’’ss and input (and input (““truetrue””) spectrum ) spectrum widthswidths
•• Used elevation #1 of VCP 12 with PRI #5, Used elevation #1 of VCP 12 with PRI #5, short (988 short (988 μμs, s, NN=40) =40)
•• Computed estimator bias and standard Computed estimator bias and standard deviation using 10000 timedeviation using 10000 time--series per series per scenarioscenario
* * FrehlichFrehlich, R. and M. J. , R. and M. J. YadlowskyYadlowsky, 1994: Performance of mean, 1994: Performance of mean--frequency frequency estimators for estimators for dopplerdoppler radar and radar and lidarlidar. . Journal of Atmospheric and Oceanic Journal of Atmospheric and Oceanic
TechnologyTechnology, 11, 1217, 11, 1217--1230; corrigenda, 12, 4451230; corrigenda, 12, 445--446.446.

1818NCARNCAR
Estimated Spectrum Width (m/s)
Freq
uen
cy
Red line indicates true W
PP R0/R1 Histograms:PP R0/R1 Histograms: SNR = 10dB, W = 5 SNR = 10dB, W = 5 m/sm/s

1919NCARNCAR
Estimated Spectrum Width (m/s)
Freq
uen
cy
Red line indicates true W
PP R0/R1 Histograms:PP R0/R1 Histograms: SNR = 10dB, W = 0.5 SNR = 10dB, W = 0.5 m/sm/s

2020NCARNCAR
Est
imat
ed S
pec
trum
Wid
th
True (Input) Spectrum Width (m/s)
Freq
uen
cy (
log s
cale
)
PP R0/R1 2D Histograms PP R0/R1 2D Histograms –– True vs. Estimated:True vs. Estimated:SNR = 10dBSNR = 10dB

2121NCARNCAR
Est
imat
ed S
pec
trum
Wid
th
True (Input) Spectrum Width (m/s)
Freq
uen
cy (
log s
cale
)
PP R0/R1 2D Histograms PP R0/R1 2D Histograms –– True vs. Estimated:True vs. Estimated:SNR = 20dBSNR = 20dB

2222NCARNCAR
R1/R2 PulseR1/R2 Pulse--Pair EstimatorPair Estimator
R1/R2 (will be used in ORDA, in SZR1/R2 (will be used in ORDA, in SZ--2):2):
Good:• Simple and fast• Generally good results• Insensitive to estimate of
noise power PN
Bad:• Assumes exactly 1 Gaussian
shaped signal• Saturates for spectrum
widths above ~1/3 Nyquist• Saturation failure mode
extremely poor
1/ 2
110
2
2 log6av R
Rπ
⎛ ⎞⎜ ⎟⎜ ⎟⎝ ⎠

2323NCARNCAR
Est
imat
ed S
pec
trum
Wid
th
True (Input) Spectrum Width (m/s)
Freq
uen
cy (
log s
cale
)
PP R1/R2 2D Histograms PP R1/R2 2D Histograms –– True vs. Estimated:True vs. Estimated:SNR = 10dBSNR = 10dB

2424NCARNCAR
R0/R1/R2 Least Squares R0/R1/R2 Least Squares EstimatorEstimator
PolyPoly--Pulse Pair method using R0, R1, and Pulse Pair method using R0, R1, and R2R2Proposed to be used as part of hybrid Proposed to be used as part of hybrid estimator.estimator.
Good:• Simple and fast• Generally good results• Less sensitive to estimate
of noise power PN• Saturates more gracefully
than R1/R2
Bad:• Assumes exactly 1 Gaussian
shaped signal• Saturates for spectrum
widths above ~1/3 Nyquist

2525NCARNCAR
Autocorrelation Lag
Auto
corr
elat
ion M
agnitude
Pulse Pair LS 2: Pulse Pair LS 2: Simulated AC, SNR 10 dB, W=1 Simulated AC, SNR 10 dB, W=1 m/sm/s

2626NCARNCAR
Autocorrelation Lag
Auto
corr
elat
ion M
agnitude
PulsePulse--Pair LS 2: Pair LS 2: Simulated AC, SNR 10 dB, W=1 Simulated AC, SNR 10 dB, W=1 m/sm/s

2727NCARNCAR
Autocorrelation Lag
Auto
corr
elat
ion M
agnitude
PulsePulse--Pair LS 2: Pair LS 2: Simulated AC, SNR 10 dB, W=1 Simulated AC, SNR 10 dB, W=1 m/sm/s

2828NCARNCAR
Est
imat
ed S
pec
trum
Wid
th
True (Input) Spectrum Width (m/s)
Freq
uen
cy (
log s
cale
)
PPLS2 2D Histograms PPLS2 2D Histograms –– True vs. Estimated:True vs. Estimated:SNR = 10dBSNR = 10dB

2929NCARNCAR
Hybrid Spectrum Width EstimatorHybrid Spectrum Width Estimator
Compute pulseCompute pulse--pair spectrum width pair spectrum width estimators (R0/R1, R1/R3, PPLS 2)estimators (R0/R1, R1/R3, PPLS 2)Decide whether the (normalized) Decide whether the (normalized) spectrum width is spectrum width is ““largelarge””, , ““mediummedium””, , or or ““smallsmall””Use best estimator for that size Use best estimator for that size spectrum widthspectrum width

3030NCARNCAR
Est
imat
ed S
pec
trum
Wid
th
True (Input) Spectrum Width (m/s)
Freq
uen
cy (
log s
cale
)
Hybrid 2D Histograms Hybrid 2D Histograms –– True vs. Estimated:True vs. Estimated:SNR = 10dBSNR = 10dB

3131NCARNCAR
Est
imat
ed S
pec
trum
Wid
th
True (Input) Spectrum Width (m/s)
Freq
uen
cy (
log s
cale
)
PP R0/R1 2D Histograms PP R0/R1 2D Histograms –– True vs. Estimated:True vs. Estimated:SNR = 10dBSNR = 10dB

3232NCARNCAR
Est
imat
ed S
pec
trum
Wid
th
True (Input) Spectrum Width (m/s)
Freq
uen
cy (
log s
cale
)
Hybrid 2D Histograms Hybrid 2D Histograms –– True vs. Estimated:True vs. Estimated:SNR = 20dBSNR = 20dB

3333NCARNCAR
Est
imat
ed S
pec
trum
Wid
th
True (Input) Spectrum Width (m/s)
Freq
uen
cy (
log s
cale
)
PP R0/R1 2D Histograms PP R0/R1 2D Histograms –– True vs. Estimated:True vs. Estimated:SNR = 20dBSNR = 20dB

3434NCARNCAR
Estimated Spectrum Width (m/s)
Freq
uen
cy
Red line indicates true W
Hybrid Histograms:Hybrid Histograms: SNR = 10dB, W = 0.5 SNR = 10dB, W = 0.5 m/sm/s

3535NCARNCAR
Estimated Spectrum Width (m/s)
Freq
uen
cy
Red line indicates true W
Hybrid Histograms:Hybrid Histograms: SNR = 10dB, W = 1 SNR = 10dB, W = 1 m/sm/s

3636NCARNCAR
Estimated Spectrum Width (m/s)
Freq
uen
cy
Red line indicates true W
Hybrid Histograms:Hybrid Histograms: SNR = 10dB, W = 2 SNR = 10dB, W = 2 m/sm/s
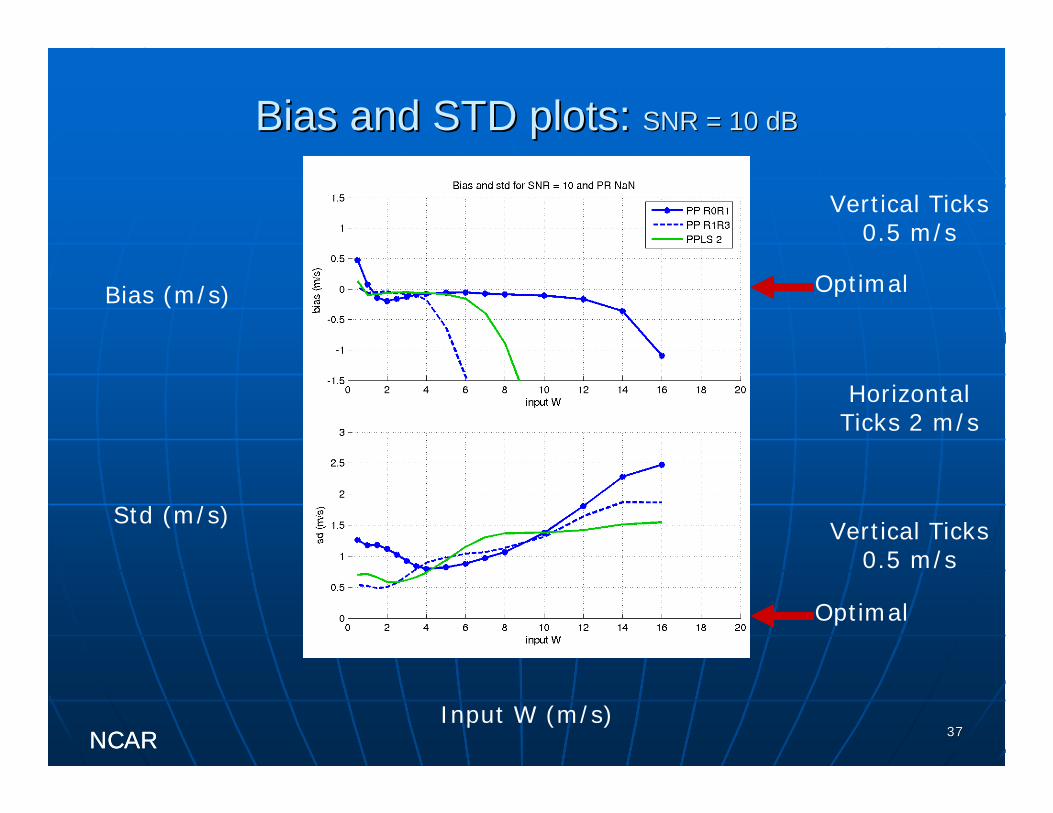
3737NCARNCAR
Bias (m/s)
Std (m/s)
Input W (m/s)
Vertical Ticks 0.5 m/s
Horizontal Ticks 2 m/s
Vertical Ticks 0.5 m/s
Optimal
Optimal
Bias and STD plots: Bias and STD plots: SNR = 10 dBSNR = 10 dB

3838NCARNCAR
Bias (m/s)
Std (m/s)
Input W (m/s)
Vertical Ticks 0.5 m/s
Horizontal Ticks 2 m/s
Vertical Ticks 0.5 m/s
Optimal
Optimal
Bias and STD plots: Bias and STD plots: SNR = 10 dBSNR = 10 dB

3939NCARNCAR
Bias (m/s)
Std (m/s)
Input W (m/s)
Vertical Ticks 0.5 m/s
Horizontal Ticks 2 m/s
Vertical Ticks 0.5 m/s
Optimal
Optimal
Bias and STD plots: Bias and STD plots: SNR = 20 dBSNR = 20 dB

4040NCARNCAR
Bias (m/s)
Std (m/s)
Input W (m/s)
Vertical Ticks 0.5 m/s
Horizontal Ticks 2 m/s
Vertical Ticks 0.5 m/s
Optimal
Optimal
Bias and STD plots: Bias and STD plots: SNR = 20 dBSNR = 20 dB

4141NCARNCAR
Bias (m/s)
Std (m/s)
Input W (m/s)
Vertical Ticks 0.5 m/s
Horizontal Ticks 2 m/s
Vertical Ticks 0.5 m/s
Optimal
Optimal
Bias and STD plots: Bias and STD plots: SNR = 50 dBSNR = 50 dB

4242NCARNCAR
Bias (m/s)
Std (m/s)
Input W (m/s)
Vertical Ticks 0.5 m/s
Horizontal Ticks 2 m/s
Vertical Ticks 0.5 m/s
Optimal
Optimal
Bias and STD plots: Bias and STD plots: SNR = 50 dBSNR = 50 dB

4343NCARNCAR
RelativeBias (%)
RelativeStd (%)
Input W (m/s)
Vertical Ticks 10 %
Horizontal Ticks 2 m/s
Vertical Ticks 50 %
Optimal
Optimal
Relative Bias and STD plots: Relative Bias and STD plots: SNR = 10 dBSNR = 10 dB
4444NCARNCAR
Summary and ConclusionSummary and Conclusion
Pulse Pair R0/R1 performs poorly for low Pulse Pair R0/R1 performs poorly for low SNRsSNRsand/or small spectrum widths. Pulse Pair R1/R2 and/or small spectrum widths. Pulse Pair R1/R2 performs poorly for large spectrum widths and performs poorly for large spectrum widths and very narrow spectrum widths. very narrow spectrum widths.
Results show the hybrid estimator outperforms Results show the hybrid estimator outperforms standard pulsestandard pulse--pair estimators for VCP 12, PRI 5. pair estimators for VCP 12, PRI 5.
Computational complexity at runComputational complexity at run--time is minimal.time is minimal.
Recommendation: Improve NEXRAD SWRecommendation: Improve NEXRAD SW’’s by s by using a polyusing a poly--pulse pair hybrid estimator!pulse pair hybrid estimator!
More work is required to evaluate this approach More work is required to evaluate this approach on a full range of operational scenarios. However, on a full range of operational scenarios. However, we chose one of the more difficult we chose one of the more difficult VCPVCP’’ss for for testing.testing.

SW and NTDA, TAC, 27-28 March 2007 45
Case StudyKFTG (Denver), 10/26/2006
Stratiform snow case.VCP 21, PRI #5
(N = 88 pulses,Ts = 988 μs)Clutter filtering off.
DZ
SNRVE

SW and NTDA, TAC, 27-28 March 2007 46
Overlaid power ratio, PR (dB)

SW and NTDA, TAC, 27-28 March 2007 47
SW from VCP 21 legacy R0/R1 (m s-1)

SW and NTDA, TAC, 27-28 March 2007 48
SW from VCP 21 poly pulse hybrid (m s-1)

SW and NTDA, TAC, 27-28 March 2007 49
SW from VCP 12 legacy R0/R1 (m s-1)(VCP 12 emulated by processing middle 40 pulses per radial)

SW and NTDA, TAC, 27-28 March 2007 50
SW from VCP 12 poly pulse hybrid (m s-1)

SW and NTDA, TAC, 27-28 March 2007 51
NTDA EDR from VCP 21 legacy R0/R1 (m2/3 s-1)

SW and NTDA, TAC, 27-28 March 2007 52
NTDA EDR from VCP 21 poly pulse hybrid (m2/3 s-1)relaxed QC increased coverage by 18%

SW and NTDA, TAC, 27-28 March 2007 53
NTDA EDR from VCP 12 legacy R0/R1 (m2/3 s-1)

SW and NTDA, TAC, 27-28 March 2007 54
NTDA EDR from VCP 12 poly pulse hybrid (m2/3 s-1)relaxed QC increased coverage by 23%

SW and NTDA, TAC, 27-28 March 2007 55
Case study summary• Legacy spectrum width is very sensitive to overlaid
echoes (NTDA QC uses VCP 21 threshold of ~40 dB PR, VCP 12 threshold of ~50 dB PR)
• The poly pulse hybrid spectrum width estimator– appears to show improved accuracy for low SWs– is much less sensitive than R0/R1 to overlaid echoes– is less sensitive to the number of pulses (this could aid
QC in “mixed method” VCPs like 211, 212, 221)– is expected to be less sensitive to errors in noise
estimation, which may be enhanced in thunderstorms.
• The hybrid method allowed relaxation of the NTDA’sSNR threshold by 5 dB and PR threshold by 20 dB, leading to about 20% increased coverage.

SW and NTDA, TAC, 27-28 March 2007 56
Relevant TAC Technical Needs• TN-31: Evolution of WSR-88D hardware and software to
implement advances in technology and science(Priority # 1, March 1999 ranking)Description: Ensure the continued capability of the WSR-88D system to implement desired mission support improvements, by employing an ongoing program to plan and execute WSR-88D upgrades.
• TN-32: System Performance (Priority # 2, March 1999 ranking)Description: System Performance includes assessing and improving (1) the performance of system hardware; (2) the quality of base data; and (3) the performance of the algorithms.
• TN-17: Turbulence Analysis Techniques (Priority # 9, March 1999 ranking)Description: Develop an algorithm that will locate and quantify turbulence that is hazardous to aircraft.

SW and NTDA, TAC, 27-28 March 2007 57
Possible alternative NEXRAD TR• Spectrum width computation:
autocorrelation, poly pulse-pair, spectral technique, or hybrid• Spectrum width estimate standard deviation:
“For a true spectrum width between 2 m s-1 and 12 m s-1, the relative standard deviation in the estimate of the spectrum width shall be less than or equal to 25% and relative bias shall be less than or equal to 10% for SNR > 10 dB and overlaid PR > 20 dB. For a true spectrum width less than 2 m s-1, the standard deviation shall be less than 0.5 m s-1 and the bias shall be less than 0.2 m s-1. These values include quantization errors. Spectrum width shall be reported with a precision of 0.1 m s-1.”
• Number of pulses averaged: 29 to 280
• Notes: These performance targets are equivalent to the current specification at 4 m s-1; they appear to be achieved by the hybrid SW estimator method on simulated data. If windowing is used, oversampling may be required at fast scan rates.

SW and NTDA, TAC, 27-28 March 2007 58
SW-related challenges for NTDA• SNR and PowerRatio calculated from DZ are not
always accurate– DZ may be adjusted by clutter filtering causing
PowerRatio to be in error. This compromises QC effectiveness, particularly in the region following the unambiguous range.
– In multi-method VCPs, the unambiguous range for each SW estimate may not be known.
– Direct access to SNR and PR associated with each SW measurement would be helpful.

SW and NTDA, TAC, 27-28 March 2007 59
SW-related challenges for NTDA (2)• Calculating SW-to-EDR factors and performing optimal
QC require knowing N and the windowing method used for each SW estimate. – These can be estimated from VCP, PRF, and elevation
number via VCP description tables, but this is awkward.– SZ-2 may use long pulse data for some estimates, and it
is difficult to accurately determine when this happens.– Direct access to this information would be helpful.
• Saturation of the R1/R2 pulse-pair SW estimator used in SZ-2 could yield pseudo-random SWs that would lead to missed detections.
• Staggered PRT SWs could also exhibit low saturation levels.

SW and NTDA, TAC, 27-28 March 2007 60
Future NTDA plans• FAA AWRP funding for FY07 includes
– continued support for ORPG Build 10 integration testing– operational 3-D mosaic development– a summer operational demonstration– evaluations and modifications to adapt to ORDA changes– beginning research and development of NTDA-2
• NCAR’s FAA AWRP manager indicates that NEXRAD SW estimator upgrade is an “operational systems issue”unlikely to be approved for FY08 AWRP funding.
• TAC endorsement and outside-AWRP funding are essential for improving NEXRAD SW quality.

SW and NTDA, TAC, 27-28 March 2007 61
Extras

6262NCARNCAR
Autocorrelation Lag
Auto
corr
elat
ion M
agnitude
Simulation Verification: Simulation Verification: SNR = 10 dB, W = 10 SNR = 10 dB, W = 10 m/sm/s

6363NCARNCAR
Autocorrelation Lag
Auto
corr
elat
ion M
agnitude
Simulation Verification: Simulation Verification: SNR = 10 dB, W = 10 SNR = 10 dB, W = 10 m/sm/s

6464NCARNCAR
Autocorrelation Lag
Auto
corr
elat
ion M
agnitude
Simulation Verification: Simulation Verification: SNR = 10 dB, W = 1 SNR = 10 dB, W = 1 m/sm/s

6565NCARNCAR
Autocorrelation Lag
Auto
corr
elat
ion M
agnitude
Simulation Verification: Simulation Verification: SNR = 10 dB, W = 1 SNR = 10 dB, W = 1 m/sm/s

6666NCARNCAR
Est
imat
ed S
pec
trum
Wid
th
True (Input) Spectrum Width (m/s)
Freq
uen
cy (
log s
cale
)
PP R1/R2 2D Histograms PP R1/R2 2D Histograms –– True vs. Estimated:True vs. Estimated:SNR = 20dBSNR = 20dB

6767NCARNCAR
Est
imat
ed S
pec
trum
Wid
th
True (Input) Spectrum Width (m/s)
Freq
uen
cy (
log s
cale
)
PPLS2 2D Histograms PPLS2 2D Histograms –– True vs. Estimated:True vs. Estimated:SNR = 20dBSNR = 20dB

6868NCARNCAR
Bias and STD as a function of Bias and STD as a function of NN