spectrum monitoring pilot program - ntia · pdf filespectrum monitoring pilot program ... be...
TRANSCRIPT

1
Spectrum Monitoring Pilot Program
Docket Number:
130809703-3703-01
RIN 0660-XC007
General Response and comments from:
CRFS Inc,
34428 Yucaipa Blvd, Suite E346
Yucaipa, CA, 92399
Prepared by :
Malcolm Levy VP CRFS Inc. 949 413 1024
&
Steve Williamson VP Engineering
General systems already exist to monitor spectrum usage in real time and have already been fielded by
a number of DoD and US Commercial organizations – these companies will be better able to provide
testimonials on the system capabilities:
EPG Ft Huachuca, AZ
JSC Annapolis, MD
Aberdeen Proving Ground, MD
Microsoft Seattle, WA
Boeing Seattle, WA
Comsearch Ashburn, VA
The systems already in use consist of remote, rugged, SDR outdoor sensors. The sensors report
spectrum occupancy or signal strength back to a central system if connected through the internet or are

2
able to store data locally if remote from the internet. All data is recorded with GPS location and time
precision.
Data format is compressed using a number of techniques; however the resulting information can be
provided in a standard format for use with other existing databases such as csv, png or Mancat.
A database server is available that keeps results from all sensors and can be set up to automatically poll
the network of sensors hourly or over any other preconfigured period of time. Should the network be
lost data is saved locally on the sensor for collection at the next connection.
Critical to this system is the ability to move sensors around quickly with minimal technical knowledge,
even placing the sensors into vehicles and driving around on a daily basis, examples of gathering mobile
information are: postal service, garbage collectors, utility readers – each of these services travel to every
home and business in a specific geography over a regular period of time.
A sensor could be placed at every freeway camera providing extra security and implemented on an
already constructed IT infrastructure.
This system is described in the CRFS Monitor documents provided.
More specifically, NTIA invites comment on the following questions:
1. How should a measurement system be designed to measure a variety of emissions, including weak or intermittent
signals, airborne platforms, and radar systems, while keeping incremental costs in check?
To achieve the necessary coverage the receivers have to be sensitive, mounted at the antenna
so losses are minimized and capture the spectrum extremely fast. Tradeoffs will have to be
made between sweep speed, capture bandwidth and cost. The concept to be considered should
be no different than the way we monitor traffic flow on freeways or gather weather data
around the country. If the sensor and system costs can be kept low enough then sensors can be
easily located in clusters around communities of interest.
2. What types of measurement/monitoring techniques should be used for the different types of radio services
Typically the various radio services are already operating in defined bands so for example it may not be
necessary to sweep the broadcast bands as fast or as often as other bands that have intermittent usage,
3
using this technique with a high speed receiver allows for monitoring and measuring techniques to be
configured based on a specific spectrum. Intelligence inside the sensor can then be used to zoom in on a
signal of interest; I/Q data can then be captured should a signal not be of the correct format on a
specific frequency. This data can then be used to further analyze the signal. Receivers all working
together in a cluster have a higher probability of seeing the same signal at the same point in time this
allows for geolocation of the signals using TDOA or POA techniques.
Despite this, even high speed; swept receivers have a limit on their POI (Probability of intercept). To
improve the POI, one or more swept receivers can be combined with a single wideband receiver which is
able to command a receiver to analyze sub-bands more closely when radar and other fast pulse
signatures are captured.
3. What frequency bands should initially be measured during the pilot phase of the program?
All frequencies from 30MHz to 6GHz should be measured, limiting the spectrum capture is not necessary
and is critical to spot harmonic, sub harmonic or spurious signals. Military comms and radar have been
known to cause garage doors to open due to harmonic or out of band distorted signals. Receivers exists
that can sweep the full 6GHz spectrum 10 to 100 times a second so why limit the captures? Limiting the
frequency range will also allow a geographically broader spread of equipment, as to cover bands up to
20GHz and beyond requires a more dense population of receivers due to the transmit powers possible
and the more significant effects of propagation loss.
4. How should measurement and monitoring parameters (e.g., resolution and video bandwidths, sampling rate, dwell time,
detector selection, antennas, pre-selector filtering, dynamic range) be specified?
This depends on the band or frequencies being monitored. However to cover the range of all
possibilities the receiver should be able to measure power or occupancy in a bandwidth of as little as
5KHz as this is the present narrowest comms bandwidth, if there is a need to measure adjacent channel
or adjacent noise power from signals then this may need to be narrower. Sample rate needs to be
coupled with bandwidth, the full spectrum can be sampled extremely fast if the bandwidth is 1MHz but
is proportionally slower for a narrower bandwidth.
For spectrum occupancy dwell time should just be long enough to determine there is a signal present, if
the signal captured is an interferer then the receivers intelligence can be used to dwell long enough to
capture IQ content. The IQ content can then undertake any form of detection. Again, in locations
subject to radar or other pulsed signature RF signals, the combined use with a wideband capture
receiver will improve POI.
Antennas should be omni-directional and circularly polarized in order to capture any polarization.
4
In a 6GHz frequency range pre-selection filtering will be a function of the receiving method at a
minimum over the 30MHz to 6 GHz range this is 8 but more would be better.
In addition to Dynamic range, receiver Noise Figure is critical as well as AGC or attenuator control.
Equipment should be able to AGC on the RTBW (Real Time Bandwidth) captured alone to ensure
maximum dynamic range is achieved at every point in a sweep.
5. Which geographic locations within major metropolitan areas or other communities throughout the country would provide the
greatest value for the pilot?
Spectrum is probably already being captured on DoD ranges – more ranges should be added. An area of
great interest and not likely to have been studied is a quiet non populated area as this will provide
information on background signals that are never spotted in the MMA’s it may alert us to anomalous
propagation that is not easily spotted in a cluttered environment as well as effects from solar radiation.
Additionally, information on propagation across areas bounded by forested areas or vegetation would
be significant. The effects of the variation in moisture content due to the change in foliage across
winter, summer and fall could show how the effects of interference change seasonally.
6. How should individual measurement units be deployed in each community?
The best approach could be to locate sensors on government buildings with access to a network as well
as mobile units that can be driven around and finally a number of sensors with batteries, solar panels
and local storage that can be placed for short periods of time in any suitable location.
Remote sensors with no access to a wide area network can be accessed using the cellular network or by
storing to local hard drives.
7. How could the long- or short-term placement of multiple fixed units within the same general geographic area improve the
accuracy and reliability of the data collected in each community and at what incremental cost?
Multiple sensors in a general geographic area will not only ensure capture of weak signals but also
provide the ability to geolocate the signals. As an example a GPS jammer designed to jam a receiver in a
vehicle from reporting its location may only generate a few milli-watts, enough to be seen by one
receiver in its immediate vicinity, as it moves into range of a second receiver say 1km away then location
information can be determined. If the receiver is located with a camera then the license plate of a
specific vehicle passing through the geography can be identified and apprehended.
5
8. How could mobile or portable units be utilized to supplement data collected at fixed sites within a community and at what
incremental cost?
Mobile units are essential to supplement fixed units as they allow for “fill in” of signals not seen by fixed
units, as an example sensors placed every km will not see every WiFi or low power ISM device that a
mobile unit will see. Incremental costs can be very small if the mobile unit is going about its regular day
to day activity such as a postal vehicle or garbage collector. Skilled operators are not needed to operate
the systems available today.
9. How long should measurement data be collected to provide statistically relevant results, particularly for intermittent
operations, at each geographic location?
An understanding of the type of signals expected in a specific geography will determine the answer to
this question. Intelligence in the sensor can allow full time spectrum monitoring with results averaged
over a specific period of time such as 15 minutes, 30 minutes or 24 hours so that only a small percent
will show up for a frequency that only appears for 10 seconds in a 24 hour period.
10. How should the measurement system design take into account variations in population densities, buildings, terrain and other
factors within or surrounding selected measurement locations (i.e., in urban, suburban, and rural parts of a metropolitan area)?
As with any radio equipment deployment plan, an analysis of the population’s usage of the ‘local’ radio
spectrum as well as a first order model of the surrounding town or city and terrain would be necessary.
This would allow estimates of optimum monitoring locations, as well as protection from local and
national RF transmitters to be determined. The balance of these sites can then be compared to the
available local infrastructure to best place the equipment and thus optimize the expectation of detecting
anomalous RF transmissions.
11. What steps can be taken to eliminate or minimize the possibility of ‘‘hidden nodes’’ when conducting measurements?
In order to prevent “hidden nodes” it would be necessary to perform some modeling of the propagation
environment surrounding any deployment. As is seen with GSM/LTE base stations (BS), urban canyons
are often formed due to the nature of the buildings on which they are mounted. This is necessary to
help isolate one BS from another. The reverse is true for monitoring, as we want to see as much
common spectrum as possible. Multiple placements of antennas at a variety of heights can be modeled
to show how this can overcome the possibility of a hidden node.

6
12. What kind of spectrum utilization and occupancy information (e.g., precise received field strength levels, time-of- day
occupancy percentages, times that signals are measured above specified thresholds) would be most useful to spectrum
stakeholders?
Levels must be set to determine occupancy above a minimum threshold in a specific band, for instance if
operating in the cellular bands maybe only signals above -100dbm are relevant, in the broadcast bands
only signals above -80dbm may be relevant. Separate occupancy sweeps can be set at a lower level to
run less frequently looking for lower level signals and compared to the high level signals. Care must be
taken not to set levels too low such that noise triggers the occupancy sensor; this is also a critical point
when determining the noise figure of the system. The basis of this analysis of the real-time spectrum is
to set masks which can trigger alerts to significant misuses of the spectrum. However, once occupancy
data is brought back to a central database for analysis occupancy percentages can be analyzed in a
variety of ways. This data can also be looked at historically to identify short or long term rogue
transmissions.
13. What detection thresholds should be used to measure and characterize the usage patterns of incumbent systems?
Multiple detection thresholds can be set so that post collection analysis can be used to determine usage
patterns based on signal level. Systems do not need to be limited to one threshold level.
14. What data and information would be useful in evaluating potential sharing compatibility with wireless broadband
devices?
The most useful measure for this is percentage occupancy. If we can see the occupancy rates for
multiple wireless devices, we can also then decide whether there are better algorithms for ensuring
maximum band co-existance of such devices. The measure of power transmitted by each device would
also ensure all devices are operating at their maximum limits. Where transmit power back-off is
implemented due to better link quality, it may be possible to determine whether these devices operate
‘fairly’ in the presence of devices competing for the same spectrum or adjacent channels of operation.
15. How can the gathered data and analysis better inform spectrum policy decisions, enhance research and development of
advanced wireless technologies and services?
Real world IQ data can be captured in a specific band and analyzed for bit error rate and other signal
quality factors – this data can then be mixed with other IQ data from a different technology to compare
the performance and results with advanced wireless techniques, for instance spread spectrum
technology such as COFDM is less susceptible to a single channel narrow band FM signal within its
bandwidth than two narrow band FM signals on top of each other.
16. What data formats and evaluation tools should be employed?
As much open source data formats as possible should be used and in line with other standards that have
evolved over the years there needs to be a user’s group developed to help formulate these standards,
bodies such as NDIA for defense interest could be tapped as they have spent a great deal of time in the
Test and Evaluation world formulating standards.
7
17. How can the large amounts of measurement data be effectively managed, stored, and distributed?
All data should be brought back to a central server and be in a format that allows quick database
searches by time, location and frequency. RFeye Monitor software combines quick and easy data access
with a deep database capable of storing multi-terabyte volumes of data. Data is processed by the
embedded Linux system on board each receiver and logged. Logged data is automatically transferred to
the database server where it can be queried and filtered using a web portal interface. Data can be
viewed as a series of graphs, such as occupancy by time or frequency, or output as CSV. A common data
format allows the same data to be transferred to other tools for further analysis and visualization.
Multiple users can simultaneously make multiple requests of the receivers and this is managed by on-
board intelligence that assigns a relative priority or executes on a “round-robin” basis. For example,
users can make background occupancy measurements, whilst at the same time running a range of
standard campaigns or user-generated applications on the Node. RFeye Monitor can also run in parallel
with other real-time software applications. This flexibility is the key to cost-effective deployment of
large receiver networks for serving multiple discrete and diverse spectrum data requirements.
18. What steps can be taken to ensure that sensitive or classified information will not be revealed to unauthorized
parties?
The database server can have different levels of security that control the level of information provided
to non-secure users, for instance IQ data associated with a specific collection would not be made
available to uncleared users. Alternatively, if the monitoring equipment is placed on a segregated
network at each location with its own server, then security could be significantly enhanced this way.
Data could be physically moved to a central database with restricted access levels to allow analysis of
the data without access to the monitoring equipment. This doe add some complexity, but the level of
security required should be implemented according to the sensitivity of the data which the system may
capture.
RFeye MonitorWeb-based dynamic spectrum database and
management solution using remote distributed
monitoring network
Key features ✓ Network of fully configurable RFeye Nodes
✓ Rugged, compact, lightweight, IP67 rated
✓ Wideband 10 MHz to 6 GHz receiver with
20 MHz RTBW
✓ Frequency extension to 18 GHz with Block
Down Converter
✓ Outstanding RF performance and sensitivity
✓ On-board GPS for accurate positional and
time stamping
✓ Full mounting kits for easy installation
✓ Integrated RFeye Monitor database software
for quasi-real time querying of data from
any network Node
✓ Node and network status monitoring
✓ Fully programmable sweeps and time
captures
✓ Fully programmable mask and level analyses
✓ Fully programmable alarms and alerts
✓ Fully programmable campaigns
✓ Displays of occupancy by time and
frequency
✓ Displays of spectral events
✓ GSM cell site surveys
✓ Data export to RFeye Map for mapping and
analysis or processing CSV for further
analysis
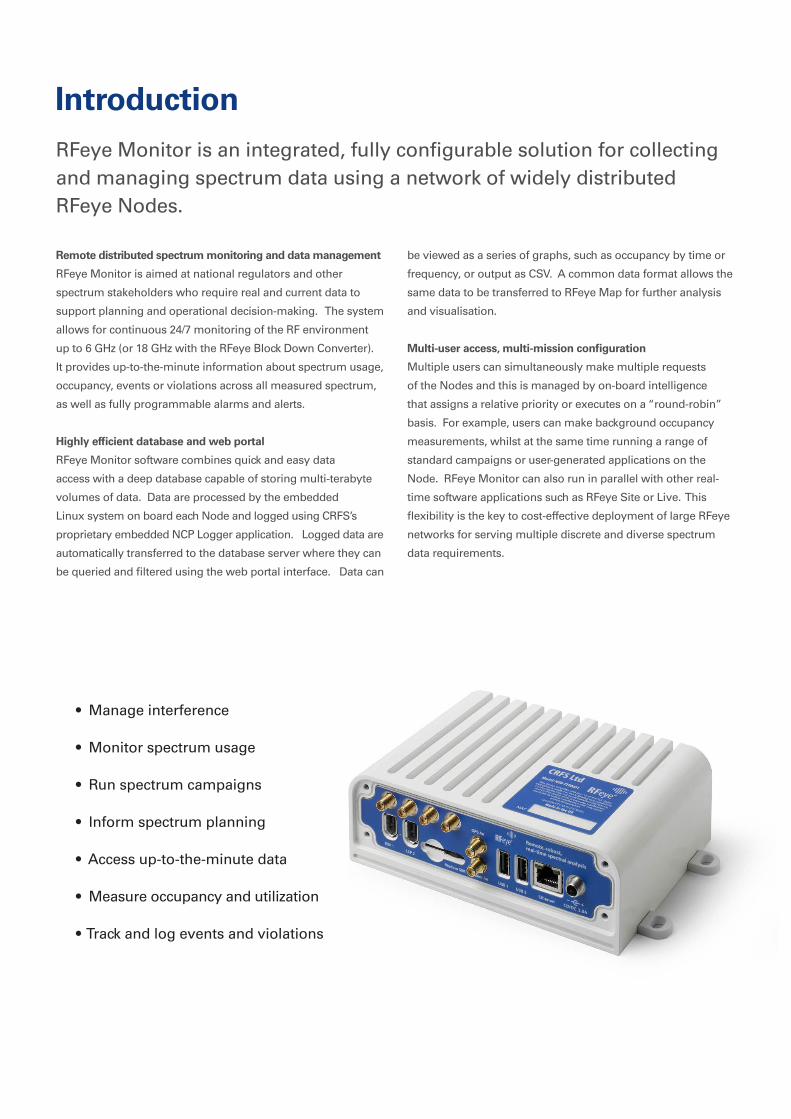
Remote distributed spectrum monitoring and data management
RFeye Monitor is aimed at national regulators and other
spectrum stakeholders who require real and current data to
support planning and operational decision-making. The system
allows for continuous 24/7 monitoring of the RF environment
up to 6 GHz (or 18 GHz with the RFeye Block Down Converter).
It provides up-to-the-minute information about spectrum usage,
occupancy, events or violations across all measured spectrum,
as well as fully programmable alarms and alerts.
Highly efficient database and web portal
RFeye Monitor software combines quick and easy data
access with a deep database capable of storing multi-terabyte
volumes of data. Data are processed by the embedded
Linux system on board each Node and logged using CRFS’s
proprietary embedded NCP Logger application. Logged data are
automatically transferred to the database server where they can
be queried and filtered using the web portal interface. Data can
be viewed as a series of graphs, such as occupancy by time or
frequency, or output as CSV. A common data format allows the
same data to be transferred to RFeye Map for further analysis
and visualisation.
Multi-user access, multi-mission configuration
Multiple users can simultaneously make multiple requests
of the Nodes and this is managed by on-board intelligence
that assigns a relative priority or executes on a “round-robin”
basis. For example, users can make background occupancy
measurements, whilst at the same time running a range of
standard campaigns or user-generated applications on the
Node. RFeye Monitor can also run in parallel with other real-
time software applications such as RFeye Site or Live. This
flexibility is the key to cost-effective deployment of large RFeye
networks for serving multiple discrete and diverse spectrum
data requirements.
IntroductionRFeye Monitor is an integrated, fully configurable solution for collecting and managing spectrum data using a network of widely distributed RFeye Nodes.
• Manage interference
• Monitor spectrum usage
• Run spectrum campaigns
• Inform spectrum planning
• Access up-to-the-minute data
• Measure occupancy and utilization
• Track and log events and violations
Use scenarios
• National and regional spectrum monitoring
• Cities and other spectrum intensive areas
• Military training grounds and ranges
• Government ranges
• Critical infrastructure
• Airports
• Public arenas
• Sports stadia
• Borders
• Harbors
• Coastlines
Customers
• Spectrum regulatory agencies
• Military spectrum operations
• Government and military range managers
• Spectrum/frequency managers
• Homeland security and intelligence services
• Site security managers
• Border control
• Coastguards and harbor masters
Missions
• Up-to-the-minute occupancy profiling
• Spectrum campaigns:
• Suspected GPS and other jammers
• Tetra interference
• ISM band usage
• GSM and UMTS band coverage
• Celluar interferers
• Other user specified
• Triggers and warnings
• Compliance and interference monitoring
• Spectrum planning and decision-making
• Fast access to individual or aggregated
measurements
• ITU compliant spectrum occupancy
measurements
• Analysis of spectrum anomalies and events
• Interactive spectrum database applications
Use scenarios, customers and missions
NCP Logger
Each RFeye Node runs NCP Logger, an embedded application
that records spectrum data and makes them available for
database interrogation. NCP Logger reads a configuration file
to determine which scans to perform, what level of processing
is carried out on the resultant data and how those data are
presented. As well as performing captures, calculations and
analysis, NCP Logger also creates notifications and SMS
messages to flag events and warnings.
RFeye Monitor Software
RFeye Monitor software comprises a series of tools for data
logging, data transfer, database storage and filtering, and web
display of requested results. These tools have been designed
to provide a seamless user experience such that the set-up can
be easily configured and up-to-the-minute data retrieved via a
web browser.
Once logged, data are transferred from the Node into the
RFeye Monitor database. This can be done in a number of
ways to suit requirements and will normally involve either
UDP or TCP data transports. The database is capable of
storing several different types of data, including text, spectra,
occupancy, time, cell survey, temperature and voltage, as well
as information about the network and individual campaigns.
It uses a single comprehensive library of scripts able to
deal with data provided by any of the possible data transfer
mechanisms.
The data from the database are accessed via a web portal
which can be configured to provide any appropriate GUI to
the data. The portal allows the user to query the data and
graph the results, as well as to create individual campaigns to
run using NCP Logger. It provides secure logins and varying
levels of access based on user privilege.
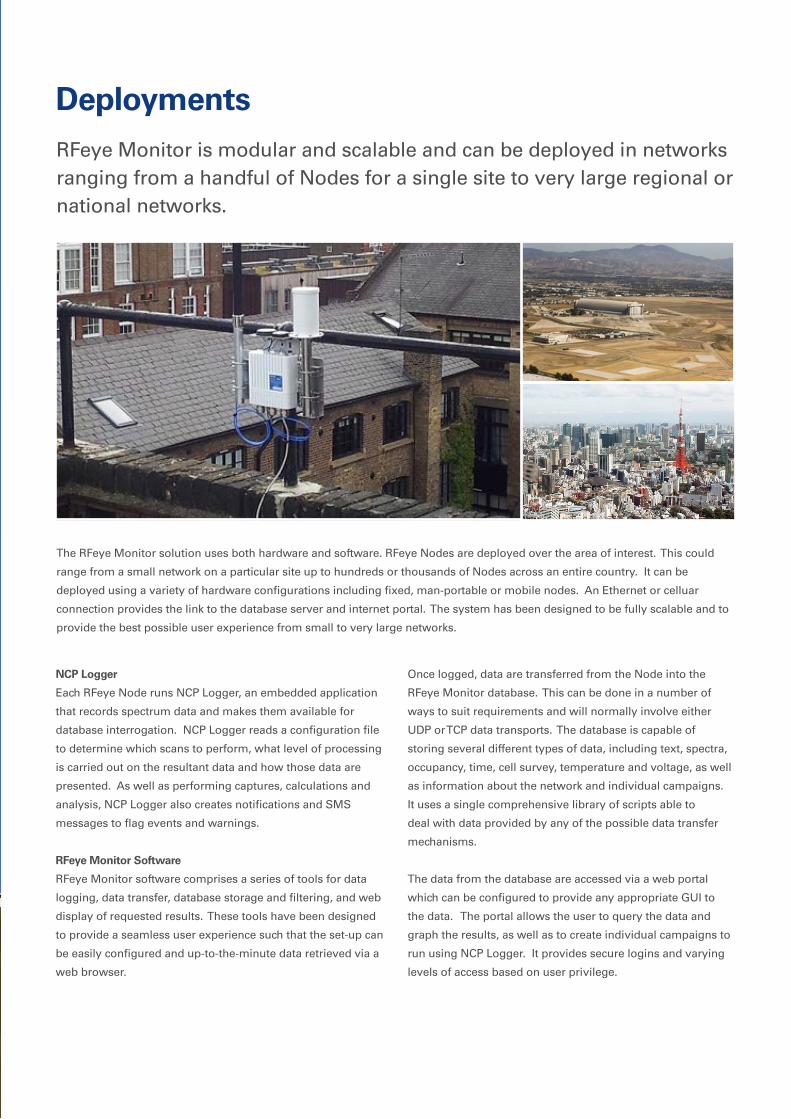
DeploymentsRFeye Monitor is modular and scalable and can be deployed in networks ranging from a handful of Nodes for a single site to very large regional or national networks.
The RFeye Monitor solution uses both hardware and software. RFeye Nodes are deployed over the area of interest. This could
range from a small network on a particular site up to hundreds or thousands of Nodes across an entire country. It can be
deployed using a variety of hardware configurations including fixed, man-portable or mobile nodes. An Ethernet or celluar
connection provides the link to the database server and internet portal. The system has been designed to be fully scalable and to
provide the best possible user experience from small to very large networks.

Web InterfaceRFeye Monitor provides a seamless user experience through a secure and streamlined web-based application interface.
Powerful backend system behind accessible interface
The RFeye Monitor system architecture consists of
several parts which are neatly presented to the user
as a single entity through the web interface. The
hardware piece comprises a distributed network of
RFeye Nodes and a centralized server. RFeye Monitor
software combines the spectrum database with
data handling processes to present an integrated,
convenient and responsive portal to logged data from
networks of RFeye Nodes.
The RFeye Monitor database API provides a further
degree of flexibility for users needing to take further
control of the spectrum database or integrate with
third party systems.

Sweep and time capture data
Both frequency and time domain spectral captures can be
graphically displayed within the web interface, with controls
for scale and range-zoom via simple click and drag. As
with other data, the sweep and time data can be filtered by
Node ID, campaign, date/time, antenna input and spectral
processing, and also output to CSV.
Temporal Analysis
The interface for graphical reporting provides a simple
mechanism to zoom from broad range frequency occupancy
data aggregated from the entire RFeye network, into tracking
of occupancy by time for specified frequencies of interest
at particular RFeye Node locations. This allows the user to
quickly drill down from spectrum events spotted in top level
overview reports to a detailed localized time line of spectrum
activity surrounding the signal of interest. This information
can be combined with other features within RFeye Monitor
such as spectrum licensee status to provide further layers of
context for decision making.
Occupancy data aggregation
RFeye Monitor allows the user to run queries by individual
Node or aggregated groups for occupancy by time or
frequency during any selectable period of time. The Nodes
take measurements at the requested rate based on power
measured above a threshold, in accordance with ITU
recommendation SM 1880 for occupancy.
RFeye Node location and status management
The location of each RFeye Node in the network can be viewed
on a map within RFeye Monitor. Mobile RFeye Nodes will
display their historical location according to the data timestamp
selected. Full NMEA data along with Node management data
including unit temperatures, supply voltages and currents, as
well as disk usage statistics are all made available to enable
comprehensive status management of the RFeye network.
Campaigns
The ability for different users to define and run multiple simultaneous spectrum monitoring campaigns is central to the powerful
capability from the RFeye Monitor system. Campaigns can be assigned to the entire RFeye network, sub-groups and regional
networks, or individual sites as required. In addition to full range background spectrum monitoring, campaigns are defined for
specific missions for example to monitor ISM band usage, TETRA interference, GSM and UMTS band coverage, and suspected
GPS and other jammers. The tools available from NCP Logger running on each RFeye Node enable campaigns to be configured
based on events such as mask breakages and conditional expressions, which allows targeting of spectral events of interest and
data volume management.

Receiver Performance
Frequency range 10 MHz to 6 GHz (18 GHz with Block Down Converter)
Receiver noise figure 8 dB typical (10 MHz – 4 GHz)11 dB typical (4 GHz – 6 GHz)
Input connector Four switchable signal inputs
Maximum input level +15 dBm; 15 VDC
3rd order intercept point (IP3) +20 dBm typical (AGC active)
1 dB input compression +10 dBm typical (AGC active)
Level accuracy ± 2.5 dB typical
Antenna LO re-radiation -90 dBm typical
Antenna port isolation 30 dB min. at 2 GHz
SSB phase noise -90 dBc/Hz at 10 kHz oset-110 dBc/Hz at 200 kHz osettypical, at 2 GHz* (*low noise synthesiser)
Synthesiser switching time 50 μs typical (fast sweep mode)
Spurious free dynamic range 60 dB min.
AGC range 60 dB
Sweep and triggering
Sweep speed 40 GHz/s (fast synthesizer)10 GHz/s (high quality synthesizer)
Sweep mode Fully programmable: Free runcontinuous, single, timed, delay timeduser trigger, adaptive (if-then-else)
Trigger on event Fully programmable: userdefinable masks, user-definable action when mask exceeded
Signal analysis
Real-time analysis bandwidth 20 MHz maximum
Equivalent resolution bandwidth 20 kHz min. (max. analysis b/w)18 Hz min. (reduced analysis b/w)
Operating system and software development options
Linux OS version 2.6
Development environments Full SDK C and Pythondevelopment environment available
Frequency reference
Selection Internal, GPS or External
External ref. input Via expansion port, 10 MHz ± 1 kHz
Reference output Via expansion port, 10 MHz
Internal frequency reference
Initial accuracy better than ±2 ppm at 20°C
Stability better than ±1 ppm (10°C to 30°C)
Ageing better than ±2 ppm per year
Timing reference
GPS 30 ns RMS accuracy typical
RFeye SyncLinc < 10 ns RMS accuracy typical
Mechanical
Dimensions (w h d) 170 mm x 60 mm x 125 mm(6.7 in x 2.4 in x 4.9 in)
Weight 1.4 kg (3.1 lb) [Node only]2.0 kg (4.4 lb) [with environmentalprotection cover]
Environmental
Operating temp. -30 to +55°C (-22 to 131°F)
Storage temp. -40 to +70°C (-40 to 158°F)
Envrn. protection IP67 (with environmental cover fitted)
Interfaces
RF input SMA (X 4)
DC power 10 - 56 VDC
DC power input Direct to Node or via Ethernet
Power consumption 15 - 25 W, radio operational6 W typical, radio idle
GPS antenna SMA, passive and active (3.3 Vnominal DC) antennas supported
Cellular modem antenna SMA
Ethernet 1 x 1 GigE
USB 2 x USB A (2.0)
Expansion ports 2, configurable to provide:(a) trigger input(b) frequency reference input(c) external (peripheral) control(d) frequency reference output
RFeye Node technical specifications
For more information
To find out more or discuss your specific application, please e-mail us at
[email protected] or call +44 (0) 1223 815 615. You can also find useful
resources on our website at www.crfs.com.
CRFS and RFeye are trademarks or registered trademarks of CRFS Limited. Copyright © 2013 CRFS Limited. All rights reserved. No part of this document may be reproduced or distributed in any manner without the prior written consent of CRFS. The information and statements provided in this document are for informational purposes only and are subject to change without notice. Document Number crfs-md00031-c05, September 2013.