spectrum mill a powerful tool for proteomics - agilent · spectrum mill – a powerful tool for...
TRANSCRIPT

Karl Clauser
Proteomics and Biomarker Discovery
Spectrum Mill – A Powerful Tool for Proteomics
Karl Clauser
Broad Institute of MIT and Harvard
February 26, 2015
1

Karl Clauser
Proteomics and Biomarker Discovery
Abstract
2
Driven by new instrumentation and techniques actively used in my proteomics research, collaborative development with Agilent has evolved the tools and algorithms within the Spectrum Mill software package. In this webinar several features will be highlighted. Scoring of peptide MS/MS spectrum matches capitalizes on low ppm product ion mass
accuracies with fragment-ion type models optimized for qToF-CID(HCD), ion trap CID, and ETD dissociation methods.
Summary reports enable quantitative comparison across samples with organization not only by protein, distinct peptide, or peptide spectrum match, but also by PTM site.
Sophisticated protein parsimony assembles distinct peptides into protein groups which enables protein-level quantitation that allows for peptides shared between multiple proteins to be either included or excluded. This is particularly empowering for human/mouse xenograft experiments in need of species-specific quantitation.
Quantitative data analysis methods support iTRAQ, TMT-6/10, SILAC, and label-free paradigms.
Quality Metrics enable troubleshooting mass spectrometry, chromatography, sample handling, and chemical labeling efficiency problems, as well as measuring effectiveness of MS/MS data acquisition method alterations.
Automation on an SM server through a service request manager that maximizes use of all CPUs and queues processes from multiple users.

Karl Clauser
Proteomics and Biomarker Discovery

Karl Clauser
Proteomics and Biomarker Discovery
Summary of New Features in Next Release (B.05.00)
4
• 64-bit extraction
• Readily handle data files > 4Gb
• Support for latest instruments
• Agilent 6500 Series Q-TOF
• ThermoFisher: QExactive Plus, QExactive HF, Fusion?
• 64-bit search
• Handle sequence databases > 2Gb
• Data Extraction supports “multi-core” or “Maximize CPUs” (core per file)
• Workflow automation
• Quality and FDR Metrics reports
• Data Archival
• Additonal Quality Metrics (isobaric label incorporation, LC gradient shape)
• Enhanced MassProfiler Professional export for Agilent data
• TMT-10 Extraction, Search, Quantitation support
• Peptide String Match Utility
Search database with a list of peptide sequences to aid configuring targeted MS/MS
assays
• Protein-termini modifications support in MS/MS Search
• Tool to create a FASTA subset from accession numbers

Karl Clauser
Proteomics and Biomarker Discovery
Spectrum Mill Workflow
5
Extracted
Filtered
MS/MS Spectra
Candidate
Peptide ID’s (PSM’s)
VM site localizations
Localized ,
Identified,
Quantitated
Peptides
or PSM’s
Identified,
Quantitated
Grouped
Proteins
LC-MS/MS
Run(s)
Trypsin
Protein Sequence Database(s)
Precursor ion
Reporter ion
Peak Areas
Localized,
Identified,
Quantitated
Protein grouped
VM sites
Data
Extractor
MS/MS
Search
Autovalidation
*.d
*.RAW
*.mzXML
FDR Validated
Peptide ID’s (PSM’s), VM site localizations
PP Summary
Protein-VM site
Comparison
(Group by VM site, MC)
Protein-Peptide
Comparison
(Group by Sequence)
Identified,
Quantitated
Protein grouped
Peptides
(Filter by
distinct peptides)
Protein-Protein
Comparison
(Group by protein,
shared peptides
included or excluded)
specFeatures.1.tsv
proteinProteinCentricColumnsExport.1.ssv
proteinPeptideComparisonColumnsExport.VM.1.ssv
proteinPeptideComparisonColumnsExport.S.1.ssv peptideExport.CS.1.ssv
PSMexport.1.ssv
hitTable.1.tsv
spectrumTable.1.tsv
tagSummary.1.tsv

Karl Clauser
Proteomics and Biomarker Discovery
Use Windows Explorer to Move data files to the SM server
6
At Broad Institute
• Nightly, data files backed up from instrument
to archive server.
• Following extraction, raw data files
automatically deleted from SM server,
replaced by shortcut.

Karl Clauser
Proteomics and Biomarker Discovery
Configuring an Extraction
7
• Convert to .mzXML
• Filter out low quality MS/MS
ThermoFisher
Instruments
• Calculate precursor ion XIC’s
• Correct precursor monisotopic
m/z assignments
• Merge replicate MS/MS from
same chromatographic peak
Agilent
Instruments
Karl Clauser
Proteomics and Biomarker Discovery
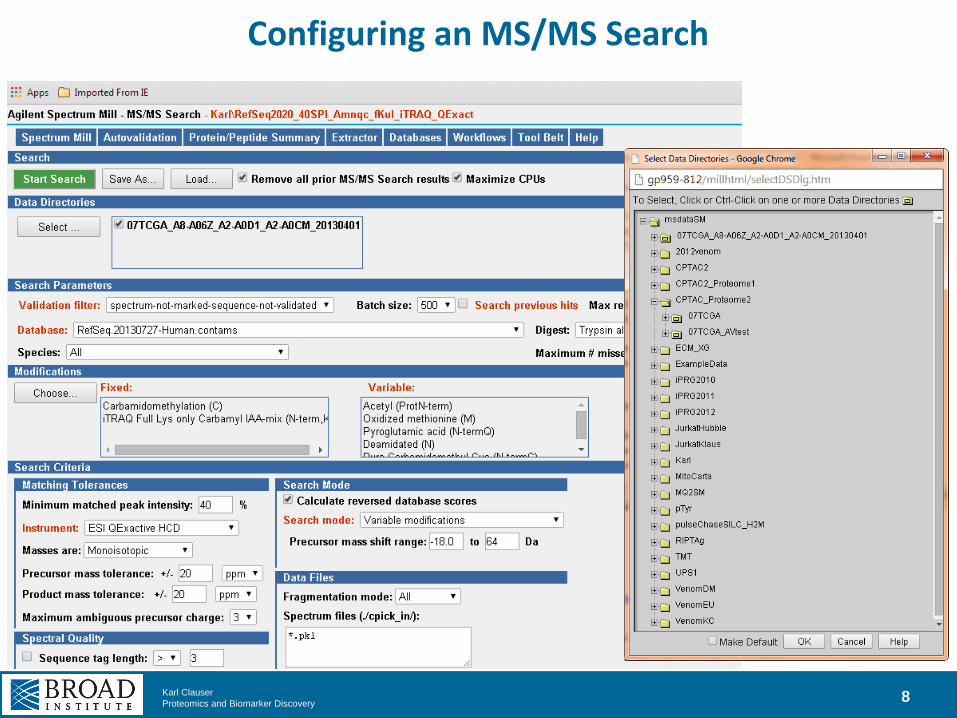
Configuring an MS/MS Search
8
Karl Clauser
Proteomics and Biomarker Discovery
Key Features of Spectrum Mill Database Searching with MS/MS Spectra
9
• Scoring specific to instrument types, dissociation modes
• Ion types allowed and scoring weights
• On board peak detection (de-isotoping, S/N thresholding, fragment z assignment).
• Product ion mass tolerance in ppm or Da.
• Spectra grouped in batches of similar precursor m/z, z for fast precursor mass filtering.
• Target-decoy FDR accomplished by on-the-fly peptide inner reversal
• SAMPLER becomes SELPMAR
• Search time is only ~1.5x as long as a target only database, instead of 2x for a
concatenated forward/reverse database. 1x digestion of all proteins, 1x precursor
mass filtering of all peptides, 2x MS/MS matching of every sequence (fwd & rev)
• Search results do not comingle target and decoy hits.
• For each PSM report top target hit, and delta Fwd – Rev score of top decoy hit
• A false positive PSM had delta Fwd-Rev < 0. (Top Decoy hit has higher score)
• Multiple cycles for fixed/mix modifications or unknown charge, with combined single result.
• Variable modifications constrained by precursor mass shift, not by # of mods/peptide.
• Second pass search possible with leftover spectra from 1st pass.
• Homology modes available
• Unassigned single mass gap
• Allow single mutation per peptide

Karl Clauser
Proteomics and Biomarker Discovery
Fixed, Mix and Variable Modifications
10
Fixed
Redefine
the wild type
as
Mix
Search in 2 cycles
Cycle 1: all KR light
Cycle 2: all KR heavy
DO NOT allow both light and heavy in 1 spectrum
Variable
Allow
2 possibilities
for an AA.
Allow both
in 1 spectrum
if more than one
location/AA.

Karl Clauser
Proteomics and Biomarker Discovery
PSM Scoring/ Phosphosite Localization
11

Karl Clauser
Proteomics and Biomarker Discovery
Spectrum Mill Scoring of MS/MS Interpretations
12
Peak Selection: De-Isotoping, S/N thresholding,
Parent - neutral removal, Charge assignment
Match to Database Candidate Sequences
Score
=
Assignment Bonus
(Ion Type Weighted)
+
Marker Ion Bonus
(Ion Type Weighted)
-
Non-assignment Penalty
(Intensity Weighted)
11.52
81.5%
80.3%
SPI (%)
Scored Peak Intensity
PIP(%)
Precursor Ion Purity
(R)I/S|F/D/E/F/I/K(I)

Karl Clauser
Proteomics and Biomarker Discovery 13
Localizing a Phosphorylation Site
L/F|P/A/D|T/s/P/S T A\T K
L/F|P/A/D|t S/P/S T A\T K
167 101
same spectrum
2 different interpretations

Karl Clauser
Proteomics and Biomarker Discovery 14
PTM Site Localization Test all Locations, Examine Score Gaps
No possible
ambiguity
Single
Site
Multiple
Sites
AVsEEQQPALK
# PO4 sites = # S,T, or Y
AVS(1.0)EEQQPALK
APS(0.99)LT(0.0)DLVK APsLTDLVK *
APSLtDLVK -
Locations Tested Conclusion
S(0.50)S(0.50)S(0.0)AGPEGPQLDVPR sSSAGPEGPQLDVPR *
SsSAGPEGPQLDVPR *
SSsAGPEGPQLDVPR -
VT(0.0)NDIS(0.99)PES(0.50)S(0.50)PGVGR VTNDIsPEsSPGVGR *
VTNDIsPESsPGVGR *
VTNDISPEssPGVGR -
VtNDIsPESSPGVGR -
VtNDISPEsSPGVGR -
VtNDISPESsPGVGR -

Karl Clauser
Proteomics and Biomarker Discovery 15
PTM Site Localization – Confident Localization
(K)A/P|s/L/T D|L\V K(S)
APS(0.99)LT(0.0)DLVK
y6, y7 ions provide
confident localization
to the Ser

Karl Clauser
Proteomics and Biomarker Discovery 16
PTM Site Localization – Ambiguous Localization
(R)S s/S/A/G/P E/G/P Q L|D|V|P R(E)
S(0.50)S(0.50)S(0.0)AGPEGPQLDVPR
y13++ ion excludes
localization to Ser 3

Karl Clauser
Proteomics and Biomarker Discovery 17
PTM Site Localization – Ambiguous Localization 2 sites: 1 confident, 1 ambiguous
(R)V T N D|I|s/P E|s S/P G V\G R(R)
VT(0.0)NDIS(0.99)PES(0.50)S(0.50)PGVGR
y9, y10 ions provide
confident localization to
the Ser -6
y9, y10 ions provide
ambiguous localization to
Ser-9, Ser-10

Karl Clauser
Proteomics and Biomarker Discovery 18
Spectrum Mill Variable Modification Localization Score
VML score = Difference in Score of same identified sequences with different
variable modification localizations
VML score > 1.1 indicates confident localization
Why a threshold value of 1.1?
1 implies that there is a distinguishing ion of b or y ion type
0.1 means that when unassigned, the peak is 10% the intensity of the base peak

Karl Clauser
Proteomics and Biomarker Discovery
Phosphosite Localization Scoring - Ascore
19
http://ascore.med.harvard.edu/
Supports Sequest results only, Linux only Beausoleil SA, Villen J, Gerber SA, Rush J, Gygi SP (2006) Nat Biotechnol 24:1285–1292.
7
0.07 0.07
• Typical score
thresholds are
equivalent to 2 peaks
supporting localization
• Peak selection
probability term
requires Da tolerance
instead of ppm

Karl Clauser
Proteomics and Biomarker Discovery
VML Score Features Reported
20
*
*

Karl Clauser
Proteomics and Biomarker Discovery
Autovalidation Confident identification and False Discovery Rates
(FDR) at the PSM, peptide, and protein levels.
21

Karl Clauser
Proteomics and Biomarker Discovery
Autovalidation – Peptide/PSM level
22
Optimize thresholds by directory
Useful for low frequency
matches in complex samples
• PTM’s in unenriched samples
• Proteogenomic variants
• High charge states (>4+)
Min Sequence length filter
• Short peptides often contribute to multiple proteins,
inclusion may skew protein quantitation.
• Extractor MH+ lower limit: 750 for iTRAQ excludes
short Arg peps
• Autovalidation MSL filter excludes short Lys & Arg peps
Separate Score
thresholds for each:
• LC-MS/MS run
• Precursor charge
Separate precursor
mass error range for
each LC-MS/MS run
• Median +/- 3 std dev
Karl Clauser
Proteomics and Biomarker Discovery
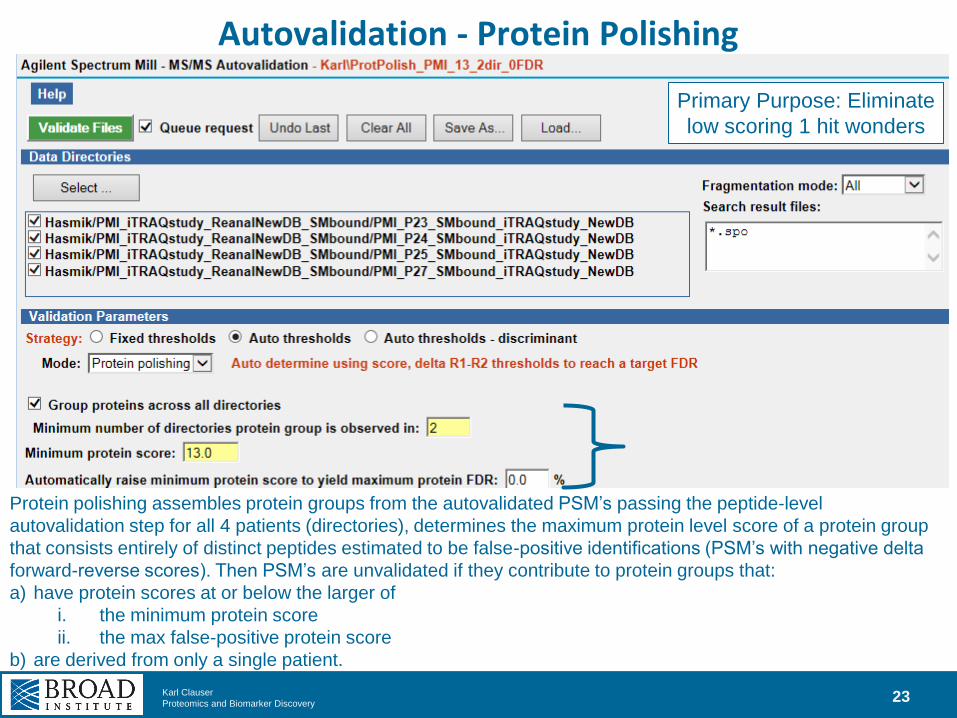
Autovalidation - Protein Polishing
23
Protein polishing assembles protein groups from the autovalidated PSM’s passing the peptide-level
autovalidation step for all 4 patients (directories), determines the maximum protein level score of a protein group
that consists entirely of distinct peptides estimated to be false-positive identifications (PSM’s with negative delta
forward-reverse scores). Then PSM’s are unvalidated if they contribute to protein groups that:
a) have protein scores at or below the larger of
i. the minimum protein score
ii. the max false-positive protein score
b) are derived from only a single patient.
Primary Purpose: Eliminate
low scoring 1 hit wonders

Karl Clauser
Proteomics and Biomarker Discovery
Collapsing Peptide Spectrum Matches (PSM’s) for Quantitation at the
Protein level and Phosphosite level
24

Global proteome and phosphoproteome discovery workflow for TCGA breast tumors
25
1 mg total protein per tumor
Internal reference: equal representation of basal, Her2 and Luminal A/B subtypes

Hierarchical clustering of proteome yields 3 major
groups: basal, luminal, and a new group
ratio count >1;
stdev>1. 5
>15 tumors
4,657 proteins
Basal-
Enriched
Luminal-
Enriched Uncharacterized
Clusters
• Row – protein
• Cell - iTRAQ ratio
• Column - patient
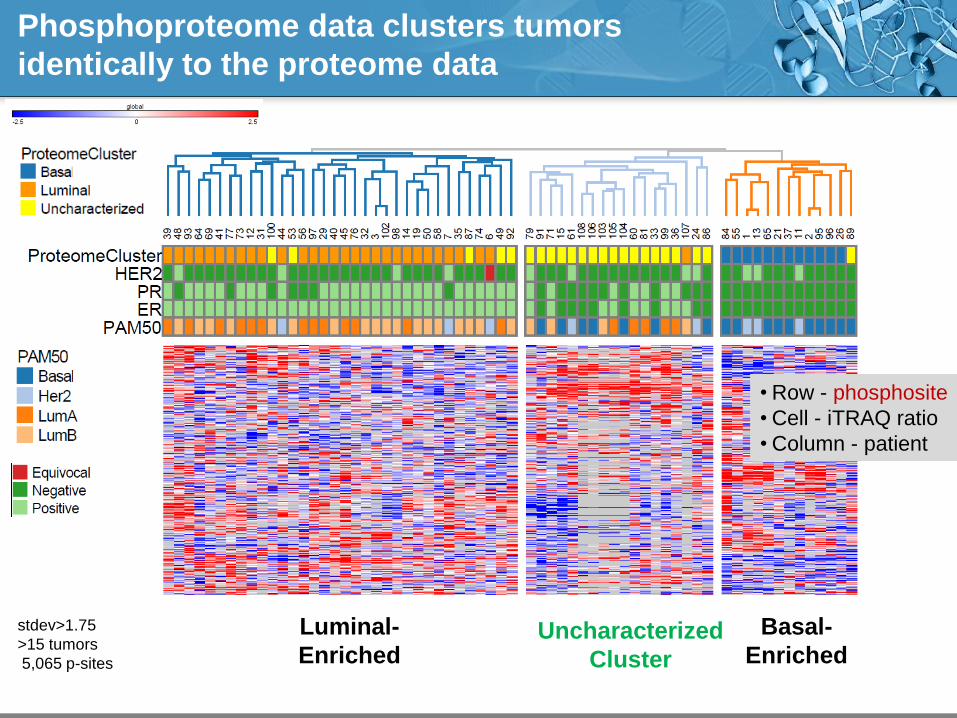
Phosphoproteome data clusters tumors
identically to the proteome data
Basal-
Enriched
Luminal-
Enriched Uncharacterized
Cluster
stdev>1.75
>15 tumors
5,065 p-sites
• Row - phosphosite
• Cell - iTRAQ ratio
• Column - patient

Karl Clauser
Proteomics and Biomarker Discovery 28
Protein Grouping Method: 1 shared, expand subgroups
Protein Inference Tutorial
Nesvizhskii, Mol Cell Proteomics, 4, 1419-1440, 2005.
# groups # subgroups
2 1, 1
1 1
1 2
# groups # subgroups
1 2
1 1
1 1

Karl Clauser
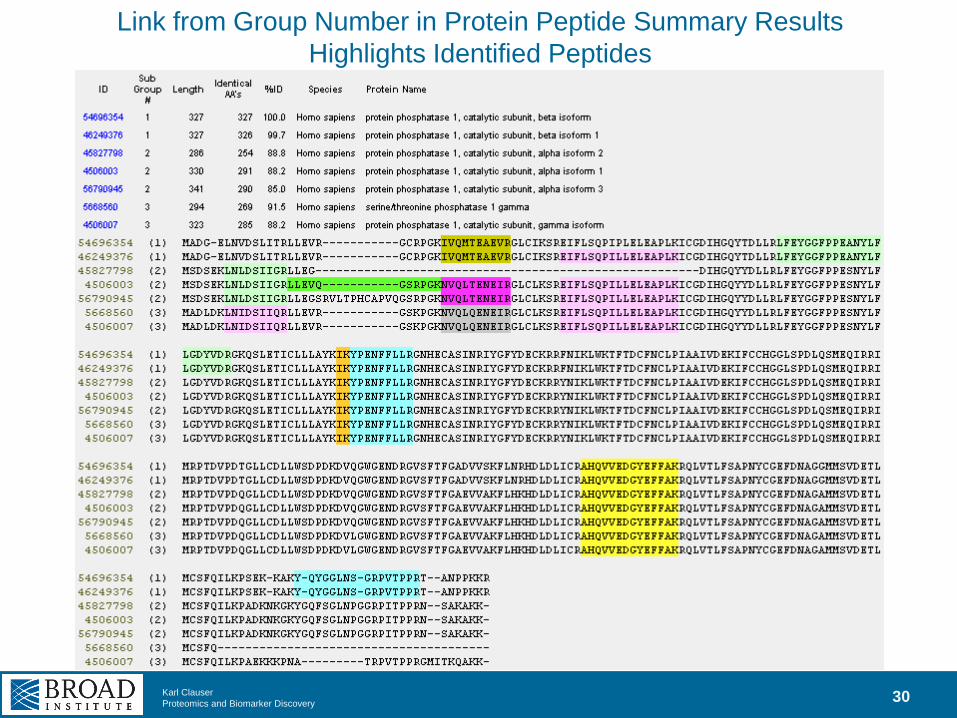
Proteomics and Biomarker Discovery 29
Collapsing PSM’s to Protein level
Distinct Peptides must be
length >8 to spawn a new
subgroup
Karl Clauser
Proteomics and Biomarker Discovery 30
Link from Group Number in Protein Peptide Summary Results
Highlights Identified Peptides

Karl Clauser
Proteomics and Biomarker Discovery
Collapsing PSM’s to VM site level
31
m/z ppm
ID
Score Filename
VML
score
#Loc
sty
sites
#Am
big
sty
sites
iTRAQ
114/1
17
iTRAQ
115/1
17
iTRAQ
116/1
17
PIP
(%) Sequence VML sequence
Gene
name
PO4
Site
552.960 5.1 13.83TCGA_A8-A06Z_A2-A0D1_A2-A0CM_117C_P_BI_201303230_H-JQ_f04.10050.10050.3 0.00 0 1 0.96 0.08 1.27 76.7 RSStLSQLPGDK RS(0.33)S(0.33)T(0.33)LS(0.0)QLPGDK SPAG9 T581t
643.689 -0.1 10.84TCGA_A8-A06Z_A2-A0D1_A2-A0CM_117C_P_BI_201303230_H-JQ_f10.7464.7464.3 0.00 0 1 0.93 0.06 1.45 94.5 KRSsTLSQLPGDK KRS(0.25)S(0.25)T(0.25)LS(0.25)QLPGDK
500.923 -1.4 8.06TCGA_A8-A06Z_A2-A0D1_A2-A0CM_117C_P_BI_201303230_H-JQ_f12.11558.11558.3 0.00 0 1 1.48 0.31 0.88 78.7 SsTLSQLPGDK S(0.25)S(0.25)T(0.25)LS(0.25)QLPGDK
750.882 0.8 7.23TCGA_A8-A06Z_A2-A0D1_A2-A0CM_117C_P_BI_201303230_H-JQ_f11.11174.11174.2 0.00 0 1 1.84 0.16 0.99 87.1 SStLSQLPGDK S(0.0)S(0.50)T(0.50)LS(0.0)QLPGDK
750.881 -0.2 7.09TCGA_A8-A06Z_A2-A0D1_A2-A0CM_117C_P_BI_201303230_H-JQ_f12.11572.11572.2 0.00 0 1 1.96 0.14 0.71 62.8 SStLSQLPGDK S(0.0)S(0.50)T(0.50)LS(0.0)QLPGDK
678.833 3.6 7.07TCGA_A8-A06Z_A2-A0D1_A2-A0CM_117C_P_BI_201303230_H-JQ_f09.11720.11720.2 1.04 0 1 0.99 0.10 0.96 82.9 SStLSQLPGDK S(0.33)S(0.33)T(0.33)LS(0.0)QLPGDK
551.943 0.1 10.81TCGA_A8-A06Z_A2-A0D1_A2-A0CM_117C_P_BI_201303230_H-JQ_f08.20410.20410.3 4.43 1 0 0.40 0.70 1.84 75.1 DGGsVVGASVFYK DGGS(0.99)VVGAS(0.0)VFY(0.0)K SPAG9 S691s
755.361 2.1 7.91TCGA_A8-A06Z_A2-A0D1_A2-A0CM_117C_P_BI_201303230_H-JQ_f07.20717.20717.2 7.91 1 0 1.03 0.89 1.60 94.0 DGGsVVGASVFYK DGGS(0.99)VVGAS(0.0)VFY(0.0)K
827.408 -2.0 7.73TCGA_A8-A06Z_A2-A0D1_A2-A0CM_117C_P_BI_201303230_H-JQ_f08.20423.20423.2 7.73 1 0 0.57 0.90 1.63 87.7 DGGsVVGASVFYK DGGS(0.99)VVGAS(0.0)VFY(0.0)K
721.043 0.7 16.86TCGA_A8-A06Z_A2-A0D1_A2-A0CM_117C_P_BI_201303230_H-JQ_f01.16757.16757.3 2.29 1 0 0.48 0.98 1.77 69.8 SAsQSSLDKLDQELK S(0.0)AS(0.99)QS(0.0)S(0.0)LDKLDQELK SPAG9 S716s
645.813 1.0 12.89TCGA_A8-A06Z_A2-A0D1_A2-A0CM_117C_P_BI_201303230_H-JQ_f06.4977.4977.2 2.66 1 0 0.74 0.08 1.45 91.6 SAsQSSLDK S(0.0)AS(0.99)QS(0.0)S(0.0)LDK
541.035 2.5 12.36TCGA_A8-A06Z_A2-A0D1_A2-A0CM_117C_P_BI_201303230_H-JQ_f01.16777.16777.4 0.00 0 1 0.42 1.08 1.74 74.7 SASQsSLDKLDQELK S(0.0)AS(0.50)QS(0.50)S(0.0)LDKLDQELK
1081.057 -2.6 13.71TCGA_A8-A06Z_A2-A0D1_A2-A0CM_117C_P_BI_201303230_H-JQ_f10.15073.15073.2 1.21 1 0 0.44 0.76 1.56 87.9 SASQSsLDKLDQELK S(0.0)AS(0.0)QS(0.0)S(0.99)LDKLDQELK SPAG9 S719s
541.032 -1.7 8.73TCGA_A8-A06Z_A2-A0D1_A2-A0CM_117C_P_BI_201303230_H-JQ_f10.15034.15154.4 0.00 0 1 0.48 0.74 1.56 75.6 SASQSsLDKLDQELK S(0.0)AS(0.0)QS(0.50)S(0.50)LDKLDQELK
721.040 -2.5 7.37TCGA_A8-A06Z_A2-A0D1_A2-A0CM_117C_P_BI_201303230_H-JQ_f10.15039.15039.3 0.00 0 1 0.35 0.75 1.52 72.3 SASQSsLDKLDQELK S(0.0)AS(0.0)QS(0.50)S(0.50)LDKLDQELK
430.878 0.6 4.40TCGA_A8-A06Z_A2-A0D1_A2-A0CM_117C_P_BI_201303230_H-JQ_f04.4593.4593.3 0.00 0 1 0.65 0.06 1.52 69.7 SASQSsLDK S(0.0)AS(0.0)QS(0.50)S(0.50)LDK
Non-conflicting
localization
requires

Karl Clauser
Proteomics and Biomarker Discovery
Key Features of Spectrum Mill Quantitation
32
• MS/MS reporter ion ratio based: iTRAQ, TMT
• Median of all PSM ratios for each Protein, VM-site
• Not sum of all PSM reporter ion intensities, then ratio for Protein, VM-site
• Exclude ratios with PIP < 50%
• Exclude ½ of false positive ID’s: Delta Fwd-Rev < 0
• Exclude peptides with no label
• MS precursor ion ratio based: SILAC
• Only 1 member of H/L pair H/M/L triplet needs to be triggered for MS/MS
• Median of all H/L pair H/M/L triplet ratios for each Protein, VM-site
• Exclude ratios from poor precursor ion isotope cluster shape
• Label – free
• Only uses peptides identified by MS/MS
• Sums up all precursor ion peak area for all PSM’s for a protein
• Peptides shared between protein subgroups
• Use shared in each subgroup
• Use only unshared: Subgroup specific

Karl Clauser
Proteomics and Biomarker Discovery
Automation
Service Request Manager (SRM)
and Workflows
33

Karl Clauser
Proteomics and Biomarker Discovery
SRM coordinates
task execution on
the queue to
maximize CPU
usage while
maintaining
workflow order
dependencies
SRM Request Queue Status
34
Tasks in each
user’s workflow
execute in serial
User A’s workflow
executes
in parallel with
user B’s workflow
Any user can
add/remove tasks
from queue
Insert screenshot
of active queue
with multiple
users

Karl Clauser
Proteomics and Biomarker Discovery
SRM Completion Log
35
If a task fails the
SRM aborts all
subsequent task
in the workflows
Karl Clauser
Proteomics and Biomarker Discovery
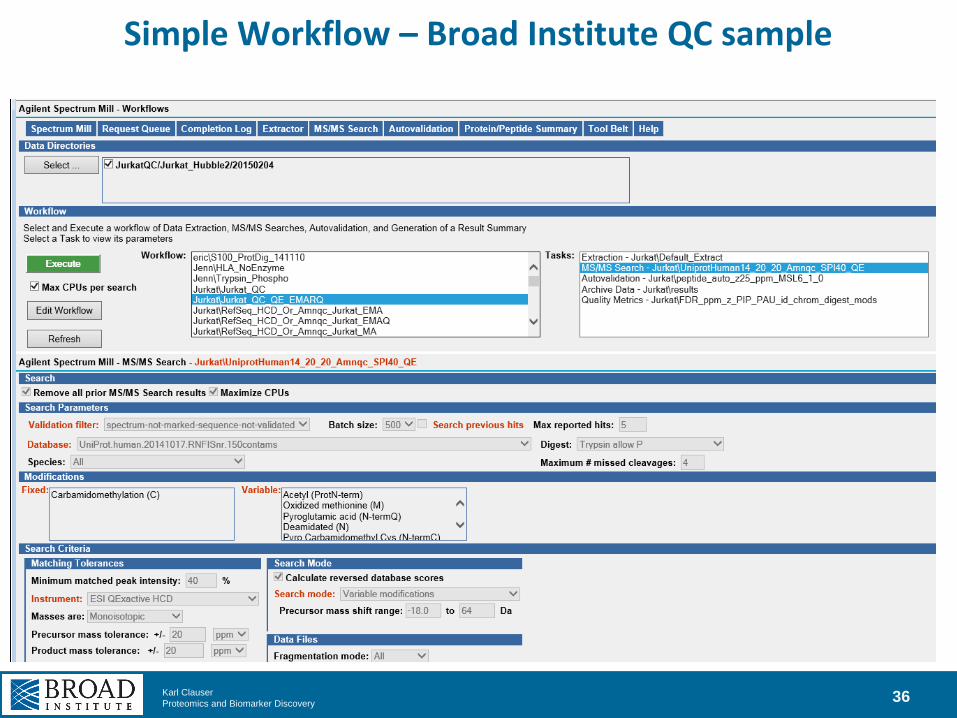
Simple Workflow – Broad Institute QC sample
36

Karl Clauser
Proteomics and Biomarker Discovery
Complex Workflow – Mixed CID/ETD Dataset
37

Karl Clauser
Proteomics and Biomarker Discovery
Edit Workflow
38
Edit an existing
workflow to search a
different database

Karl Clauser
Proteomics and Biomarker Discovery
Quality Metrics
Troubleshooting
• LC Gradient and column performance
• Measuring data acquisition strategy changes
• Mass calibration drift
• MS ion optics need cleaning
• iTRAQ labeling efficiency
• IMAC phospho enrichment
• Cysteine reduction/alkylation failure
39

Karl Clauser
Proteomics and Biomarker Discovery
Standalone Quality Metrics form
40
Concepts for some of these metrics were developed and described in: Rudnick PA, Clauser KR, Kilpatrick LE, et.
al., "Performance metrics for liquid chromatography-tandem mas spectrometry systems in proteomics analyses",
Mol Cell Proteomics. 2010 Feb;9(2):225-41 (http://www.ncbi.nlm.nih.gov/pubmed/19837981).

Karl Clauser
Proteomics and Biomarker Discovery
MS and Chromatography Metrics
41
Measure effect of changes in acquisition parameters and chromatography
on recently installed QExactive Plus at Broad Institute
Comment
Pep
Match
MS/MS
spectra
collect
ed C
MS/MS
spectra
collect
ed MI
m/z =
0.0
MS/MS
spectra
filtered
F
MS/MS
spectra
valid V
MS/MS
spectra
valid
MI m/z
= 0.0
Medi
an ID
Scor
e
Mean
Precu
rsor
Mass
Error
(ppm)
Start
time
mid 90
% run
(min)
End
time
mid 90
% run
(min)
Time
span
mid 90
% run
(min)
Gradient
Shape
mid 90 %
filtered
spectra
in run
Media
n MS1
peak
width
mid 90
% run
(sec)
Total
precurso
r XIC
mid 90 %
matched
spectra
in run
PIP
bin 1
100-
90
Spec
tra
(%)
PIP
bin 6
<50
Spec
tra
(%)
Distinct
Peps
CS
Total
(#)
FDR
Spec
tra
(%)
pref 59,229 15,118 54,812 34,687 5,706 11.57 1.8 20 98 78 9876532 12 3.32E+13 21.5 10.3 28,743 0.94
LC-Frankl in,
New pump
B pref 59,003 14,832 54,249 35,140 5,750 11.67 0.3 21 98 78 9986643 12 3.64E+13 21.8 10.6 28,683 0.96
on 52,270 - 47,892 34,811 - 12.07 0.3 21 98 78 9997754 12 6.15E+13 22.1 9.7 27,929 0.72 Isolation
width
decreased
2.5 to 2.0 on 51,827 - 49,963 36,876 - 12.68 1.1 17 98 81 9987753 12 6.31E+13 29.7 6.4 29,598 0.73
LC-Klaus on 49,015 - 47,140 32,487 - 11.73 -0.2 18 98 80 9999876 15 5.35E+13 26.1 9.4 26,176 0.78
pref 60,705 19,121 57,497 38,127 8,198 11.79 2.2 21 100 79 9897654 11 4.88E+13 27.0 7.6 30,759 0.8716 min
longer
gradient,
i solation
width
decreased
2.0 to 1.6 pref 68,003 23,946 63,633 42,998 10,670 12.36 -0.4 20 115 94 8898754 13 6.13E+13 35.0 4.8 34,719 0.96
Replaced
Pump B
Replaced
LC
Lengthened
Gradient

Karl Clauser
Proteomics and Biomarker Discovery
Comment
Pep
Match
MS/MS
spectra
collect
ed C
MS/MS
spectra
collect
ed MI
m/z =
0.0
MS/MS
spectra
filtered
F
MS/MS
spectra
valid V
MS/MS
spectra
valid
MI m/z
= 0.0
Medi
an ID
Scor
e
Mean
Precu
rsor
Mass
Error
(ppm)
Start
time
mid 90
% run
(min)
End
time
mid 90
% run
(min)
Time
span
mid 90
% run
(min)
Gradient
Shape
mid 90 %
filtered
spectra
in run
Media
n MS1
peak
width
mid 90
% run
(sec)
Total
precurso
r XIC
mid 90 %
matched
spectra
in run
PIP
bin 1
100-
90
Spec
tra
(%)
PIP
bin 6
<50
Spec
tra
(%)
Distinct
Peps
CS
Total
(#)
FDR
Spec
tra
(%)
on 52,270 - 47,892 34,811 - 12.07 0.3 21 98 78 9997754 12 6.15E+13 22.1 9.7 27,929 0.72 Isolation
width
decreased
2.5 to 2.0 on 51,827 - 49,963 36,876 - 12.68 1.1 17 98 81 9987753 12 6.31E+13 29.7 6.4 29,598 0.73
LC-Klaus on 49,015 - 47,140 32,487 - 11.73 -0.2 18 98 80 9999876 15 5.35E+13 26.1 9.4 26,176 0.78
pref 60,705 19,121 57,497 38,127 8,198 11.79 2.2 21 100 79 9897654 11 4.88E+13 27.0 7.6 30,759 0.8716 min
longer
gradient,
i solation
width
decreased
2.0 to 1.6 pref 68,003 23,946 63,633 42,998 10,670 12.36 -0.4 20 115 94 8898754 13 6.13E+13 35.0 4.8 34,719 0.96
MS and Chromatography Metrics
42
Measure effect of changes in acquisition parameters and chromatography
on recently installed QExactive Plus at Broad Institute
Narrowed
isolation width
Lengthened
Gradient
Pep Match (on/pref)
Precursor isotope cluster

Karl Clauser
Proteomics and Biomarker Discovery
Phosphorylation Quality Metrics
43
Directory
Raw
Files
MS/MS
spectra
valid V
s|t|y
Sites
spectra
(%)
s|t|y
Sites
spectra
(#)
s|t|y
Sites
Localized
spectra
(%)
s|t|y
Sites
Distinct
Peptides
(CI#)
s|t|y
Sites
Distinct
Peptides
(CI%)
s|t|y
Sites
FDR
Spectra
(%)
s|t|y
Sites
FDR
Distinct
Peptide
(%)
s|t|y
Sites
Distinct
Peptides
(CI#)
FDR
Spectra
(%)
FDR
Distinct
Peptide
(%)
Distinct
Peptides
(CI#) CPTAC2/Phosphoproteome2/01TCGA_AO-A12D_C8-A131_AO-A12B_2013021313 77,152 94.5 72,930 56.4 32,179 92.4 0.47 0.92 32,179 0.51 0.98 34,830
CPTAC2/Phosphoproteome2/02TCGA_E2-A10A_BH-A18Q_C8-A130_2013022813 82,578 90.0 74,288 55.7 31,843 85.9 0.51 1.00 31,843 0.52 0.98 37,072
CPTAC2/Phosphoproteome2/03TCGA_C8-A138_E2-A154_BH-A0BZ_2013030113 91,894 77.8 71,460 57.0 31,193 75.6 0.48 0.95 31,193 0.50 0.96 41,256
CPTAC2/Phosphoproteome2/04TCGA_A8-A09I_C8-A12L_A2-A0EX_20130032113 98,744 72.6 71,690 57.9 31,921 68.1 0.57 1.12 31,921 0.51 0.96 46,887
CPTAC2/Phosphoproteome2/05TCGA_AO-A12D_AN-A04A_BH-A0AV_20130032213 90,028 83.4 75,068 57.6 31,748 78.2 0.49 1.05 31,748 0.50 0.98 40,620
CPTAC2/Phosphoproteome2/06TCGA_A2-A0D0_BH-A0HK_C8-A12T_20130032913 96,310 53.2 51,264 58.7 22,933 51.4 0.64 1.18 22,933 0.51 0.93 44,613
CPTAC2/Phosphoproteome2/07TCGA_A8-A06Z_A2-A0D1_A2-A0CM_2013033013 83,351 73.0 60,858 58.4 26,668 68.9 0.54 1.03 26,668 0.47 0.86 38,695
CPTAC2/Phosphoproteome2/08TCGA_BH-A18U_A2-A0YI_A2-A0EQ_2013042313 102,722 66.7 68,521 55.1 30,355 66.3 0.65 1.23 30,355 0.49 0.92 45,811
CPTAC2/Phosphoproteome2/09TCGA_AR-A0TY_AR-A0U4_BH-A0HP_2013042613 87,016 67.1 58,360 55.5 27,513 65.1 0.62 1.19 27,513 0.51 0.91 42,250
CPTAC2/Phosphoproteome2/10TCGA_BH-A0EE_AO-A0J9_BH-A0E0_2013042613 88,406 78.5 69,368 55.7 29,632 74.7 0.58 1.15 29,632 0.52 1.00 39,650
CPTAC2/Phosphoproteome2/11TCGA_AR-A1AP_AN-A0FK_AO-A0J6_2013060513 60,593 92.5 56,029 49.4 25,075 90.0 0.52 0.95 25,075 0.50 0.89 27,864
CPTAC2/Phosphoproteome2/12TCGA_BH-A18V_A7-A13F_BH-A0E1_2013053113 63,858 94.1 60,117 50.5 26,540 92.5 0.45 0.81 26,540 0.45 0.80 28,689
CPTAC2/Phosphoproteome2/13TCGA_A7-A0CE_BH-A0C0_A2-A0YC_2013053113 81,810 85.2 69,701 49.5 28,186 79.7 0.51 0.93 28,186 0.49 0.86 35,384
CPTAC2/Phosphoproteome2/14TCGA_AO-A0JC_A8-A08Z_AR-A0TX_2013060613 68,580 90.7 62,196 48.5 26,335 87.6 0.49 0.92 26,335 0.49 0.91 30,077
CPTAC2/Phosphoproteome2/15TCGA_D8-A13Y_A8-A076_AO-A126_2013062113 80,970 95.0 76,933 57.2 31,203 92.8 0.47 0.97 31,203 0.50 1.02 33,629
CPTAC2/Phosphoproteome2/16TCGA_C8-A12P_BH-A0C1_A2-A0EY_2013062813 83,601 93.1 77,874 56.2 32,908 90.0 0.46 0.91 32,908 0.49 0.91 36,573
CPTAC2/Phosphoproteome2/17TCGA_AR-A1AW_AR-A1AV_C8-A135_2013070213 71,216 94.5 67,305 56.7 29,337 91.9 0.48 0.95 29,337 0.49 0.93 31,907
CPTAC2/Phosphoproteome2/18TCGA_A2-A0EV_AN-A0AM_D8-A142_2013072413 71,290 93.9 66,930 53.0 27,688 91.6 0.47 0.91 27,688 0.49 0.93 30,234
CPTAC2/Phosphoproteome2/19TCGA_AN-A0FL_BH-A0DG_AN-A0AS_2013083013 85,670 92.5 79,252 55.9 35,012 90.2 0.5 0.98 35,012 0.51 0.97 38,814
CPTAC2/Phosphoproteome2/20TCGA_AR-A0TV_C8-A12Z_AO-A0JJ_2013083113 85,860 94.7 81,314 55.8 35,404 93.1 0.48 0.96 35,404 0.51 1.00 38,046
CPTAC2/Phosphoproteome2/21TCGA_AO-A0JE_A2-A0T2_AN-A0AJ_2013090113 90,324 96.6 87,277 55.3 35,215 95.1 0.47 0.98 35,215 0.50 1.04 37,043
CPTAC2/Phosphoproteome2/22TCGA_A7-A0CJ_AO-A12F_A2-A0YL_2013090413 83,748 97.5 81,684 56.0 34,594 96.3 0.46 0.97 34,594 0.49 1.01 35,935
CPTAC2/Phosphoproteome2/23TCGA_A2-A0T7_C8-A12Q_A8-A079_2013090513 84,628 94.6 80,032 55.2 31,800 92.1 0.43 0.94 31,800 0.46 0.98 34,537
CPTAC2/Phosphoproteome2/24TCGA_E2-A159_A2-A0T3_A2-A0YD_2013090613 75,699 95.7 72,416 55.4 28,790 93.8 0.46 0.97 28,790 0.48 0.99 30,697
• Track level of phospho enrichment
across IMAC experiments
• Separate FDR calculation for
phosphopeptides and all peptides
Karl Clauser
Proteomics and Biomarker Discovery
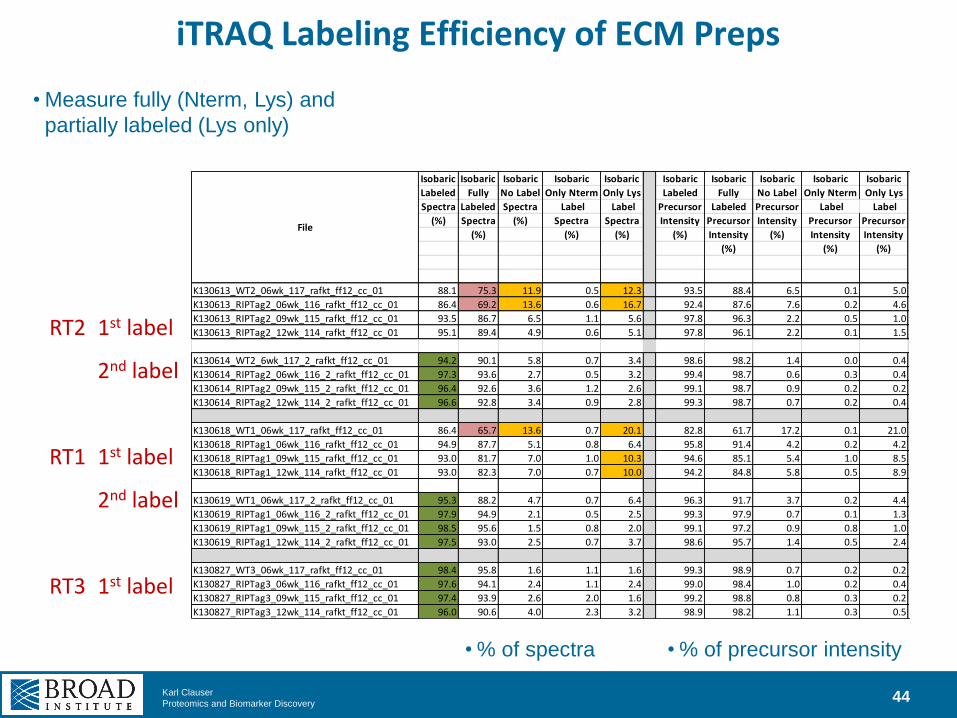
iTRAQ Labeling Efficiency of ECM Preps
44
Isobaric Isobaric Isobaric Isobaric Isobaric Isobaric Isobaric Isobaric Isobaric Isobaric Digest
Labeled Fully No Label Only Nterm Only Lys Labeled Fully No Label Only Nterm Only Lys Missed
Spectra Labeled Spectra Label Label Precursor Labeled Precursor Label Label Cleavages
(%) Spectra (%) Spectra Spectra Intensity Precursor Intensity Precursor Precursor trypsin (%
(%) (%) (%) (%) Intensity (%) Intensity Intensity Distinct
(%) (%) (%) peps CS)
K130613_WT2_06wk_117_rafkt_ff12_cc_01 88.1 75.3 11.9 0.5 12.3 93.5 88.4 6.5 0.1 5.0 25.6
K130613_RIPTag2_06wk_116_rafkt_ff12_cc_01 86.4 69.2 13.6 0.6 16.7 92.4 87.6 7.6 0.2 4.6 21.2
K130613_RIPTag2_09wk_115_rafkt_ff12_cc_01 93.5 86.7 6.5 1.1 5.6 97.8 96.3 2.2 0.5 1.0 27.1
K130613_RIPTag2_12wk_114_rafkt_ff12_cc_01 95.1 89.4 4.9 0.6 5.1 97.8 96.1 2.2 0.1 1.5 24.1
K130614_WT2_6wk_117_2_rafkt_ff12_cc_01 94.2 90.1 5.8 0.7 3.4 98.6 98.2 1.4 0.0 0.4 25.8
K130614_RIPTag2_06wk_116_2_rafkt_ff12_cc_01 97.3 93.6 2.7 0.5 3.2 99.4 98.7 0.6 0.3 0.4 19.0
K130614_RIPTag2_09wk_115_2_rafkt_ff12_cc_01 96.4 92.6 3.6 1.2 2.6 99.1 98.7 0.9 0.2 0.2 24.6
K130614_RIPTag2_12wk_114_2_rafkt_ff12_cc_01 96.6 92.8 3.4 0.9 2.8 99.3 98.7 0.7 0.2 0.4 23.6
K130618_WT1_06wk_117_rafkt_ff12_cc_01 86.4 65.7 13.6 0.7 20.1 82.8 61.7 17.2 0.1 21.0 5.3
K130618_RIPTag1_06wk_116_rafkt_ff12_cc_01 94.9 87.7 5.1 0.8 6.4 95.8 91.4 4.2 0.2 4.2 4.8
K130618_RIPTag1_09wk_115_rafkt_ff12_cc_01 93.0 81.7 7.0 1.0 10.3 94.6 85.1 5.4 1.0 8.5 8.0
K130618_RIPTag1_12wk_114_rafkt_ff12_cc_01 93.0 82.3 7.0 0.7 10.0 94.2 84.8 5.8 0.5 8.9 4.5
K130619_WT1_06wk_117_2_rafkt_ff12_cc_01 95.3 88.2 4.7 0.7 6.4 96.3 91.7 3.7 0.2 4.4 5.6
K130619_RIPTag1_06wk_116_2_rafkt_ff12_cc_01 97.9 94.9 2.1 0.5 2.5 99.3 97.9 0.7 0.1 1.3 4.9
K130619_RIPTag1_09wk_115_2_rafkt_ff12_cc_01 98.5 95.6 1.5 0.8 2.0 99.1 97.2 0.9 0.8 1.0 7.4
K130619_RIPTag1_12wk_114_2_rafkt_ff12_cc_01 97.5 93.0 2.5 0.7 3.7 98.6 95.7 1.4 0.5 2.4 5.1
K130827_WT3_06wk_117_rafkt_ff12_cc_01 98.4 95.8 1.6 1.1 1.6 99.3 98.9 0.7 0.2 0.2 15.6
K130827_RIPTag3_06wk_116_rafkt_ff12_cc_01 97.6 94.1 2.4 1.1 2.4 99.0 98.4 1.0 0.2 0.4 19.0
K130827_RIPTag3_09wk_115_rafkt_ff12_cc_01 97.4 93.9 2.6 2.0 1.6 99.2 98.8 0.8 0.3 0.2 14.9
K130827_RIPTag3_12wk_114_rafkt_ff12_cc_01 96.0 90.6 4.0 2.3 3.2 98.9 98.2 1.1 0.3 0.5 23.0
File
RT2 1st label
2nd label
RT1 1st label
2nd label
RT3 1st label
• Measure fully (Nterm, Lys) and
partially labeled (Lys only)
• % of spectra • % of precursor intensity

Karl Clauser
Proteomics and Biomarker Discovery
PSMs
Containing
no Var
Mods (#)
PSMs
Containing
m (#)
PSMs
Containing
c (#)
PSMs
Containing
p (#)
PSMs
Containing
C (#)
PSM's
Cys/Total
5101 285 133 918 1527 0.213
3857 219 61 1051 778 0.140
4147 225 77 1107 866 0.145
5852 309 129 1178 1580 0.193
5204 522 223 1247 1855 0.228
4785 470 185 1072 1475 0.204
4161 287 157 1212 1170 0.184
6395 424 26 1371 533 0.058
7617 1199 303 1752 2431 0.206
7408 1078 259 1469 2084 0.188
6685 764 212 1524 1613 0.162
14035 946 113 1770 2770 0.152
1184 200 2 1144 77 0.029
1928 258 3 1004 91 0.027
4483 580 117 1381 1495 0.205
3684 447 5 1323 177 0.030
7617 1199 303 1752 2431 0.206
7408 1078 259 1469 2084 0.188
6685 764 212 1524 1613 0.162
14035 946 113 1770 2770 0.152
1184 200 2 1144 77 0.029
1928 258 3 1004 91 0.027
4483 580 117 1381 1495 0.205
3684 447 5 1323 177 0.030
4017 434 22 1571 1061 0.166
5540 578 28 1434 1273 0.157
12714 1058 234 2129 3127 0.180
11774 936 70 1934 2376 0.151
Reduction/Alkylation Problem
45
1 Fine
2 Before
2 After
3 Before
3 After
Reduction/alkylation repeated due to
low #’s of PSM’s Containing Cys

Karl Clauser
Proteomics and Biomarker Discovery
Peptide String Match
46
An aid for configuring targeted MS/MS assays
ClustalW
Multi-Aligner

Karl Clauser
Proteomics and Biomarker Discovery
Future Directions
47
• Personalized sequence databases
• 2-3x faster searches, better handle peptide redundancy in databases from isoforms
• Store protein grouping for faster report generation
• VM site level polishing autovalidation
• VM site level FDR, FLR
• Better integration with post-SM statistical manipulation of quantitation
• Normalization
• Significance testing
• Clustering
• Spectral library searching
• Identify multiple peptides per MS/MS spectrum

Dataflow for Proteomics with Personalized Sequence Databases
48
CPTAC Global Proteomics Phospho Proteomics
105 Tumors
Variants,
Alternative Splicing,
Frameshifts,
Novel Expression,
Fusion Genes,
Indels,
Tumor Specific Databases
QUILTS quilts.fenyolab.org
Identified/Quantitated Peptides and Proteins
+ tumor specific peptides + patient specific peptides
MS/MS
Proteogenomic mapping
and integration
Sequence Analysis (TopHat, BowTie, GATK )
Whole Exome sequencing RNA-Seq Copy number arrays (Affy) DNA methylation Whole genome sequencing mRNA arrays (Affy) miRNA sequencing RPPA
TCGA
RefSeq Reference database
Spectrum Mill
Variants
Alternative
Frameshift
Other
.VCF .BED
.fasta (4x10⁵)
.fasta .Raw
germline

Serial Search Strategy with Personalized Databases
49
> Canonical Protein SIGNALINGPATHWAYREGULATOR
25,776,160 Spectra (105 patients) (36 iTRAQ experiments) (25 LC-MS/MS runs / experiment)
RefSeq-Hs-7/2013: 31,852
11,113,249 Spectra 355,654 Peptides 15,402 Proteins (43% of total) (0.43% FDR)
3,330 Variants Matched
196 Splice Junctions Matched
14,662,911 Leftover Spectra
• Concatenated FASTA files, 105 patients • Removed redundant entries
> Canonical – Variant Patient 1 SIGNALINGPATHWAHREGULATOR >Canonical Protein – Variant Patient 2 SIKNALINGPATHWAYREGULATOR
Variants: 132,769
> Canonical – Alternate splice Patient 1 SIGNALINGREGULATOR >Canonical – Alternate splice Patient 2 SIGNALINGPATHREGULATOR
Alternative Splices: 68,434
Concatenated: 420,114
> Canonical – Truncation Patient 1 SIGNALINGPATFRAMESHIF >Canonical – Novel Exon Insert Patient 2 SIGNALINGPATHWAYINSERTREGULATOR >Canonical – Partial Exon Deletion Patient 3 SIGNALINGPATHWAYULATOR
Frameshifts: 187,059
476 Truncations Matched
12 Insertions Matched
68 Deletions Matched
Low confidence thresholds for Genome Transcriptome calls • Variants: >2 QUAL score (phred-scaled) • Alternative splices, frameshifts: >1 read
High confidence for Proteome IDs • <0.1% FDR peptide spectrum match

Karl Clauser
Proteomics and Biomarker Discovery
Acknowledgements
50
Broad Institute Proteomics Platform Group – Steve Carr
Agilent Technologies Inc.
Joe Roark
Chris Miller
http://www.chem.agilent.com/en-US/Products-Services/Software-Informatics/Spectrum-Mill/pages/default.aspx