spectropolarimetry of the luminous narrow-line seyfert
TRANSCRIPT

(Accepted for Publication in the June 10, 1999 Astrophysical Journal)
Spectropolarimetry of the Luminous Narrow-Line Seyfert
Galaxies IRAS 20181–2244 and IRAS 13224–3809
Laura E. Kay1,2
Dept. of Physics and Astronomy, Barnard College, Columbia University, NY NY 10027
and
A. M. Magalhaes1,4, F. Elizalde3,4 and C. Rodrigues3
Instituto Astronomico e Geofisico, Universidade de Sao Paulo, Caixa Postal 3386, Sao
Paulo, SP 01060-970, Brazil
ABSTRACT
We observed the narrow-line Seyfert 1 galaxies IRAS 20181–2244 and
IRAS 13324–3809 with a new spectropolarimeter on the RC spectrograph at the
CTIO 4m telescope. Previously it had been suggested that IRAS 20181–2244
was a Type 2 QSO and thus might contain an obscured broad-line region which
could be detected by the presence of broad Balmer lines in the polarized flux.
We found the object to be polarized at about 2%, and constant with wavelength,
(unlike most narrow-line Seyfert 1s), but with no evidence of broad Balmer
lines in polarized flux. The spectropolarimetry indicates that the scattering
material is inside the BLR. IRAS 13224–3809, notable for its high variability in
X-ray and UV wavelengths, has a low polarization consistent with a Galactic
interstellar origin.
Subject headings: galaxies: individual (IRAS 20181–2244, IRAS 13224–3809) –
– galaxies: active–galaxies: Seyfert–polarization
1Visiting Astronomer, Cerro Tololo Inter-American Observatory. CTIO is operated by AURA, Inc. undercontract to the National Science Foundation.
2NSF International Research Fellow, IAG–USP
3Present Address: INPE-DAS, Caixa Postal 515, Sao Jose dos Campos, SP 12201-970, Brazil
4Visiting Astronomer, CNPq/Laboratorio Nacional de Astrofisica.
brought to you by COREView metadata, citation and similar papers at core.ac.uk
provided by CERN Document Server
– 2 –
1. Introduction
IRAS 20181–2244 and IRAS 13224–3809 are part of the Boller et al. (1992) sample of
bright IRAS galaxies which were also identified as soft X-ray sources by ROSAT. Elizalde
& Steiner (1994) reported that IRAS 20181–2244 has a Seyfert 2 type spectrum and an
absolute magnitude bright enough to be called a QSO, and suggested that it qualifies as
one of the elusive Type 2 (narrow-line) QSOs.
Previous studies have shown that some Type 2 Active Galactic Nuclei (AGN), with
narrow permitted and forbidden emission lines, have obscured broad-line regions (BLR)
that are visible only in reflected and scattered – and thus polarized – light. Thus the
polarized flux of these obscured Type 2 objects have broad Balmer lines, i.e., they look like
the total flux of a Type 1 object with broad permitted and narrow forbidden lines. This has
been seen for about 12 ‘classical’ Seyfert 2 galaxies, some narrow-line radio galaxies, and
about half a dozen narrow-line Ultraluminous IRAS galaxies with luminosities comparable
to those of QSOs. (e.g. Antonucci & Miller 1985; Miller & Goodrich 1990; Kay et al. 1992;
Tran et al. 1995; Young et al. 1996; Heisler et al. 1997; Kay & Moran 1998). In QSOs, the
AGN with the highest luminosities, only the Type 1 broad–line objects normally are seen.
If QSOs are to fit into these ‘unified models’ of AGN, we should be observing some of them
too at an orientation in which the BLR is obscured, so that they appear as very luminous
objects with only narrow emission lines in their spectra.
There have been numerous transitory claims of observations of such Type 2 QSOs,
especially in X-ray identified targets, usually because their optical spectra were of low
signal-to-noise or because they didn’t include the Hα spectral region. Indeed, in their
optical survey of the northern Boller et al. (1992) sample, Moran, Halpern, & Helfand
(1996) reclassified IRAS 20181–2244 as a ‘narrow-line Seyfert 1 (NLS1)’. These Seyfert
galaxies were first identified by Phillips (1976) and Osterbrock & Pogge (1985), and are
sometimes called I Zw 1 objects after their prototype. These objects have narrow forbidden
and permitted lines, high ionization lines as in classical Seyfert 2s, strong permitted
narrow Fe II emission line complexes, and usually an [O III]λ5007 to Hβ flux ratio < 3. A
comprehensive analysis of their 1994 optical spectra of IRAS 20181–2244 confirmed their
initial reclassification (Halpern & Moran 1998). NLS1 often are highly represented in soft
X-ray selected samples (Stephens 1987; Moran et al. 1996) and thus this classification is
not surprising.
We observed IRAS 20181–2244 (z=0.185) in order to look for a possible obscured
BLR, as indicated by broad Hα and Hβ emission lines in polarized flux and to see how its
polarization properties compared with other similar targets. We present spectropolarimetry
of this AGN, taken at the CTIO 4m with a visitor polarimetry unit on the RC Spectrograph,

– 3 –
and imaging polarimetry from the Laboratorio Nacional de Astrofisca (LNA) 1.6m telescope
in Brasopolis. Another narrow-line Seyfert 1 galaxy, IRAS 13224–3809 (z=0.067), was also
observed with spectropolarimetry.
2. Observations and Data Reduction
2.1. Spectropolarimetry
These observations took place during the first test run of the CTIO spectropolarimeter
on May 23, 1995. We used the RC Spectrograph at the CTIO 4m telescope, with a Loral 3k
CCD, a KPGL3 grating with a dispersion of 1.2 A/pixel, a spectral resolution of 4A, and
a wavelength range of 4445-8150A. Additional optics were placed into the spectrograph in
order to conduct the polarimetry observations. A rotatable superachromatic half waveplate
(Frecker & Serkowski 1974) with 19 mm clear aperture (manufactured by Halle in Germany)
was installed 63 mm above the slit. The waveplate was rotated in 22.5◦ steps with an
external controller built at the University of Wisconsin. Miller, Robinson, & Goodrich
(1988) discuss the advantages of a dual-beam instrument for spectropolarimetry. For a
beamsplitting device we used a 44 mm diameter square double calcite block (Savart plate,
built at Optoeletronica, Sao Paulo), mounted 78 mm below the slit. Each component
prism was cut with its optical axis at 45◦ to their faces and they were cemented with their
optical axis crossed. This arrangement minimizes the astigmatism and color which are
present when a single calcite block is used (Serkowski 1974). This beamsplitter produces
two spectra of the given object, separated by 1 mm and with orthogonal polarizations. A
comb dekker used for observations had a series of parallel slots each about 1 mm wide. This
system is more similar to the spectropolarimeter on the ISIS spectrograph at the WHT
(Tinbergen & Rutten 1992) than to the instruments recently constructed in the U.S. (e.g.
Goodrich 1991). An advantage of using a Savart plate is that the focus of the two beams is
consistent, a disadvantage is that the length of the slit with the comb dekker is short.
We tested the instrumental polarization by observing the published null standard stars
HD 100623 and HD 98161 at all 16 positions of the waveplate. Even though images at only
4 consecutive positions of the waveplate (e.g. 0◦ through 67.5◦) are needed for a polarization
measurement, observations at all available positions allows the overall performance of the
polarimeter, in particular the residuals at each position angle, to be inspected. The linear
polarization P measured for these objects was 0.03% or less. Polarization standard stars
HD 298383, HD 187929, HD 110984, and HD 155197 were also observed, and found to agree
with published V band values (Turnshek et al. 1990). The polarizance (the instrumental
response to 100% polarized light) was found to be 98%. The zero point of the position
– 4 –
angle correction curve, which depends on the position of the fast axis of the waveplate and
the orientation of the beamsplitter, was obtained by comparing the measured polarization
position angles of the standard stars with the published values. Spectropolarimetry
data reduction and analysis were performed with the VISTA software package originally
developed at Lick Observatory, and additional routines.
IRAS 20181–2244 was observed for 15 minutes in each of 8 waveplate positions,
(0◦ through 67.5◦ and 180◦ through 247.5◦) for a total of 16 spectra in two hours.
IRAS 13224–3809 was observed for 15 minutes in each of 4 waveplate positions for a total of
8 spectra in 1 hour. Data were reduced following Miller et al. (1988), and all summing and
averaging was done with the Stokes parameters Q and U . The averaged Q and U Stokes
parameter spectra were used to create the the observed polarizations presented in Table 1.
2.2. Imaging Polarimetry Observations
IRAS 20181–2244 was observed with a CCD imaging polarimeter (Magalhaes et al.
1996) at the 1.6m telescope at the LNA on September 1, 1994. This data is important
to serve as a check on the spectropolarimetry measurements with a new system and to
provide field stars for estimating the Galactic foreground polarization. The polarimeter is
a modification of the Observatory’s direct CCD camera to allow for high precision imaging
polarimetry. The first element in the beam is a rotatable, achromatic half–wave retarder
followed by a Savart plate from the Instituto Astronomico e Geofisico, USP. This Savart
plate was built similarly to the one used at CTIO. This gives us two images of each object
in the field, separated by 1 mm (corresponding to about 13′′ at the telescope focal plane)
and with orthogonal polarizations. One polarization modulation cycle is covered for every
90◦ rotation of the waveplate. The simultaneous observations of the two beams allows
observing under non-photometric conditions at the same time that the sky polarization is
practically cancelled (Magalhaes et al. 1996).
CCD exposures were taken through the V filter with the waveplate rotated through 12
positions 22.5◦ apart. The exposure time at each position was 900s. After bias and flatfield
corrections, photometry was performed on the images of objects in the field with IRAF,
and then a special purpose FORTRAN routine processed these data files and calculated
the normalized linear polarization from a least squares solution. This yields the Stokes
parameters Q and U as well as the theoretical (i.e., photon noise) and measurement errors.
The latter are obtained from the residuals of the observations at each waveplate position
angle (ψi) with regards to the expected cos 4ψi curve and are quoted in Table 2; they are
consistent with the photon noise errors (Magalhaes et al. 1984). The instrumental Q and

– 5 –
U values were converted to the equatorial system from standard star data obtained in the
same night. The instrumental polarization was measured to be less than 0.03%.
Figure 1 shows the field and identifies the objects. The separation between each pair
of images is 1 mm, or 12.9′′ at the 1.6m f/10 LNA telescope. The size of the field shown in
the image is 3.7’ × 5.6’. As noted in Moran et al. (1996), and shown in Fig. 1 of Halpern
& Moran (1998), IRAS 20181–2244 (obj. no. 1 in Fig. 1) is the extended object in the
center of the field; obj. no. 2 is the one incorrectly identified instead in Fig. 1 of Elizalde
& Steiner (1994). The imaging polarimetry includes data on targets angularly close to the
object of interest, thereby providing the means to estimate the interstellar polarization
towards a given direction.
Table 2 includes the polarization data for IRAS 20181–2244 and for six other objects
in the field. For each target, the table gives the percent polarization, its error and the
equatorial position angle. The polarization values in Table 2 have not been corrected for
statistical bias. IRAS 20181–2244 is more polarized than the other objects in the field,
at P = 1.70 ± 0.16% and position angle 126◦. The six field objects included in Table 2
were the ones that showed a (de-biased) polarization larger than 3 sigma. A weighted
average, performed on the Stokes parameters of the field objects, yields a polarization of
0.520± 0.059% at 20.2◦. The error of this estimate is entirely consistent with the average
value of the individual measurement errors in Table 2 divided by sqrt(6) (0.062%) as well
as with the variance obtained from the spread of the individual Q and U values. We
therefore take the average polarization value above as the Galactic foreground polarization
towards IRAS 20181–2244. These values were used to correct the spectropolarimetry Stokes
parameters Q and U .
3. Results
3.1. IRAS 20181–2244
Figure 2 shows part of our de-redshifted flux spectrum of IRAS 20181–2244.
Measurements and analysis of the Balmer and forbidden lines were recently presented in
Halpern & Moran (1998). We note that our higher S/N spectrum indicates broader wings
on the Balmer lines than were seen in the spectrum of Elizalde & Steiner (1994), and the
Fe II emission line complexes discussed in Halpern & Moran (1998) are seen at 4500–4680A
and 5105–5395A. Thus we concur with the classification of this object by the latter as a
narrow-line Seyfert 1.
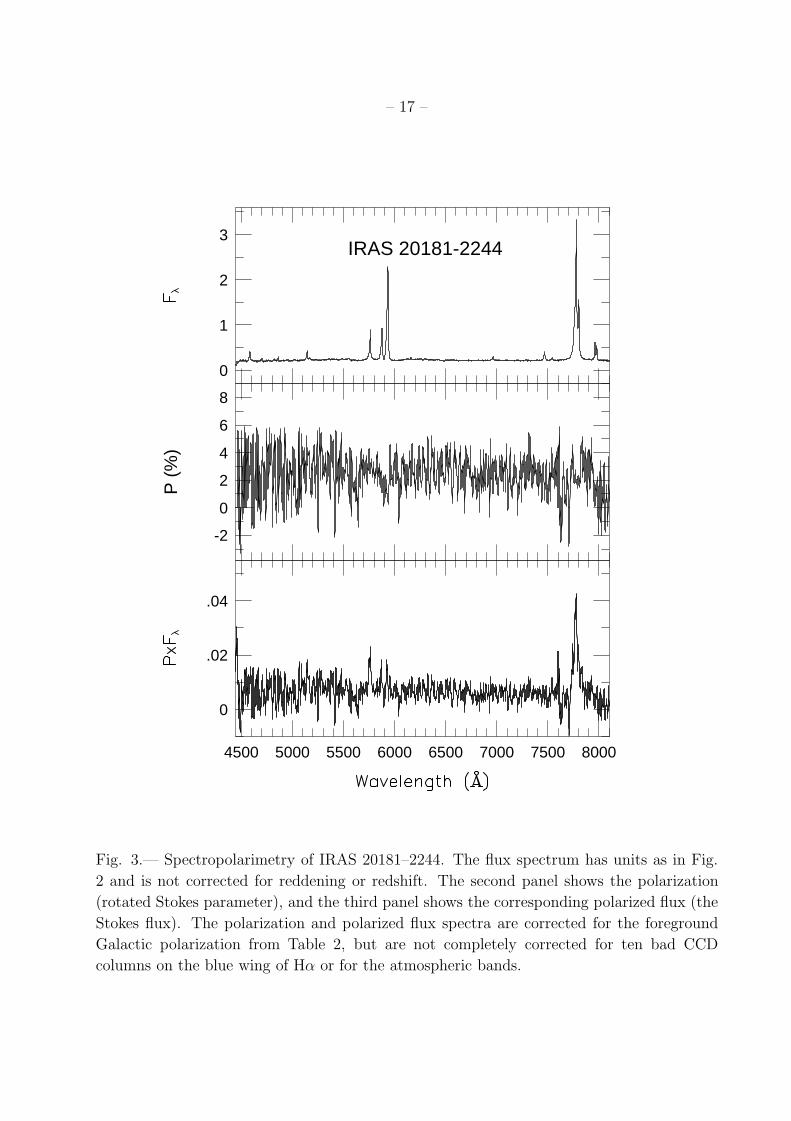
Figure 3 shows our spectropolarimetric observations of IRAS 20181–2244. The

– 6 –
panels indicate the direct flux spectrum, the polarization (strictly the rotated Stokes
parameter RSP , obtained from rotating the Stokes Q,U by the average position angle
θ: RSP = Qcos2θ + Usin2θ), the position angle of polarization, and the corresponding
polarized flux (Stokes flux = RSP×Flux). The polarization spectrum uncorrected for
Galactic interstellar polarization shows an average P for λλ5000 − 6000A of about
1.72 ± 0.07%, at a position angle of 130 ± 1◦, in excellent agreement with the imaging
polarimetry measurement. When corrected for the Galactic interstellar polarization value
in Table 2, we find P of about 2.3± 0.09% at θ = 127◦. The interstellar correction did not
alter the original spectral shapes of the data in Figure 3. We have not corrected for starlight
dilution of the polarization because we see no stellar absorption lines in the spectrum.
P is generally constant with wavelength, and does not show the rise to the blue
indicative of dust reflection as seen in the polarized narrow-line Seyfert 1s of Goodrich
(1989). P may drop lower to near zero at the positions of the forbidden lines of [O III]suggesting these lines come from a spatially different nuclear region than Hα and Hβ.
The position angle of polarization is constant, except for a rotation across the [O III]lines, indicating perhaps a separate source of polarization (e.g. transmission through dust
grains in the host galaxy). IRAS 20181 is detected as an unresolved 25 mJy source in
the 20 cm NVSS survey (Condon et al. 1998). A higher resolution radio observation of
IRAS 20181–2244 with a good radio position angle is not yet available, thus we cannot
compare radio and polarization position angles to see if they are perpendicular as in most
Seyfert 2s (Antonucci 1983, Brindle et al. 1990), some NLS1s (Ulvestad et al. 1995) and
some Seyfert 1s (Goodrich & Miller 1994), or parallel as in most Seyfert 1s (Antonucci 1983,
Martel 1996). This comparison would be interesting as there is considerable discussion
as to whether NLS1s as a class are objects in which we are viewing the disk pole-on
(e. g. Osterbrock & Pogge 1985, Puchnarewicz et al. 1992, Ulvestad et al. 1995). The
relatively high P value we obtained would argue against this although it may be produced
by scatterers symmetrically distributed around the central source.
In the plot of the polarized flux, which shows the spectrum of the polarized light from
the object, Hβ and Hα are visible, but the data is too noisy to measure an Hα/Hβ ratio
accurately. The slope of the continua in the direct and polarized flux spectra are both
nearly flat. Figure 4 shows the Hβ line profile in flux (dark line) and polarized flux. The
FWHM of Hβ in both direct and polarized flux is about 600 km/sec. Direct flux and
polarized flux Hα also have a similar FWHM. The lines are not shifted in the polarized flux
with respect to the direct flux. Thus the Balmer lines do not appear to be significantly
broader in the polarized flux as we might expect if an obscured BLR was present and visible
only in dust scattered or electron scattered - and thus polarized - light.

– 7 –
3.2. IRAS 13224–3809
The optical spectrum of the NLS1 IRAS 13224–3809 is discussed in Boller et al. (1993),
who present line measurements, including the strong Fe II lines, and an Hα to Hβ ratio of
7.6. Figure 5 shows our spectropolarimetric observations of IRAS 13224–3809. The panels
indicate the direct flux spectrum, and the Q and U Stokes parameters. The averaged P
is ∼0.38% at position angle 84◦. We do not have imaging polarimetry of the field around
IRAS 13224–3809, but given that it has a galactic latitude of +24◦, it would seem likely
that some of this is attributable to Galactic interstellar polarization.
Mathewson & Ford (1970) include measurements of four stars (HD 114981, HD 116413,
HD 117440, and HD 117597), which are within 3◦ of IRAS 13224–3809 in the sky. The
polarizations and position angles of the polarization vary from 0.14 - 0.20% at 20.3◦- 67.0◦,with the closest of these, HD 117597, 1.66◦ away in the sky, having the highest values. These
stars are not all that close to the target, but it suggests that perhaps at least 0.2% of the
measured polarization originates in the Galaxy. The Galactic E(B-V) has been estimated
from the distributed IRAS maps of Schlegal et al. (1998) as 0.12 mag. A similar estimate
comes from using the Stark et al. (1992) neutral hydrogen column density NH = 7.3× 10²⁰
cm−2. Using Pmax ≤ 0.09 E(B-V) (Serkowski, Mathewson, & Ford 1975), this suggests a
maximum polarization from our Galaxy of 1.08%. However the high Hα to Hβ ratio in
IRAS 13224–3809 could indicate reddening and a possible dust transmission polarization
component within the host galaxy.
4. Discussion
4.1. Continuum polarization
Many Seyfert 1 galaxies have a continuum polarization rising to the blue (e.g. Goodrich
& Miller 1994; Martel 1996). Dust scattering is the most commonly suggested mechanism
for this polarization, as the scattering cross section of small dust grains increases slowly
towards shorter wavelengths. With the addition of redder nuclear light, the observed
increase in polarization towards the blue steepens. The polarization of the NLS1 galaxies
discussed in Goodrich (1989), as well as Mrk 486 (Smith et al. 1997) and IRAS 17020+4544
(Leighly et al. 1997) are attributed to dust scattering.
In general, polarized synchrotron radiation is insufficient to explain the observations
because at least some of the lines are observed to be polarized. Polarization from dust
transmission in our Galaxy or the host galaxy is nearly constant over 4000-7000A,

– 8 –
but with a peak that corresponds to the grain size and a decrease toward smaller and
larger wavelengths. The polarized flux would appear reddened (Goodrich 1989). Electron
scattering will preserve the shape of the scattered spectrum, except possibly for a broadening
of the Balmer lines in the polarized flux (unless the electrons are cool; even a relatively
low electron temperature of 5000 K would broaden the line by 900 km sec−1, which would
be noticeable in Figure 4). However electron scattering combined with an unpolarized
reddened nuclear light or redder starlight can also yield a continuum polarization which
rises to the blue.
For example, Wills et al. (1992) observed IRAS 13349+2438, a luminous QSO with
properties similar to a NLS1, and concluded that the wavelength dependence of its high
polarization which rises to the blue is attributable to electron scattering, as well as to
a dilution of the polarization by direct, unpolarized light from the reddened continuum.
Smith et al. (1997) observed I Zw 1 with ground-based and HST spectropolarimetry, and
found that the optical polarization was low but possibly time variable. They concluded
that the wavelength dependence of the polarization of I Zw 1 is largely due to starlight
from the host galaxy. When a correction was made for this, the continuum polarization
became almost independent of wavelength from the UV to the red, and thus is likely due
to scattering by electrons. This example indicates that unpolarized starlight can affect the
polarization measurements even in a NLS1, and that it is possible that the polarization
may change in some of these objects.
In our data of IRAS 20181–2244, the continuum polarization is nearly constant with
wavelength (although the data do not go as far to the blue as in the objects discussed
above). As noted by Goodrich (1989), it is difficult to estimate the starlight contribution
to the direct flux spectrum because the Fe II emission lines contaminate the Mg I b and G
band stellar features. (Smith et al. 1997 derived a host galaxy spectrum for I Zw 1 using
the total H magnitude of the host galaxy to estimate a galaxy fraction of 0.5 at 5500A,
an unusually high starlight correction for a high luminosity Seyfert 1). We do not make a
correction for starlight in the spectrum of IRAS 20181–2244, and thus find that it may have
a similar continuum polarization to I Zw 1, due to electron scattering with a possible dust
transmission component. Dust scattering seems less likely because the reddened continuum
would steepen the rise towards the blue.
The polarization of IRAS 13224–3809 measured in our single set of observations is low
enough to be consistent with a Galactic interstellar origin. Low polarization of NLS1s is
not unusual; Goodrich (1989) found 11/17 of his NLS1s to be polarized at a level consistent
with interstellar polarization from our Galaxy. Grupe et al. (1998) observed a sample of
43 bright soft X-ray selected (ROSAT) AGN, half of which were NLS1s, and found that

– 9 –
only two NLS1 were polarized (IRAS 13349+2438 again and IRAS F12397+3333). Another
X-ray NLS1 galaxy with a similar spectrum to IRAS 13224–3809 which was found to be
unpolarized (i.e., less than 0.4%) is RE J1034+396 (Puchnarewicz et al. 1995, Breeveld
& Puchnarewicz 1998). The authors suggest this could be due to geometrical effects
(symmetric distribution of scatterers so that the polarization vectors cancel out, e. g. as
in a pole on view), dilution of the polarization as proposed for IRAS 13349+2438 (Wills
et al. 1992), or the absence of aligned dust grains in the line of sight. However, Boller et
al. (1997) propose that an edge-on model, with a highly inclined inner accretion disk, can
explain the strong X-ray variability and the soft X-ray excess of IRAS 13224–3809.
4.2. Location of the polarizing material
In the other polarized NLS1s (e.g. Goodrich 1989, Leighly et al. 1997) it is also
generally found that the narrow forbidden lines are less polarized than the Balmer lines,
which can have a different polarization than the continuum. This suggests that the
scattering material responsible for the observed polarization is between the NLR and the
BLR. The position angle does not vary across the Balmer lines, thus the scatterers are not
likely within the BLR itself.
Recently Leighly et al. (1997) investigated the connection between optical polarization
and the presence of warm absorber features in the X-ray spectra of a sample of Seyfert 1
galaxies. They showed that objects with optical polarizations greater than 1% are likely
to have warm absorbers, and suggested this indicates a link between the warm absorber,
reddened spectrum, and polarization. For example, the polarized NLS1 IRAS 17024+4544
contains a warm absorber as seen in the ASCA data (Leighly et al. 1997). Mrk 766, one
of the 3 polarized NLS1 galaxies in Goodrich (1989) also has a warm absorber (Leighly et
al. 1996). The ASCA X-ray spectrum of IRAS 20181–2244 has a neutral column density of
NH = 1.6 × 1021cm−2 (Halpern & Moran 1998). Re-analysis shows that there is marginal
evidence for a warm absorber (at the 95% confidence level; Leighly 1998). If the polarization
indeed occurs inside the NLR, this suggests that the absorbing material is within that
region as well, perhaps in the molecular torus as has been suggested for Seyfert 2 galaxies.
If this obscuration is inside the AGN, then it would affect Hβ but not [O III], which can
explain why the [O III]λ5007/Hβ ratio of 3.4 is higher in IRAS 20181–2244 compared to
other NLS1s (Halpern & Moran 1998). Goodrich (1989) also showed that the three NLS1
galaxies in his sample with P ≥ 1% have high [O III]λ5007/Hβ ratios.

– 10 –
5. Summary
IRAS 20181–2244 is a luminous optical and X-ray source. The presence of Fe IIemission lines in our spectrum confirms the Halpern & Moran (1998) conclusion that it
is a luminous narrow-line Seyfert 1 rather than a Type 2 QSO. Imaging polarimetry and
spectropolarimetry measurements indicate it is polarized at about 2.3± 0.09% at θ = 127◦
after a correction for interstellar polarization in our Galaxy. P and θ are constant with
wavelength, which is similar to I Zw 1 but isn’t common for a NLS1, which more often show
P rising to the blue, probably indicative of dust reflection. Spectropolarimetry indicates
that the scattering material is inside the BLR. The Balmer lines are visible in the polarized
flux, but do not show evidence of an obscured Broad Line Region, consistent with the object
not being a Type 2 QSO. Although several other X-ray selected targets have not survived
their designation as Type 2 QSOs (e.g. Forster & Halpern 1996; Halpern, Eracleous, &
Forster 1998), ASCA detections are being made of some of the ultraluminous IRAS galaxies
which have QSO luminosities, broad Balmer lines in polarized flux (or broad Paschen lines
in the infrared) and can be labelled Type 2 QSOs (Brandt et al. 1997, Ogasaka et al. 1997).
IRAS 13224–3809 is a well studied X-ray source and is unusual for its variability at
X-ray and UV wavelengths. Our single measurement suggests it is not polarized above what
is consistent with a Galactic interstellar polarization. In view of the results of Smith et al.
(1997) on the polarization variability of I Zw 1, polarimetric monitoring of these objects,
especially IRAS 20181–2244, could be informative.
We thank the staff at CTIO, especially Steve Heathcote, for assistance in the
spectropolarimetry tests. We acknowledge Dr. Art Code, Don Bucholz, Don Hoffman,
and Steve Polishinski, University of Wisconsin, for assistance with building the CTIO
waveplate module hardware. L. E. K. thanks CTIO and IAG–USP for their hospitality
during extended visits, and acknowledges support from the Research Corporation, NSF
International Research Fellowship INT-9423970, and NSF CAREER grant. AST-9501835.
A. M. M. acknowledges support for polarimetry at USP from the Sao Paulo FAPESP grants
92/3345-0, 94/0033-3, and 97/11299-2 and from CNPq.
– 11 –
REFERENCES
Antonucci, R. R. J. 1983, Nature, 303, 158
Antonucci, R. R. J., & Miller, J. S. 1985, ApJ, 297, 621
Boller, T., Meurs, E. J. A., Brinkman, W., Fink, H., Zimmerman, U., & Adorf, H. M. 1992,
A&A, 262, 57
Boller, T., Trumper, J., Molendi, S., Fink, H., Schaeidt, S., Caulet, A., & Dennefeld, M.
1993, A&A, 279, 53
Boller, T., Brandt, W. N., Fabian, A. C., & Fink, H. H. 1997, MNRAS, 289, 393
Brandt, W. N., Fabian, A. C., Takashashi, K., Fujimoto, R., Yamashita, A., Inoue, H., &
Ogasaka, Y. 1997, MNRAS, 290, 617
Breeveld, A. A., & Puchnarewicz, E. M. 1998, MNRAS, 295, 568
Condon, J. J., Cotton, W. D., Greisen, E. W., Yin, Q. F., Perley, R. A., Taylor, G. B., &
Broderick, J. J. 1998, AJ, 115, 1693
Elizalde, F., & Steiner, J. E. 1994, MNRAS, 268, L47
Forster, K. & Halpern, J. P. 1996, ApJ, 468, 565
Frecker, J. & Serkowski, K. 1974, Applied Optics, 15, 605
Goodrich, R. W. 1989. ApJ, 342, 224
Goodrich, R. W. 1991. PASP, 103, 1314
Goodrich, R. W. & Miller, J. S. 1994, ApJ, 434, 82
Grupe, D., Wills, B. J., Wills, D., & Beuermann, K. 1998, A&A, 333, 827
Halpern, J. P. & Moran, E. C. 1998, ApJ, 494, 194
Halpern, J. P., Eracleous, M., & Forster, K. 1998, ApJ, 501, 103
Kay, L. E. & Moran, E. C. 1998, PASP, 110, 1003
Kay, L. E., Antonucci, R., & Coleman, P. 1992, BAAS, 24, 1173
Leighly, K. M. 1998, in prep.
Leighly, K. M., Kay, L. E., Wills, B. J., Wills, D., & Grupe, D. 1997, ApJ, 489. L137
Leighly, K. M., Mushotzky, R. F., Yaqoob, T., Kuneida, H., & Edelson, R. 1996, ApJ, 469,
147
Magalhaes, A. M., Benedetti, E., & Roland, E. 1984, PASP, 96, 384

– 12 –
Magalhaes, A. M., Rodrigues, C. V., Margoniner, V. E., Pereyra, A., & Heathcote, S. 1996,
Polarimetry of the Interstellar Medium, ed. D. C. B. Whittet & W. Roberge (San
Francisco: ASP), p.118
Martel, A. 1996, PhD Thesis, U. C. Santa Cruz
Mathewson, D. S. & Ford, V. L. 1970, MmRAS, 74, 139
Miller, J. S., Robinson, L. B., & Goodrich, R. W. 1988, in Instrumentation for Ground–Based
Astronomy, ed. L.B. Robinson (New York: Springer Verlag), p.157
Miller, J. S., & Goodrich, R. W. 1990, ApJ, 355, 456
Moran, E. C., Helfand, D. J., & Halpern, J. 1996, ApJS, 106, 341
Ogasaka, Y., Inoue, H., Brandt, W. N., Fabian, A. C., Kii, T., Nakagawa, T., Fujimoto, R.
& Otani, C. 1997, PASJ, 49, 179
Osterbrock, D. E., & Pogge, R. W. 1985, ApJ, 297, 166
Phillips, M. M. 1976, ApJ, 208, 37
Puchnarewicz, E. M., Mason, K. O., Siemiginowska, A., & Pounds, K. A. 1995, MNRAS,
276, 20
Puchnarewicz, E. M., Mason, K. O., Cordova, F. A., Kartje, J., Branduardi-Raymont, G.,
Mittaz, J. P. D., Murdin, P. G. & Aliington-Smith, J. 1992, MNRAS, 256, 589
Schlegel, D. J., Finkbeiner, D. P., & Davis, M. 1998, ApJ, 500, 525
Serkowski, K. 1974, in Methods of Experimental Physics, vol. 12, part A, eds. M. L. Meeks
& N. P. Carleton (New York: Academic Press), p.361
Serkowski, K., Mathewson, D. S. & Ford, V. L. 1975, ApJ, 196, 261
Smith, P., Schmidt, G. D., Allen, R. G., & Hines, D. 1997, ApJ, 488, 202
Stark, A. A., Gammie, C. F., Wilson, R. W., Bally, J. Linke, R. A., Heiles, C., & Hurwitz,
M. 1992, ApJS, 79, 77
Stephens, S. A. 1989, AJ, 97, 10
Tinbergen, J. & Rutten, R. 1992, A Users Guide to WHT Spectropolarimetry
Tran, H., Cohen, M., & Goodrich, R. 1995, AJ, 110, 2597
Turnshek, D. A., Bohlin, R. C., Williamson II, R. L., Lupie, O. L., Koornneef, J., &
Morgan, D. H. AJ, 99, 1243
Ulvestad, J. S, Antonucci, R. R. J, & Goodrich, R. W. 1995, AJ, 109, 81
Young, S., Hough, J. H., Efstathiou, A., Wills, B. J, Bailey, J. A., Ward, M. J., & Axon,
D.J. 1996, MNRAS, 281, 1206

– 13 –
Wills, B. J., Wills, D., Evans, N. J., Natta, A., Thompson, K. L., Breger, & M., Sitko, M.
L. 1992, ApJ, 409, 96
This preprint was prepared with the AAS LATEX macros v4.0.

– 14 –
Table 1. CTIO Spectropolarimetry Observations
Object Date Exp P σP θ
(UT) (min) % % (deg)
IRAS 20181–2244 1995 May 23 120 1.86 0.07 131 ±1
IRAS 13224–3809 1995 May 23 60 0.38 0.03 84 ±2
Table 2. Imaging Polarization Data for IRAS 20181–2244 and field stars
Object P σP θ
(%) (%) (deg)
IRAS 20181–2244 1.701 0.162 126.4
Field Stars:
2 0.487 0.126 12.1
3 0.478 0.119 22.4
4 0.803 0.206 25.1
5 0.468 0.124 24.8
6 0.596 0.177 16.6
7 0.561 0.169 20.0
Weighted Avg 0.520 0.059 20.2

– 15 –
Fig. 1.— Imaging polarimetry field for IRAS 20181–2244. Polarization data for the numbered
stars is given in Table 2.

– 16 –
4400 4600 4800 5000 5200 5400
.2
.3
.4
.5
.6
.7
.8
.9
Rel
ativ
e F
lux
IRAS 20181-2244
Fe II Fe II
Fig. 2.— Spectroscopy of IRAS 20181–2244, showing the Fe II lines. The spectrum is not
corrected for reddening. The flux is in units of 10−15 ergs s−1 cm−2 A−1.
– 17 –
0
1
2
3IRAS 20181-2244
-2
0
2
4
6
8
P (
%)
4500 5000 5500 6000 6500 7000 7500 8000
0
.02
.04
Fig. 3.— Spectropolarimetry of IRAS 20181–2244. The flux spectrum has units as in Fig.
2 and is not corrected for reddening or redshift. The second panel shows the polarization
(rotated Stokes parameter), and the third panel shows the corresponding polarized flux (the
Stokes flux). The polarization and polarized flux spectra are corrected for the foreground
Galactic polarization from Table 2, but are not completely corrected for ten bad CCD
columns on the blue wing of Hα or for the atmospheric bands.

– 18 –
5400 5500 5600 5700 5800 5900 6000 6100 6200
.01
.02
.03
IRAS 20181-2244
Fig. 4.— Comparison of Hβ in direct (bold line) and polarized flux for IRAS 20181–2244.

– 19 –
0
2
4 IRAS 13224-3809
-4
0
4
Q (
%)
4500 5000 5500 6000 6500 7000 7500 8000
-4
0
4
U (
%)
Fig. 5.— Spectropolarimetry of IRAS 13224–3809. From top to bottom, a flux spectrum as
in the other figures, and Stokes Q and U , since P is so low.