spectrogram
TRANSCRIPT
7/28/2019 Spectrogram
http://slidepdf.com/reader/full/spectrogram 1/21

7/28/2019 Spectrogram
http://slidepdf.com/reader/full/spectrogram 2/21
GoalsO Definition & application of
SPECTROGRAM and MULTIPATH
O How to build SPECTROGRAMO Characteristic of MULTIPATH
O How to simulate all of them using
MATLAB

7/28/2019 Spectrogram
http://slidepdf.com/reader/full/spectrogram 3/21
spectrum spectrogram

7/28/2019 Spectrogram
http://slidepdf.com/reader/full/spectrogram 4/21
O The horizontal axis represents time.
O The vertical axis is frequency
O A third dimension indicating the amplitude of a particular
frequency at a particular time is represented by the
intensity or colour of each point in the image.

7/28/2019 Spectrogram
http://slidepdf.com/reader/full/spectrogram 5/21
Short time fourier transform

7/28/2019 Spectrogram
http://slidepdf.com/reader/full/spectrogram 6/21
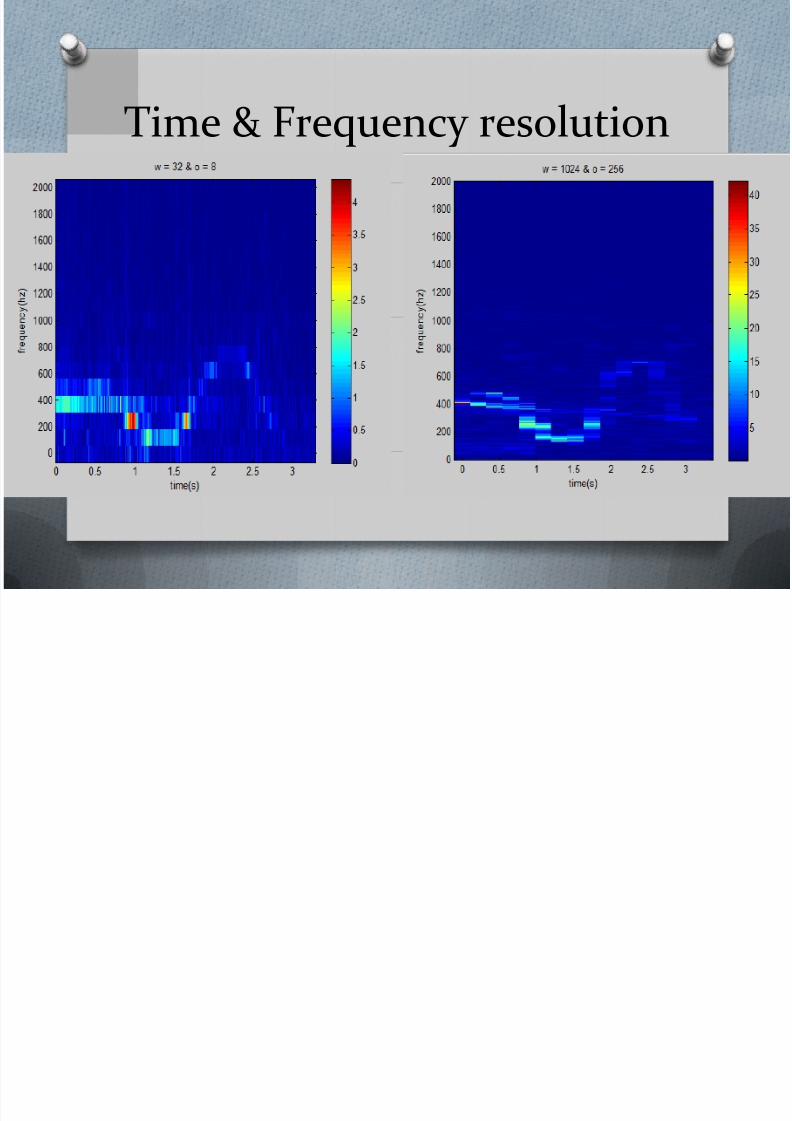
Window size’s effection O A wide window gives better frequency
resolution but poor time resolution.
O A narrower window gives good timeresolution but poor frequency resolution.
These are called narrowband and
wideband transforms, respectively.

7/28/2019 Spectrogram
http://slidepdf.com/reader/full/spectrogram 7/21
Build spectrogram
7/28/2019 Spectrogram
http://slidepdf.com/reader/full/spectrogram 8/21
SpectrogramsO Spectrograms can be used to identify
spoken words phonetically , and to
analyse the various calls of animals.O They are used extensively in the
development of the fields of music, sonar,
radar, and speech processing, seismology

7/28/2019 Spectrogram
http://slidepdf.com/reader/full/spectrogram 9/21
Simulation using Matlab
7/28/2019 Spectrogram
http://slidepdf.com/reader/full/spectrogram 10/21
Time & Frequency resolution
7/28/2019 Spectrogram
http://slidepdf.com/reader/full/spectrogram 11/21
Part 3: Multipath in the oceanO -What it Multipath?
- Multipath in the ocean
- Simulation multipath

7/28/2019 Spectrogram
http://slidepdf.com/reader/full/spectrogram 12/21
What is Multipath? O When the transmitter and receiver are at different
locations, the analog of echoes is that the receiver
hears the transmitter's signal, and then hears
echoes caused by the signal traveling different
(usually longer) paths. This is called multipath.

7/28/2019 Spectrogram
http://slidepdf.com/reader/full/spectrogram 13/21
What is Multipath? O Reflection Fadding
O Scaterring Noise
O Diffraction Distortion
Can be a challenging part of any remote-
sensing signal processing system,
including radar, ultrasound, and sonar.

7/28/2019 Spectrogram
http://slidepdf.com/reader/full/spectrogram 14/21
Multipath in the oceanThere may be many bounces of the signal of the seafloor and off the
ocean-air interface (and possibly off other whales or sunken ships,etc.)
Figure : A ship is shown with a sensor array descending from it, an object isdenoted in red (whale? dolphin? submarine?) and the object emits signal x(t),which under goes multipath. The total effect of the multipath is modeled as achannel with impulse response h(t). The ship sonar system receivesz(t)=x(t)*h(t). (Inpractice, the ship really receives z(t)=x(t)*h(t)+n(t), where n(t) issome extra noise.)

7/28/2019 Spectrogram
http://slidepdf.com/reader/full/spectrogram 15/21
Simulation multipathIf we call the line of sight signal x(t)
Then the signal that bounced, received T
seconds later, would be a*x(t-T)
a:(between 1 and -1) accounts for the
attenuation.

7/28/2019 Spectrogram
http://slidepdf.com/reader/full/spectrogram 16/21
Simulation multipath In MATLAB, we will represent this kind of continuous-time impulse response by sampling itwith sampling interval Ts. Then the delay timesT1..Tn are represented as multiples of thesampling interval, so for M samples:
O We need only specify the ak values for k=0...M(assuming we know Ts).
O
Ak will be 0 if there are no delay componentscorresponding to (k)Ts seconds.
O A0 will be 1 for the line of sight signal.

7/28/2019 Spectrogram
http://slidepdf.com/reader/full/spectrogram 17/21
Simulation multipath
Figure 5: This is an example of the impulseresponse for the multipath in a 50 meter water channel (for example, in a bay).

7/28/2019 Spectrogram
http://slidepdf.com/reader/full/spectrogram 18/21
Simulation using Matlab

7/28/2019 Spectrogram
http://slidepdf.com/reader/full/spectrogram 19/21
Time

7/28/2019 Spectrogram
http://slidepdf.com/reader/full/spectrogram 20/21
Spectrogram

7/28/2019 Spectrogram
http://slidepdf.com/reader/full/spectrogram 21/21