spectral observation chemistry and physics l. palchetti et al
TRANSCRIPT
ACPD7, 17741–17767, 2007
Spectral observationof the outgoing
longwave radiation
L. Palchetti et al.
Title Page
Abstract Introduction
Conclusions References
Tables Figures
J I
J I
Back Close
Full Screen / Esc
Printer-friendly Version
Interactive Discussion
EGU
Atmos. Chem. Phys. Discuss., 7, 17741–17767, 2007www.atmos-chem-phys-discuss.net/7/17741/2007/© Author(s) 2007. This work is licensedunder a Creative Commons License.
AtmosphericChemistry
and PhysicsDiscussions
Measurement of the water vapour verticalprofile and of the Earth’s outgoing farinfrared fluxL. Palchetti, G. Bianchini, B. Carli, U. Cortesi, and S. Del Bianco
Istituto di Fisica Applicata “Nello Carrara” – Consiglio Nazionale delle Ricerche IFAC–CNR,Sesto Fiorentino, Firenze, 50019, Italy
Received: 18 October 2007 – Accepted: 26 November 2007 – Published: 10 December 2007
Correspondence to: L. Palchetti ([email protected])
17741

ACPD7, 17741–17767, 2007
Spectral observationof the outgoing
longwave radiation
L. Palchetti et al.
Title Page
Abstract Introduction
Conclusions References
Tables Figures
J I
J I
Back Close
Full Screen / Esc
Printer-friendly Version
Interactive Discussion
EGU
Abstract
Our understanding of global warming depends on the accuracy with which the atmo-spheric components that modulate the Earth’s radiation budget are known. Many un-certainties still exist on the radiative effect of water in the different spectral regions,among which the far infrared where few observations have been made. An assess-5
ment is shown of the atmospheric outgoing flux obtained from a balloon-borne platformwith wideband spectrally resolved nadir measurements at the top-of-atmosphere overthe full spectral range, including the far infrared, from 100 to 1400 cm−1, made by aFourier transform spectrometer with uncooled detectors. From these measurements,we retrieve 15 pieces of information about water vapour and temperature profiles, and10
surface temperature, with a precision of 5% for the mean water vapour profile and a ma-jor improvement of the upper troposphere-lower stratosphere knowledge. The retrievedatmospheric state makes it possible to calculate the emitted radiance as a function ofthe zenith angle and to determine the outgoing radiation flux, proving that spectrallyresolved observations can be used to derive accurate information on the integrated15
flux. While the retrieved temperature is in good agreement with ECMWF analysis, theretrieved water vapour profile differs significantly, and, depending on time and location,the derived flux differs in the far infrared (0–600 cm−1) from that derived from ECMWFby 2–3.5 W/m2±0.4 W/m2. The observed discrepancy is larger than current estimatesof radiative forcing due to CO2 increases since pre-industrial time. The error with which20
the flux is determined is caused mainly by calibration uncertainties while detector noisehas a negligible effect, proving that uncooled detectors are adequate for top of the at-mosphere radiometry.
1 Introduction
Water is the principal molecule driving the climate on Earth since through the hydrologic25
cycle it is involved in all the phenomena from energy transport to radiative effects gov-
17742

ACPD7, 17741–17767, 2007
Spectral observationof the outgoing
longwave radiation
L. Palchetti et al.
Title Page
Abstract Introduction
Conclusions References
Tables Figures
J I
J I
Back Close
Full Screen / Esc
Printer-friendly Version
Interactive Discussion
EGU
erning the climate system (Pierrehumbert, 2002). The atmospheric water, in the formof both vapour and clouds, is the most important greenhouse components trappingthe outgoing longwave radiation (OLR) (Harries, 1996). Even if its main contributionto climate changes is through feedback processes occurring as a consequence of aman-induced temperature variation driven by the increased CO2 concentration, it has5
recently been found that also long term increases in stratospheric water vapour maybe considered to be in part a forcing term (Held and Soden, 2000). Changes in thedistribution of water vapour and the associated radiative forcing and feedback are wellrecognised as fundamental processes to be characterised in predicting future climate(Lindzen, 1990; Chahine, 1992; Harries, 1997; Stuber et al., 2005). 2007 IPCC report10
identifies the estimate of the strength of different feedbacks as a key uncertainty inglobal circulation model predictions (Randall et al., 2007).
Despite its prominent spectroscopic signatures in the OLR, the quantitative mea-surement of the water vapour volume mixing ratio (VMR) is made difficult by its vari-ability and its large vertical (and to a lesser extent horizontal) concentration gradients.15
Furthermore, also the spectroscopy of water vapour poses some problems. The highconcentration of this species in the lower troposphere makes relevant several spec-troscopic processes (self and foreign broadening, pressure shift, and continuum ab-sorption) (Tobin et al., 1999) that are difficult to observe in laboratory conditions andrequire a field validation. In this context, Sinha and Harries (1995) pointed out the lack20
of validation of far infrared (FIR) model line parameters of water vapour under atmo-spheric conditions and stressed that FIR parameterisation in climate models should bevalidated by observational programs.
The radiative balance of the troposphere is influenced strongly by radiative coolingassociated with the emission of FIR radiation by water vapour. The water vapour ro-25
tational band is extremely intense, especially at band centre around 200–300 cm−1,and so emits to space from the upper troposphere. Atmospheric fluxes calculations(Clough et al., 1992) have shown that perturbations to upper tropospheric water vapour(pressures of <500 hPa) exert a peak response in the FIR, and can have a sizeable im-
17743

ACPD7, 17741–17767, 2007
Spectral observationof the outgoing
longwave radiation
L. Palchetti et al.
Title Page
Abstract Introduction
Conclusions References
Tables Figures
J I
J I
Back Close
Full Screen / Esc
Printer-friendly Version
Interactive Discussion
EGU
pact on the clear-sky greenhouse effect.Water can manifest itself also in the form of cirrus clouds and cirrus cloud feed-
back is the major source of discrepancy between models of climate predictions. Theprevalence and persistence of cirrus cloud systems, especially in the tropical uppertroposphere, implies that cirrus clouds play an important role in climate (Liou, 1986).5
Radiative studies of cirrus clouds show that the clouds may cool radiatively or heat theupper atmosphere in the thermal infrared wavelengths depending upon height, thick-ness and microphysics of the particles (Cox, 1971; Stephens et al., 1990). Cirrusclouds have been recognised as important components of feedback processes to cli-mate forcings (Randall et al., 1989; Del Genio et al., 1996; Chou and Neelin, 1999).10
The OLR flux is strongly modulated by cirrus, nevertheless, the available operativesensors give no direct information on cloud microphysics and cirrus clouds represent amajor observational gap.
In this contest, in June 2005 we performed a new spectral measurement, describedin Sect. 2, covering the FIR portion of the Earth’s emission spectrum, from a strato-15
spheric balloon flown in tropical region in the North-East of Brazil. As described inSect. 3, this spectral measurement allows the retrieval of temperature and water vapourvertical profiles up to the upper troposphere level. A comparison of our results with theatmospheric status obtained from the ECMWF (European Centre for Medium-rangeWeather Forecast) analysis is shown in Sect. 4. In Sect. 5 the difference from ECMWF20
found on the water vapour concentration profile is used to address the effect on thecalculation of the outgoing longwave radiation flux at the flight altitude level.
2 Spectroscopic measurements of the outgoing longwave radiation
In June 2005 the first wideband spectrally resolved measurements including the FIRportion of the atmospheric thermal emission were performed from stratospheric bal-25
loon platform. Two experiments were flying almost at the same time, the FIRST(Far InfraRed Spectroscopy of the Troposphere) experiment flew from Fort Sumner
17744
ACPD7, 17741–17767, 2007
Spectral observationof the outgoing
longwave radiation
L. Palchetti et al.
Title Page
Abstract Introduction
Conclusions References
Tables Figures
J I
J I
Back Close
Full Screen / Esc
Printer-friendly Version
Interactive Discussion
EGU
(NM, USA) on 7 June, and the REFIR-PAD (Radiation Explorer in the Far InfraRed-Prototype for Applications and Development) experiment flew from Teresina (Brazil) on30 June. FIRST measurements were performed with a broad bandpass Fourier trans-form spectrometer (FTS) with Michelson configuration, covering the 50–2000 cm−1
spectral range, with 0.625 cm−1 resolution. The instrument is partially cooled: aft op-5
tics at 180 K, and detectors at 4.2 K. REFIR-PAD measurements were performed witha FTS with Mach-Zehnder configuration covering the 100–1400 cm−1 spectral rangewith 0.5 cm−1 resolution.
REFIR-PAD is a prototype developed as a field demonstrator of a satelliteinstrument designed in the framework of the European REFIR space mission10
(European-Commission, 2000; Rizzi et al., 2002). It is a compact and innovative FTSwith double-input/double-output port configuration designed for measuring with highaccuracy the wideband atmospheric emission without requiring any cooled compo-nents (Palchetti et al., 2005; Bianchini et al., 2006). This instrument is optimised asa small and light payload and uses uncooled optics and detectors. The capability of15
an uncooled instrument to provide information on the status of the atmosphere and itsradiative properties is assessed in the present paper.
REFIR-PAD acquired 540 nadir spectra of the atmospheric emission during a strato-spheric flight at the mean floating altitude of 34 km for about 8 h (Palchetti et al., 2006).The experiment was launched onboard a gondola that hosted the LPMAA IASI–balloon20
(Laboratoire de Physique Moleculaire pour l’Atmosphere et l’Astrophysique – InfraredAtmospheric Sounding Interferometer) instrument from the airfield of Timon, nearTeresina in the North-East Brazil (5◦5′ S, 42◦52′ W), at night at 03:36 local time, andlanded 10 h later at 270 km south-west of the launch site. This tropical flight was per-formed within the framework of the Equatorial Large Balloons Campaign (ELBC) led25
by the French Centre National d’Etudes Spatiales (CNES) in collaboration with theEuropean Space Agency (ESA), for the Envisat (Environmental Satellite) validationprogram.
A summary of the main instrument specifications including performances for this
17745

ACPD7, 17741–17767, 2007
Spectral observationof the outgoing
longwave radiation
L. Palchetti et al.
Title Page
Abstract Introduction
Conclusions References
Tables Figures
J I
J I
Back Close
Full Screen / Esc
Printer-friendly Version
Interactive Discussion
EGU
flight is reported in Table 1. An accurate characterisation of the level 1 analysis produc-ing calibrated spectra can be found in Bianchini and Palchetti (2007). The noise equiva-lent spectral radiance (NESR) turned out to be in the range of 0.8–2.5 mW/(m2 sr cm−1)with the lower values between 200 and 600 cm−1. The mean calibration error was about0.1 K with a peak-to-peak value of about ±0.3 K. The total radiometric error has been5
calculated as a function of frequency for each calibrated spectrum taking into accountboth the detector noise component and the systematic calibration errors.
3 Retrieval of water vapour and temperature vertical profiles
Nadir wideband spectral measurements have been used to retrieve the vertical pro-files of atmospheric temperature and water vapour concentration, and the surface10
(skin) brightness temperature (BT). Vertical profile of temperature is retrieved exploit-ing the carbon dioxide band at 668 cm−1. A trend corrected value of carbon dioxideof 378 ppmv is considered. The water vapour profile is retrieved exploiting both thevibro-rotational band and the FIR pure rotational band below 600 cm−1. The softwaredevoted to the analysis of REFIR-PAD measurements has been developed at IFAC.15
The main features of the retrieval code can be described by making reference to twomain blocks: the forward model and the inverse model.
3.1 Forward model
The forward model simulates REFIR-PAD wideband measurements using line-by-lineradiative transfer (RT) calculation. The code computes the radiance that reaches the20
instrument, and simulates the instrumental effects (instrumental lineshape and field ofview). Assuming a uniform layered atmosphere, the RT has been implemented us-ing the Curtis-Godson (Houghton, 2002) values associating a temperature and pres-sure equivalent value to each species in the layer in order to evaluate the averagedvalue of the cross-section. The atmospheric lineshapes are modelled with a modified25
17746

ACPD7, 17741–17767, 2007
Spectral observationof the outgoing
longwave radiation
L. Palchetti et al.
Title Page
Abstract Introduction
Conclusions References
Tables Figures
J I
J I
Back Close
Full Screen / Esc
Printer-friendly Version
Interactive Discussion
EGU
Voigt profile in which the Lorentz function is replaced with the Van Vleck-Weisskopf(Van Vleck and Weisskopf, 1945) function. The spectroscopic database used for thesimulations is HITRAN 2004 (Rothman et al., 2005) with recent updates for the airbroadened half widths provided by Gordon et al. (2007). The atmospheric continuumis modelled according to the work by Clough et al. (2005) considering the contribution5
of water vapour lines external to the region of ±25 cm−1 from the line centre. For CO2a dedicated database and lineshape has been adopted in order to take into accountthe line-mixing effect (Niro et al., 2005a,b).
3.2 Inversion
The retrieval procedure (Carli et al., 2007) uses the constrained Non-linear Least-10
Square Fit (NLSF) approach: the cost function to be minimised takes into account the apriori information (optimal estimation approach) and the Marquardt lambda parameter(Rodgers, 2000). The retrieval algorithm enables us to fit the wideband spectrum tofind more quantities simultaneously (multi-target retrieval) in order to best account forthe errors due to the interfering unknowns.15
REFIR-PAD measurements have been analysed by simultaneously fitting the watervapour profile, the temperature profile and the Earth skin BT using the spectrum from100 to 1000 cm−1. As a priori information, the IG2 database (Remedios, 1999) for anequatorial atmosphere in July 2005 has been used. The pressure profile at the altitudegrid provided by ECMWF database has been obtained by imposing the hydrostatic20
equilibrium with a pressure reference level at 1000 hPa. The a priori errors that havebeen used are 100% for water vapour profile and a linearly decreasing error from 9.8 Kat an altitude of 1 km to 2.3 K at an altitude of 33 km for the temperature profile. Theconvergence is established using the chi-square test. The final reduced chi-squareclose to one indicates the agreement between the forward model and measurements25
and the correctness of the estimated measurement noise. The correlations among theproducts are contained in the correlation matrix exported by the program.
In Fig. 1 and Fig. 2 an example of the retrieved profiles from the output provided by17747

ACPD7, 17741–17767, 2007
Spectral observationof the outgoing
longwave radiation
L. Palchetti et al.
Title Page
Abstract Introduction
Conclusions References
Tables Figures
J I
J I
Back Close
Full Screen / Esc
Printer-friendly Version
Interactive Discussion
EGU
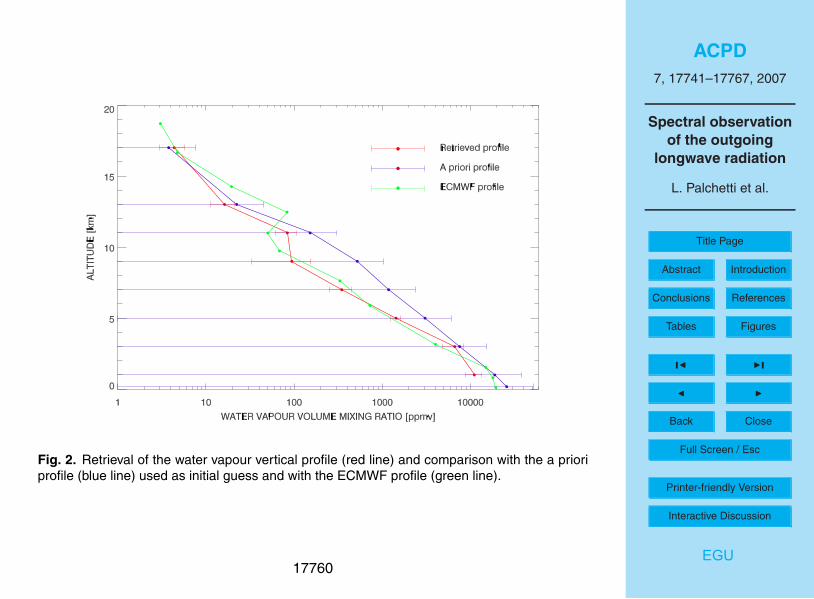
the analysis is given. The plots show the retrieved profiles (red lines) with the con-strained error together with the initial guess profile (blue lines) and the profile obtainedfrom the ECMWF operational analysis (green lines). The results show a good agree-ment with ECMWF for the temperature profile and for water vapour below 10 km alti-tude. Above 10 km, REFIR-PAD measurement found a drier atmosphere which alters5
the result of the calculation of the OLR flux, as it will shown in Sect. 5.The retrieval altitude grid has been optimised in order to maximise the total number
of independent retrieved unknowns and to better exploit the sounding capability of theREFIR-PAD instrument. The analysis of the averaging kernel profiles for temperatureand water vapour VMR, shown in Fig. 3 and Fig. 4 respectively, was used to select10
the vertical retrieval grid. The results shows that REFIR-PAD measurements provideinformation up to 33 km for temperature, and up to about 17 km for water vapour, witha vertical resolution of about 2 km for both quantities.
The degrees of freedom of the retrieval, i.e. the number of independent new piecesof information provided by the trace values of the averaging kernel matrix, are for atmo-15
spheric temperature, water vapour, and surface skin BT, 7, 7, and 1, respectively. Theinformation content coming from the FIR region improves the water vapour retrieval inthe upper troposphere relative to retrievals only performed in the rotovibrational band(Mertens, 2002).
3.3 Error budget20
The error analysis takes into account both the random measurement noise (NESR)due to the detector and the spectrally-correlated calibration uncertainty. In the case ofthe REFIR-PAD measurement, the NESR is due to the uncooled pyroelectric detectorsand, as we have seen in Sect. 2, it is in the range of 0.8–2.5 mW/(m2 sr cm−1). Alsothe measurement noise of the calibration spectra contributes to this error, which has25
no correlation among the different spectral channels. The second effect is insteadcalculated with 1σ-error corresponding to the peak error of 0.3 K in the knowledge ofthe calibration sources temperature and it is less than 1.2 mW/(m2 sr cm−1). This error
17748

ACPD7, 17741–17767, 2007
Spectral observationof the outgoing
longwave radiation
L. Palchetti et al.
Title Page
Abstract Introduction
Conclusions References
Tables Figures
J I
J I
Back Close
Full Screen / Esc
Printer-friendly Version
Interactive Discussion
EGU
is correlated among the different spectral channels. An in-deep analysis of these errorsand of their spectral features can be found in Bianchini and Palchetti (2007).
A full variance-covariance matrix of these errors is used to assess the error propa-gation in the retrieved atmospheric state. In such a way, an error of about 2 K constantat different altitudes is found for the temperature profile, and an error varying from 22%5
at ground to 35% at 17 km altitude for water vapour. These errors are shown by errorbars in Figs. 1 and 2. The skin BT is retrieved with an errore of about 0.4 K.
4 Data analysis: atmospheric state
Some thin scattered clouds were present at low altitude at the beginning of the flight,but apart a small effect observed soon after launch, the atmosphere resulted to be10
transparent enough to assume clear sky in our analysis. The vertical profiles of watervapour VMR and temperature, and the skin BT have been retrieved for each measure-ment sequence during the flight from 08:05 to 15:47 UTC. A mean spectrum is obtainedfor each sequence by a weighted average of 10 spectra acquired in about 6 min.
In order to check the validity of the vertical profiles of temperature and water vapour15
retrieved from REFIR-PAD measurements, we relied on correlative data obtained fromECMWF operational analysis. Vertical profiles of temperature and relative humidity(converted to water vapour VMR) for the region of Teresina, Brazil and for the durationof the balloon flight were obtained from the ECMWF data archive, with a spatial reso-lution of 1◦×1◦ in latitude and longitude and with a temporal resolution of 6 h. These20
profiles were linearly interpolated to the average geolocation and time of each REFIR-PAD sequence. The resulting temperature and water vapour distributions were usedfor validation purposes.
The REFIR-PAD profiles retrieved during the flight were compared with the ECMWFcorrelative data. The comparisons are shown in Fig. 5 for the temperature profiles and25
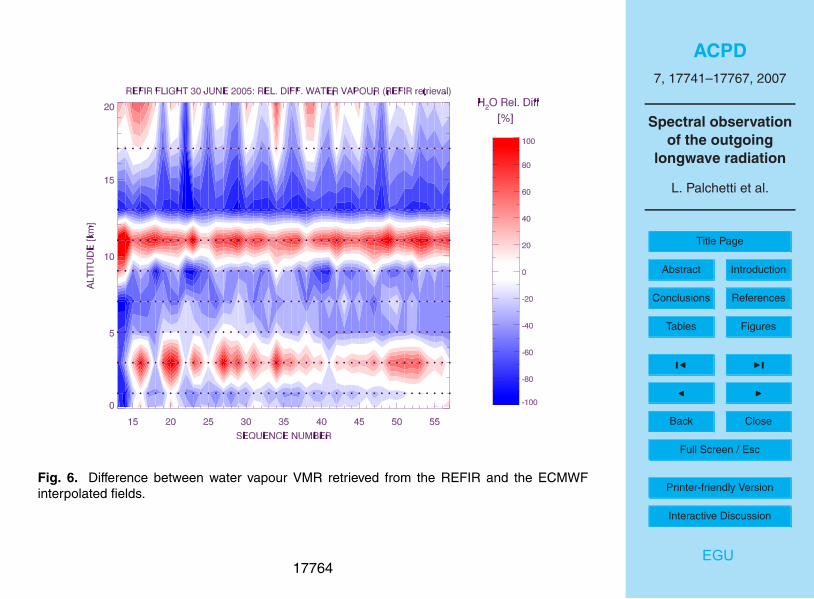
in Fig. 6 for the water vapour profiles. The differences for temperature are generally lowand in particularly they seldom exceed 2%. For the water vapour VMR, instead Fig. 6
17749

ACPD7, 17741–17767, 2007
Spectral observationof the outgoing
longwave radiation
L. Palchetti et al.
Title Page
Abstract Introduction
Conclusions References
Tables Figures
J I
J I
Back Close
Full Screen / Esc
Printer-friendly Version
Interactive Discussion
EGU
shows that the retrieved profiles are characterised by a drier upper troposphere, about60% less that the ECMWF VMR in in the region from 12 km to tropopause. The greaterdifferences observed at lower altitudes at the beginning of the flight are possibly due toa pixel contamination produced by the presence of clouds.
In Fig. 7, we report the mean values of the residuals of the fitting process, obtained5
by averaging over the duration of the flight the difference between the observed spec-tral radiance and its simulated values after last iteration (red line). The average of theresiduals is compared with the mean value over the flight of the measurement error,computed as the root mean square of the diagonal elements of the variance-covariancematrix of the observations. The residuals are generally well within the mean measure-10
ment error, with isolated exceptions that peak around 460 cm−1 and 590 cm−1, prov-ing that no significant unaccounted systematic error is present in the data analysis(Bianchini et al., 2007).
In Fig. 8, the time series of the temperature values at the retrieval altitudes aredisplayed for the lower troposphere. The ground skin BT increment due to the solar15
irradiation was detected starting from the sunrise occuring at sequence #19. A smallincrement of temperature is also observed in the first layer of the atmosphere.
Since the atmospheric state is sufficiently uniform in time and location along theflight, the retrieval standard error, described in Sect. 3.3, can be compared with thestandard deviation of all the measurements. The comparison shows a good agreement20
between the two sets of values for both temperature and water vapour. This allows toconsider the mean standard error of the mean measurement, which resulted to be lessthan 0.5 K for temperature mean profile, and about 3–5% for water vapour mean profile.
5 Data analysis: outgoing longwave radiation flux
The evaluation of the OLR by using directional non-spectral measurements, such25
as satellite single view observations, is affected by an error due to the angu-lar distribution model used for the calculation of the emission anisotropy factor
17750

ACPD7, 17741–17767, 2007
Spectral observationof the outgoing
longwave radiation
L. Palchetti et al.
Title Page
Abstract Introduction
Conclusions References
Tables Figures
J I
J I
Back Close
Full Screen / Esc
Printer-friendly Version
Interactive Discussion
EGU
in the radiance-to-flux conversion, see e.g. the ERBE and CERES experiments(Suttles et al., 1992; Wielicki et al., 1996). It was shown that statistical methods de-veloped for deriving the anisotropy factor for different viewing conditions are af-fected by an error of about 4.6 W/m2 for the best situation of nadir observations(Clerbaux et al., 2003).5
Our spectrally resolved measurement provides the capability of retrieving the atmo-spheric parameters, that primarily determine the OLR emission, i.e. the vertical profilesof T and water vapour, and the surface emission. Based on this information and usinga RT model, such as that described in Sect. 3.1, it is possible to simulate the emis-sion L(σ,θ) as a function of the wavenumber σ and the zenith angle θ. In the case of10
an horizontally uniform atmosphere, the angular integral defining the OLR flux FOLR isaccurately calculated with the following equation
FOLR = 2π∫ ∞
0dσ
∫ π2
0L(σ, θ) cos(θ) sin(θ)dθ. (1)
and has a variance equal to:
σ2FOLR
= 4π2∫ ∞
0dσ1
∫ ∞
0dσ2
∫ π2
0dθ1 cos(θ1) sin(θ1) ·15
·∫ π
2
0dθ2 cos(θ2) sin(θ2)J1SJT
2 . (2)
where S is the variance covariance matrix of the retrieved atmospheric parameters,J1 and J2 are the jacobian matrices
(Jk)σi ,j =∂L(σi , θk)
∂xj. (3)
where xi are the retrieved parameters.20
17751

ACPD7, 17741–17767, 2007
Spectral observationof the outgoing
longwave radiation
L. Palchetti et al.
Title Page
Abstract Introduction
Conclusions References
Tables Figures
J I
J I
Back Close
Full Screen / Esc
Printer-friendly Version
Interactive Discussion
EGU
Equation (1) was used with our measurements for the calculation of FOLR at the float-ing altitude of the balloon gondola. The integral is calculated with a spectral integrationfrom 20 to 2600 cm−1 and with the simulation of different angular observations fromthe zenith to the atmospheric limb. The limitation in the spectral domain introducesan underestimation of about 0.05 W/m2 in our case of the tropical atmosphere. The5
OLR flux varies along the flight path mainly due to the temperature variations of thelower troposphere and of the Earth surface. The value has the minimum of 284 W/m2
at the sunrise occurring at 09:00 UTC and reaches 306 W/m2 at the end of the flight at15:48 UTC. The error analysis shows that the effect of random noise on the flux integralis negligible since it has positive and negative contributions which cancel out along the10
wavenumber integration performed to calculate the flux. The systematic componentdue to the calibration accuracy is instead integrated with the flux and is the main con-tribution to the total error. With this analysis, we found that the radiation flux error isabout 0.4 W/m2 when related to the FIR spectral region and globally over the wholeband it does not exceed 1.3 W/m2.15
A comparison with the fluxes calculated for the ECMWF atmospheric states hasbeen performed in the two extreme cases at sunrise and at the end of flight. Also thefluxes obtained with the ECMWF atmosphere show an increase with time, but both theECMWF fluxes and their increase are less that what obtained with REFIR-PAD data.The FIR spectral region from 0 to 600 cm−1 is here considered in detail because in this20
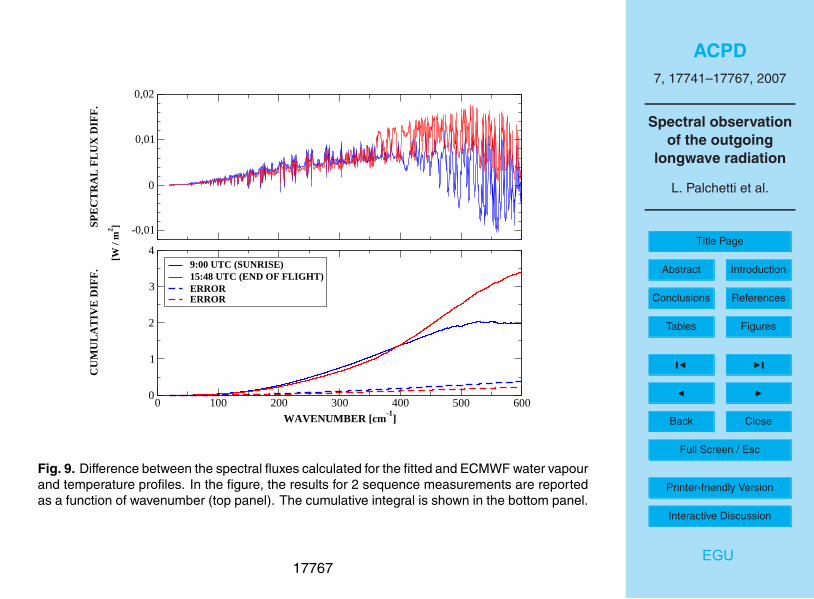
spectral region new observations are obtained by REFIR-PAD and low altitude cloudshave a negligible effect on the TOA radiance. The result is shown in Fig. 9, wherein the top panel the differences between the spectral fluxes calculated for the retrievedand the ECMWF water vapour and temperature profiles are shown for the sunrise (blueline), and for the end of the flight (red line). In the bottom panel, the results are reported25
as the cumulative integral of the spectral differences and they are compared with thecumulative integral of the expected error (dashed lines). The Fig. 9 shows that theOLR flux differences in the FIR are in the range of 2–3.5 W/m2, larger for the warmeratmosphere.
17752

ACPD7, 17741–17767, 2007
Spectral observationof the outgoing
longwave radiation
L. Palchetti et al.
Title Page
Abstract Introduction
Conclusions References
Tables Figures
J I
J I
Back Close
Full Screen / Esc
Printer-friendly Version
Interactive Discussion
EGU
This result clearly identifies the differences with the estimations made with theECMWF atmospheric analysis and the importance of the characterisation of the FIRregion for the exact calculation of the OLR fluxes. The error with which the flux isdetermined is caused mainly by calibration uncertainties while detector noise has anegligible effect. This is a further demonstration that uncooled detectors are adequate5
for a detailed radiometric observations.
6 Conclusions
The results of the first flight of REFIR-PAD have been shown. The instrument per-formed the spectral measurement of the OLR from 100 to 1400 cm−1 in the tropicalregion in June 2005. This spectrally resolved measurement has allowed the retrieval of10
the atmospheric state with sufficient precision to improve the accuracy with which theintegrated outgoing radiation flux can be calculated, proving that spectral informationcan be used to infer the angular distribution of the radiance.
While the temperature profile is in good agreement with the ECMWF analysis, theretrieved water vapour VMR profile differs of about 60% at the upper troposphere –15
lower-stratosphere altitude. This difference allows to calculate the difference in termsof the OLR flux at the flight altitude of 34 km due to the FIR region which resulted tobe as large as 3.5 W/m2 with an error of about 0.4 W/m2. A difference of 3.5 W/m2 isan important term in the determination of the total OLR since it is comparable to oreven greater than the estimation of the radiative forcing of the CO2 increases since20
pre-industrial times.Furthermore, we have shown that the flux error is mainly due to the radiometric
calibration uncertainty while the random detector noise has a negligible effect, provingthe feasibility of climatological studies with instruments that use uncooled detectors.
This measurement that is limited in time and space can not be representative of a25
bias in ECMWF analysis, but underlines a shortcoming in the knowledge of the Earth’sradiation budget. We argue that a comprehensive characterisation of the outgoing ra-
17753

ACPD7, 17741–17767, 2007
Spectral observationof the outgoing
longwave radiation
L. Palchetti et al.
Title Page
Abstract Introduction
Conclusions References
Tables Figures
J I
J I
Back Close
Full Screen / Esc
Printer-friendly Version
Interactive Discussion
EGU
diation flux could be attained, using uncooled detectors, from spectrally resolved wide-band measurements of the atmospheric emission, that also includes the far infrared.
Acknowledgements. The Authors wish to thank C. Camy-Peyret, LPMAA-CNRS, France, theCNES ballon team (led by P. Chadoutaud), and the CNES gondola team (led by J. Evrard) forhaving hosted REFIR-PAD on-board the IASI-balloon gondola and the helpful support during5
the Brazilian field campaign.
References
Bianchini, G. and Palchetti, L.: REFIR-PAD level 1 data analysis and performance characteri-zation, Atmos. Chem. Phys. Discuss., accepted, 2007. 17746, 17749
Bianchini, G., Palchetti, L., and Carli, B.: A wide-band nadir-sounding spectroradiometer for the10
characterization of the Earth’s outgoing long-wave radiation, 6361, p.63 610A, 2006. 17745Bianchini, G., Carli, B., Cortesi, U., Bianco, S. D., Gai, M., and Palchetti, L.: Test of far infrared
atmospheric spectroscopy using wide band ballon borne measurements of the upwellingradiance, J. Quant. Spectrosc. Rad., doi:10.1016/j.jqsrt.2007.11.010, 2007. 17750
Carli, B., Bazzini, G., Castelli, E., Cecchi-Pestellini, C., Bianco, S. D., Dinelli, B. M., Gai, M.,15
Magnani, L., Ridolfi, M., and Santurri, L.: MARC: A code for the retrieval of atmosphericparameters from millimeter-wave limb measurements, J. Quant. Spectrosc. Rad., 105, 476–491, 2007. 17747
Chahine, M.: The hydrological cycle and its influence on climate, Nature, 359, 373–380, 1992.1774320
Chou, C. and Neelin, J.: Cirrus Detrainment-Temperature Feedback, Geophys. Res. Lett., 26,1295–1298, 1999. 17744
Clerbaux, N., Dewitte, S., Gonzalez, L., Bertrand, C., Nicula, B., and Ipe, A.: Outgoing long-wave flux estimation: improvement of angular modelling using spectral information, RemoteSens. Environ., 85, 389–395, 2003. 1775125
Clough, S. A., Iacono, M. J., and Moncet, J.-L.: Line-by-Line Calculations of AtmosphericFluxes and Cooling Rates: Application to Water Vapor, J. Geophys. Res., 97, 15 761–15 785,1992. 17743
Clough, S. A., Shepard, M. W., Mlawer, E. J., Delamere, J. S., Iacono, M. J., Cady-Pereira, K.,
17754
ACPD7, 17741–17767, 2007
Spectral observationof the outgoing
longwave radiation
L. Palchetti et al.
Title Page
Abstract Introduction
Conclusions References
Tables Figures
J I
J I
Back Close
Full Screen / Esc
Printer-friendly Version
Interactive Discussion
EGU
Boukabara, S., and Brown, P. D.: Atmospheric radiative transfer modelling: a summary ofthe AER codes, J. Quant. Spectrosc. Rad., 91, 233–244, 2005. 17747
Cox, S.: Cirrus Clouds and the Climate, J. Atmos. Sci., 28, 1513–1515, 1971. 17744European-Commission: REFIR Radiation Explorer in the Far InfraRed, Tech. Rep. Final ENV4-
CT6-0344, European Commission, Brussels, Belgium, 2000. 177455
Del Genio, A. D., Yao, M.-S., Kovari, W., , and Lo, K. K.-W.: A prognostic cloud water parame-terization for global climate models, J. Climate, 9, 270–304, 1996. 17744
Gordon, I. E., Rothman, L. S., Gamache, R. R., Jacquemart, D., Boone, C., Bernath, P. F.,Shephard, M. W., Delamere, J. S., and Clough, S. A.: Current updates of the water-vaporline list in HITRAN:A new “Diet” for air-broadened half-widths, J. Quant. Spectrosc. Rad.,10
108, 389–402, 2007. 17747Harries, J. E.: Atmospheric radiation and atmospheric humidity, Q. J. Roy. Meteor. Soc., 123,
2173–2186, 1997. 17743Harries, J. E.: The Greenhouse Earth – A view from space, Q. J. Roy. Meteor. Soc., 122,
799–818, 1996. 1774315
Held, I. M. and Soden, B. J.: Water vapor feedback and global warming, Annu. Rev. Energ.Env., 25, 441–475, 2000. 17743
Houghton, J.: The physics of atmospheres, Cambridge University Press, Cambridge, U.K.,New York, 2002. 17746
Lindzen, R.: Some Coolness Concerning Global Warming, Bull. Amer. Meteor. Soc., 71, 288–20
299, 1990. 17743Liou, K.-N.: Influence of cirrus clouds on weather and climate processes, a global perspective,
Mon. Weath. Rev., 114, 1167–1199, 1986. 17744Mertens, C. J.: Feasibility of retrieving upper tropospheric water vapor from observations of
far-infrared radiation, 4485, pp.191–201, SPIE, 2002. 1774825
Niro, F., Jucks, K., and Hartmann, J. M.: Spectra calculations in central and wing regions ofCO2 IR bands. IV: software and database for the computation of atmospheric spectra, J.Quant. Spectrosc. Rad., 95, 469–481, 2005a. 17747
Niro, F., Von Clarmann, T., Jucks, K., and Hartmann, J. M.: Spectra calculations in central andwing regions of CO2 IR bands between 10 and 20µm. III: atmospheric emission spectra, J.30
Quant. Spectrosc. Rad., 90, 61–76, 2005b. 17747Palchetti, L., Bianchini, G., Castagnoli, F., Carli, B., Serio, C., Esposito, F., Cuomo, V., Rizzi,
R., and Maestri, T.: The breadboard of the Fourier transform spectrometer for the Radiation
17755

ACPD7, 17741–17767, 2007
Spectral observationof the outgoing
longwave radiation
L. Palchetti et al.
Title Page
Abstract Introduction
Conclusions References
Tables Figures
J I
J I
Back Close
Full Screen / Esc
Printer-friendly Version
Interactive Discussion
EGU
Explorer in the Far Infrared (REFIR) atmospheric mission, Appl. Opt., 44, 2870–2878, 2005.17745
Palchetti, L., Belotti, C., Bianchini, G., Castagnoli, F., Carli, B., Cortesi, U., Pellegrini, M., Camy-Peyret, C., Jeseck, P., , and Te, Y.: Technical note: First spectral measurement of the Earth’supwelling emission using an uncooled wideband Fourier transform spectrometer, Atmos.5
Chem. Phys., 6, 5025–5030, 2006. 17745Pierrehumbert, R.: The hydrologic cycle in deep-time climate problems, Nature, 419, 191–198,
2002. 17743Randall, D., Wood, R., and et al.: Climate Models and Their Evaluation, chap. 8, IPCC WG1
AR4 Final Report, 2007. 1774310
Randall, D. A., Harshvardhan, Dazlich, D. A., and Corsetti, T. G.: Interactions among Radiation,Convection, and Large-Scale Dynamics in a General Circulation Model, J. Atmos. Sci., 47,1943–1970, 1989. 17744
Remedios, J. J.: Extreme atmospheric constituent profiles for MIPAS, 2, pp. 779–783, 96, 1999.1774715
Rizzi, R., Palchetti, L., Carli, B., Bonsignori, R., Harries, J. E., Leotin, J., Peskett, S. C., Serio,C., and Sutera, A.: Feasibility of the spaceborne radiation explorer in the far infrared (REFIR),4485, pp. 202–209, SPIE, http://link.aip.org/link/?PSI/4485/202/1, 2002. 17745
Rodgers, C. D.: Inverse Methods for Atmospheric Sounding: Theory and Practice, World Sci-entific, Singapore, New Jersey, London, Hong Kong, 2000. 1774720
Rothman, L. S., Jacquemart, D., Barbe, A., Benner, D. C., Birk, M., Brown, L. R., Carleer,M. R., and Wagner, .G.: The HITRAN 2004 molecular spectroscopic database, J. Quant.Spectrosc. Rad., 96, 139–204, 2005. 17747
Sinha, A. and Harries, J. E.: Water vapor and greenhouse trapping: the role of far infraredabsorption, Geophys. Res. Lett., 22, 2147–2150, 1995. 1774325
Stephens, G., Tsay, S., Stackhouse, P. J., and Flatau, P.: The Relevance of the Microphysicaland Radiative Properties of Cirrus Clouds to Climate and Climatic Feedback, J. Atmos. Sci.,47, 1742–1754, 1990. 17744
Stuber, N., Ponater, M., and Sausen, R.: Why radiative forcing might fail as a predictor ofclimate change, Clim. Dynam., 2005. 1774330
Suttles, J. T., Wielicki, B. A., and Vemury, S.: Top-of-Atmosphere Radiative Fluxes: Validationof ERBE Scanner Inversion Algorithm Using Nimbus-7 ERB Data, J. Appl. Meteor., 31, 784–796, 1992. 17751
17756
ACPD7, 17741–17767, 2007
Spectral observationof the outgoing
longwave radiation
L. Palchetti et al.
Title Page
Abstract Introduction
Conclusions References
Tables Figures
J I
J I
Back Close
Full Screen / Esc
Printer-friendly Version
Interactive Discussion
EGU
Tobin, D. C., Best, F. A., Brown, P. D., Clough, S. A., Dedecker, R. G., Ellingson, R. G., Garcia,R. K., Howell, H. B., Knuteson, R. O., Mlawer, E. J., Revercomb, H. E., Short, J. F., van Delst,P. F. W., and Walden, V. P.: Downwelling spectral radiance observations at the SHEBA icestation: Water vapor continuum measurements from 17 to 26µm, J. Geophys. Res., 104,2081–2092, 1999. 177435
Van Vleck, J. H. and Weisskopf, V. F.: On the Shape of Collision-Broadened Lines, Revs. Mod.Phys., 17, 227–236, 1945. 17747
Wielicki, B. A., Barkstrom, B. R., Harrison, E. F., Lee, R. B., Louis Smith, G., and Cooper,J. E.: Clouds and the Earth’s Radiant Energy System (CERES): An Earth Observing SystemExperiment, Bull. Amer. Meteor. Soc., 77, 853–868, 1996. 1775110
17757

ACPD7, 17741–17767, 2007
Spectral observationof the outgoing
longwave radiation
L. Palchetti et al.
Title Page
Abstract Introduction
Conclusions References
Tables Figures
J I
J I
Back Close
Full Screen / Esc
Printer-friendly Version
Interactive Discussion
EGU
Table 1. REFIR-PAD specifications.
Spectrometer specifications
Interferometer type Mach-Zehnderwith double-input/double-output
Detector system 2 room temperature DLATGSSpectral coverage 100–1400 cm−1
Spectral resolution 0.5 cm−1
Optical throughput 0.01 cm2 srField of view 0.133 radLine of sight nadir, limb, deep space at +30◦
Acquisition time 32 sNESR 0.8–2.5 mW/(m2 sr cm−1)Mean calibration error 0.1 K
17758

ACPD7, 17741–17767, 2007
Spectral observationof the outgoing
longwave radiation
L. Palchetti et al.
Title Page
Abstract Introduction
Conclusions References
Tables Figures
J I
J I
Back Close
Full Screen / Esc
Printer-friendly Version
Interactive Discussion
EGU
Fig. 1. Retrieval of the T vertical profile (red line) and comparison with the a priori profile (blueline) used as initial guess and with the ECMWF profile (green line).
17759
ACPD7, 17741–17767, 2007
Spectral observationof the outgoing
longwave radiation
L. Palchetti et al.
Title Page
Abstract Introduction
Conclusions References
Tables Figures
J I
J I
Back Close
Full Screen / Esc
Printer-friendly Version
Interactive Discussion
EGU
Fig. 2. Retrieval of the water vapour vertical profile (red line) and comparison with the a prioriprofile (blue line) used as initial guess and with the ECMWF profile (green line).
17760

ACPD7, 17741–17767, 2007
Spectral observationof the outgoing
longwave radiation
L. Palchetti et al.
Title Page
Abstract Introduction
Conclusions References
Tables Figures
J I
J I
Back Close
Full Screen / Esc
Printer-friendly Version
Interactive Discussion
EGU
Fig. 3. Averaging kernels for T.
17761

ACPD7, 17741–17767, 2007
Spectral observationof the outgoing
longwave radiation
L. Palchetti et al.
Title Page
Abstract Introduction
Conclusions References
Tables Figures
J I
J I
Back Close
Full Screen / Esc
Printer-friendly Version
Interactive Discussion
EGU
Fig. 4. Averaging kernels for water vapour.
17762

ACPD7, 17741–17767, 2007
Spectral observationof the outgoing
longwave radiation
L. Palchetti et al.
Title Page
Abstract Introduction
Conclusions References
Tables Figures
J I
J I
Back Close
Full Screen / Esc
Printer-friendly Version
Interactive Discussion
EGU
Fig. 5. Difference along the flight between the REFIR retrieved temperature and the ECMWFinterpolated fields.
17763
ACPD7, 17741–17767, 2007
Spectral observationof the outgoing
longwave radiation
L. Palchetti et al.
Title Page
Abstract Introduction
Conclusions References
Tables Figures
J I
J I
Back Close
Full Screen / Esc
Printer-friendly Version
Interactive Discussion
EGU
Fig. 6. Difference between water vapour VMR retrieved from the REFIR and the ECMWFinterpolated fields.
17764

ACPD7, 17741–17767, 2007
Spectral observationof the outgoing
longwave radiation
L. Palchetti et al.
Title Page
Abstract Introduction
Conclusions References
Tables Figures
J I
J I
Back Close
Full Screen / Esc
Printer-friendly Version
Interactive Discussion
EGU
Fig. 7. Mean value of residuals and error during the flight.
17765

ACPD7, 17741–17767, 2007
Spectral observationof the outgoing
longwave radiation
L. Palchetti et al.
Title Page
Abstract Introduction
Conclusions References
Tables Figures
J I
J I
Back Close
Full Screen / Esc
Printer-friendly Version
Interactive Discussion
EGU
Fig. 8. Time series of temperature values as measured by REFIR at the surface (brightnesstemperature) and the retrieval altitudes of 1.0 and 3.0 km.
17766
ACPD7, 17741–17767, 2007
Spectral observationof the outgoing
longwave radiation
L. Palchetti et al.
Title Page
Abstract Introduction
Conclusions References
Tables Figures
J I
J I
Back Close
Full Screen / Esc
Printer-friendly Version
Interactive Discussion
EGU
0 100 200 300 400 500 600WAVENUMBER [cm
-1]
0
1
2
3
4
CU
MU
LA
TIV
E D
IFF
. 9:00 UTC (SUNRISE)15:48 UTC (END OF FLIGHT)ERRORERROR
-0,01
0
0,01
0,02SP
EC
TR
AL
FL
UX
DIF
F.
[W /
m2 ]
Fig. 9. Difference between the spectral fluxes calculated for the fitted and ECMWF water vapourand temperature profiles. In the figure, the results for 2 sequence measurements are reportedas a function of wavenumber (top panel). The cumulative integral is shown in the bottom panel.
17767