spectral mixture analysis of the urban landscape in ...isu.indstate.edu/qweng/pers september...
TRANSCRIPT

AbstractThis paper examines characteristics of urban land-use andland-cover (LULC) classes using spectral mixture analysis(SMA), and develops a conceptual model for characterizingurban LULC patterns. A Landsat Enhanced Thematic MapperPlus (ETM+) image of Indianapolis City was used in this re-search and a minimum noise fraction (MNF) transform wasemployed to convert the ETM+ image into principal compo-nents. Five image endmembers (shade, green vegetation, im-pervious surface, dry soil, and dark soil) were selected, andan unconstrained least-squares solution was used to un-mixthe MNF components into fraction images. Different combina-tions of three or four endmembers were evaluated. The bestfraction images were chosen to classify LULC classes based ona hybrid procedure that combined maximum-likelihood anddecision-tree algorithms. The results indicate that the SMA-based approach significantly improved classification accuracyas compared to the maximum-likelihood classifier. The frac-tion images were found to be effective for characterizing theurban landscape patterns.
IntroductionUrban landscapes are typically composed of features that aresmaller than the spatial resolution of the sensors, a complexcombination of buildings, roads, grass, trees, soil, water, andso on. Strahler, et al. (1986) described H- and L-resolutionscene models based on the relationships between the size ofthe scene elements and the resolution cell of the sensor. Thescene elements in the H-resolution model are larger than theresolution cell and can, therefore, be directly detected. In con-trast, the elements in the L-resolution model are smaller thanthe resolution cells, and are not detectable. When the objectsin the scene become increasingly smaller relative to the reso-lution cell size, they may be no longer regarded as objectsindividually. Hence, the reflectance measured by the sensorcan be treated as a sum of interactions among various classesof scene elements as weighted by their relative proportions(Strahler, et al., 1986). Landsat Thematic Mapper (TM) orEnhanced Thematic Mapper Plus (ETM+) images with a nomi-nal 30 meter spatial resolution are attributed to L-resolutionmodel. These data are often considered too coarse for map-ping the components of urban environments. As the spatialresolution interacts with the fabric of urban landscapes, a spe-
Spectral Mixture Analysis of theUrban Landscape in Indianapolis
with Landsat ETM+ ImageryDengsheng Lu and Qihao Weng
cial problem of mixed pixels is created, where several land-use and land-cover (LULC) types are contained in one pixel.Such a mixture becomes especially prevalent in residentialareas where buildings, trees, lawns, concrete, and asphalt canall occur within a pixel. Mixed pixels have been recognized asa problem affecting the effective use of remotely sensed datain LULC classification and change detection (Fisher, 1997;Cracknell, 1998). Fisher (1997) summarized four causes of themixed pixel problem, i.e., (1) boundaries between two or moremapping units, (2) the intergrade between central conceptsof mappable phenomena, (3) linear sub-pixel objects, and(4) small sub-pixel objects. When mixed pixels occur, purespectral responses of specific features are confused with thepure responses of other features, leading to the problem ofcomposite signatures (Campbell, 2002).
The low accuracy of LULC classification in urban areas islargely attributed to the mixed pixel problem. For example, thetraditional per-pixel classifiers, such as maximum-likelihoodclassifier (MLC), cannot effectively handle complex urban land-scapes and the mixed pixel problem. When unsupervisedclassification is applied to densely populated suburban metro-politan areas, the mixed pixel problem becomes exaggerated.Trees on lawns are confused with forest classes. Lawns aresimilar to pasture and recreation, and pavement is commonin high-density residential and commercial/industrial areas(Epstein, et al., 2002). In practice, accurate classification re-sults are a prerequisite for many environmental and socioeco-nomic applications, such as urban change detection (Chen,et al., 2000; Ward, et al., 2000), urban heat islands (Lo, et al.,1997; Quattrochi, et al., 2000; Weng, 2001), and estimationof biophysical, demographic, and socioeconomic variables(Lo, 1995; Thomson and Hardin, 2000). Improving LULC clas-sification accuracy has been an important theme in remotesensing literature.
Different approaches have been used to improve urbanLULC classification or change detection accuracies. These ap-proaches include incorporation of geographic data (Harris andVentura, 1995), census data (Mesev, 1998), texture features(Myint, 2001; Shaban and Dikshit, 2001), and structure orcontextual information (Gong and Howarth, 1990; Stuckens,et al., 2000) into remote sensing spectral data, use of expertsystems (Stefanov, et al., 2001; Hung and Ridd, 2002) andfuzzy classification (Zhang and Foody, 2001), use of multi-sensor data such as merged radar and TM data (Haack, et al.,2002), merged SPOT and TM data (Gluch, 2002), and merged
P H OTO G R A M M E T R I C E N G I N E E R I N G & R E M OT E S E N S I N G September 2004 1 0 5 3
Dengsheng Lu is with the Center for the Study of Institutions,Population, and Environmental Change, Indiana University,Bloomington, IN 47408 ([email protected]).
Qihao Weng is with the Department of Geography, Geology,and Anthropology, Indiana State University, Terre Haute,IN 47809 ([email protected]).
Photogrammetric Engineering & Remote Sensing Vol. 70, No. 9, September 2004, pp. 1053–1062.
0099-1112/04/7009–1053/$3.00/0 © 2004 American Society for Photogrammetry
and Remote Sensing
03-019.qxd 8/10/04 17:01 Page 1053

Airborne Visible/Infrared Imaging Spectrometer (AVIRIS) andradar data (Chen, et al., 2003). Table 1 summarizes some re-search efforts to improve urban LULC classification accuracies.
One of the major advances in urban LULC analysis isRidd’s (1995) vegetation—impervious surface—soil (V-I-S)model (Figure 1). It assumes that land cover in urban environ-ments is a linear combination of three components: vegeta-tion, impervious surface, and soil. This model provides a
guideline for decomposing urban landscapes and a link forthese components to remote sensing spectral characteristics.Several studies have adopted this model as a basis for under-standing the urban environment. Ward, et al. (2000) used a hi-erarchical unsupervised classification scheme to classify fourclasses (water, forest, cleared, and urban) on a per-pixel basisand applied the approach to a TM image in southeast Queens-land, Australia, based on the V-I-S model. An adjusted overallaccuracy of 83 percent was achieved. Madhavan, et al. (2001)used an unsupervised classifier (ISODATA) to classify TM im-ages into seven classes in the Bangkok Metropolitan area,Thailand. The V-I-S model proved to be useful for the classifi-cation, although the classification accuracy was not as highas expected due to the complexity of the study area. Rashed,et al. (2001) conducted spectral mixture analysis (SMA) of IRS-1C multispectral image to describe the anatomy of the GreaterCairo Region, Egypt, based on four image endmembers: vege-tation, impervious surface, soil, and shade. A decision treeclassifier (DTC) was then applied to the fraction images. Theclassification accuracy was found to be higher than the accu-racy achieved using MLC and minimum distance classifiers.Phinn, et al. (2002) compared traditional image classification,interpretation of aerial photographs, and constrained linearSMA using a TM image in southeast Queensland, Australia, andfound that the V-I-S fraction images derived from SMA pro-vided better classification results than per-pixel classificationand aggregated aerial photo interpretation. Wu and Murray(2003) used SMA to analyze impervious surface distribution inthe metropolitan area of Columbus, Ohio, USA, and foundthat impervious surface can be estimated using a linear regres-sion model of low and high albedo endmember fractions.
Although the V-I-S model has demonstrated usefulness foridentifying and characterizing urban land cover patterns, itsuse in practice is constrained due to the following factors.First, the V-I-S model cannot explain all land cover types suchas water and wetlands. Second, impervious surface in the V-I-Smodel cannot be easily identified as an endmember based on
1 0 5 4 September 2004 P H OTO G R A M M E T R I C E N G I N E E R I N G & R E M OT E S E N S I N G
Figure 1. The V-I-S (Vegetation—Impervious surface—Soil)model illustrating the characteristics of urban landscapes(Ridd, 1995).
TABLE 1. A SUMMARY OF PREVIOUS METHODS USED FOR IMPROVING URBAN LULC CLASSIFICATION ACCURACY
No. Category Datasets Used Study Area References
1 Use of advanced classifiers (1) TM (fuzzy) (1) Edinburgh (1) Zhang and Foody, 2001(2) TM (ECHO) (2) Minneapolis, St. Paul, Minnesota (2) Stuckens et al., 2000(3) ASTER (support vector (3) Beer Sheva, Israel (3) Zhu and Blumberg, 2002
machine-based algorithm)
2 Use of sub-pixel information (1) TM and aerial photographs (1) Southeast Queensland, Australia (1) Phinn et al., 2002(2) IRS-1C multispectral and (2) Metropolitan area of Cairo, Egypt (2) Rashed et al., 2001
panchromatic image
3 Incorporation of spectral (1) SPOT (1) Town of Arkham, northeastern (1) Gong and Howarth, 1990and spatial information (2) SPOT Toronto, Canada (2) Shaban and Dikshot, 2001
(3) TM (2) Lucknow, Uttar Pradesh, India (3) Stuckens et al., 2000(4) ATLAS (3) Minneapolis, St. Paul, Minnesota (4) Myint, 2001
(4) Baton Rouge, Louisiana
4 Incorporation of ancillary (1) TM, zoning data, and (1) Beaver Dam, Wisconsin (1) Harris and Ventura, 1995data housing densities (2) Beijing, China (2) Zhang et al., 2002
(2) TM image and road density (3) Four medium-sized settlements (3) Mesev, 1998(3) SPOT HRV(XS), TM, census in United Kingdom: Bristol,
data Swindon, Norwich,and Peterborough
5 Use of multisensor data (1) TM and RADARSAT C-band (1) Kathmandu Valley, Nepal (1) Haack et al., 2002(2) TM and SPOT-P band (2) Wasatch Front, Utah (2) Gluch, 2002(3) AVIRIS and radar (3) Park City, Utah (3) Chen et al., 2003
6 Use of normalized difference TM Nanjing, China Zha et al., 2003built-up index
7 Use of expert system TM (1) Phoenix metropolitan area, (1) Stefanov et al., 2001Arizona (2) Hung and Ridd, 2002
(2) Salt Lake City, Utah
8 Reclassification SPOT-1 HRV Southeast London, England Barnsley and Barr, 1996
03-019.qxd 8/10/04 17:01 Page 1054
P H OTO G R A M M E T R I C E N G I N E E R I N G & R E M OT E S E N S I N G September 2004 1 0 5 5
remote sensing images (Wu and Murray, 2003) because imper-vious surface is a complex mixture of different materials, in-cluding concrete, asphalt, metals, plastic, and soils (Jensen,2000). Finally, the V-I-S model excludes an important compo-nent in the mixed pixels, i.e., the shade. Shade, caused by tallbuildings or trees, is an important factor affecting the spectralresponse patterns of urban landscapes and should be an es-sential consideration in analyzing urban landscapes. Formedium-spatial resolution remotely sensed data, such asTM/ETM+, the central business district, light/heavy industry,high/medium density residential, and bare soils are difficultto differentiate using traditional digital image processing tech-niques. Recently SMA has attracted increasing interests inurban studies and has shown the potential for estimating im-pervious surface and vegetation abundance, and for improv-ing urban land-cover classification (Rashed, et al., 2001;Small, 2001; Phinn, et al., 2002; Small, 2002; Wu and Murray,2003). This paper evaluates the potential of SMA for character-izing an urban environment and for improving urban LULCclassification accuracy.
Spectral Mixture AnalysisThe linear SMA approach assumes that the spectrum measuredby a sensor is a linear combination of the spectra of all com-ponents within the pixel (Adams, et al., 1995; Roberts, et al.,1998a). The mathematical model can be expressed as
Ri � �n
k�1fkRik � �i
where i is the number of spectral bands used; k � 1, . . . , n(number of endmembers); Ri is the spectral reflectance of bandi of a pixel, which contains one or more endmembers; fk is theproportion of endmember k within the pixel; Rik is known asthe spectral reflectance of endmember k within the pixel onband i, and �i is the error for band i. To solve fk, the followingconditions must be satisfied: (1) selected endmembers shouldbe independent of each other, (2) the number of endmembersshould be less than or equal to the spectral bands used, and(3) selected spectral bands should not be highly correlated.
It is well recognized that remotely sensed data, such asvisible bands in Landsat TM/ETM+ data, are highly correlatedbetween the adjacent spectral wavebands (Barnsley, 1999).Several techniques have been used to transform the data fromhighly correlated bands to an orthogonal subset. Principalcomponent analysis (PCA) and minimum noise fraction (MNF)are the two most common transformations (Green, et al., 1988;Boardman and Kruse, 1994; Jensen, 1996). The MNF transformcontains two steps (ENVI, 2000): (1) de-correlation and rescal-ing of the noise in the data based on an estimated noise co-variance matrix, producing transformed data in which thenoise has unit variance and no band-to-band correlations; and(2) implementation of a standard PCA of the noise-whiteneddata. The result of MNF is a two-part dataset, one part associ-ated with large eigenvalues and coherent eigenimages, and acomplementary part with near-unity eigenvalues and noise-dominated images (ENVI, 2000). In the MNF transform, thenoise is separated from the data by using only the coherentportions, thus improving spectral processing results. Previousstudies have shown that use of MNF transform can improvethe quality of fraction images (van der Meer and de Jong, 2000;Small, 2001; Lu, et al., 2002; Small, 2002; Wu and Murray,2003), and thus the MNF transform was used in this study.
Development of high-quality fraction images dependsgreatly on the selection of suitable endmembers. A variety ofmethods have been developed to determine endmembers. Forexample, endmembers can be obtained from (1) a spectral li-brary, or field reflectance measurements; (2) the image itself(Quarmby, et al., 1992; Settle and Drake, 1993) or high-order
PCA eigenvectors (Boardman, 1993); (3) spectrally pure pixelsidentified using the Pixel Purity Index (PPI) (Boardman, et al.,1995), which are selected manually by visualizing the PPI re-sults in an N-dimensional visualizer with ENVI (ENVI, 2000);(4) manual endmember selection (Bateson and Curtiss, 1996),which is a multidimensional visualization technique for inter-actively exploring the mixing space in search of spectra todesignate as endmembers; and (5) the combination of imageand reference endmember selection methods. The combina-tion approach involves a spectral alignment between imageendmembers and reference endmembers, and a calibration torelate image endmembers to reference endmembers (Smith,et al., 1990; Roberts, et al., 1993). For most SMA applications,image endmembers are utilized because they can be easily ob-tained and can represent spectra measured at the same scaleas the image data (Roberts, et al., 1998a). The endmembers areregarded as the extremes in the triangles of an image scatter-gram. Hence, the image endmembers can be identified fromthe scatterplots of two spectral bands.
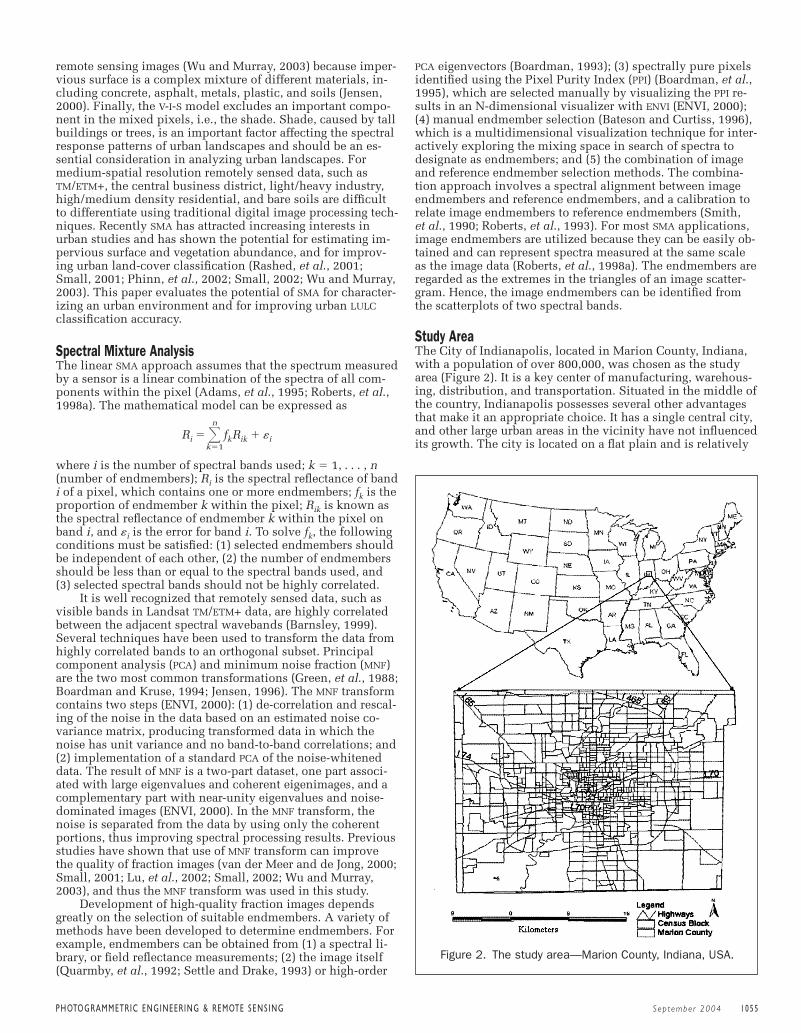
Study AreaThe City of Indianapolis, located in Marion County, Indiana,with a population of over 800,000, was chosen as the studyarea (Figure 2). It is a key center of manufacturing, warehous-ing, distribution, and transportation. Situated in the middle ofthe country, Indianapolis possesses several other advantagesthat make it an appropriate choice. It has a single central city,and other large urban areas in the vicinity have not influencedits growth. The city is located on a flat plain and is relatively
Figure 2. The study area—Marion County, Indiana, USA.
03-019.qxd 8/10/04 17:01 Page 1055
symmetrical, having possibilities of expansion in all direc-tions. Like most American cities, Indianapolis is increasingin population and in area. The areal expansion is through en-croachment into the adjacent agricultural and non-urban land.Certain decision-making forces, such as density of population,distance to work, property value, and income structure, en-courage some sectors of metropolitan Indianapolis to expandfaster than others. Analyzing the urban landscape structureand monitoring urban expansion and its environmental im-pacts in metropolitan Indianapolis is significant to understand,control, and plan its future development.
MethodThe Landsat ETM+ image (L1G product of path 21, row 32)used in this study was acquired on 22 June 2000, under clearsky conditions. The data were radiometrically converted toat-sensor reflectance using image-based correction method(Markham and Barker, 1987). Although the L1G ETM+ datawere geometrically corrected, its geometrical accuracywas not high enough for combining them with other high-resolution data sets. Hence, the image was further rectified toa common Universal Transverse Mercator coordinate systembased on 1:24000 scale topographic maps and was resampledto a pixel size of 30 m by 30 m using the nearest-neighbor al-gorithm. A root mean square error of less than 0.5 pixels wasobtained in the rectification. Following georectification, theMNF was applied to transform the ETM+ at-sensor reflectancedata into a new coordinate set. The first four MNF componentswere used for spectral mixture analysis, and the last two werediscarded due to their high proportion of noise contents.
Four types of endmembers were selected: shade, greenvegetation (GV), impervious surfaces (such as building roofsand roads), and soils (including dry soil and dark soil). End-members were initially identified from the ETM+ image basedon high-spatial resolution aerial photographs. The shade end-member was identified from the areas of clear and deep water,while GV was selected from the areas of dense grass and covercrops. Different types of impervious surfaces were selectedfrom building roofs, airport runways, and highway intersec-tions. Soils were selected from bare grounds in agriculturallands. Next, these initial endmembers were compared withthose endmembers selected from the scatterplots of MNF1 andMNF2, and of MNF1 and MNF3. The endmembers with similarMNF spectra located at the extreme vertices of the scatterplotswere selected. These endmembers were shade, GV, impervioussurface, dry soil, and dark soil. An unconstrained least-squaresregression solution was used to unmix the MNF componentsinto fraction images.
To find the best quality of fraction images, different com-binations of endmembers were tested. The combinationswere: (1) four endmembers with shade, GV, impervious sur-face, and dark soil; (2) three endmembers with shade, GV, andimpervious surface; (3) three endmembers with shade, GV, anddry soil; and (4) three endmembers with shade, GV, and darksoil. Visualization of fraction images, analysis of fractioncharacteristics of representative land cover types, and assess-ment of error images were conducted to determine whichcombination provided the best fractions for the study area.
High-spatial resolution aerial photographs were used toidentify LULC sample plots. A total of 156 sample plots wereidentified, covering ten land-cover types: commercial and in-dustrial urban area (hereafter, urban), high-intensity residen-tial, low-intensity residential, bare soil, crop, grass, pasture,forest, wetland, and water. On average, 10 to 16 sample plotsfor each class were selected. A window size of three by threewas applied to extract the fraction value for each plot. Theaverage value and standard deviation were then calculated foreach land cover class. A graph showing the fraction character-
istics of selected LULC types was created to examine their dif-ferent features in proportional compositions.
The MLC was applied to classify the fraction images intoten classes producing a classified image and a distance image.The distance image represents the result of the Mahalanobisdistance between the measurement vector of the pixel and themean vector of the pixel’s class. Higher values in the distanceimage indicate greater spectral distances from the signaturemeans for the classes to which they are assigned, i.e., morelikely to be misclassified. A distance threshold was selectedfor each class to screen out the pixels that probably do not be-long to that class, and was determined by examining interac-tively the histogram of each class in the distance image. Pixelswith a distance value greater than the threshold were assigneda class value of zero in the thematic image.
The MLC is a parametric classifier that assumes normal ornear normal spectral distribution for each feature of interestassociated with an equal prior probability among the classes.Hence, training samples insufficient in number or non-representative of features of interest or having multimodedistributions often lead to poor classification results because ofinaccurate estimation of the mean vector and covariance ma-trix used in the MLC algorithm. In this situation, a non-para-metric classifier, such as the DTC, is more suitable to use be-cause no assumption is required. Therefore, the DTC approachwas applied to reclassify the pixels that were set to zero basedon the distance image. One critical step in using the DTC was todevelop the threshold for each LULC type (Lu, et al., 2003).These thresholds were identified based on the mean and stan-dard deviation from the sample plots for each class. As a com-parison, conventional supervised classification with MLC wasalso performed to classify the ETM+ image into the same cate-gories of LULC classes using the same training sample data.
In urban landscape analysis, land use data are often moreuseful than land cover data because of their pertinence to plan-ning and environmental management issues. Further deriva-tion of land use data from a classified land cover image is oftendesirable. Having considered LULC characteristics and applica-tions of the study area, the classified LULC image was finallymerged into six classes: urban, residential, pasture and agricul-tural lands, grass, forest, and water. Pasture and cropland werecombined since they have similar spectral responses and frac-tions. The wetland areas were very limited in extent, and weretherefore merged into either forest or water depending on theircharacteristics. To improve the classification results betweengrass, pasture, and crops, the following rules were applied tothe classified images developed using the SMA-based and MLCapproaches, respectively: (1) when grasses were confused withpasture or crops in urban or residential areas, these pasture orcrops were re-grouped as grass, and (2) when pasture or cropswere misclassified as grass in the agricultural areas, they weremerged into pasture-agricultural lands.
Accuracy assessment is considered an important part inLULC classification (Foody, 2002). The meaning and calcula-tion for overall accuracy, producer’s accuracy, user’s accuracy,and kappa coefficient have been described extensively in theliterature (Congalton and Mead, 1983; Hudson and Ramm,1987; Congalton, 1991; Janssen and van der Wel, 1994;Kalkhan, et al., 1997; Smits, et al., 1999; Foody, 2002). Theerror matrix is the most frequently used method for quantita-tively analyzing LULC classification accuracy and was used inthis paper. The accuracies of the classified images werechecked with a stratified random sampling method using atotal of 150 samples. The reference data were collected fromlarge-scale aerial photographs. Overall accuracy, producer’saccuracy, and user’s accuracy were calculated based on theerror matrices for both classification results, as well as theKHAT statistic, kappa variance, and Z statistic.
1 0 5 6 September 2004 P H OTO G R A M M E T R I C E N G I N E E R I N G & R E M OT E S E N S I N G
03-019.qxd 8/10/04 17:01 Page 1056
ResultsFraction images derived from different combinations of end-members were evaluated with visual interpretation and theerror extent and distribution in the error fraction image. Be-cause this study is more interested in characterizing urbanLULC patterns than non-urban regions, the criteria to identifythe best suitable fraction images are based on (1) high-qualityfraction images in urban regions, (2) relatively low errors inthe urban regions, and (3) the distinction among typical LULCtypes. Results indicated that a three-endmember combinationof shade/GV/impervious surface provided a satisfactory resultin urban areas, but a relatively poor performance for agricul-tural lands, especially for bare soils and pasture. In contrast,the combination of shade/GV/dark soil did not provide a satis-factory result for urban and residential areas but was suitablefor agricultural areas. Four endmembers with shade/GV/im-pervious surface/dark soil or dry soil did not provide a satis-factory fraction result either, especially for urban and residen-tial areas. The best combination of fractions was threeendmembers with shade/GV/dry soil, which showed the bestresults for both urban areas and agricultural lands. Therefore,the fraction images derived from these three endmemberswere used for LULC classification and were further examinedin the following text.
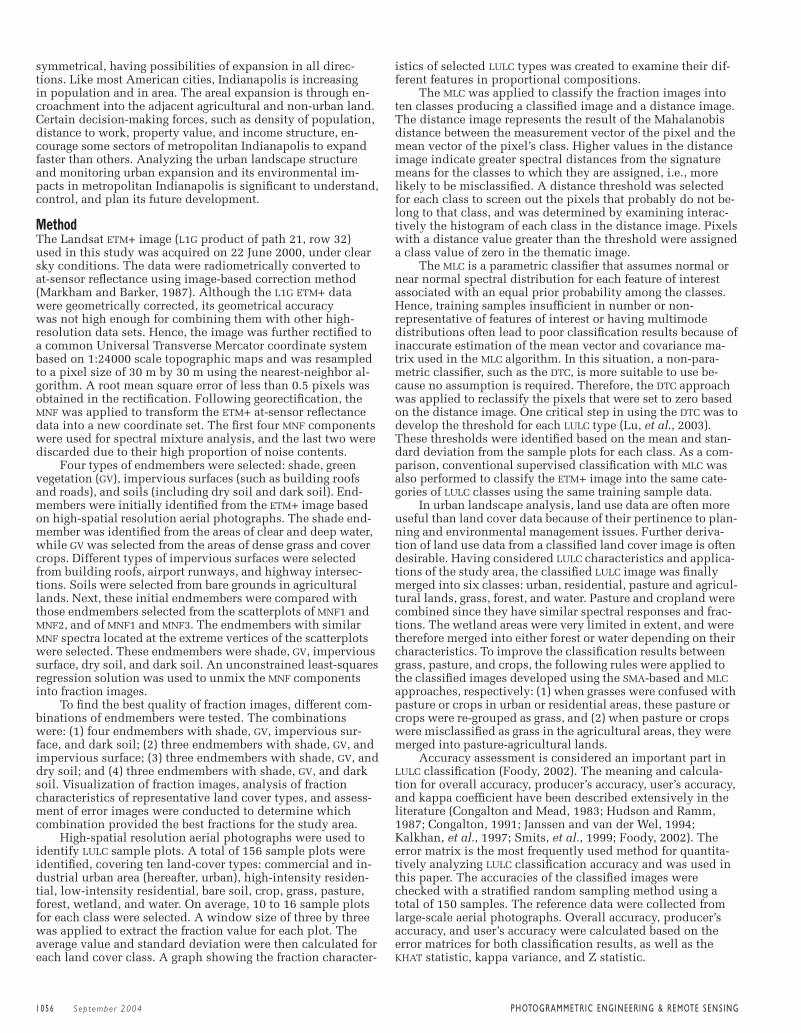
The fractions represent the areal proportions of the end-members within a pixel. Each land cover type has a distinctfraction composition. Figure 3 illustrates the three fractionimages: shade, GV, and soil. As a comparison of fraction im-ages and ETM+ image, the ETM+ panchromatic image was alsoincluded. In the shade fraction image, water appears very
bright due to its high shade fraction. This is because shadeendmember was selected from clear and deep water assumingthat shade had similar spectral characteristics with water.Urban, residential, and forest have medium shade fractionvalues as indicated by their grey tone. Grass, pasture, andagricultural lands have a dark tone, indicative of the lowestfraction of shade. In the GV fraction image, forest and densegrass/pasture appear very bright, while residential areas andagricultural lands appear grey. Urban areas, bare soils, andwater have a dark tone. The progression from areas of lowto high GV fraction is apparent in the transition from high-density urban areas with minimal vegetation cover to low-density urban areas with a large proportion of vegetationcover. In the soil fraction image, the transition from urban tohigh residential to low residential is consistent with the tonechange from white to bright grey to dark grey. Forest, water,and areas of dense grass/pasture exhibit a dark tone in the soilfraction image.
The fraction composition of each LULC type can be studiedbased on Figures 4a and 4b. The errors were not included inthese figures due to their low values clustering near zero.These diagrams were constructed after examining fractions of10 to 16 plots (3 � 3 window size) for each LULC type. Waterpossesses the highest shade fraction, but low GV and soilfractions. Forest and wetlands both have medium-high shadefractions and a high GV, but a low soil fraction. Residentialareas show a medium shade fraction and relatively low GV andsoil fractions. Grass and pasture share a similar fraction com-position. Both are low in shade and soil fractions, but are highin the GV fraction. Croplands possess a relatively small shadefraction as well as soil fraction, in contrast with a medium GVfraction. Urban areas show the highest soil fraction among theLULC types. Bare soils in agricultural lands display a fractioncomposition similar to urban areas, except that bare soils have
P H OTO G R A M M E T R I C E N G I N E E R I N G & R E M OT E S E N S I N G September 2004 1 0 5 7
Figure 3. Characteristics of three fraction images (shade,green vegetation, and soil). The fractions were developedusing a spectral mixture model based on the minimumnoise transformed images and a comparison with the ETM+panchromatic image.
Figure 4. Comparison of fraction features among differentland-use and land-cover types. 4a—Fraction compositions ofurban buildings, high- and low-residential areas, and baresoil; 4b—Fraction compositions of cropland, grassland andpasture, forest, wetland, and water.
(a)(b)
03-019.qxd 8/10/04 17:01 Page 1057

a bit higher shade and GV fractions. The soil fraction was thehighest in urban and bare soils showing intermediate valuesin high- and low-intensity residential areas, low values forcrop and pasture/grass, and lowest values in forest, wetland,and water. The shade fraction was highest for water, followedby wetland, forest, high- and low-residential areas. Crops, baresoils, and urban (buildings) all had a low shade fraction buthigher than grass/pasture. Because the GV fraction is associ-ated with vegetation abundance and biomass, it registeredthe highest value in grass/pasture/forest. Wetland/crops/low residential areas showed a medium GV fraction, whereashigh-intensity residential/soil/water/urban (buildings) placedat the lowest level.
Based on the analysis of fraction characteristics of differ-ent LULC types, a conceptual model based on the V-I-S ternarydiagram of Ridd (1995) was constructed to explain the rela-tionship among the LULC types with respect to the fractioncomposition (Figure 5). Each land cover can be regarded as alinear combination of three components: shade, GV, and soilor impervious surface. For example, soil or impervious sur-face accounts for the majority of the bare soil or urban class.The GV fraction accounts for the majority of the dense grassand pasture. The shade fraction accounts for the majorityof water and wetlands. Therefore, urban/bare soils, grass/pastures, and water/wetlands occupy the three vertices of thetriangle. Crops, forest, and residential areas are transitional inthe space of the fraction composition triangle, implying thatthey are composed of different proportions of GV, soil or im-pervious surface, and shade fractions. The proportion of cropsdepends largely on crop types and density, accounted for byGV and soil. Forest consists mainly of GV and shade fractions.Vegetation stand structure, species composition, and tree den-sity affect their fractions. In residential areas, the fractionsreflect the mixing result of their structure components, in-cluding buildings, trees, grass, and pavement. Therefore, inhigh residential areas, impervious surface and shade accountsfor most of its composition, while in low residential areas,GV and shade fractions explain the majority of variation in thefraction composition. This conceptual model would be valu-able as a guideline for urban LULC analysis using remotelysensed data.
1 0 5 8 September 2004 P H OTO G R A M M E T R I C E N G I N E E R I N G & R E M OT E S E N S I N G
Figure 5. Lu-Weng urban landscape model. The modelshows that the composition of an urban landscape is alinear combination of three fractions, shade, green vegeta-tion, and soil/impervious surface. Various urban landcover types may be deciphered in terms of proportions ofshade, green vegetation, and soil/impervious surface.
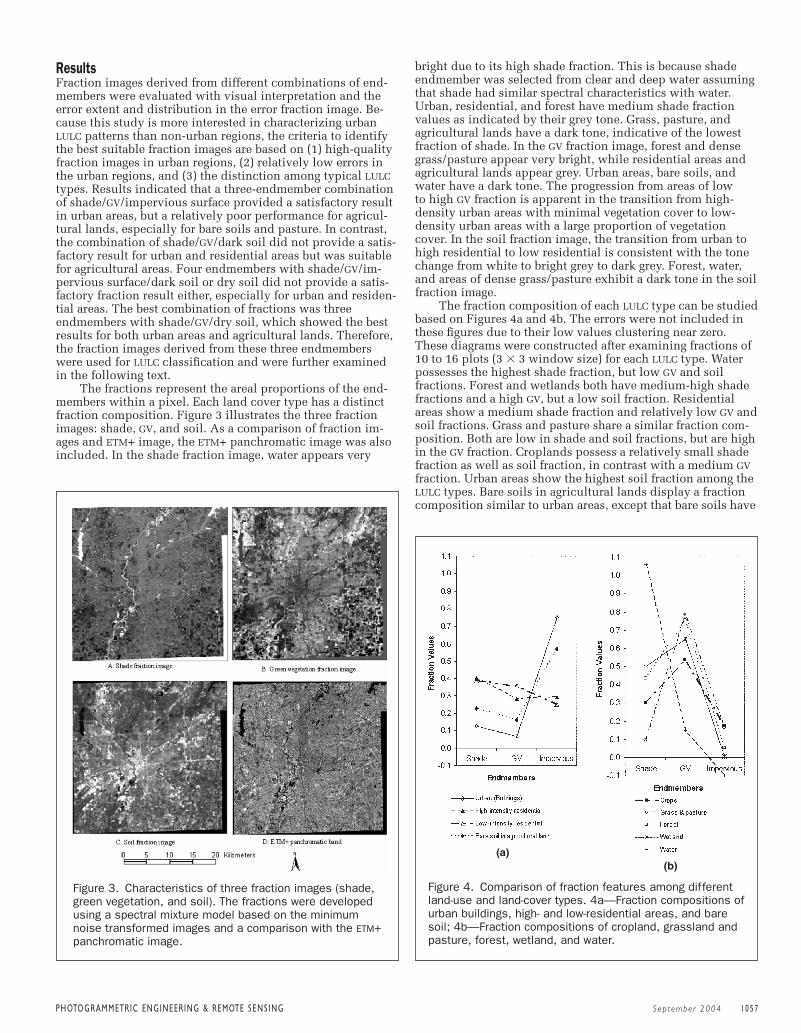
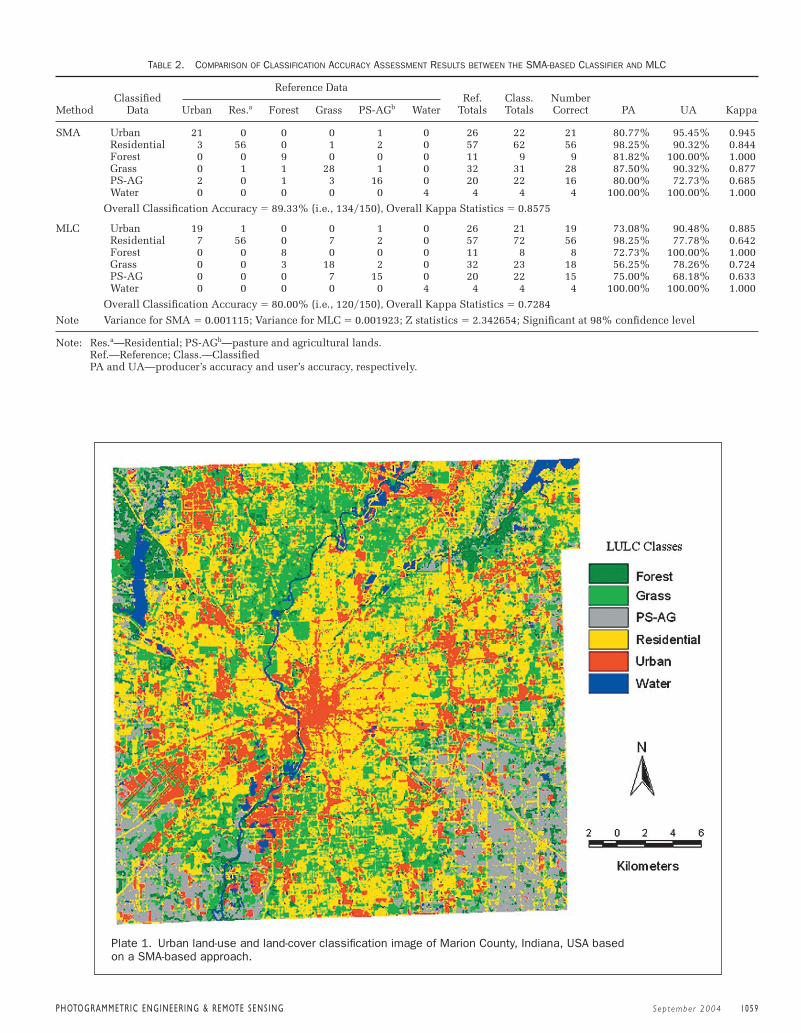
Plate 1 shows the resultant classification image fromusing the procedures described above. The main urban area islocated in the center of the Marion County, while some smalltowns and one airport are distributed around the main urbanarea. Residential areas are distributed between the main urbanareas and small towns. Forest is mainly seen in the surround-ing areas, especially around the Eagle Creek Reservoir, andin Fort Harrison State Park along Fall Creek. Agriculturallands are located in the southeastern and southwestern partsof the study area. The overall accuracy of the LULC map wasdetermined to be 89 percent using the SMA-based approach(Table 2). The classification performance of the SMA-basedapproach was a significant improvement (at a 98 percentconfidence level) over MLC (overall accuracy: 80 percent).The kappa coefficients for the two maps were 0.86 and 0.73respectively. Clearly, the LULC data derived from the SMA pro-cedure have reasonably high accuracy and are sufficient forurban landscape analysis and growth detection. The mainmisclassifications arise from: (1) roads within urban and resi-dential areas where some roads were classified as urban areasand others as residential depending on the road width and as-sociated environmental conditions along the roads, (2) confu-sion between urban and dry bare soils in pasture and agricul-tural areas, and (3) confusion among grass, pasture, and somecrops.
Discussion and ConclusionsUrban landscapes are complex and often difficult to classify.This study demonstrates that SMA is an effective approach forcharacterizing urban landscape patterns and for classifyingurban LULC. Since many LULC types tend to occur as heteroge-neous mixtures in the urban context, even when viewed atvery fine spatial scales, utilization of SMA for improving LULCclassification accuracy is especially valuable. This is particu-larly true when considering the fact that substantial increasein spatial resolution would produce compensating disadvan-tages, including increased cost and spectral variation of LULCtypes, which decreases the spectral separability of classes andreduces classification accuracy (Cao and Lam, 1997).
In SMA, endmember selection is a crucial step. The selec-tion of suitable endmembers often involves an iterativeprocess, i.e., selecting initial endmembers, refining these end-members, evaluating fraction images, and then further refiningendmembers. Finally, selected endmembers should be inde-pendent of each other. For a study area with complex land-scape structures, such as those urban areas composed of resi-dential, commercial and industrial uses, agricultural lands,and forest, identification and selection of proper endmembersfor the whole study area is often not straightforward. Two pos-sible approaches may be taken for effective derivation of end-members in an intricate urban area: (1) stratification or (2) useof multiple endmembers.
Stratification of the whole study area into smaller regionsof similar landscape structures may be necessary to facilitatethe derivation of high-quality fraction images. For example,in a study area dominated by residential, commercial, andindustrial uses, possible endmembers may be GV, shade, andimpervious surface, while in an agriculture-dominated region,endmembers may be GV, shade, and soil. If an urban areaunder investigation has a large proportion of forests, then GV,shade, and non-photosynthetic vegetation (NPV) could be themost appropriate choices of endmembers for the forestedareas. However, if GV, shade, impervious surface, soil, andNPV are used for the entire study area without stratification,the process for developing high-quality fraction images couldbe lengthy and technically difficult due to potentially highcorrelations among some endmembers, e.g., among impervi-ous surfaces, soil, and NPV.
03-019.qxd 8/10/04 17:01 Page 1058
P H OTO G R A M M E T R I C E N G I N E E R I N G & R E M OT E S E N S I N G September 2004 1 0 5 9
Plate 1. Urban land-use and land-cover classification image of Marion County, Indiana, USA basedon a SMA-based approach.
TABLE 2. COMPARISON OF CLASSIFICATION ACCURACY ASSESSMENT RESULTS BETWEEN THE SMA-BASED CLASSIFIER AND MLC
ClassifiedReference Data
Ref. Class. NumberMethod Data Urban Res.a Forest Grass PS-AGb Water Totals Totals Correct PA UA Kappa
SMA Urban 21 0 0 0 1 0 26 22 21 80.77% 95.45% 0.945Residential 3 56 0 1 2 0 57 62 56 98.25% 90.32% 0.844Forest 0 0 9 0 0 0 11 9 9 81.82% 100.00% 1.000Grass 0 1 1 28 1 0 32 31 28 87.50% 90.32% 0.877PS-AG 2 0 1 3 16 0 20 22 16 80.00% 72.73% 0.685Water 0 0 0 0 0 4 4 4 4 100.00% 100.00% 1.000
Overall Classification Accuracy � 89.33% (i.e., 134�150), Overall Kappa Statistics � 0.8575
MLC Urban 19 1 0 0 1 0 26 21 19 73.08% 90.48% 0.885Residential 7 56 0 7 2 0 57 72 56 98.25% 77.78% 0.642Forest 0 0 8 0 0 0 11 8 8 72.73% 100.00% 1.000Grass 0 0 3 18 2 0 32 23 18 56.25% 78.26% 0.724PS-AG 0 0 0 7 15 0 20 22 15 75.00% 68.18% 0.633Water 0 0 0 0 0 4 4 4 4 100.00% 100.00% 1.000
Overall Classification Accuracy � 80.00% (i.e., 120�150), Overall Kappa Statistics � 0.7284
Note Variance for SMA � 0.001115; Variance for MLC � 0.001923; Z statistics � 2.342654; Significant at 98% confidence level
Note: Res.a—Residential; PS-AGb—pasture and agricultural lands. Ref.—Reference; Class.—ClassifiedPA and UA—producer’s accuracy and user’s accuracy, respectively.
03-019.qxd 8/10/04 17:01 Page 1059

1 0 6 0 September 2004 P H OTO G R A M M E T R I C E N G I N E E R I N G & R E M OT E S E N S I N G
For most SMA studies, limited endmembers, i.e., three orfour endmembers, were used (Roberts, et al., 1998a; Small,2001; Wu and Murray, 2003). However, in a complex land-scape, a limited number of endmembers may not account forthe spectral variability of the landscape and cannot tackle themixed pixel problem. In urban regions, because of the com-plexity of impervious surfaces, identifying suitable impervi-ous surfaces as endmembers useful in SMA is often difficult,and the impervious surfaces tend to be confused with soils,although some previous research used impervious surfaceas an endmember (Rashed, et al., 2001; Phinn, et al., 2002).Moreover, different urban areas may have different impervi-ous surface types. Hence, a possible method is to use multi-ple endmember models (Roberts, et al., 1998b). The multipleendmember SMA approach permits a large number of end-members to be modeled across a scene and has shown a bet-ter performance than the standard SMA approach (Painter,et al., 1998; Roberts, et al., 1998b; Okin, et al. 2001). Thisapproach starts with a series of candidate two-endmembermodels and then evaluates each model based on three crite-ria of fraction values, root mean square error, and residualthreshold, and finally produces fraction images with thelowest error (Roberts, et al., 1998b). The multiple-endmem-ber SMA approach may be more suitable for use in urbanlandscapes.
A comparison of the V-I-S model by Ridd (1995) and thenew conceptual model developed in this paper (Lu-WengModel) will give some insights into urban LULC patterns. Inthe V-I-S model, vegetation, impervious surface, and soil areregarded as three fundamental components, but in practice,impervious surface is a complex combination of different ma-terials, and is difficult to identify because it may vary greatlyin different locations. On the other hand, shade is an impor-tant component captured by optical remote sensors. There-fore, the shade component is included in the Lu-Weng model.Impervious surface, shade, and vegetation are considered es-sential components in the urban area; while in a non-urbanregion, soil, vegetation, and shade can account for the spectralvariability. Given the importance of impervious surfaces inurban landscapes and their confusion with soils, further re-search efforts are necessary to examine the fractional charac-teristics of soils and impervious surfaces.
Another important contribution SMA makes to image pro-cessing techniques is that it provides a suitable model to de-compose the spectral mixtures of L-resolution data such asTM/ETM+. Thus, a more realistic representation of the true na-ture of a surface is possible compared with that provided bythe assignment of a single dominant class to every pixel bystatistical models (Campbell, 2002). This research indicatesthat SMA approach is suitable to solve the mixture problem inthe L-resolution data and provided better classification resultsin the urban environments than traditional per-pixel basedmaximum likelihood classifier. Fraction images may havea great potential for improving classification quality whencombined with temperature and other GIS ancillary data, pop-ulation, and other social-economic variables. This study re-veals that although fraction images can be successfully usedfor urban LULC classification, some confusions still exist. Fur-ther studies should be encouraged by incorporation of fractionimages and some ancillary data such as census, or by a combi-nation of fraction images with texture information, or by fu-sion of multisensor data such as TM/ETM+ and radar imagery,so classification accuracy should be improved.
AcknowledgmentsThe authors wish to thank the three anonymous reviewers fortheir constructive comments and suggestions. We further ac-knowledge the financial supports of University Research Com-mittee at Indiana State University through the grant #UNR184
and from the Center for the Study of Institutions, Population,and Environmental Change (CIPEC), Indiana University,through the National Science Foundation (Grant 99-06826).
ReferencesAdams, J.B., D.E. Sabol, V. Kapos, R.A. Filho, D.A. Roberts, M.O.
Smith, and A.R. Gillespie, 1995. Classification of multispectralimages based on fractions of endmembers: Application to landcover change in the Brazilian Amazon, Remote Sensing of Envi-ronment, 52:137–154.
Barnsley, M.J., and S.L. Barr, 1996. Inferring urban land use fromsatellite sensor images using kernel-based spatial reclassification,Photogrammetric Engineering & Remote Sensing, 62:949–958.
Barnsley, M.J., 1999. Digital remote sensing data and their characteris-tics, Geographical Information Systems: Principles, Techniques,Applications, and Management (Second Edition) (P. Longley, M.Goodchild, D.J. Maguire and D.W. Rhind, editors), John Wiley &Sons, New York, N.Y., pp. 451–466.
Bateson, A., and B. Curtiss, 1996. A method for manual endmemberselection and spectral unmixing, Remote Sensing of Environ-ment, 55:229–243.
Boardman, J.W., 1993. Automated spectral unmixing of AVIRIS datausing convex geometry concepts, Summaries of the Fourth JPLAirborne Geoscience Workshop, JPL Publication 93-26, NASA JetPropulsion Laboratory, Pasadena, Calif., pp. 11–14.
Boardman, J.W., and F.A. Kruse, 1994. Automated spectral analysis: Ageological example using AVIRIS data, north Grapevine Moun-tains, Nevada, Proceedings, ERIM Tenth Thematic Conference onGeologic Remote Sensing, Ann Arbor, MI, pp. 407–418.
Boardman, J.M., F.A. Kruse, and R.O. Green, 1995. Mapping target sig-nature via partial unmixing of AVIRIS data, Summaries of theFifth JPL Airborne Earth Science Workshop, JPL Publication 95–1,NASA Jet Propulsion Laboratory, Pasadena, Calif., pp. 23–26.
Campbell, J.B., 2002. Introduction to Remote Sensing (3rd Edition),The Guilford Press, New York, N.Y., 621 p.
Cao, C., and N.S.N. Lam, 1997. Understanding the scale and resolu-tion effects in remote sensing and GIS, Scale in Remote Sensingand GIS, (D.A. Quattrochi and M.F. Goodchild, editors), LewisPublishers, Boca Raton, FL, pp. 57–72.
Chen, C.-M., G.F. Hepner, and R.R. Forster, 2003. Fusion of hyper-spectral and radar data using the IHS transformation to enhanceurban surface features, ISPRS Journal of Photogrammetry andRemote Sensing, 58:19–30.
Chen, S., S. Zheng, and C. Xie, 2000. Remote sensing and GIS forurban growth in China, Photogrammetric Engineering & RemoteSensing, 66:593–598.
Congalton, R.G., 1991. A review of assessing the accuracy of classifi-cation of remotely sensed data, Remote Sensing of Environment,37:35–46.
Congalton, R.G., and R.A. Mead, 1983. A quantitative method to testfor consistency and correctness in photo interpretation, Pho-togrammetric Engineering & Remote Sensing, 49:69–74.
Cracknell, A.P., 1998. Synergy in remote sensing—what’s in a pixel?International Journal of Remote Sensing, 19:2025–2047.
ENVI, 2000. ENVI User’s Guide. Research Systems Inc., Boulder,Colorado, 930 p.
Epstein, J., K. Payne, and E. Kramer, 2002. Techniques for mappingsuburban sprawl, Photogrammetric Engineering & Remote Sens-ing, 63:913–918.
Fisher, P., 1997. The pixel: A snare and a delusion, International Jour-nal of Remote Sensing, 18:679–685.
Foody, G.M., 2002. Status of land cover classification accuracy assess-ment, Remote Sensing of Environment, 80:185–201.
Gong, P., and P.J. Howarth, 1990. The use of structure information forimproving land-cover classification accuracies at the rural-urbanfringe, Photogrammetric Engineering & Remote Sensing,56:67–73.
Gluch, R., 2002. Urban growth detection using texture analysis onmerged Landsat TM and SPOT-P data, Photogrammetric Engi-neering & Remote Sensing, 68:1283–1288.
03-019.qxd 8/10/04 17:01 Page 1060

Green, A.A., M. Berman, P. Switzer, and M.D. Craig, 1988. A trans-formation for ordering multispectral data in terms of imagequality with implications for noise removal, IEEE Transactionson Geoscience and Remote Sensing, 26:65–74.
Haack, B.N., E.K. Solomon, M.A. Bechdol, and N.D. Herold, 2002.Radar and optical data comparison/integration for urban deline-ation: A case study, Photogrammetric Engineering & RemoteSensing, 68:1289–1296.
Harris, P.M., and S.J. Ventura, 1995. The integration of geographicdata with remotely sensed imagery to improve classification in anurban area, Photogrammetric Engineering & Remote Sensing,61:993–998.
Hudson, W.D., and C.W. Ramm, 1987. Correct formulation of theKappa coefficient of agreement, Photogrammetric Engineering &Remote Sensing, 53:421–422.
Hung, M., and M.K. Ridd, 2002. A subpixel classifier for urban land-cover mapping based on a maximum-likelihood approach andexpert system rules, Photogrammetric Engineering & RemoteSensing, 68:1173–1180.
Janssen, L.F.J., and F.J.M. van der Wel, 1994. Accuracy assessment ofsatellite derived land-cover data: A review, PhotogrammetricEngineering & Remote Sensing, 60:419–426.
Jensen, J.R., 1996. Introductory Digital Image Processing: A RemoteSensing Perspective (2nd Edition), Prentice Hall, Upper SaddleRiver, New Jersey, 318 p.
Jensen, J.R., 2000. Remote Sensing of the Environment: An EarthResource Perspective, Prentice Hall, Upper Saddle River, NewJersey, 544 p.
Kalkhan, M.A., R.M. Reich, and R.L. Czaplewski, 1997. Varianceestimates and confidence intervals for the Kappa measure ofclassification accuracy, Canadian Journal of Remote Sensing,23:210–216.
Lo, C.P., 1995. Automated population and dwelling unit estimationfrom high-resolution satellite images: A GIS approach, Interna-tional Journal of Remote Sensing, 16:17–34.
Lo, C.P., D. Quattrochi, and J. Luvall, 1997. Application of high-resolution thermal infrared remote sensing and GIS to assess theurban heat island effect, International Journal of Remote Sensing,18:287–304.
Lu, D., M. Batistella, and E. Moran, 2002. Linear Spectral MixtureAnalysis of TM Data for Land-use and Land-Cover Classificationin Rondonia, Brazilian Amazon, Proceedings of the ISPRSCommission IV Symposium: Geospatial Theory, Processing andApplications, (C. Armenakis and Y.C. Lee, editors), Published byCenter for Topographic Information Mapping Services Branch,Geomatics Canada, Department of Natural Resources Canada,Ottawa, Canada, pp. 557–562.
Lu, D., E. Moran, and M. Batistella, 2003. Linear mixture modelapplied to Amazonian vegetation classification, Remote Sensingof Environment, 87:456–469.
Madhavan, B.B., S. Kubo, N. Kurisaki, and T.V.L.N. Sivakumar, 2001.Appraising the anatomy and spatial growth of the BangkokMetropolitan area using a vegetation-impervious-soil modelthrough remote sensing, International Journal of Remote Sensing,22:789–806.
Markham, B.L., and J.L. Barker, 1987. Thematic Mapper bandpasssolar exoatmospheric irradiances, International Journal ofRemote Sensing, 8:517–523.
Mesev, V., 1998. The use of census data in urban image classification,Photogrammetric Engineering & Remote Sensing, 64:431–438.
Myint, S.W., 2001. A robust texture analysis and classification ap-proach for urban land-use and land-cover feature discrimination,Geocarto International, 16:27–38.
Okin, G.S., D.A. Roberts, B. Murray, and W.J. Okin, 2001. Practicallimits on hyperspectral vegetation discrimination in arid andsemiarid environments, Remote Sensing of Environment, 77:212–225.
Painter, T.H., D.A. Roberts, R.O. Green, and J. Dozier, 1998. Theeffects of grain size on spectral mixture analysis of snow-coveredarea from AVIRIS data, Remote Sensing of Environment, 65:320–332.
Phinn, S., M. Stanford, P. Scarth, A.T. Murray, and P.T. Shyy, 2002.Monitoring the composition of urban environments based on the
vegetation-impervious surface-soil (VIS) model by subpixelanalysis techniques, International Journal of Remote Sensing,23:4131–4153.
Quarmby, N.A., J.R.G. Townshend, J.J. Settle, and K.H. White, 1992.Linear mixture modeling applied to AVHRR data for crop areaestimation, International Journal of Remote Sensing, 13:415–425.
Quattrochi, D.A., J.C. Luvall, D.L. Rickman, M.G. Estes, C.A. Laymon,and B.F. Howell, 2000. A decision support information system forurban landscape management using thermal infrared data, Pho-togrammetric Engineering & Remote Sensing, 66:1195–1207.
Rashed, T., J.R. Weeks, M.S. Gadalla, and A.G. Hill, 2001. Revealingthe anatomy of cities through spectral mixture analysis of multi-sepctral satellite imagery: A case study of the Greater Cairo re-gion, Egypt, Geocarto International, 16:5–15.
Ridd, M.K., 1995. Exploring a V-I-S (Vegetation-Impervious Surface-Soil) model for urban ecosystem analysis through remote sensing:Comparative anatomy for cities, International Journal of RemoteSensing, 16:2165–2185.
Roberts, D.A., M.O. Smith, and J.B. Adams, 1993. Green vegetation,non-photosynthetic vegetation, and soils in AVIRIS data, RemoteSensing of Environment, 44:255–269.
Roberts, D.A., G.T. Batista, J.L.G. Pereira, E.K. Waller, and B.W. Nelson,1998a. Change identification using multitemporal spectral mix-ture analysis: Applications in eastern Amazônia, Remote SensingChange Detection: Environmental Monitoring Methods and Appli-cations (R.S. Lunetta and C.D. Elvidge, editors), Ann Arbor Press,Ann Arbor, Mich., pp. 137–161.
Roberts, D.A., M. Gardner, R. Church, S. Ustin, G. Scheer, and R.O.Green, 1998b, Mapping chaparral in the Santa Monica mountainsusing multiple endmember spectral mixture models, RemoteSensing of Environment, 65:267–279.
Settle, J.J., and N.A. Drake, 1993. Linear mixing and the estimation ofground cover proportions, International Journal of Remote Sens-ing, 14:1159–1177.
Shaban, M.A., and O. Dikshit, 2001. Improvement of classification inurban areas by the use of textural features: The case study ofLucknow city, Uttar Pradesh, International Journal of RemoteSensing, 22:565–593.
Small, C., 2001. Estimation of urban vegetation abundance by spectralmixture analysis, International Journal of Remote Sensing,22:1305–1334.
Small, C., 2002. Multitemporal analysis of urban reflectance, RemoteSensing of Environment, 81:427–442.
Smith, M.O., S.L. Ustin, J.B. Adams, and A.R. Gillespie, 1990. Vegeta-tion in Deserts: I. A regional measure of abundance from multi-spectral images, Remote Sensing of Environment, 31:1–26.
Smits, P.C., S.G. Dellepiane, and R.A. Schowengerdt, 1999. Qualityassessment of image classification algorithms for land-cover map-ping: A review and a proposal for a cost-based approach, Interna-tional Journal of Remote Sensing, 20:1461–1486.
Stefanov, W.L., M.S. Ramsey, and P.R. Christensen, 2001. Monitoringurban land cover change: An expert system approach to landcover classification of semiarid to arid urban centers, RemoteSensing of Environment, 77:173–185.
Strahler, A.H., C.E. Woodcock, and J.A. Smith, 1986. On the nature ofmodels in remote sensing, Remote Sensing of Environment,70:121–139.
Stuckens, J., P.R. Coppin, and M.E. Bauer, 2000. Integrating contextualinformation with per-pixel classification for improved land coverclassification, Remote Sensing of Environment, 71:282–296.
Thomson, C.N., and P. Hardin, 2000. Remote sensing/GIS integrationto identify potential low-income housing sites, Cities, 17:97–109.
Van der Meer, F., and S.M. de Jong, 2000. Improving the results ofspectral unmixing of Landsat Thematic Mapper imagery byenhancing the orthogonality of end-members, InternationalJournal of Remote Sensing, 21:2781–97.
Ward, D., S.R. Phinn, and A.L. Murray, 2000. Monitoring growth inrapidly urbanizing areas using remotely sensed data, ProfessionalGeographer, 53:371–386.
Weng, Q., 2001. A remote sensing-GIS evaluation of urban expansionand its impact on surface temperature in the Zhujiang Delta,China, International Journal of Remote Sensing, 22:1999–2014.
P H OTO G R A M M E T R I C E N G I N E E R I N G & R E M OT E S E N S I N G September 2004 1 0 6 1
03-019.qxd 8/10/04 17:01 Page 1061

Wu, C., and A.T. Murray, 2003. Estimating impervious surface distrib-ution by spectral mixture analysis, Remote Sensing of Environ-ment, 84:493–505.
Zha, Y., J. Gao, and S. Ni, 2003. Use of normalized difference built-upindex in automatically mapping urban areas from TM imagery,International Journal of Remote Sensing, 24:583–594.
Zhang, J., and G.M. Foody, 2001. Fully-fuzzy supervised classificationof sub-urban land cover from remotely sensed imagery: Statisticalneural network approaches, International Journal of RemoteSensing, 22:615–628.
Zhang, Q., J. Wang, X. Peng, P. Gong, and P. Shi, 2002. Urban built-upland change detection with road density and spectral informationfrom multitemporal Landsat TM data, International Journal ofRemote Sensing, 23:3057–3078.
Zhu, G., and D.G. Blumberg, 2002. Classification using ASTER dataand SVM algorithms: The case study of Beer Sheva, Israel, Re-mote Sensing of Environment, 80:233–240.
(Received 07 February 2003; accepted 24 July 2003; revised 22 August2003)
1 0 6 2 September 2004 P H OTO G R A M M E T R I C E N G I N E E R I N G & R E M OT E S E N S I N G
03-019.qxd 8/10/04 17:01 Page 1062