spectral measurements of visible solar direct-normal irradiance and air pollutant attenuation...
TRANSCRIPT

~ Pergamon 0960-1481 (95)00118-2
D A T A B A N K
Renewable Eneryy, Vol. 7, No. 1, pp. 81 88, 1996 Copyright .c) 1996 Elsevier Science Ltd
Printed in Great Britain. All rights reserved 0960-1481/96 $15.00 + 0.00
Spectral measurements of visible solar direct-normal irradiance and air pollutant attenuation coefficients at Helwan
M. A. MOSALAM SHALTOUT, U. ALI RAHOMA, and A. FATHY National Research Institute of Ast ronomy and Geophysics, Helwan, Cairo, Egypt
(Received 7 July 1995; accepted 10 September 1995)
Abstrac~Solar radiation spectra were measured by a ground-level pyrheliometer (Eppley NIP) equipped with a filter wheel. Three flat, circular, Schott filters were used to define three spectral bands. The filters were large band-pass filters of the types OG530, RG630 and RG695. The experiment was conducted from June 1991 to May 1992 on the roof of the new building of the National Research Institute of Ast ronomy and Geophysics (NRIAG) at Helwan. The Linke turbidity factor for the integrated radiation, and the spectral at tentuation coefficients of solar energy caused by aerosols were computed. In comparison with earlier measurements in 1910, 1967 and 1987, it is clear that there is a continuous increase in the turbidity factor, due to an increase of industrial waste in the Helwan atmosphere. A correlation analysis between the turbidity factors and the total suspended particles, smoke and sulphur dioxide was carried out. Meteorological elements and sand storms have been taken into consideration in the correlation analysis.
I. I N T R O D U C T I O N
The study of atmospheric contaminants in the greater Cairo area, which includes the big industrial centre at Helwan, started in 1960. Most of these studies were conducted on particulate matter, being the most noticeable and objec- tionable form of air pollution in that area. The annual mean rate of dust deposits varied widely from one sector to another in the city of Cairo, from 242 ton/mile2/month in a residential area with industrial and commercial activities, to 21.2 ton/ mile2/month in a purely residential area surrounded by cul- tivated land. The highest average values of dust deposit, all over the city, were found in the spring, which is characterized by the passage of the hot Khamasin storms that are loaded with dust and sand [1]. Deposited dust resulting from such storms varied in the mean from 15.6 to 23.1 ton/mile2/storm. However, following up the studies of dust deposits in the city of Cairo, showed without doubt that industry was wrongly placed in and around Cairo and that industrial and com- mercial activities are not less important than natural phenomena when considering the problem of dust deposition in the city [2]. This conclusion was reconfirmed by studies of air pollution in the heavy industrial centre at Helwan, about 20 km south of Cairo. The total deposited dust found in that area during the year (1967) ranged from 70.9 ton/ mile2/month in June, to 384.7 ton/mile2/month in December. The average rate for the month of April, when Khamasin dust s torms were more frequent, was found to be 117.6 ton/mile 2 in 1967 [3]. Industrial activities, scattered all over the area, were the main source of these enormous amounts of deposit, in particular the cement, iron and steel industries [4]. Using automatic smoke samplers, the atmospheric con- tent of the smoke and particulate matter was studied thoroughly in the greater Cairo area, including the Helwan and Shubra E1 Kheima industrial centres [5]. The effects of suspended particulate matter on atmospheric turbidity, visibility, incoming solar radiation, and gaseous pollution of
81
the atmosphere of the greater Cairo area were first studied in the Helwan industrial sector [3]. The study included some scattered measurements of carbon monoxide, sulphur diox- ide, nitrogen oxide and hydrocarbons. Outside of the immediate vicinity of industrial plants, the concentrations of these pollutants were negligible. The results for another study measuring the amount of deposited particulate matter over Helwan [6] are given in Table 1.
A study of the limits on carbon monoxide in different units of the iron and steel industry [7], and the actual results are also given in Table 2.
Table 1. Amount of deposited particles over Helwan
Year Sand (ton/mile2/month)
1967 145 1974 315 1978 377 1988 > 500
Table 2. Limit of carbon monoxide in different units in the iron and steel company
Accepted July Place Pollutants limit 1987
Blast furnace 3 CO 50 P.P.M. 100 500 Blast furnace 4 CO 50 P.P.M. 150 500 Gases mixing station CO 50 P.P.M. 10(~500
P.P.M. = parts per million.

82 Data
2. THE PURPOSE OF THE P R E S E NT W O R K
(1) To determine the 'clean' air or background turbidity and its geographical, seasonal, and long-term variation.
(2) To investigate the interaction between cities and turbidity.
(3) To detect the occurrence of any unusual air pollutants. (4) To provide information on the a tmosphere 's optical
quality, as it may be related to the distribution of the aerosol and gaseous pollution of the atmosphere.
(5) To calculate the turbidity factor and atmospheric transparency.
(6) To compare the results with the results of earlier studies about Helwan.
(7) To compare three different methods to calculate the turbidity factor. This is for the integrated radiation and spectral distribution of direct solar irradiance at ground level.
3. CLIMATIC CONDITIO NS OF H E L W A N IN THE STUDIED YEAR
At Helwan, the diurnal variation in the figures for poor visibility observations less or equal to 8 km, for one year from June 1991 to May 1992, have been compared with similar observations shown in Table 3. The mean values of seasonal variation shown in Fig. 1 show the monthly mean variations of temperature, humidity, visibility and direction of wind at Helwan.
The best visibility time is at noon in the months of April and May [Fig. l(b)], while August and December have bad visibility. In August this is due to high dispersion storms resulting from high temperatures [Fig. l(a)], while in December it is due to the lower average temperature and higher humidity [Fig. l(a)].
4. INTENSITY OF DIRECT SOLAR RADIATION M E A S U R E M E N T S
The values of solar radiation were measured at normal incidence at Helwan Observatory from February 1914 to December 1923 for air mass m = 1 and 2 [9]. Another study obtained hourly rates of total solar radiation at normal inci- dence for clear sky conditions from 1922 to 1927. The measurements were carried out for each mon th of the year, at the same site during 1967, i.e. Helwan observatory, under clear sky conditions. This comparative study showed that a significant amount of solar radiation is lost as a result of increasing air pollution levels in the atmosphere above Hel- wan [5]. This is also shown to be true from other studies on air pollution and solar radiation in the Helwan industrial area from 1967 to 1977 [10]. Various aspects of the solar energy distributions over Egypt can be read from the Egyp-
Table 3. Parameter for various degrees of atmospheric cleanliness
(according to ref. [8])
Atmosphere Visibility
Clean 340 Clear 28 Turbid 11 Very turbid < 5
Bank
tian Solar Radiation Atlas [11], which shows an exceptional decrease in solar radiation in two areas: the Cairo area due to air pollution [12], and the Eastern Owienat area due to rising sand storms in the deep desert and the effect of tropical clouds [13 15]. Using full tracking systems increases the flux of solar energy by about 50% in the south and by 35% in the north of Egypt on the annual average [16].
The present work aims to compare the intensity of direct solar radiation at Helwan and study the spectral distribution in different bands:
21 < 530 nm 530 < 22 < 630 nm 630 < 23 < 695 nm 695 n m < 24
measured during the period from June 1991 to May 1992, to show the increase in air pollution and hence the decrease in solar radiation in the Helwan area during the last decade.
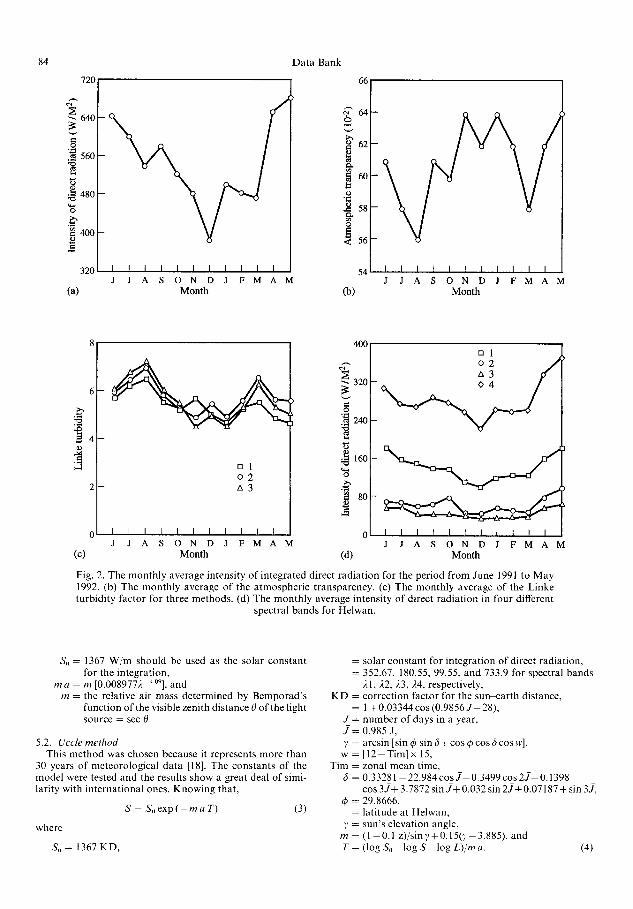
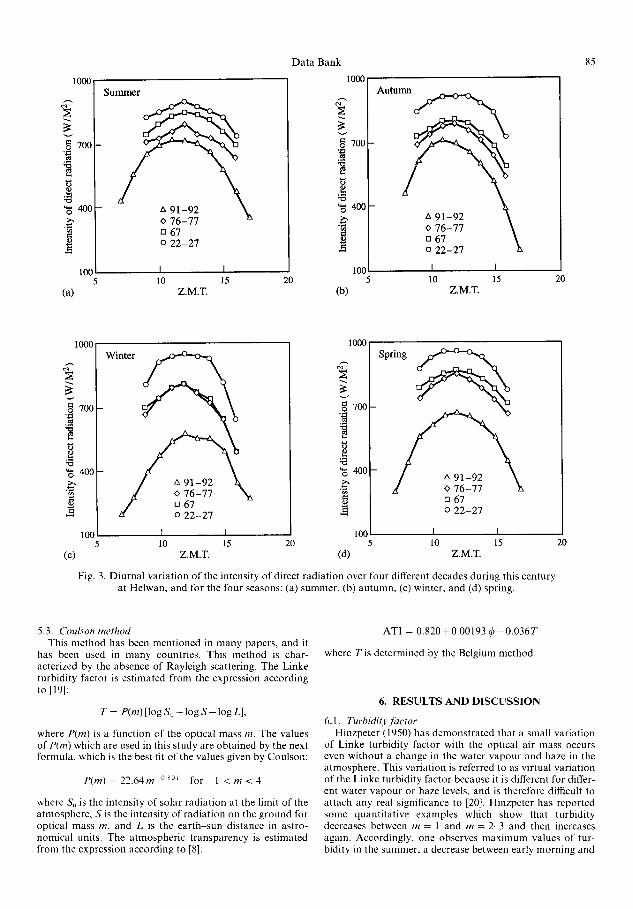
However, the radiation intensities for the months of the year studied were averaged over the days in each month. The results in Fig. 2(a) show the monthly average intensity of direct radiation throughout that year. The intensity of the direct solar radiation in the different bands, 21, 22, 23 and 24, is represented by 1, 2, 3, and 4, respectively. The results shown in Fig. 2(b) show the monthly average atmospheric transparency values throughout that year. The winter mon- ths have lower radiation due to the effect of changes in meteorological conditions on the variation in radiation, shown in Fig. l(a). It is clear that temperature ranges and humidity reach lower values than in previous studies. Al though the atmospheric pollutants are highly concentrated in the winter months (from December to February), the accumulation of these emissions occurs near the ground level. High increases in humidity and decreases in temperature relate to the high water vapour content over Helwan, while in the summer, pollutants diffuse in the whole atmosphere, especially in cloudless skies when there are relatively high temperatures and low humidity. These factors, which charac- terize the summer in Egypt, tend to build up strong con- vection currents which are able to diffuse the atmospheric pollutants. It is clear that the noon values are significantly higher in comparison with the morning and afternoon values, except in winter time, when the noon values are nearly the same as the afternoon values. They are, however, still higher than the morning values and seem to be about the same during midsummer. The above-mentioned features can mainly be attributed to the position of the sun around mid- day in comparison to the morning and afternoon. The dis- crepancy between morning and afternoon may be related to the discrepancy in the pollution level and the different amounts of water vapour and aerosols in the atmosphere. Comparing the values of the four studies clearly shows that the solar radiation intensities decreased from 1967 to 1976- 1977 and 1991-1992 more gradually than between 1914 and 1923, shown in Fig. 3(c). This is expected, since industry only began to develop in Helwan in 1950. The presence of atmospheric contaminants greatly reduces the solar energy received on the earth 's surface. However, this decrease was sharp between 1991 and 1992, and small from 1976 to 1977 and in 1967. This can be attributed to the rapid growth in industry from 1950 to the present day, compared with less progress during the last 10 years.
The annual mean values of intensity of the direct solar radiation at Helwan from 1914 to 1923 were 2(~40% in the summer, 23~45% in the autumn, 3 0 ~ 5 % in the winter, and

8O
,~ 60
i 4° }2o
0
(a)
o H
I L I I I I I i t t t J J A S O N D J F M A M
Month
Data Bank
8
6
~z
0
(b)
I I I I I I I I I I I J J A S O N D J F M A M
Month
83
N
, ~ 6
.a 3
o 91-92 O 76-77 n 2 2 - 2 7
(c) (d) J J A S O N D J F M A M
Month
NW
\
NE
E \ ES
Fig. 1. Monthly variation of the means of (a) ambient air pressure, (b) relative humidity, (c) visibility, and (d) the annual wind directions as a percentage at Helwan.
3045% in the spring. The spectral distribution of direct solar irradiance at ground level makes it possible to compute the spectral attenuation coefficients of solar radiation caused by aerosols with respect to 21, 22, 23, and 24, represented by 352.67, 180.55, 99.85, and 733.9 nm, respectively. However, the noon values are significantly higher than the morning and afternoon values.
5. METHODS OF COMPUTATION AND RESULTS
5.1. Linke method To measure the haze and water vapour content of the
atmosphere, Linke (1922) introduced a turbidity factor and compared the complex extinction coefficient for total radi- ation (of all wavelengths) [17], with the extinction of a clean, dry (Rayleigh) atmosphere. The turbidity factor for total
radiation of all wavelengths is defined by the equation:
S = S0 exp ( - Ta(m)m), ( 1 )
where So = ~ S0(2) d(2) represents the extraterrestrial solar radiation and a (m) is the mean value over all wavelengths of the extinction coefficient in a clean, dry atmosphere (weighted according to the distribution of transmitted energy). From eq. (1), a formula for the computation of the turbidity is easily deduced:
T - P(m)[log So -- log S-- log L], (2)
where
P(m) = [m a (m) log e] 1 e = the base of natural logarithms, L = the reduction factor for mean solar distance,
7 2 0
i e-i
~ 6 4 0
o
; ~ 4 8 0
"8
4 0 0
3 2 0
(a)
84 D a t a Bank
66
~-" 64 6
~ 6 2
60
58 e~
, 6
I [ I I I I I I I I I 5 4 I I I [ I I I I I I I J J A S O N D J F M A M J J A S O N D J F M A M
Month (b) Month
6 4
n l 0 2 zx3
(c)
400
•320
i~ 240
.~160
..~ co
8 0
I I I I I I l l l l f 0 J J A S O N D J F M A M
M o n ~ (d)
u l
A 3
I I I [ I [ I I I P I J J A S O N D J F M A M
Month
Fig. 2. The m o n t h l y average in tensi ty of in tegra ted direct r ad i a t i on for the per iod f rom June 1991 to M a y 1992. (b) The m o n t h l y average of the a tmospher i c t ransparency . (c) The mon th ly average of the Linke tu rb id i ty fac tor for three methods . (d) The m o n t h l y average in tensi ty of direct r ad ia t ion in four different
spectral bands for Helwan.
S0 = 1367 W / m should be used as the solar cons tan t = for the in tegra t ion , =
m a = m [0.0089772 409], and m = the relat ive air mass de te rmined by Bemporad ' s K D =
funct ion of the visible zeni th d is tance 0 of the l ight = s o u r c e = s e c 0 . J =
j ~
5.2. U c c l e m e t h o d 7 -
This me thod was chosen because it represents more than w = 30 years of meteoro log ica l da t a [18]. The cons tan t s of the Tim = model were tested and the results show a great deal o f simi- 6 = lar i ty wi th in te rna t iona l ones. K n o w i n g that ,
q~= S - So exp ( - m a T) (3) =
where 7 = m -
S,, = 1367 KD, T =
solar cons tan t for in tegra t ion of direct rad ia t ion , 352.67, 180.55, 99.55, and 733.9 for spectral bands 21, 22, ).3, ).4, respectively, cor rec t ion factor for the s u n ~ a r t h dis tance, 1 + 0.03344 cos (0.9856 J - 28), n u m b e r of days in a year, 0.985 J, arcsin [sin q~ sin 6 + cos 0 cos 6 cos w], [ 1 2 - T i m ] x 15, zona l mean time, 0.33281 - 22.984 cos J - 0.3499 cos 2 J - 0.1398 cos 3at+ 3.7872 sin J + 0.032 sin 2 J + 0.07187 + sin 3J, 29.8666, la t i tude at Helwan, sun 's e levat ion angle, (1 - 0.1 z)/sin 7 + 0.15(7 - 3.885), and (log So log S log L ) / m a . (4)
Data Bank
1000
cq
700
~'~ 400
100 5
(a)
S u m m e r
[ ] 67 o 22-27
I I
Autumn
o ~ 700
"~ 400
10 I5 20 Z.M.T. (b)
100 I I 10 15 20
Z.M.T.
85
looO
o = 7 o o
.~.
'~ 400
IOOO
_ Winter ~
0 76-77 . / [] 67 z~ o 22-27
1000
&-
700
"~ 400
Spring
[] 67 o 22-27
100 1 I 1 0 0 I I 10 15 20 l0 15
(c) Z.M.T. (d) Z.M.T. 20
Fig. 3. Diurnal variation of the intensity of direct radiation over four different decades during this century at Helwan, and for the four seasons: (a) summer, (b) autumn, (c) winter, and (d) spring.
5.3. Coulson method This method has been mentioned in many papers, and it
has been used in many countries. This method is char- acterized by the absence of Rayleigh scattering. The Linke turbidity factor is estimated from the expression according to [19]:
T = P(m) [log So -- log S - log L],
where P(m) is a function of the optical mass m. The values of P(m) which are used in this study are obtained by the next formula, which is the best fit of the values given by Coulson:
P(m) = 22.64m 0~0t for 1 < m < 4
where So is the intensity of solar radiation at the limit of the atmosphere, S is the intensity of radiation on the ground for optical mass m, and L is the earth-sun distance in astro- nomical units. The atmospheric transparency is estimated from the expression according to [8]:
ATI = 0.820+0.00193 ~b-0.036T
where T is determined by the Belgium method.
6. RESULTS AND DISCUSSION
6.1. Turbidity J~tctor Hinzpeter (1950) has demonstrated that a small variation
of Linke turbidity factor with the optical air mass occurs even without a change in the water vapour and haze in the atmosphere. This variation is referred to as virtual variation of the Linke turbidity factor because it is different for differ- ent water vapour or haze levels, and is therefore difficult to attach any real significance to [20]. Hinzpeter has reported some quantitative examples which show that turbidity decreases between m = 1 and m = 2-3 and then increases again. Accordingly, one observes maximum values of" tur- bidity in the summer, a decrease between early morning and

86 Data Bank
afternoon and an increase towards sunset. The Linke factor was obtained from the radiation measurements. The summer values of these coefficients were found to be larger than their winter values [21].
For more evaluation of the influence of air pollution on the atmospheric environment, it would be necessary to cal- culate the atmospheric turbidity, which can be directly related to the amoun t of particulate pollution in the atmo- sphere above a specific area. The Linke turbidity factor at ground level with respect to the intensity of direct radiation can be calculated by the three methods: those of Belgium, Coulson, and Bourger (represented by 1, 2, and 3, respec- tively in Fig. 5). However, the calculated Linke turbidity factors for the different hours of the day (between 07:00 and 17:00) of zonal mean time from June 1991 to May 1992 are present as yearly average values for Helwan.
The calculated Linke turbidity factors for the spectral distribution of direct solar irradiance at ground level for 21,
22, 23 and 24 determined for the different hours of the day are presented for the Belgium method, as shown in Fig. 4. All the figures clearly show the important features of the diurnal variations for the mean morning, noon and afternoon values. This illustrates the higher values of the midday tur- bidity in comparison with the morning and afternoon values. (The afternoon values were lower in general.) The relative increase of the noon values is similar for each month. This can be noted by comparing the values for the winter months , which show a big variation between noon and afternoon values, compared with other months of the year. The pro- nounced difference between noon and morning values, in comparison with the afternoon values during winter time, may be attributed to the relatively higher variation in the water vapour level in the atmosphere, as shown in Fig. 1 (a).
From Figs 4 and 5 it is noticed that the Linke turbidity factor (T) increases generally from winter to spring with a max imum peak in March. It remains high during the
12
(a)
Summer
I I 10 15
Z.M.T.
' , 1 0 2 n 3 0 4
20 (b)
12 A u t u m n
I I I0 15
Z.M.T.
ZXl O 2 m3 o 4
20
12
8
Winter
(c)
A1 0 2 u 3 0 4
12 S p r i n g ZXl
0 2 u 3 o 4
I I I I 10 15 20 10 15
Z.M.T. (d) Z.M.T.
Fig. 4. Diurnal variation of Linke turbidity factors for four spectral bands at Helwan, calculated by the Belgium method for the four seasons, (a) summer, (b) au tumn, (c) winter, and (d) spring. (The numbers 1,
2, 3, and 4 represent the spectral bands 2~, 22, 23, and 24, respectively.)
20

Data Bank 87
(a)
12 Summer
i
I I 10 15
Z.M.T.
12 zxl 0 2 o 3
9
3
0 20
(b)
A u t u m n
I I
ZXl 0 2 n 3
10 15 20 Z.M.T.
(c)
12
g~
3
Winter ZXl O2 o 3
I I
12 Spring ,x 1
O2 o 3
3
0 I I 10 15 20 5 10 15 20
Z.M.T. (d) Z.M.T.
Fig. 5. Diurnal variation of Linke turbidity factors calculated by three different methods at Helwan: Belgium method (1), Coulson method (2), and Bourger method (3) for the four seasons, (a) summer,
(b) autumn, (c) winter, and (d) spring.
summer, showing a peak in August. It then decreases to a minimum in autumn. In spite of this decrease in value it is still higher than that during winter. The increase in the Linke turbidity factor from winter to summer is always associated with an increase in temperature and a decrease in relative humidity. These factors favour the increase of dust and water vapour in the atmosphere, both of which in general lead to a higher turbidity factor (Fig. 5). This shows that the atmosphere over Helwan is turbid which is not only due to the high amount of dust but also to the very high pollution level over Helwan, resulting especially from cement compan- ies. The behaviour of the spectral distribution of the total direct radiation and that obtained using the OG530, RG630 and RG695 filters was approximately equal. The Linke tur- bidity factor in the summer and spring was found to be higher than that in the autumn and winter. It is clear from Fig. 4. that the band ,:°3, which is represented by 3 in Fig. 4(a) (d), has a higher Linke turbidity, which is seen as a red
Table 4. Linke turbidity factors obtained using two different methods
Bands Belgium method Coulson method
21 4~8 4~8 ~.2 5 9 5 9 23 4~6 4~8 24 5-7 4~8
band, then violet blue, green, deep red and red, respectively, which can be explained as follows.
Diatomic oxygen has three weak absorption bands in the visible spectrum centred at 630, 690 and 760 nm. However, in this region there is some overlap by ozone bands, as ozone exhibits a number of absorption bands beyond 200 nm in the

88 Data Bank
ultraviolet, visible and near infrared. Ozone has a strong absorption band from 200 to 300 nm, weaker bands from 300 to 350 nm, and stronger bands again in the visible region from 450 to 770 nm. Ozone also has absorption bands below 200 nm wavelength. Highly variable dust haze, which results from cement companies is responsible for at tenuation in the region 32(~700 nm.
7. C O N C L U S I O N
The present study investigated the main features of atmo- spheric turbidity at Helwan city in the period between June 1991 and May 1992. These features include the Linke tur- bidity factor, atmospheric transparency and the intensity of direct solar irradiance. The integrated direct solar radiation and the spectral distribution in four bands were calculated for these features. The results obtained show some features characteristic of the atmospheric conditions at Helwan as follows:
1. The calculation of the turbidity of the direct solar radi- ation over Helwan was found to be 4~7, showing a con- siderable increase with respect to the previous studies (1922 1927, 1967, and 197~1977). 2. A careful study of the turbidity was done by applying the spectral distribution in four bands, and the results of this application are represented in Table 4. 3. The results mentioned above show an increase in the turbidity at Helwan. This is due to irresponsible planning in establishing industry. 4. The detailed analysis of meteorological elements for daily variations, through t~ e whole period of measurement, showed that the turbidity reaches its max imum value at noon, whereas the temperature is high and the humidity is low. 5. The analysis of monthly variations of the measured atmo- spheric transparency compare with results obtained from previous studies. It showed a 30-50 % decrease with respect to the studies of 1922 1927 and 15 20% decrease with respect to the studies of 1967. 6. The seasonal variations of turbidity show the dependence of the turbidity level on the seasonal variations of the tem- perature, relative humidity and the effect of the local pre- vailing synoptic conditions (such as the Khamass in depression on the other side). 7. From the analysis of monthly variations, it can be con- cluded that the intensity of direct radiation decreased by 3(~ 45 % with respect to the results of 1922 1927 and by 20 % with respect to the results of 1967. 8. The results of the study showed there to be a decrease in the intensity of direct solar radiation by approximately 50 % from the extra-terrestrial value.
REFERENCES
1. N. A. Hgazy, Physical studies on polluted air in Egypt. M.Sc. Thesis, Cairo University, p. 64 (1961).
2. A. Salam, and M. Sowelim, Dust deposits in the city of Cairo. J. Atmosph. Environ. 1, 211 20 (1967).
3. A. Salam, Study of air pollution in Helwan industrial area. Report submitted to the high committee for plan- ning of greater Cairo (1967).
4. M. M. Nassrallah, Air contaminants in the industrial communi ty of Helwan. M.Sc. Thesis, Ain Shims Uni- versity (1968).
5. N. A. Hgazy, Effect of air pollution visibility and pen- etration of solar ultraviolet radiation. Ph.D. Thesis, Cairo University (1976).
6. M. M. Nassrallah, A m o u n t of suspended particulate over Helwan. Faculty of Science, Helwan University Meeting, 25 March (1990).
7. A. El-dahab, Study of the limit of carbon monoxide in different units in the iron and steel company. Faculty of Science, Helwan University Meeting, 25 March (1990).
8. R. Dogniaux and M. Lemoine, Classification of radi- ation sites in terms of different indices of atmospheric transparency, Solar Radiation Data Vol. 2, Proc. EC Contractors, Brussels, 18-19 October 1982, pp. 94-107. D. Reidel Publishing Company (1982).
9. H. Kimball, Measurement of solar radiation intensity. Monthly Weather Review 55, 55 (1927).
10. N. M. El-Taieb, Some studies on air pollution and solar radiation in Helwan industrial area. M.Sc. Thesis, A1- Azhar University (1981).
11. M. A. Mosa lamn Shaltout, Egyptian Solar Radiation Atlas. New and Renewable Energy Authority, Ministry of Electricity and Energy, Egypt (1991).
12. M. A. Mosa lamn Shaltout, Solar radiation and air pol- lution in Cairo. Proc. Third Arab International Solar Energy Conf., 21-24 February 1988, Ed. N. AI-Ham- adani et al. (1988).
13. M. A. Mosalam Shaltout, Atmospheric transmission and diffuse fraction of solar energy over Egypt. Proc. International Symp. on Applications o f Solar and Renew- able Energy A S R E 86, Cairo, Egypt, 23-26 March 1986, Ed. A. Mobarak and H-El Agamawi, Vol. 1, No. 4, pp. 35~44 (1986).
14. M. A. Mosa lamn Shaltout and A. H. Hassen, Solar energy distribution over Egypt using cloudiness from Meteostat photos. Solar Energy 45(6), 345 351 (1990).
15. M. A. Mosa lamn Shaltout, M. M. Ghoneim and A. Hassan, Atmospheric transparency at Owienat. Proc. International Con/: on Application of Solar Renewable Energy ASRE, 19 22 March 1989, Cairo, Egypt, Vol. 1, pp. 91-104, Ed. A. Mobarak and H. E1-Agamawi (1989).
16. M. A. Mosalam Shaltout, Solar energy characteristics and some photovoltaic testing results in Jeddah. Solar and Wind Technol. 3 (3), 173 187 (1986).
17. M. A. Mosalem Shaltout, Solar energy variability over horizontal and inclined passive systems in Egypt. Proc. PLEA '88, Energy and BuildingsJor Temperate Climates, a Mediterranean Regional Approach, Ed. E. de Oliverira Ferandes and S. Yannas, pp. 375 382, Pergamon Press, Oxford (1988).
18. R. Dogniaux, Programme General de calcul des Eclai- rements Solaire Energetiques et Lumineux des surfaces Orientees Etinclinees, Belgique (1985).
19. K. L. Coulson, Solar and Terrestrial Radiation. Aca- demic Press, New York (1975).
20. H. Hinzpeter, Uber Trubungsbes t immungen in Potsdam im den Jahran 1946 und 1947. Meteorol. 4 (1/2), (1950).
21. M. A. Abdel -Rahman, S. A. M. Said and A. N. Shuaib, Compar ison between atmospheric turbidity coefficients of desert and temperate climate, Solar Energy 40 (3) (1988).