spectral handheld light meters for accurate measurements
TRANSCRIPT
Spectral Handheld Light Meters for accurate measurements of LED lighting
Mike Clark, Gigahertz-Optik GmbH
on behalf of Te Lintelo Systems BV
www.gigahertz-optik.de
www.tlsbv.nl

2
What are the weaknesses and problems associated with using traditional light meters to measure LED based lighting products?
What’s different about contemporary spectral light meters and what are the advantages and benefits of using them?
How do spectral light meters help us exploit the many opportunities offered by LED lighting
Talk Aims
LED EVENT 2016 | © Gigaherts-Optik & Te Lintelo Systems BV

3
So what’s wrong with using a traditional lux meter to measure LED lighting?
Just because something has been ‘calibrated’, it doesn’t necessarily make it suitable for a particular measurement task.
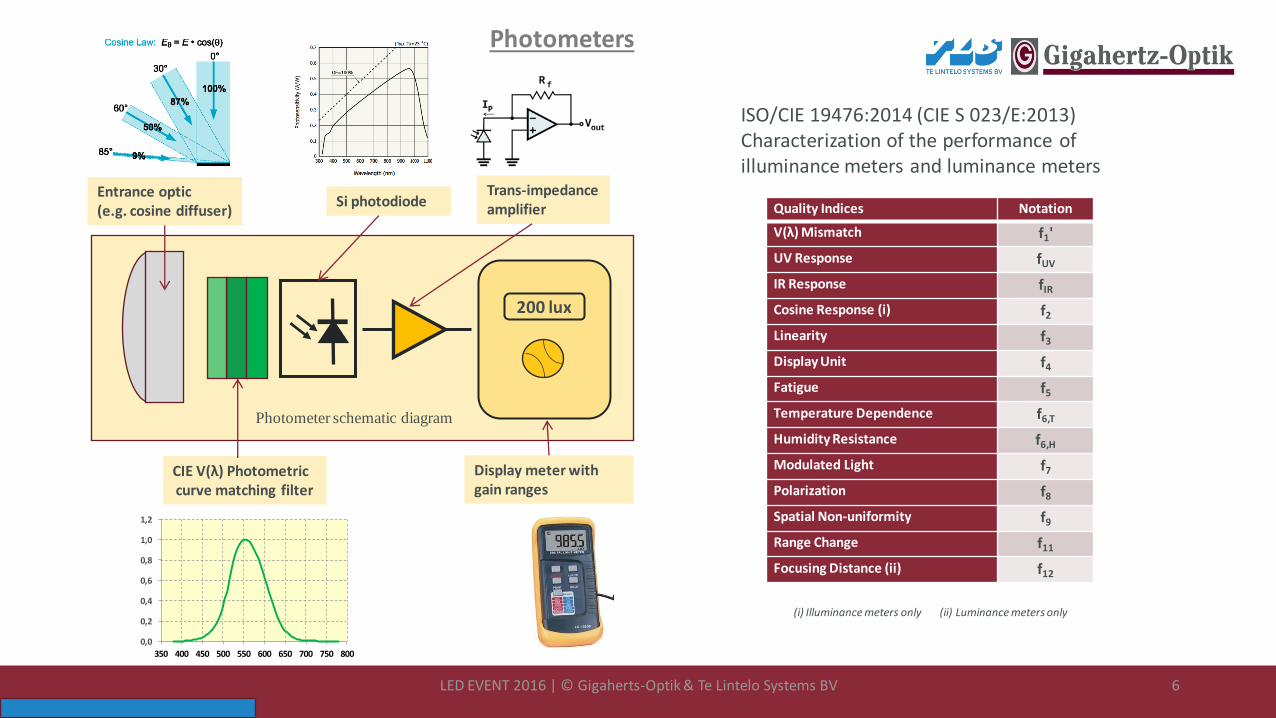
Photometers
LED EVENT 2016 | © Gigaherts-Optik & Te Lintelo Systems BV

4
Light is visible to humans in the 380nm to 780nm wavelength range….
….but not all wavelengths with the same sensitivity
0,0
0,2
0,4
0,6
0,8
1,0
1,2
350 400 450 500 550 600 650 700 750 800
Peak wavelength 555nm
V(λ) curve
Wavelength nm
Ph
oto
pic
lum
ino
us
eff
icie
ncy
The CIE V(λ) curve describes the average spectral sensitivity of human visual perception of brightness. In use since 1924.
ISO 23539:2005 (CIE S010/E:2004)
Visible Light
https://en.wikipedia.org/wiki/Prism
LED EVENT 2016 | © Gigaherts-Optik & Te Lintelo Systems BV

5
Radiometric
Quantity
Radiometric
Unit
Photometric
Quantity
Photometric
Unit
Irradiance
W/m2
Illuminance
lux
Radiance
W/(sr.m2) Luminance cd/m2
Radiant
intensity
W/sr Luminous
intensity
cd
Radiant flux W Luminous flux lumens
x = V(λ)
x = V(λ)
x = V(λ)
x = V(λ) www.gigahertz-optik.de/en-us/basics-light-measurement
Photometric Units
LED EVENT 2016 | © Gigaherts-Optik & Te Lintelo Systems BV
6
Quality Indices Notation
V(λ) Mismatch f1'
UV Response fUV
IR Response fIR
Cosine Response (i) f2
Linearity f3
Display Unit f4
Fatigue f5
Temperature Dependence f6,T
Humidity Resistance f6,H
Modulated Light f7
Polarization f8
Spatial Non-uniformity f9
Range Change f11
Focusing Distance (ii) f12
ISO/CIE 19476:2014 (CIE S 023/E:2013) Characterization of the performance of illuminance meters and luminance meters
(i) Illuminance meters only (ii) Luminance meters only
200 lux
0,0
0,2
0,4
0,6
0,8
1,0
1,2
350 400 450 500 550 600 650 700 750 800
Entrance optic (e.g. cosine diffuser)
Photometer schematic diagram
Si photodiode Trans-impedance amplifier
CIE V(λ) Photometric curve matching filter
Display meter with gain ranges
Photometers
LED EVENT 2016 | © Gigaherts-Optik & Te Lintelo Systems BV

7
Quality Indices Notation
V(λ) Mismatch f1'
UV Response fUV
IR Response fIR
Cosine Response (i) f2
Linearity f3
Display Unit f4
Fatigue f5
Temperature Dependence f6,T
Humidity Resistance f6,H
Modulated Light f7
Polarization f8
Spatial Non-uniformity f9
Range Change f11
Focusing Distance (ii) f12
V(λ) Mismatch f1'
Spectral mismatch is usually the most significant error source when photometers are used to measure LEDs
Standard calibration of photometers is made with the CIE Illuminant A (2856K incandescent source)
Spectral Mismatch Error
LED EVENT 2016 | © Gigaherts-Optik & Te Lintelo Systems BV

8
Tony Bergen & Peter Blattner CIE Div 2, Photometry Standardization Developments for OLEDs and LEDs, LED Professional Review, Issue 41, Jan 2014.
f1’ not a direct measure of LED measurement error, but can indicate likely error range for white LEDs
~10% significant for energy bills and global warming
Spectral Mismatch Error
LED EVENT 2016 | © Gigaherts-Optik & Te Lintelo Systems BV

9
Tony Bergen & Peter Blattner CIE Div 2, Photometry Standardization Developments for OLEDs and LEDs, LED Professional Review, Issue 41, Jan 2014.
V(λ) Mismatch f1'
real measured LED's
0
0,1
0,2
0,3
0,4
0,5
0,6
0,7
0,8
0,9
1
380 430 480 530 580 630 680 730 780
wavelength (nm)
rel.
rad
ian
t in
ten
sit
y
LB T676
blue
LW T673
LB T673
LV T673
LT T673
LP T670
LA T676
LY T676
LO T676
LG T671
LS T676
LH K376
Blau
Gelb
Gruen
Rot635
Rot645
Trkis
Photometer errors when measuring coloured LEDs can be very much worse than white LEDs
Spectral Mismatch Error
LED EVENT 2016 | © Gigaherts-Optik & Te Lintelo Systems BV

10
Cosine Response f2 Quality Indices Notation
V(λ) Mismatch f1'
UV Response fUV
IR Response fIR
Cosine Response (i) f2
Linearity f3
Display Unit f4
Fatigue f5
Temperature Dependence f6,T
Humidity Resistance f6,H
Modulated Light f7
Polarization f8
Spatial Non-uniformity f9
Range Change f11
Focusing Distance (ii) f12
As a beam of light deviates from normal incidence, its area increases on the surface. The resulting reduction in irradiance is determined by the cosine of the angle of incidence.
Lux meter errors resulting from poor cosine response can be most significant when measuring extended light sources
Independent of lighting technology – not specific to LEDs
Cosine Error
LED EVENT 2016 | © Gigaherts-Optik & Te Lintelo Systems BV
11
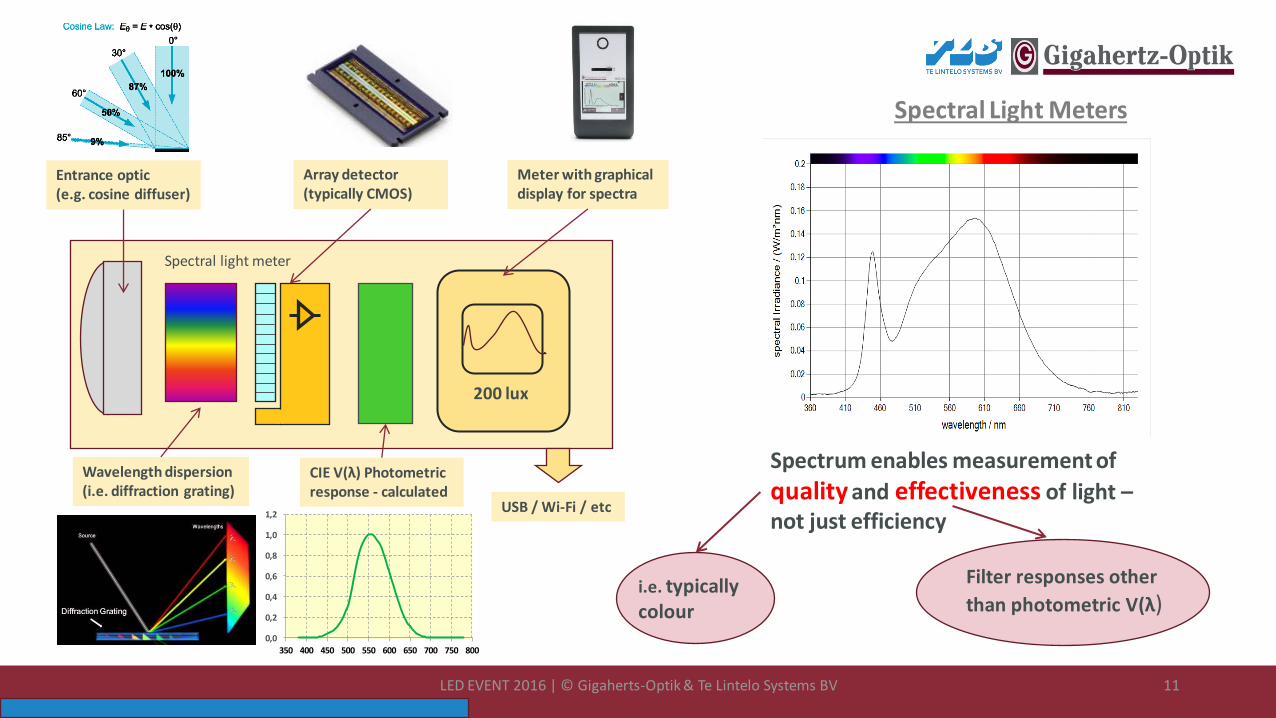
200 lux
Entrance optic (e.g. cosine diffuser)
0,0
0,2
0,4
0,6
0,8
1,0
1,2
350 400 450 500 550 600 650 700 750 800
CIE V(λ) Photometric response - calculated
Wavelength dispersion (i.e. diffraction grating)
USB / Wi-Fi / etc
Array detector (typically CMOS)
Spectral light meter
Meter with graphical display for spectra
Spectrum enables measurement of
quality and effectiveness of light – not just efficiency
i.e. typically colour
Filter responses other
than photometric V(λ)
Spectral Light Meters
LED EVENT 2016 | © Gigaherts-Optik & Te Lintelo Systems BV
12
)(x
)(y
)(z
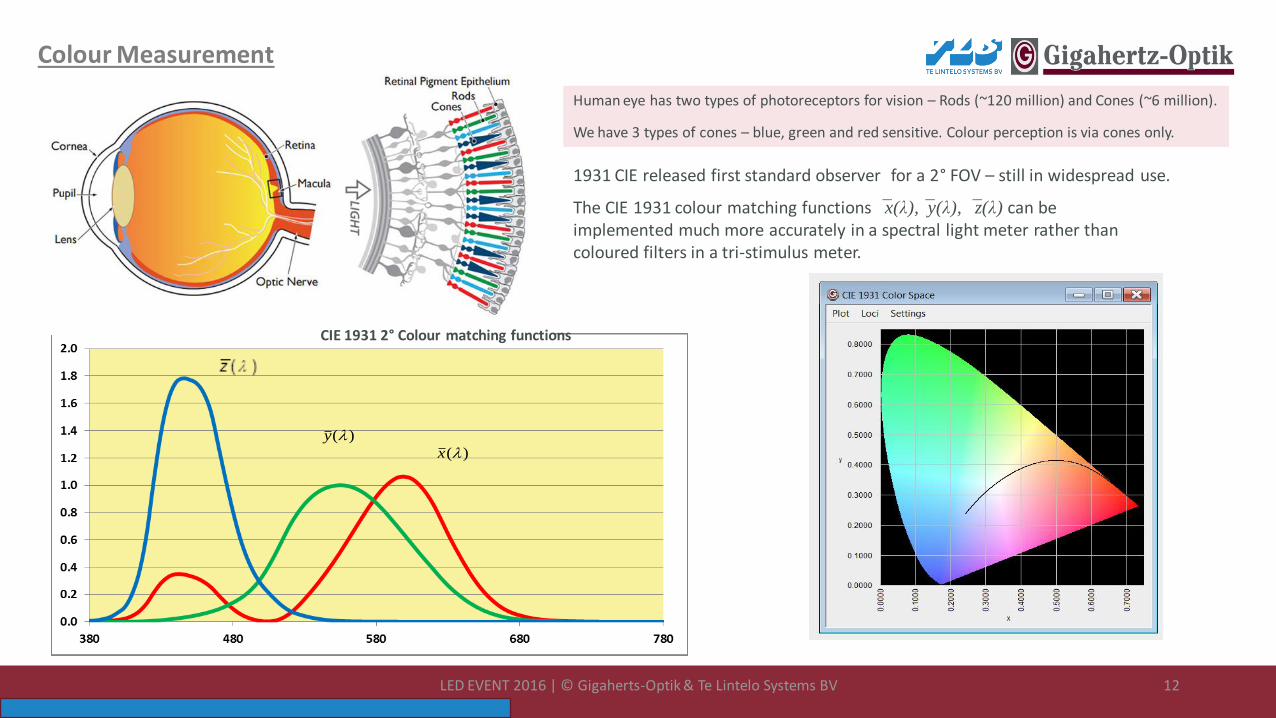
The CIE 1931 colour matching functions ̅x(λ), ̅y(λ), ̅z(λ) can be implemented much more accurately in a spectral light meter rather than coloured filters in a tri-stimulus meter.
CIE 1931 2° Colour matching functions
Human eye has two types of photoreceptors for vision – Rods (~120 million) and Cones (~6 million).
We have 3 types of cones – blue, green and red sensitive. Colour perception is via cones only.
1931 CIE released first standard observer for a 2° FOV – still in widespread use.
Colour Measurement
LED EVENT 2016 | © Gigaherts-Optik & Te Lintelo Systems BV

13
Limited accuracy and range of CCT with tri-stimulus meters
Correlated colour temperature (CCT) is a measure of light source’s colour appearance defined by the proximity of its chromaticity coordinates to the blackbody locus.
Different colour light sources can have the same CCT.
Colour Temperature
LED EVENT 2016 | © Gigaherts-Optik & Te Lintelo Systems BV

14
CRI can only be determined with
spectral data of light source
The colour rendering of a light source is a measure of its ability to realistically reproduce the colour of an object.
Colour Rendering - CRI
Colour fidelity metric only. First released 1965, updated in 1974. Ra is average of R1 - R8
The CIE General Colour Rendering Index, Ra, does not agree well with perception of some light sources, notably LED light sources that contain narrow spectral bands.
CIE 13.3-1995 “Method of measuring and specifying colour rendering properties of light sources”
Test colour samples according to CIE 13.3
CIE Colour Rendering Indices, CRI
LED EVENT 2016 | © Gigaherts-Optik & Te Lintelo Systems BV

15
TM-30-15 IES “Method for Evaluating Light Source Color Rendition”
http://www.ies.org
Fidelity Index, Rf
Gamut Index, Rg
Color Vector/Saturation Graphics 16 hue-based fidelity indices 16 hue-based chroma indices 1 skin-specific fidelity index 99 individual fidelity value
TM-30-15 uses 99 colour samples to characterize the difference between the test source and reference illuminant. Uses CIECAM02 (uniform colour space).
More comprehensive set of numerical and graphical outputs than CIE CRI system
Colour Rendering – TM30
LED EVENT 2016 | © Gigaherts-Optik & Te Lintelo Systems BV

16
Cones are not uniformly distributed within the fovea – few blue cones in the central region.
Observer’s field of view
CIE 1964 10° Standard Observer
CIE 1931 2° Standard Observer
http://www.osram-os.com/osram_os/en/applications/general-lighting/ten-binning/index.jsp
CIE 170-2:2015
Only with spectral data can these different weighting functions be implemented
LED EVENT 2016 | © Gigaherts-Optik & Te Lintelo Systems BV

17
The standard scotopic luminosity function or V' (λ) was adopted by the CIE in 1951
Scotopic Vision
Under low light (scotopic) conditions only rods produce a visual signal.
In normal (photopic) conditions only cones produce visual signal (rods are saturated).
Photopic lighting condition ~>3cd/m2 Scotopic lighting condition ~<0.03cd/m2
Scotopic response is simply implemented with spectral meter
LED EVENT 2016 | © Gigaherts-Optik & Te Lintelo Systems BV

18
CIE 191: System for mesopic photometry
Mesopic Vision
Scotopic Vision Illuminance <0.05 lux to ~3µlux Rods only, no colour perception
Photopic Vision Illuminance levels >50lux
Cone receptors yield colour
Mesopic Vision Illuminance 3µlux to 50 lux
Eye not in stable state
The eye operates in the mesopic region in many important situations:
• Night time driving; • Emergency escape lighting; • Marine signalling.
LED lighting has potential to offer good colour rendering with high mesopic efficiency. Using the mesopic system to calculate the effective luminance of cool white light sources results in significant changes in their apparent efficacy.
Spectral weighting function depends on visual adaptation (determines value of m)
LED EVENT 2016 | © Gigaherts-Optik & Te Lintelo Systems BV

19
Human Centric Lighting / Circadian Lighting
Lucas et al (2014) Trends in Neurosciences 37(1):1-9
http://lucasgroup.lab.ls.manchester.ac.uk/research/measuringmelanopicilluminance/
Research over the past 15+ years has shown that as well as the rod and cones responsible for our vision, our retinas also have intrinsically photosensitive retinal ganglion cells (ipRGCs) that play a major role in entraining our circadian rhythms.
Much activity in this field due to the ease with which the spectral output and intensity of LEDs can be controlled as well as the flexibility in constructing luminaires (and the commercial opportunities this gives rise to!).
LED EVENT 2016 | © Gigaherts-Optik & Te Lintelo Systems BV

20
Human Centric Lighting – age considerations
Int. J. Mol. Sci. 2014, 15(12), 23448-23500; doi:10.3390/ijms151223448
Clouding of the lens in the eye with age results in lower light transmission, particularly in the blue region.
Another effect requiring spectral
data!
LED EVENT 2016 | © Gigaherts-Optik & Te Lintelo Systems BV
21
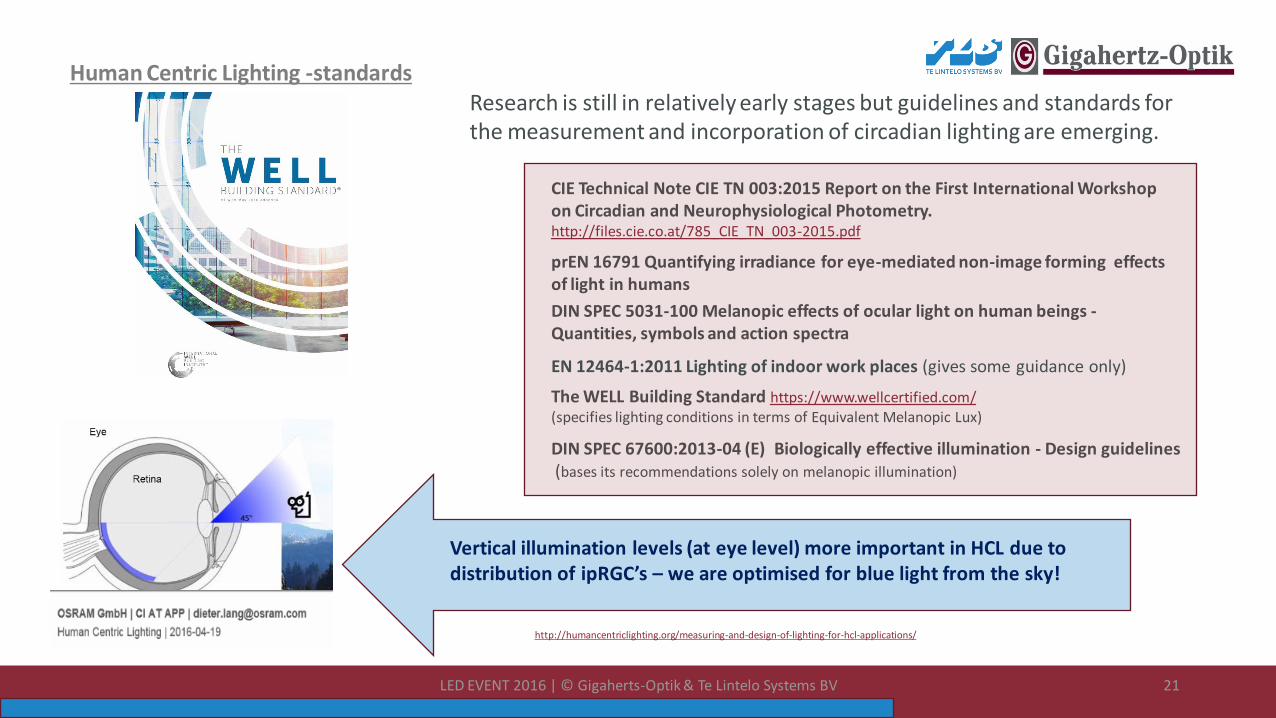
Human Centric Lighting -standards Research is still in relatively early stages but guidelines and standards for the measurement and incorporation of circadian lighting are emerging.
prEN 16791 Quantifying irradiance for eye-mediated non-image forming effects of light in humans
DIN SPEC 5031-100 Melanopic effects of ocular light on human beings - Quantities, symbols and action spectra
DIN SPEC 67600:2013-04 (E) Biologically effective illumination - Design guidelines (bases its recommendations solely on melanopic illumination)
The WELL Building Standard https://www.wellcertified.com/ (specifies lighting conditions in terms of Equivalent Melanopic Lux)
CIE Technical Note CIE TN 003:2015 Report on the First International Workshop on Circadian and Neurophysiological Photometry. http://files.cie.co.at/785_CIE_TN_003-2015.pdf
Vertical illumination levels (at eye level) more important in HCL due to distribution of ipRGC’s – we are optimised for blue light from the sky!
EN 12464-1:2011 Lighting of indoor work places (gives some guidance only)
http://humancentriclighting.org/measuring-and-design-of-lighting-for-hcl-applications/
LED EVENT 2016 | © Gigaherts-Optik & Te Lintelo Systems BV
22
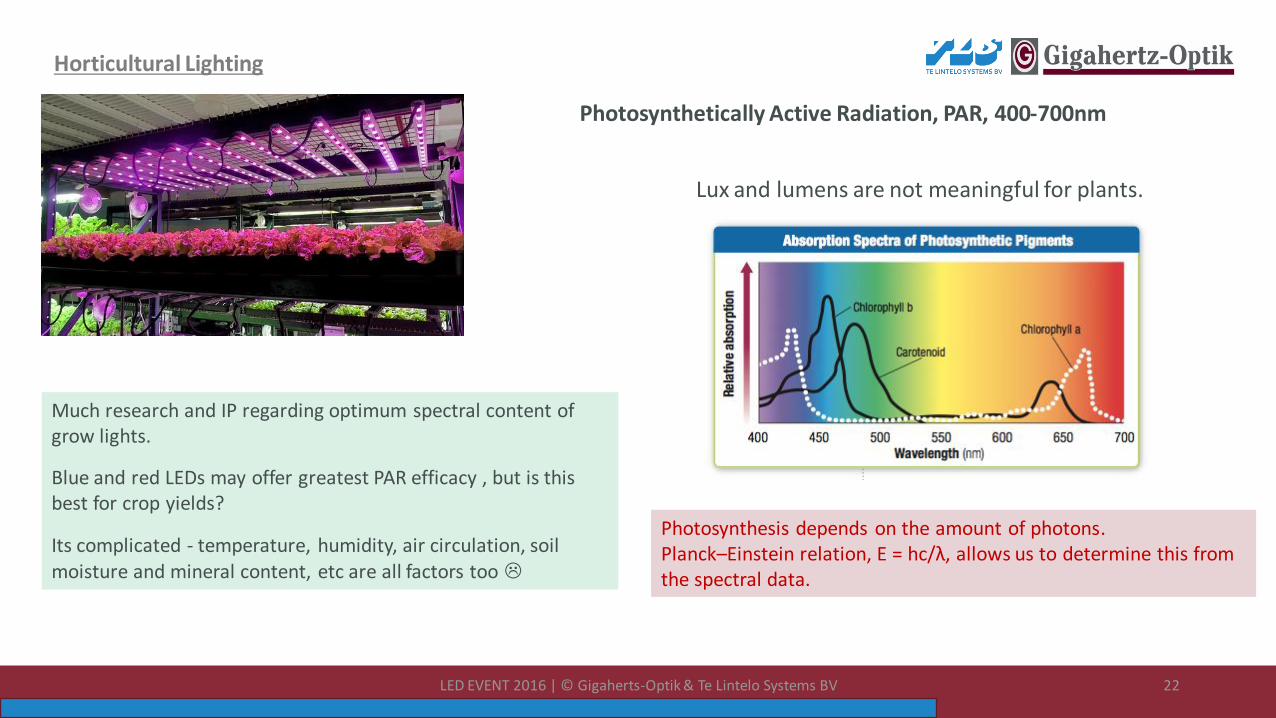
Photosynthetically Active Radiation, PAR, 400-700nm
Horticultural Lighting
Much research and IP regarding optimum spectral content of grow lights.
Blue and red LEDs may offer greatest PAR efficacy , but is this best for crop yields?
Its complicated - temperature, humidity, air circulation, soil moisture and mineral content, etc are all factors too
Photosynthesis depends on the amount of photons. Planck–Einstein relation, E = hc/λ, allows us to determine this from the spectral data.
Lux and lumens are not meaningful for plants.
LED EVENT 2016 | © Gigaherts-Optik & Te Lintelo Systems BV
23
Photosynthetic Photon Flux (PPF) : measurement of the total number of photons emitted by a light source each second within PAR wavelength range. Measured in μmol/s. Analogous to ‘lumens’ for visible light.
Photosynthetic Photon Flux Density (PPFD) : measurement of the total number of photons within PAR wavelength range that reach a surface each second measured over a one square meter area. Measured in μmol/m2/s. Analogous to ‘lux’ for visible light.
Day Light Integral (DLI) : cumulative measurement of the total number of photons within PAR wavelength range that reach a surface during 24 hour period, measured over a one square meter area. Measured in mol/m2/d.
Horticultural Lighting – PAR metrics
PAR is a much misused term – not quantitative, just descriptive - Photosynthetically Active Radiation. Generally accepted as radiation within 400-700nm
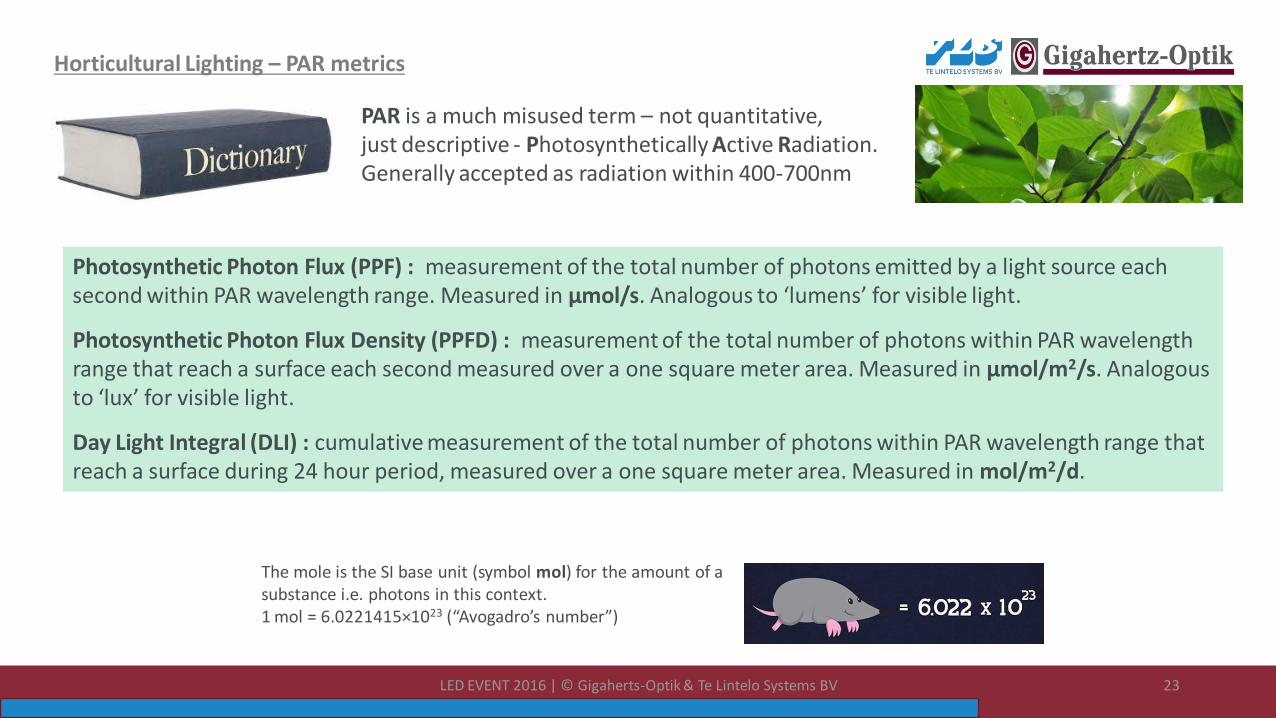
The mole is the SI base unit (symbol mol) for the amount of a substance i.e. photons in this context. 1 mol = 6.0221415×10²³ (“Avogadro’s number”)
LED EVENT 2016 | © Gigaherts-Optik & Te Lintelo Systems BV

24
Agricultural and aquacultural lighting
LED EVENT 2016 | © Gigaherts-Optik & Te Lintelo Systems BV

25
Phototherapy
Light is used for therapeutic purposes such as the treatment of jaundice (hyperbilirubinemia) in new born infants
The European market specifies: Total irradiance for bilirubin, Ebi in accordance with IEC 60601-2-50:2009+A1:2016 Ebi = integrated irradiance 400 to 550nm, in mW/cm2
Whereas the USA market requires: Average spectral irradiance over the 460 to 490nm range in accordance with American Academy of Pediatrics latest recommendations, in µW/cm2/nm
Spectral light meters enable the accurate measurement
of phototherapy sources according to all international
standards.
LED EVENT 2016 | © Gigaherts-Optik & Te Lintelo Systems BV

26
Blue Light Hazard More specialist application - extended wavelength range 300-700nm Standards require particular measurement geometries
https://www.hdwarrior.co.uk/2009/05/09/led-light-damage/
IEC 62471:2006 Photobiological safety of lamps and lamp systems Includes UV and IR hazards too, 200-3000nm
IEC TR 62778:2014 Application of IEC 62471 for the assessment of blue light hazard to light sources and luminaires
Blue light weighted radiance 300-700nm at 200mm in an 11mrad FOV
LED EVENT 2016 | © Gigaherts-Optik & Te Lintelo Systems BV

27
IEEE Std 1789 (2015) "Recommended Practice for Modulating Current in High-Brightness LEDs for Mitigating Health Risks to Viewers"
IEEE PAR1789 Recommended Practice for Modulating Current in High Brightness LEDs for Mitigating Health Risks to Viewers
Enhanced Spectral Light Meters
• additional measurement capabilities such as Flicker measurement;
• higher levels of accuracy resulting from improved stray light rejection and linearity correction.
LED Flicker – detrimental health effects such as triggering photosensitive epilepsy and stroboscopic effects. Results from drive and control circuitry
CIE TN 006:2016 Visual Aspects of Time-Modulated Lighting Systems – Definitions and Measurement Models http://files.cie.co.at/883_CIE_TN_006-2016.pdf
LED EVENT 2016 | © Gigaherts-Optik & Te Lintelo Systems BV

28
Traceable Calibration
Product
Testing equipment of the company
Internal calibration laboratory
Standard or factory standard
Accredited
calibration
laboratory
Reference
standard
National
standard Be cautious about: • Manufacturer’s claims of ‘traceable’ calibration. Check
for relevant accreditation by DAkkS, UKAS, etc to ISO 17025;
• Simple % ‘accuracy’ claims. Look for details of calibration conditions and uncertainty;
• Unrealistic accuracy claims – how does it relate to uncertainty from National Measurement Institutes
LED EVENT 2016 | © Gigaherts-Optik & Te Lintelo Systems BV

29
To conclude: • Spectral mismatch errors with photometers are often
significant when measuring LEDs/SSL;
• Spectral light meters remove spectral mismatch error and enable colour measurements;
• Any action spectra (filter function) may be applied within its spectral range;
• Enable development and testing of LED products for non-GLS / novel / high value applications;
• Traceable calibration is essential.
200 lux
Spectral matching to: • Photometric curve V(λ) • Scotopic curve V’(λ) • Colour matching • Mesopic • Melanopic • PAR • Bilirubin • Blue light hazard • Chicken vision • Etc, etc …
Summary
LED EVENT 2016 | © Gigaherts-Optik & Te Lintelo Systems BV
30 LED EVENT 2016 | © Gigaherts-Optik & Te Lintelo Systems BV
Thank you for your attention.
Mike Clark [email protected]

LED EVENT 2016 | © Gigaherts-Optik & Te Lintelo Systems BV 31
Te Lintelo Systems BV
Mecurion 26a
6903 PZ Zevenaar
The Netherlands
+31 316 340804
www.tlsbv.nl
Te Lintelo Systems
Your partner in Absolute Light Measurement