· specific behavior such as strategy or tactics, we chose video stimuli that involved breaks...
TRANSCRIPT

1 23
Journal of Nonverbal Behavior ISSN 0191-5886Volume 38Number 1 J Nonverbal Behav (2014) 38:13-29DOI 10.1007/s10919-013-0168-7
The Expression of Victory and Loss:Estimating Who’s Leading or Trailing fromNonverbal Cues in Sports
Philip Furley & Geoffrey Schweizer

1 23
Your article is protected by copyright and all
rights are held exclusively by Springer Science
+Business Media New York. This e-offprint is
for personal use only and shall not be self-
archived in electronic repositories. If you wish
to self-archive your article, please use the
accepted manuscript version for posting on
your own website. You may further deposit
the accepted manuscript version in any
repository, provided it is only made publicly
available 12 months after official publication
or later and provided acknowledgement is
given to the original source of publication
and a link is inserted to the published article
on Springer's website. The link must be
accompanied by the following text: "The final
publication is available at link.springer.com”.

ORI GIN AL PA PER
The Expression of Victory and Loss: Estimating Who’sLeading or Trailing from Nonverbal Cues in Sports
Philip Furley • Geoffrey Schweizer
Published online: 19 October 2013� Springer Science+Business Media New York 2013
Abstract The goal of the paper was to test if humans can detect whether athletes are
trailing or leading in sports based on the perception of thin slices of athletes’ nonverbal
behavior. In Experiment 1, participants who were unexperienced in the respective sports
watched short videos depicting basketball and table tennis players and rated whether
athletes were trailing or leading. Results indicated that participants could significantly
differentiate between trailing and leading athletes in both team and individual sports.
Experiment 2 showed that children were also able to distinguish between trailing and
leading athletes based on nonverbal behavior. Comparison with the adult results from
Experiment 1 revealed that the adult ratings corresponded to a higher degree with the
actual scores during the game compared to the children’s. In Experiment 3, we replicated
the findings from Experiment 1 with both expert and unexperienced participants and a
different set of stimuli from team handball. Both experts and unexpert participants were
able to differentiate between leading and trailing athletes. Our findings are in line with
evolutionary accounts of nonverbal behavior and suggest that humans display nonverbal
signals as a consequence of leading or trailing which are reliably interpreted by others. By
comparing this effect as a function of different age groups we provide evidence that
although even young children can differentiate between leading and trailing athletes, the
decoding of subtle nonverbal cues continues to develop with increasing experience and
maturation processes.
Keywords Sport � Emotion expression � Nonverbal behavior � Thin slices �Development
P. Furley (&)Institute of Cognitive and Team/Racket Sport Research, German Sport University Cologne,Am Sportpark Mungersdorf 6, 50933 Cologne, Germanye-mail: [email protected]
G. SchweizerUniversity of Heidelberg, Heidelberg, Germany
123
J Nonverbal Behav (2014) 38:13–29DOI 10.1007/s10919-013-0168-7
Author's personal copy

Introduction
When viewing televised coverage of sport events, it is common to hear commentators
referring to the body language of competing players whilst also speculating about the
mental states of the performers. For example, one often hears statements such as the
following: ‘‘You can tell that the team has given up;’’ ‘‘from looking at their body lan-
guage, one suspects they’ve lost belief in their ability to turn the game around;’’ or ‘‘the
player is absolutely dominating her opponent.’’ According to evolutionary accounts of
nonverbal expressions, this is not surprising as humans have evolved to be especially well-
equipped for communicating important internal states nonverbally—displaying emotional
nonverbal expressions and interpreting these (Darwin 1872; Ekman 1992; Shariff and
Tracy 2011 for a recent review) or communicating social intentions (Fridlund 1994). For
example, it has been suggested that primates send submissive nonverbal cues when losing a
fight in order to avoid further potential life-threatening attacks (de Waal 1998). On the
other hand, winning a fight leads primates to show dominant and proud nonverbal
behaviors (NVB), which are also believed to be adaptive, as they communicate their
superiority and higher status over the opponent and thereby can also save valuable
resources by preventing further aggressive encounters (Archer 2006; de Waal 1998; Mazur
and Booth 1998; Mehta and Josephs 2010; Mehta et al. 2008). The present research
addresses the question whether leading and trailing in sport events are associated with
nonverbal cues that are readily understood and interpreted as signs of leading or trailing in
the game due to our evolutionary inheritance.
Functions of Nonverbal Expressions of Emotions
Charles Darwin (1872) suggested that the expression of emotion in general serves two
classes of functions: (1) to prepare the organism to respond adaptively to recurring stimuli;
and, of especial relevance to the present study, (2) to communicate important social
information. More recent theorizing has built on Darwin’s proposal and has been termed
the two stage model of emotional expression (see Shariff and Tracy 2011, for a review),
suggesting that internal physiological regulation was probably the original adaptive
function of emotional expressions and later evolved to serve communication functions.
Today, the communicative function of nonverbal emotional expressions is believed to be
more important in humans than the physiological function due to the increased importance
of quickly and nonverbally communicating social information in complex societies
(Shariff and Tracy 2011, for a review). Therefore, it has been suggested that humans have
evolved both the ability to automatically display NVB and to automatically interpret and
adequately respond to these NVB (Ekman 1992).
An alternative to this emotion-expression view was proposed by Fridlund (1994) who
suggested that nonverbal displays are not necessarily about expressing emotions, but serve
to communicate behavioral intentions or more generally social motives. According to this
view, NVB communicates how people are likely to act, rather than how they are currently
feeling. For the purpose of the present research, we will not go into this debate in detail
(see Parkinson 2005 for a review) as both accounts make similar predictions regarding
score estimations in sport competitions based on NVB: ‘‘Indeed, many emotions are
precisely forms of social motive, and many social motives are emotional’’ (Parkinson
2005, p. 301).
14 J Nonverbal Behav (2014) 38:13–29
123
Author's personal copy
Predicting Outcomes from Thin Slices of Expressive Behavior
A line of research providing evidence for the adaptive importance of nonverbal commu-
nication—which has been termed the thin slices approach—demonstrates that people are
highly accurate at predicting various outcomes from short observations of NVB (Ambady
et al. 2000; Ambady and Rosenthal 1992): including personality characteristics (Borkenau
et al. 2004), conversation outcomes (Curhan and Pentland 2007), teaching effectiveness
(Ambady and Gray 2002), leadership competence (Rule and Ambady 2008), and sales
effectiveness (Ambady et al. 2006). In line with the reviewed evolutionary accounts of
NVB, accurate positive versus negative judgments of NVB that are especially important to
survival (e.g., dominance, fear, disgust) can be made within seconds, whereas longer
exposure times are needed when making more complex judgments, e.g., of personality
variables (Carney et al. 2007).
Hence, the ability to quickly and reliably detect certain attributes such as anger, fear,
dominance, or submissiveness evolved because they are essential for survival in social
animals by preparing the organism to act adaptively. Moreover, the ecological approach
(Fridlund 1994, see also McArthur and Baron 1983) emphasizes that accurate social
perception is not limited to its utility in detecting emotions, but also serves adaptive
functions at the level of individual goal attainment (e.g., whom one should better avoid in a
confrontational situation).
The Present Research
Of relevance to the present study, Booth et al. (1989) demonstrated that winning in a
competition raises testosterone levels, which has been linked to the nonverbal display of
dominance (Carney et al. 2010). In addition, losing in competition had the opposite effect
of lowering testosterone which is associated with nonverbal displays of submissiveness. In
combination with the findings from the thin slices of expressive behavior approach, it
therefore seems feasible that leading and trailing in ongoing sport competitions would
result in subtle nonverbal behavioral changes associated with dominance and submis-
siveness, which are reliably recognized by observers and competitors. This argumentation
is anecdotally supported by the frequent referral of sport commentators to the NVB of
athletes as a consequence of either leading very clearly or trailing by far. To our knowl-
edge, currently no research exists on the nonverbal expression changes associated with
leading or trailing during competition and, more importantly, whether people can accu-
rately interpret these NVB as signs of leading or trailing.
Based on the reviewed evolutionary accounts of NVB (e.g., Shariff and Tracy 2011), we
hypothesized that people—including adults with no knowledge of the respective sport
(Experiment 1), children (Experiment 2), and athletes (Experiment 3)—will be able to
judge who is leading or trailing in ongoing sport competition. In this endeavor, we
transferred the thin slices paradigm to the field of sports and thereby further addressed a
well-known difficulty of this approach: objectively defining accuracy of predictions based
on the observation of thin slices of expressive behavior (cf. Ambady and Rosenthal 1992).
Accuracy typically describes the correspondence between a judgment and a criterion
(Kruglanski 1989) which has proven to be problematic in social psychology, as objective
and externally valid criteria against which to evaluate predictions are difficult to find. In
this respect, we consider the sports context as highly suitable to investigate the predictive
power of certain nonverbal cues on performance outcomes, as the outcome of sports
competitions is objectively defined by scores.
J Nonverbal Behav (2014) 38:13–29 15
123
Author's personal copy

In three experiments we tested the hypothesis that score estimates of perceivers would
correspond with the actual scores when viewing short video footage of sporting com-
petition. In Experiment 1, we tested this hypothesis in the sports of basketball and table
tennis amongst perceivers who had no experience in the respective sports. In Experiment
2, two groups of children (4–8 and 9–12 years) were tested with the same experimental
procedure as in Experiment 1. Based on recent findings (Balas et al. 2012; Ross et al.
2012; Thomas et al. 2007), we hypothesized that children would be able to distinguish
between leading and trailing athletes, but that their estimations would be less accurate
than adults’ estimations. In Experiment 3 we followed a recent call of Fiedler (2011) for
replicating an effect with different stimuli, while further examining whether domain-
specific knowledge in a respective sport moderates this effect. According to the reviewed
evolutionary accounts of NVB both inexperienced perceivers and experienced athletes
should be equally well-equipped to recognize specific NVB and interpret these as signs
of leading or trailing.
Experiment 1: Who’s Leading or Trailing
Method
Participants
Forty college students (20 male and 20 female; M = 22.4; SD = 1.4) took part in the
study, who were not experienced in both respective sports and stated they had never played
these sports in an organized context. Neither gender nor age significantly influenced the
pattern of results. Written informed consent was obtained from every participant before
commencing the experiment. The study was carried out in accordance with the Helsinki
Declaration of 1975.
Stimuli
We selected video footage of televised basketball games from the NBA and the highest
German league (Seasons 2010–2012) and table tennis matches from the World Cup, the
European Cup, the Chinese Super League, and the highest German League. The following
selection criteria were implemented to assure that the chosen stimuli were suitable for
testing the hypothesis that leading and trailing in ongoing competition result in specific
NVB that resemble evolved adaptations and are therefore recognized by observers: In
order to ensure that the ratings were not influenced by score-induced changes in sport
specific behavior such as strategy or tactics, we chose video stimuli that involved breaks
during the game—including time-outs, free throws in basketball, and breaks between
points in table tennis. Further, we carefully avoided showing any kind of obvious non-
verbal signals associated with pride such as raising both fists above the head or obvious
signals displaying shame such as hiding the face behind the hands (cf. Tracy and Mat-
sumoto 2008), that have empirically been linked to the final outcome in sport and therefore
would be too informative cues for estimating the score. After the selection process was
complete, selected basketball videos had a mean duration of 3.9 s (SD = 2.8; Mode = 1)
and selected table tennis videos had a mean duration of 3.5 s (SD = 3; Mode = 1).
16 J Nonverbal Behav (2014) 38:13–29
123
Author's personal copy
Experimental Manipulation
The manipulation in the study involved the actual score of the game during the video. We
chose five different categories of scores: (1) far behind, displaying a team or player trailing
substantially, which was defined in basketball as at least fifteen points behind and in table
tennis as at least five points behind. Moreover, in this category the team or player shown
always lost the game in the end; (2) close behind, showing a team or player losing in a
fairly close game situation which was defined in basketball as no more than five points
behind and in table tennis no more than two points behind; (3) a draw in which the score
was equal; (4) close lead, showing a team or player leading in a fairly close game situation
which was defined in basketball as no more than five points ahead and in table tennis no
more than two points ahead; (5) high lead, displaying a team or player leading substan-
tially, which was defined in basketball as at least fifteen points ahead and in table tennis as
at least five points ahead. Moreover, in this category the team or player shown always won
the game in the end.
We aimed at finally having a battery of 20 videos in each experimental category for both
respective sports (200 video clips in total). The selection of videos was done by student
research assistants according to the following guidelines. Research assistants were
instructed to review all videos of a convenience sample of 30 basketball games and 40
table tennis games one after the other. They were to select each video that fit the above
mentioned criteria [breaks during game, no obvious nonverbal signals that have empiri-
cally been linked to victory and defeat (Tracy and Matsumoto 2008)], until each category
of scores contained 20 videos1 (see footnote for the hyperlink to the utilized stimulus
material).
Measure
Perceivers rated the short video scenes on an 11-point digital semantic differential scale
after every video. In order to give their ratings, perceivers moved a mouse cursor from the
middle of the scale which represented a tied score towards either pole of the scale and
logged in their rating by clicking the left mouse button. The software converted the ratings
into a value (with 3 decimals) between 0 reflecting the left pole of the scale with the label
‘‘far behind’’ and 1 reflecting the right pole of the scale with the label ‘‘high lead.’’ The
utilized scale was continuous, ranging from 0.000 to 1.000 and was visually presented as
11 points in order to assist participants in providing a clear indication of their ratings.
Procedure
Perceivers were instructed that they had to estimate who was leading or trailing based on
the video footage presented to them by moving a mouse cursor to either the ‘‘high lead’’ or
‘‘far-behind’’ pole of the semantic differential scale. They were further instructed to answer
as accurately as possible, while speed was not emphasized. Before commencing the
experiment, perceivers filled out a questionnaire gathering demographic data. Every
1 In order to maximize transparency in the conducted research we provide hyperlinks to the stimulusmaterial utilized in the studies. Note that the software randomly selected and displayed the stimulus materialfrom the video stream according to the described procedure and not as shown in the video streams:basketball: (http://www.youtube.com/watch?edit=vd&v=UsviKNsOkUM), table tennis: (http://www.youtube.com/watch?v=2Y3YeYqTnSY), handball: (http://www.youtube.com/watch?v=w4zuaDe9dzs).
J Nonverbal Behav (2014) 38:13–29 17
123
Author's personal copy

perceiver was tested individually on a standard 17 inch notebook placed 60 cm away from
the perceivers. E-prime 2.0 professional (Psychological Software Tools 2007) was used to
present the stimuli and collect the judgments. All videos were presented silently to ensure
that ratings were based on NVB and not, for example, crowd noise. For every perceiver the
software randomly chose 12 videos from the categories far behind and high lead for both
basketball and table tennis. For the other three categories close behind, draw, and close
lead only four videos for each sport were randomly chosen so that twelve videos were also
presented for the combined category ‘‘close score.’’ Hence, every perceiver viewed 72
videos out of the 200 video clip battery in random order. In other words, different per-
ceivers were randomly assigned to different sets of videos. This approach helps to ensure
that results do not depend on specific combinations of stimuli. After every video clip
perceivers had to give their rating by clicking the left mouse button on the score estimation
scale described above. After completing the testing procedure, participants were informed
about the purpose of the experiment.
Results
The descriptive results of Experiment 1 are displayed in Fig. 1. A 2 (basketball vs. table
tennis) 9 5 (far behind, close behind, draw, close lead, and high lead) ANOVA revealed a
significant main effect of sport on overall score estimates [F(1, 39) = 22.734, p \ .001,
g2p = .368] indicating overall higher ratings—closer towards the ‘‘high lead’’ pole of the
scale—in the sport of table tennis. Most importantly, there was a significant main effect of
actual score on the score estimates [F(3.272, 127.619) = 35.257, p \ .001, g2p = .475]
indicating that perceivers were very accurate at estimating whether both basketball and
table tennis players were leading or trailing. In addition, there was a significant interaction
between sport and actual score [F(2.814, 109.727) = 8.369, p \ .001, g2p = .177].
Follow-up polynomial linear contrasts across both sports revealed a strong linear
relationship between the score estimates and the score categories [F(1, 39) = 259.40,
p \ .001, g2p = .869] demonstrating that the score estimates corresponded in a linear
manner with the scores during the game. The significant interaction in the overall ANOVA
is explained by the larger effect size in the linear contrast analysis for the basketball stimuli
[F(1, 39) = 195.881, p \ .001, g2p = .834] compared to the table tennis stimuli [F(1,
39) = 77.180, p \ .001, g2p = .664].
Discussion
Across two different sports, inexperienced perceivers, with no domain specific knowledge
regarding basketball or table tennis, as assessed via self-ratings, were able to estimate the
tendency of who was leading and who was trailing based on thin slices of NVB. In
accordance with Clark-Carter (1997) who suggested that g2p values above 0.138 may be
classified as large effects, the main effect of actual score on the score estimates g2p = .475
observed in Experiment 1 represents a large statistical effect. This finding is in line with
our hypothesis derived from evolutionary accounts of NVB (Fridlund 1994 Shariff and
Tracy 2011) and the thin slices literature (Ambady et al. 2000; Ambady and Rosenthal
1992). Hence, communicating internal states nonverbally—in this case nonverbal signals
associated with leading and trailing in sporting competitions—seems to be readily rec-
ognized and understood among adults (Burgoon 1996).
Although the findings of Experiment 1 might be interpreted as being in line with
evolutionary accounts of NVB, they do not necessarily suggest that reliable decoding of
18 J Nonverbal Behav (2014) 38:13–29
123
Author's personal copy

nonverbal cues represents a fixed capacity that humans are born with. Recent evidence
(Batty and Taylor 2006; Durand et al. 2007; Gao and Maurer 2010; Ross et al. 2012; Tonks
et al. 2007) suggests that decoding of nonverbal signals has both a nature and a nurture
component. Hence, interpreting nonverbal cues as indicative of leading or trailing might
further depend on learning, experience, and brain maturation processes (Balas et al. 2012;
Thomas et al. 2007). Therefore, we replicated Experiment 1 with a group of 4–8 year old
and 9–12 year old children following a similar between-group approach as Balas et al.
(2012).
Experiment 2: Leader–Trailer Judgments in Children
The disentanglement of the relative contributions of nature and nurture in the nonverbal
encoding and decoding of internal states is complicated by the fact that children are
exposed to complex emotional experiences from their birth. However, there is increasing
evidence suggesting that the nonverbal recognition of emotions continues to develop until
adulthood (Kolb et al. 1992; Tonks et al. 2007). These findings are interpreted as devel-
opmental adaptations to the increasing demands of the social environment as humans grow
older. Therefore, adults show a more sensitive fine-tuning regarding both differentiation
and reliably judging the intensity of different emotions (Ross et al. 2012). The authors
assume that ongoing brain maturation contributes to this finding as brain regions associated
with social and emotional perception undergo developmental structural changes at least
until the end of the second decade of life. In addition, Balas et al. (2012) provided first
evidence that the reliable judgments from thin slices of NVB only develop slowly.
Fig. 1 Mean score (0 = far behindhigh lead) estimates as a function of score category and sport. Errorbars represent standard errors
J Nonverbal Behav (2014) 38:13–29 19
123
Author's personal copy

Therefore, we hypothesized that children would be able to distinguish between leading and
trailing athletes, but that their estimations would be less accurate than adults’ estimations
as obtained in Experiment 1.
Method
Participants
Forty-four children (23 male and 21 female) took part in the study. In line with Balas et al.
(2012) we divided the participants in different age groups. Twenty-two children made up
the 4–8 year old group (11 male and 11 female; M = 6.7 years; SD = 1.4) and another
twenty-two the 9–12 year old group (12 male and 10 female; M = 11.1 years; SD = 0.8).
Gender did not significantly influence the pattern of results. Written informed consent was
obtained from the parents of every participant before commencing the experiment. The
study was carried out in accordance with the Helsinki Declaration of 1975.
We utilized exactly the same stimuli and experimental procedure as in Experiment 1.
Results
The descriptive results of Experiment 2 are displayed in Fig. 2. A 2 (4–8 year vs.
9–12 year) 9 2 (basketball vs. table tennis) 9 5 (far behind, close behind, draw, close
lead, and high lead) ANOVA again revealed a significant main effect of actual score on the
score estimates [F(4, 168) = 9.800, p \ .001, g2p = .189] indicating that irrespective of
the age group and stimulus material children were able to estimate who was leading or
trailing based on NVB. No other main effects or interactions reached significance (all
p \ .32). Interestingly, the interaction between age group and actual score [F(4, 168) =
.421, p = .793, g2p = .01] was not significant and did not show any trend that the older
children were better able to judge who was leading or trailing (cf. Fig. 2). In Experiment 2,
the sport from which the stimulus material was selected did not have any influence on the
ratings. The young participants were equally likely to correctly decode the NVBs in both
sports as signs of leading and trailing.
Polynomial linear contrasts across both sports again revealed a strong linear relationship
between the score estimates and the score categories [F(1, 42) = 58.40, p \ .001,
g2p = .582] for both the younger and older children (cf. Fig. 2). The linear contrast ana-
lysis demonstrated similar effects for both the younger [F(1, 21) = 36.850, p \ .001,
g2p = .637] and older children [F(1, 21) = 25.153, p \ .001, g2
p = .545].
Comparison Between Adults and Children
In order to compare the adults’ results from Experiment 1 with the children’s results from
Experiment 2 (see Fig. 3 for an overview), we calculated confidence intervals for the effect
sizes of the polynomial linear contrasts that depict the linear relationship between the score
estimates and the score categories (Cumming 2012). In order to do so, we first calculated
the polynomial linear contrasts collapsed across both sports for adults (g2p = .870) and for
children (g2p = .583). We transformed partial eta-square into the effect size r using the
calculations provided by Cohen (1988) and then calculated the 95 % confidence intervals
for both effect sizes (Cumming 2012). Confidence intervals of the adults’ effect size
20 J Nonverbal Behav (2014) 38:13–29
123
Author's personal copy

[r = .93, 95 % CI (.871, .963)] and the children’s effect size [r = .76, 95 % CI (.598,
.862)] do not overlap. This finding suggests that adults’ score estimations corresponded to a
higher degree with the actual score than children’s estimations (cf. Fig. 3).
Fig. 2 Mean score (0 = far behindhigh lead) estimates as a function of score category and child age group.Error bars represent standard errors
Fig. 3 Mean score (0 = far behindhigh lead) estimates as a function of score category and age group.Error bars represent standard errors
J Nonverbal Behav (2014) 38:13–29 21
123
Author's personal copy

Discussion
The results from Experiment 2 showed that children between 4 and 12 years of age were
able to reliably distinguish between athletes who were trailing by far from athletes who
were leading in the sports of basketball and table tennis. Again, the main effect of actual
score on the score estimates g2p = .189 observed in Experiment 2 represents a large
statistical effect and is in line with our hypothesis derived from evolutionary accounts of
nonverbal expressions (e.g., Shariff and Tracy 2011) and the thin slices literature (Ambady
et al. 2000; Ambady and Rosenthal 1992). Older children (9–12 years) were no more
accurate at estimating who was leading or trailing based on NVB than young children
(4–8 years).
However, and in line with previous findings (Balas et al. 2012; Ross et al. 2012; Thomas
et al. 2007), adults’ score ratings corresponded to a higher degree to the actual score of the
experimental stimuli, which was evident in a larger effect size in the linear contrast
analysis for adults. This finding suggests that the fine-tuning (Thomas et al. 2007) of
distinguishing between subtle nonverbal cues continues to develop until adulthood. Pre-
vious theorizing has suggested that this finding might be explained by the increasing
demands of the social environment (Batty and Taylor 2006; Durand et al. 2007; Gao and
Maurer 2010; Tonks et al. 2007) and by brain maturation processes (Batty and Taylor
2006; Thomas et al. 2007, 2001). The fact that we only found a difference between adults
and children and not between younger and older children might be interpreted as in line
with the suggestion that adolescence is a highly important developmental phase in the
decoding of NVB (Ross et al. 2012).
As the results of Experiments 1 and 2 suggest, that experience seemed to influence the
effect of estimating who was leading and trailing based on NVB, we attempted to further
investigate whether domain specific sport knowledge would influence this effect in
Experiment 3. As we only controlled for experience in playing the respective sports in
Experiment 1 and not TV exposure, which might mean that the participants were not
entirely ignorant of table tennis or basketball, we controlled for sport TV exposure addi-
tionally in Experiment 3. Furthermore, we followed a recent call by Fiedler (2011), who
pointed out the necessity of replicating effects found with one set of stimuli with different
stimuli to ensure that the phenomenon of interest does not only apply to a highly specific
set of stimulus material, but applies generally for the phenomenon of interest.
Experiment 3: Experience based Differences in Estimating Who’s Leading or Trailing
Method
Participants
Altogether 40 participants took part in Experiment 3. Twenty college students (10 male
and 10 female; M = 23.6; SD = 2.28) reported having no experience in playing handball
and not following handball on television (Mhours of handball on TV/week = 0.09; SD = 0.19).
The other twenty participants were competitive handball players who were competing at an
amateur to semi-professional level in Germany (10 male and 10 female; Mage = 25.3;
SD = 4.38; Myears of handball experience = 17.5; SD = 5.44; Mhours of handball on TV/week = 1.5;
SD = 1.65). Two independent t tests verified that both groups differed significantly in both
average years of handball experience (t(38) = 13.94, p \ .001, two-tailed) and average
22 J Nonverbal Behav (2014) 38:13–29
123
Author's personal copy

TV exposure of handball per week (t(38) = 3.778, p = .001, two-tailed). Hence, the
samples chosen were suitable for investigating whether domain-specific sports knowledge
influences the score estimates. Otherwise, neither gender nor age significantly influenced
the pattern of results. Written informed consent was obtained from every participant before
commencing the experiment. The study was carried out in accordance with the Helsinki
Declaration of 1975.
Stimuli
We selected video footage of televised handball games according to similar criteria as in
Experiment 1 from a convenience sample of 20 games of the European Championships of
men in 2012 and the World Championships of women in 2011. Again, we only chose
scenes that involved breaks during the game—including time-outs or situations in which
the ball was out of bounds. In addition, the scenes did not show any of the obvious
nonverbal signals that have been empirically linked to victory and defeat in sport (cf. Tracy
and Matsumoto 2008). Although it seems unlikely, as participants in Experiment 1 were
not familiar with the respective sports, a possible alternative explanation for the results is
that participants used actual playing level or reputation of teams or athletes (or some other
variable that is correlated with playing level such as reputation) as cues for their estimates.
In order to rule out this possibility in Experiment 3, we made sure that the actual playing
level of the team shown was not confounded with the score category of the video.
Therefore, we checked that the placing of the teams in the respective tournaments was
equally distributed in all experimental categories. After selection, videos had a mean
duration of 4 s (SD = 2; Mode1 = 2; Mode2 = 3). An additional variation to Experiment
1 stemmed from the specific rules of team-handball which result in fewer regular breaks
during the game than in basketball and table tennis. Therefore, we decided to not only
depict athletes’ NVB but also the NVB of coaches during competition in order to obtain an
equal amount of videos from our sample of games as in Experiment 1.
Experimental Manipulation
We chose the same five categories as in Experiment 1: (1) far behind, showing a team that
is at least seven goals behind and always lost the game in the end; (2) close behind,
showing a team that is exactly two goals behind; (3) a draw in which the score was equal;
(4) close lead, showing a team that is exactly two goals ahead; (5) high lead, a team at least
seven goals ahead and always winning the game in the end. Videos were again selected by
student research assistants. Again, we aimed at finally having 20 videos in each score
category (see Footnote for the hyperlink to the utilized stimulus material). Selection
guidelines were the same as in Experiment 1, except that the research assistants could also
include videos depicting the coach.
Procedure and Measure
The procedure and measure used in Experiment 3 was similar to Experiment 1 and only the
changes are described. In Experiment 3, the stimulus material was taken exclusively from
handball. The software randomly chose twelve videos from the categories far behind and
high lead. For the other three categories close behind, draw, and close lead only four videos
were randomly chosen so that twelve videos were also presented for the combined category
J Nonverbal Behav (2014) 38:13–29 23
123
Author's personal copy
‘‘close score.’’ Hence, every perceiver viewed 36 videos out of the 100 video clip battery in
random order.
Results
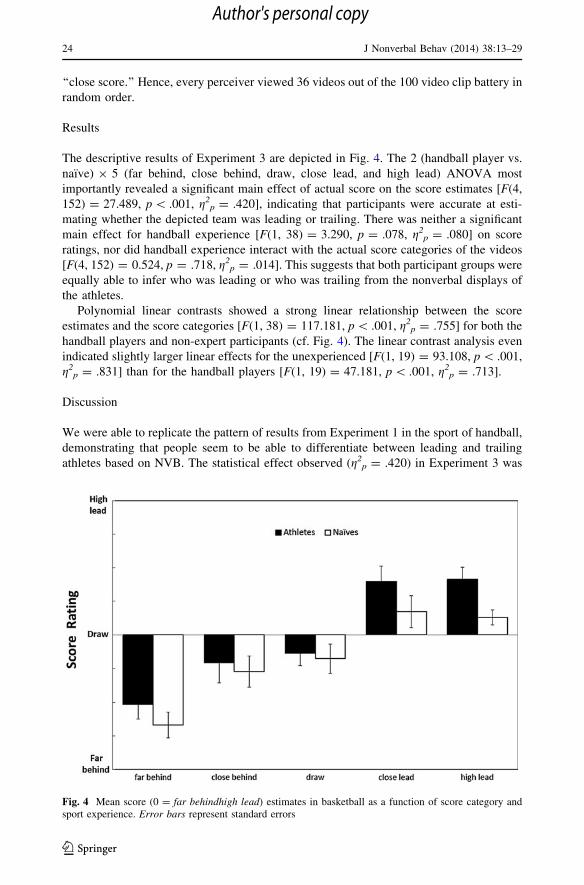
The descriptive results of Experiment 3 are depicted in Fig. 4. The 2 (handball player vs.
naıve) 9 5 (far behind, close behind, draw, close lead, and high lead) ANOVA most
importantly revealed a significant main effect of actual score on the score estimates [F(4,
152) = 27.489, p \ .001, g2p = .420], indicating that participants were accurate at esti-
mating whether the depicted team was leading or trailing. There was neither a significant
main effect for handball experience [F(1, 38) = 3.290, p = .078, g2p = .080] on score
ratings, nor did handball experience interact with the actual score categories of the videos
[F(4, 152) = 0.524, p = .718, g2p = .014]. This suggests that both participant groups were
equally able to infer who was leading or who was trailing from the nonverbal displays of
the athletes.
Polynomial linear contrasts showed a strong linear relationship between the score
estimates and the score categories [F(1, 38) = 117.181, p \ .001, g2p = .755] for both the
handball players and non-expert participants (cf. Fig. 4). The linear contrast analysis even
indicated slightly larger linear effects for the unexperienced [F(1, 19) = 93.108, p \ .001,
g2p = .831] than for the handball players [F(1, 19) = 47.181, p \ .001, g2
p = .713].
Discussion
We were able to replicate the pattern of results from Experiment 1 in the sport of handball,
demonstrating that people seem to be able to differentiate between leading and trailing
athletes based on NVB. The statistical effect observed (g2p = .420) in Experiment 3 was
Fig. 4 Mean score (0 = far behindhigh lead) estimates in basketball as a function of score category andsport experience. Error bars represent standard errors
24 J Nonverbal Behav (2014) 38:13–29
123
Author's personal copy

similar to Experiment 1 (g2p = .475) and confirms that nonverbal expressions associated
with leading and trailing have a large effect (Clark-Carter 1997) on estimating the score. In
addition, domain specific knowledge did not influence this finding, as both proficient
handball players and unexperienced students rated the experimental categories similarly.
This finding is in line with the assumption of evolutionary accounts of NVB (Darwin 1872;
Shariff andand Tracy 2011) that humans have evolved the ability to perceive emotions
(Ekman 1992) and other internal states (Fridlund 1994) communicated by another person
nonverbally.
Of further interest, the main effect of actual score on score estimates was significant
when only analyzing the clips (45 clips) that primarily depicted the coaches’ NVB
(p \ .001, g2p = .220) and the clips (55 clips) that primarily depicted the players’ NVB
(p \ .001, g2p = .265). This suggests that both coaches and players alter their NVB as a
function of leading and trailing in ongoing competition that can be used as cues for the
actual score. However, this post hoc analysis is problematic as we did not treat this as an
experimental factor in the planning of our research method. Therefore, the ratios of coach
versus player stimuli were not evenly distributed across the experimental categories. In
addition, the random selection of the E-prime software was not programmed to display the
same number of coach and player videos. Hence, although interesting, future research will
have to confirm this initial finding.
General Discussion
The aim of the present study was to investigate whether people are able to detect who is
leading or trailing in an ongoing sport competition based solely on nonverbal cues. The
present research was the first to show that leading and trailing in sports are associated with
nonverbal cues that are interpreted as signs of winning and losing. Thin slices of behavior
(very short recordings of athletes’ and coaches’ behavior) were sufficient to permit quite
precise estimates of the actual score in sport competitions. We were able to obtain this
finding with stimuli from both individual and team sports, with stimuli depicting athletes
and stimuli depicting coaches, amongst adults and children, and amongst observers with
and without experience in the respective sport. Whilst domain-specific knowledge did not
influence the effect, age did. Together with previous findings (Balas et al. 2012; Batty and
Taylor 2006; Durand et al. 2007; Gao and Maurer 2010; Ross et al. 2012; Thomas et al.
2007; Thomas et al. 2001; Tonks et al. 2007), the fact that we only found a difference
between adults and children, and not between younger and older children, suggests that
adolescence might be a highly important developmental phase in the decoding of non-
verbal behavior.
The findings presented were not only in line with evolutionary accounts of NVB
(Fridlund 1994; Shariff and Tracy 2011) and the thin slices of behavior hypothesis
(Ambady et al. 2000; Ambady and Rosenthal 1992), but they add significantly to the
literature on nonverbal behavior in sports. So far, research on nonverbal behavior in sports
has either focused on post-performance emotional expressions (Matsumoto and Willing-
ham 2006) or it has focused on pre-performance NVB (Furley and Dicks 2012; Furley et al.
2012a, 2012b; Greenlees et al. 2005a, 2005b). In contrast, our research suggests that NVB
occurring during different stages of the game can be interpreted as cues as to who is
currently leading and who is trailing.
One strength of the present research was that we were able to obtain the predicted
findings in three different studies (altogether 124 participants) with stimuli from three
J Nonverbal Behav (2014) 38:13–29 25
123
Author's personal copy

different sports. Among these were both individual (table tennis) and team sports (bas-
ketball, handball). Furthermore, not all observers were shown the same stimuli, but dif-
ferent participants were randomly assigned to different subsets of all stimuli. These
approaches are likely to reduce the probability that effects were dependent on one par-
ticular set of highly selected stimuli, as recently called for in psychological research
(Fiedler 2011). It is also in line with the calls for replication that are becoming more
frequent in the psychological literature (Pashler and Wagenmarkers 2012; Yong 2012).
Therefore, it is our further hope that other research groups will be stimulated to replicate
and extend these first findings.
The finding that laypeople and young children were able to distinguish between leading
and trailing athletes based on NVB provides support for the evolutionary nature of NVB
and its interpretation (Fridlund 1994; Shariff and Tracy 2011). Although the findings can
be interpreted as being in line with evolutionary accounts of NVB, the comparison between
children and adults suggests that the decoding of nonverbal cues has both a nature and a
nurture component. On the one hand, a line of previous research suggests that the display
of NVB as a consequence of success and failure has a strong nature component. In this
respect, Tracy and Matsumoto (2008) found that sighted, blind, and congenitally blind
athletes in Olympic competitions show similar NVB, although the latter athletes could not
have been socialized to display these NVB. On the other hand, the present findings, in
combination with the reviewed developmental studies, suggest that the fine-tuning of
interpreting nonverbal signals also has a nurture component. Nevertheless, future research
is needed on the relative contributions of nature and nurture in both the encoding and
decoding of nonverbal signals.
A further strength of the present approach is its high external validity. As the stimuli are
not artificially created—which is typical for the majority of research on NVB in sports
(Furley et al. 2012a, b; Greenlees et al. 2005a, b)—but recordings of real sports compe-
titions, the results are likely to transfer to the field. Hence, people are likely to accurately
infer who is currently leading or trailing from athletes’ NVB. Using true life stimuli
provides the additional advantage that the accuracy of participants’ estimates can be
assessed based on an objective criterion, the score. Our findings thereby add to the thin
slices literature by remedying a common problem of this paradigm, namely that the cri-
terion for predictions cannot be objectively assessed (Ambady et al. 2000; Ambady and
Rosenthal 1992).
The main limitation of our research so far concerns potential selection bias with regard
to the collection of the stimulus material, which is a common problem in psychological
literature (Fiedler 2011). Although we paid careful attention to this point when selecting
the stimulus material, we cannot entirely rule out the possibility that scores are not only
correlated with NVB, but confounded or influenced with some third variable that is dis-
played in the video clips. If this were true, participants would not only estimate scores
based on NVB, but on some other variable. We consider this possibility to be rather small,
as we found effects for three different sets of video clips.
In addition, some athletes were present in several score categories, and it seems feasible
that differentiating between leading and trailing would be easier for the same athlete than
for different athletes. Further, potential problems in the stimulus material might be that
some athletes could be more expressive than others, or that some video clips contained
more information than others. Hence, we cannot entirely rule out that certain stimuli or
constellations of stimuli mainly account for the pattern of results. We tried to partially
address this issue by our random selection procedure from our stimuli battery. Neverthe-
less, these issues highlight important avenues for future research. In order to maximize
26 J Nonverbal Behav (2014) 38:13–29
123
Author's personal copy

transparency in the research conducted, we provide hyperlinks to the stimulus material
utilized in the studies (see footnote). Hence, readers can judge for themselves the likeli-
hood of potential alternative explanations resulting from stimulus selection. In this respect,
we follow a recent call by Pashler and Wagenmarkers (2012) on how to reduce the ‘‘crisis
of confidence in psychological science’’ (p. 1).
While answering important questions, our research also poses new ones, both on a
theoretical and an applied level. These questions refer to the functionality of the phe-
nomenon we described in competitive sports. According to evolutionary accounts of
nonverbal expressions, submissive nonverbal expressions originally served the function of
avoiding further attacks in a fight (Shariff and Tracy 2011). This seems highly functional
during a fight between primates (or other animals), as the winning competitor is likely to
stop hurting the opponent any further when perceiving submissive NVB. However, the
story might be quite different in competitive sports: Here, showing ‘‘losing-NVB’’ might
be highly dysfunctional, as the winning opponent is not likely to hold off. When perceiving
‘‘losing-NVB’’, the winning opponent might even increase pressure. This reasoning sug-
gests that certain evolved behaviors may be dysfunctional in certain domains of modern
life. What makes sense for a primate losing a fight may lead to exacerbating the downward
spiral for athletes on the losing side.
Another interesting question concerns possible interactions between leading and trailing
athletes. How do leading athletes react to the expression of submission by their losing
opponent? This question directly leads to applied aspects of the present research. So far, we
have shown that leading or trailing is correlated with the expression of certain NVB that
other people can use in order to correctly infer who’s leading or trailing. However, we do
not know how the NVB themselves may in turn influence further gameplay and the score.
Athletes might recognize their opponents’ NVB and react accordingly—either with
increased motivation (when leading) or apathy and decreased motivation (when trailing),
for example. In line with this suggestion, previous research (Furley et al. 2012a, b) shows
that athletes are more confident in competition when observing submissive or anxious
NVB amongst their opponents prior to performance. As the perception of NVB seems to
influence the self-efficacy of athletes (Furley et al. 2012a, b; Furley and Dicks 2012) and
even their behavior (Furley et al. 2012a, b), the present findings may have important
practical implications for sport teams and individual athletes that might for example help
them avert the downward spiral of trailing in a competition.
In conclusion, the present research highlights that people are well-equipped to pick up
subtle changes in NVB associated with leading and trailing in sport competitions. This
seems to hold for individual and team sports, for experts and laypersons, and for children
and adults.
Acknowledgments Special thanks go to Manuel Thiel, Christoph Haberl, Christoph Sobotta, and Wolf-gang Walther for helping with the data collection and programming in this study. Further we would like tothank William D. Furley for copy editing the manuscript.
References
Ambady, N., Bernieri, F. J., & Richeson, J. A. (2000). Toward a histology of social behavior: Judgmentalaccuracy from thin slices of the behavioral stream. In M. P. Zanna (Ed.), Advances in experimentalsocial psychology (Vol. 32, pp. 201–271). San Diego, CA: Academic Press.
Ambady, N., & Gray, H. M. (2002). On being sad and mistaken: Mood effects on the accuracy of thin-slicejudgments. Journal of Personality and Social Psychology, 83, 947–961. doi:10.1037//0022-3514.83.4.947.
J Nonverbal Behav (2014) 38:13–29 27
123
Author's personal copy

Ambady, N., Krabbenhoft, M. A., & Hogan, D. (2006). The 30-sec sale: Using thin-slice judgments to evaluatesales effectiveness. Journal of Consumer Psychology, 16, 4–13. doi:10.1207/s15327663jcp1601_2.
Ambady, N., & Rosenthal, R. (1992). Thin slices of expressive behavior as predictors of interpersonalconsequences: A meta-analysis. Psychological Bulletin, 111, 236–274. doi:10.1037//0033-2909.111.2.256.
Archer, J. (2006). Testosterone and human aggression: An evaluation of the challenge hypothesis. Neuro-science and Biobehavioral Reviews, 30, 319–345. doi:10.1016/j.neubiorev.2004.12.007.
Balas, B., Kanwisher, N., & Saxe, R. (2012). Thin-slice perception develops slowly. Journal of Experi-mental Child Psychology, 112, 257–264. doi:10.1016/j.jecp.2012.01.002.
Batty, M., & Taylor, M. J. (2006). The development of emotional face processing during childhood.Developmental Science, 9, 207–220. doi:10.1111/j.1467-7687.2006.00480.x.
Booth, A., Shelley, G., Mazur, A., Tharp, G., & Kittok, R. (1989). Testosterone and winning and losing inhuman competition. Hormones and Behavior, 23, 556–571. doi:10.1016/0018-506X(89)90042-1.
Borkenau, P., Mauer, N., Riemann, R., Spinath, F. M., & Angleitner, A. (2004). Thin slices of behavior ascues of personality and intelligence. Journal of Personality and Social Psychology, 86, 599–614.doi:10.1037/0022-3514.86.4.599.
Burgoon, J. K. (1996). Nonverbal signals. In M. L. Knapp & G. R. Miller (Eds.), Handbook of interpersonalcommunication (2nd ed., pp. 344–390). Beverly Hills, CA: Sage.
Carney, D. R., Colvin, C. R., & Hall, J. A. (2007). A thin slice perspective on the accuracy of firstimpressions. Journal of Research in Personality, 41(5), 1054–1072. doi:10.1016/j.jrp.2007.01.004.
Carney, D., Cuddy, A., & Yap, A. (2010). Power posing: Brief nonverbal displays affect neuroendocrinelevels and risk tolerance. Psychological Science, 21, 1363–1368. doi:10.1177/0956797610383437.
Clark-Carter, D. (1997). Doing quantitative psychological research: From design to report. Hove: Psy-chology Press.
Cohen, J. (1988). Statistical power analysis for the behavioral sciences. Hillsdale, NJ: Erlbaum.Cumming, G. (2012). Understanding the new statistics: Effect sizes, confidence intervals, and meta-analysis.
New York: Routledge.Curhan, J., & Pentland, A. (2007). Thin slices of negotiation: Predicting outcomes from conversational
dynamics within the first five minutes. Journal of Applied Psychology, 92, 802–811. doi:10.1037/0021-9010.92.3.8027.
Darwin, C. (1872). The expression of emotions in man and animals. London: Murray.de Waal, F. (1998). Chimpanzee politics: Power and sex among apes. Baltimore, MD: Johns Hopkins
University Press.Durand, K., Gallay, M., Seigneuric, A., Robichon, F., & Baudouin, J. Y. (2007). The development of facial
emotion recognition: The role of configural information. Journal of Experimental Child Psychology,97, 14–27. doi:10.1016/j.jecp.2006.12.001.
Ekman, P. (1992). An argument for basic emotions. Cognition and Emotion, 6, 169–200. doi:10.1080/02699939208411068.
Fiedler, K. (2011). Voodoo correlations are everywhere—not only in neuroscience. Perspectives on Psy-chological Science, 6, 163–171. doi:10.1177/1745691611400237.
Fridlund, A. J. (1994). Human facial expression: An evolutionary view. San Diego, CA: Academic.Furley, P., & Dicks, M. (2012). ‘‘Hold your head high’’. The influence of emotional versus neutral nonverbal
expressions of dominance and submissiveness in baseball. International Journal of Sport Psychology,43, 294–311.
Furley, P., Dicks, M., & Memmert, D. (2012a). Nonverbal behavior in soccer: The influence of dominantand submissive body language on the impression formation and expectancy of success of soccerplayers. Journal of Sport and Exercise Psychology, 34, 61–82.
Furley, P., Dicks, M., Stendtke, F., & Memmert, D. (2012b). ‘‘Get it out the way. The wait’s killing me.’’Hastening and hiding during soccer penalty kicks. Psychology of Sport and Exercise, 13, 454–465.doi:10.1016/j.psychsport.2012.01.009.
Gao, X., & Maurer, D. (2010). A happy story: Developmental changes in children’s sensitivity to facialexpressions of varying intensities. Journal of Experimental Child Psychology, 107, 67–86. doi:10.1016/j.jecp.2010.05.003.
Greenlees, I. A., Bradley, A., Holder, T. P., & Thelwell, R. C. (2005a). The impact of opponents’ non-verbalbehaviour on the first impressions and outcome expectations of table-tennis players. Psychology ofSport and Exercise, 6, 103–115. doi:10.1016/j.psychsport.2003.10.002.
Greenlees, I. A., Buscombe, R., Thelwell, R. C., Holder, T. P., & Rimmer, M. (2005b). Impact of opponents’clothing and body language on impression formation and outcome expectations. Journal of Sport andExercise Psychology, 27, 39–52.
28 J Nonverbal Behav (2014) 38:13–29
123
Author's personal copy

Kolb, B., Wilson, B., & Taylor, L. (1992). Developmental changes in the recognition and comprehension offacial expression: Implications for frontal lobe function. Brain and Cognition, 20, 74–84. doi:10.1016/0278-2626(92)90062-Q.
Kruglanski, A. W. (1989). The psychology of being ‘‘right’’. The problem of accuracy in social perceptionand cognition. Psychological Bulletin, 106, 394–409. doi:10.1037/0033-2909.106.3.395.
Matsumoto, D., & Willingham, B. (2006). The thrill of victory and the agony of defeat: Spontaneousexpressions of medal winners at the 2004 Athens Olympic Games. Journal of Personality and SocialPsychology, 91, 568–581. doi:10.1037/0022-3514.91.3.568.
Mazur, A., & Booth, A. (1998). Testosterone and dominance in men. Behavioral and Brain Sciences, 21,353–397. doi:10.1017/S0140525X98001228.
McArthur, L. Z., & Baron, R. M. (1983). Toward an ecological theory of social perception. PsychologicalReview, 90, 215–238. doi:10.1037//0033-295X.90.3.215.
Mehta, P. H., Jones, A. C., & Josephs, R. A. (2008). The social endocrinology of dominance: Basaltestosterone predicts cortisol changes and behavior following victory and defeat. Journal of Person-ality and Social Psychology, 94, 1078–1093. doi:10.1037/0022-3514.94.6.1078.
Mehta, P. H., & Josephs, R. A. (2010). Testosterone and cortisol jointly regulate dominance: Evidence for adual-hormone hypothesis. Hormones and Behavior, 58, 898–906. doi:10.1016/j.yhbeh.2010.08.020.
Parkinson, B. (2005). Do facial movements express emotions or communicate motives? Personality andSocial Psychology Review, 9, 278–311. doi:10.1207/s15327957pspr0904_1.
Pashler, H., & Wagenmarkers, E.-J. (2012). Editors’ introduction to the special section on replicability inpsychological science. A crisis of confidence? Perspectives on Psychological Science, 7, 528–530.doi:10.1177/1745691612465253.
Ross, P. D., Polson, L., & Grosbras, M. H. (2012). Developmental changes in emotion recognition from full-light and point-light displays of body movement. PLoS One, 7(9), e44815. doi:10.1371/journal.pone.0044815.
Rule, N. O., & Ambady, N. (2008). The face of success: Inferences from chief executive officers’appearance predict company profits. Psychological Science, 19, 109–111. doi:10.1111/j.1467-9280.2008.02054.x.
Shariff, A. F., & Tracy, J. L. (2011). What are emotion expressions for? Current Directions in PsychologicalScience, 20, 395–399. doi:10.1177/0963721411424739.
Thomas, L. A., De Bellis, M. D., Graham, R., & LaBar, K. S. (2007). Development of emotional facialrecognition in late childhood and adolescence. Developmental Science, 10, 547–558. doi:10.1111/j.1467-7687.2007.00614.x.
Thomas, K. M., Drevets, W. C., Whalen, P. J., Eccard, C. H., Dahl, R. E., et al. (2001). Amygdala responseto facial expressions in children and adults. Biological Psychiatry, 49, 309–316. doi:10.1016/S0006-3223(00)01066-0.
Tonks, J., Williams, W. H., Frampton, I., Yates, P., & Slater, A. (2007). Assessing emotion recognition in9–15-years olds: preliminary analysis of abilities in reading emotion from faces, voices and eyes. BrainInjury, 21, 623–629. doi:10.1080/02699050701426865.
Tracy, J. L., & Matsumoto, D. (2008). The spontaneous display of pride and shame: Evidence for bio-logically innate nonverbal displays. Proceedings of the National Academy of Sciences, 105,11655–11660. doi:10.1073/pnas.0802686105.
Yong, E. (2012). Replication studies: Bad copy. Nature, 485, 298–300. doi:10.1038/485298a.
J Nonverbal Behav (2014) 38:13–29 29
123
Author's personal copy