special section the international mobility of inventors … · special section the international...
TRANSCRIPT
SPECIAL SECTION THE INTERNATIONAL MOBILITY OF INVENTORS
21
Introduction
The relationship between migration and innovation has
become a major focus of research by academics and pol-
icymakers alike. The key factor driving this development
is the observation that high-skilled migrants decisively
contribute to innovation outcomes, to the international
diffusion of knowledge and, ultimately, to the economic
growth of nations.
In some of the largest migrant-receiving countries (e.g.,
the United States of America (US)), immigrants are over-
represented among the most skilled workers. While immi-
grants account for about 12% of the entire US labor force,
they account for 25% of US scientists and engineers,
50% of US PhDs, 60% of post-doctoral students, and
26% of US-based Nobel Laureates (Black and Stephan,
2008; Kerr, 2009). Some anecdotal evidence suggests
that this overrepresentation of immigrants among high-
skilled workers is not unique to the US, but extends to
other countries that receive large numbers of migrants
(Fink et al, 2013). Thus, an increasing, albeit still limited,
number of studies have linked high-skilled immigration to
knowledge creation (see Breschi et al, 2013; Kerr, 2013,
for recent surveys). Given this situation, many countries
are currently debating and reforming their immigration
policies. A key question governments and policy makers
face is how to attract skilled workers who can relieve
domestic skills shortages and foster innovation.
This special section discusses the opportunities for using
IP data and patent applications, in particular, for migration
related research. It does so by describing the main pat-
terns and trends in inventor international migration – data
which were elicited from information contained in Patent
Cooperation Treaty (PCT) applications. The next section
briefly describes the source of the data, while the follow-
ing sections more extensively analyze aggregated figures
on the phenomenon of inventor migration and explore
the possibilities of using these data for future research.
What can patent data tell us about skilled migration?
The literature on migration and innovation is limited, mainly
due to the relative lack of data that have characterized this
research field. In the last 15 years, census-based migra-
tion datasets have been the data source most commonly
used to conduct research on migration issues as well as
to study the migration-innovation nexus. These datasets
comprise information on migrants by destination country
based on population censuses. Notwithstanding their
value for economic research, census-based datasets
have certain limitations. For example, the data are only
released every 10 years. Moreover, the majority of existing
datasets provide a skills breakdown according to three
schooling levels: primary, secondary and tertiary, which
only offers a rough differentiation of skills.
SPECIAL SECTIONTHE INTERNATIONAL MOBILITY OF INVENTORS

SPECIAL SECTION THE INTERNATIONAL MOBILITY OF INVENTORS
22
More recently, information retrieved from patent docu-
ments has also been used for the purpose of undertaking
innovation-migration research. Broadly speaking, patent
applications contain relevant information on the inventors
and owners of the patent, including the inventors’/owners’
names and addresses, technologies (IPC classifications)
and backward citations. Thus, patent data are an unri-
valled indicator for studying a number of innovation-re-
lated phenomena, such as the mobility of inventors, their
social networks and the patterns of knowledge diffusion.
The potential benefits of using inventor migration data
as captured in patent applications - which this section
elucidates - are manifold. First, data are related to one
specific class of high-skilled workers that are bound to be
more homogenous than the group of tertiary-educated
workers as a whole. In addition, inventors arguably have
special economic importance, as they create knowledge
that is at the genesis of technological and industrial trans-
formation. The use of patent-inventor data for migration
analysis implies the direct measurement of migrants,
contribution to innovation in their destination countries’.
Finally, patent data (and therefore inventor-related infor-
mation) are collected on a yearly basis, and such data are
available for a large number of “sending” and “receiving
countries” at a relatively low cost.
Recently, scholars have undertaken studies of migrant
inventors using information from patent applications
(Breschi et al, 2013; Kerr, 2009). In particular, they have
sought to identify the likely cultural origin of inventor
names disclosed in patent data, which provides import-
ant insights. However, the cultural origin of inventor names
may not always indicate recent migratory background
– for example, Turkish immigrants in Germany.
PCT applications contain information on the nationality
of inventors as well as information on their country of
residence at (for a detailed description of the data source,
see Miguélez and Fink, 2013). This information is available
due to one of the requirements under the PCT specifying
that only nationals or residents of a PCT contracting
state can file PCT applications. To verify that applicants
meet at least one of the two eligibility criteria, the PCT
application form requires applicants to provide details
of both their nationality and their residency. Moreover, it
transpires that, until 2012, US patent application proce-
dures have required all inventors in PCT applications to
be listed as applicants. Thus, if a given PCT application
included the US as a country in which the applicant was
considering pursuing a patent – a so-called designated
state in the patent application – all inventors were listed
as applicants, whereby ensuring that information on their
residence and nationality were available. The majority of
PCT applicants seek protection in the US, reflecting the
popularity of this country as the world’s largest market.
As a result, these data offer a valuable resource to bet-
ter understanding high-skilled migration flows and their
implications for innovation.1
The PCT database comprises more than 6 million names
of the inventors detailed in PCT applications. These
names include some homonyms which may (or may
not) refer to the same inventor. The database does not,
however, provide a single identifier for each inventor,
which makes it difficult to consolidate inventor names.
For example, when two applications contain identical
inventor names, it is difficult to distinguish whether they
are filed by the same inventor or by two different inventors.
1 Unfortunately, the US enacted changes to its patent
laws under the Leahy-Smith America Invents Act
(AIA), which effectively removed the requirement
that inventors also be named as applicants.
Starting on September 16, 2012, PCT applicants
(automatically) designating the US became free to
list inventors and are no longer obliged to indicate
their nationality and residence. As a result, many
applicants do not provide such information any longer.

SPECIAL SECTION THE INTERNATIONAL MOBILITY OF INVENTORS
23
The economic literature has disambiguated individual
inventors through their names and surnames as well as
through other information contained in patent documents.
This section does not attempt to disambiguate inventor
names, and it treats each combination of the inventor
name with an application number as if it were a different
inventor. Although this approach is far from perfect, it
enables meaningful analysis on an aggregate level.
Overall, the share of PCT data with information on na-
tionality and residency was very high, i.e., approximately
80% for the 1978-2012 period. However, this coverage
was unevenly distributed over time – approximately 60-
70% during the 1990s and 70-95% during the 2000s.
Coverage was also unevenly distributed across coun-
tries: US (66%), Canada (81%), the Netherlands (74%),
Germany (95%), the United Kingdom (UK, 92%), France
(94%), Switzerland (93%), China (92%) and India (90%),
among others.
Using the inventor’s nationality information outlined above,
the following subsections present several migration-relat-
ed figures. These figures clearly show that the pattern of
inventor’s mobility, especially from the perspective of the
receiving countries, resembles other high-skilled migra-
tion figures, and in particular, what is known about the
migration of scientists and engineers based on anecdotal
evidence, surveys and media reports.
Where do migrant inventors emigrate to/come from?
Analysis of all records containing complete information
has shown that approximately 5 million, i.e., 9-10% of
inventors had a migration background – i.e., their place
of residence was different from their nationality. This
share has increased over time – it was 7.8% during the
1996-2000 period and 10.1% during the 2006-10 period.
Immigrant inventors were overwhelmingly concentrated
in high-income countries, both during the 1996-2000
and 2006-10 periods (see Table 1). North America ac-
counted for the highest concentration of immigrant
inventors in high-income economies. During the period
2006-10, 59.1% of immigrant inventors were residing
in North America – which is a share that is larger than
that recorded during the late 1990s. A total of 31.4% of
immigrant inventors lived in Europe over the 2006-10
period, which is lower than its 1996-2000 share. Asia
lagged far behind, accounting for 7.5% of all immigrant
inventors during the 2006-10 period.
Table 1: Shares of immigrant and emigrant inventors by income group and region: 1996-2000 and 2006-10
Income group / Region
Immigrant inventors (%)1996-2000
Immigrant inventors (%)
2006-10
Emigrant inventors (%) 1996-2000
Emigrant inventors (%)
2006-10Income groupHigh-income 98.1 97.2 66.9 57.7
Upper middle-income 1.7 2.4 22.2 26.8
Lower middle-income 0.2 0.3 10.4 14.9
Low-income 0.1 0.1 0.5 0.6
RegionAfrica 0.5 0.1 1.8 1.7
Asia 5.0 7.5 31.8 41.9
Europe 39.3 31.4 52.0 41.9Latin America and the Caribbean 0.7 0.3 2.2 2.7
North America 51.5 59.1 9.7 9.7
Oceania 3.1 1.5 2.5 2.1
Note: Income groups are defined according to the World Bank classification, 2012. Source: WIPO Statistics Database, October 2013

SPECIAL SECTION THE INTERNATIONAL MOBILITY OF INVENTORS
24
Table 1 also presents the data from the perspective of
the sending countries. The first interesting point to note
is that the largest proportion of out-migration of inventors
also occurred in high-income countries. However, the
share of inventor emigrants from these countries was
considerably lower when compared to the share of
inventor immigrants. Indeed, middle-income countries
accounted for more than 40% of emigrant inventors
during the 2006-10 period. Moreover, when the data for
the 1996-2000 and 2006-10 time periods are compared,
it is possible to see that the contribution of middle-income
economies increased considerably – i.e., approximately
nine percentage points – while the corresponding share
for high-income countries decreased by the same order
of magnitude.
Like immigration, emigration was highly concentrated in
two world regions, namely, Asia and Europe. Together
these two regions accounted for more than 83% of
inventor emigrants during the period 2006-10.2
2 It should be noted that from the 1996-2000 period
to 2006-10 period, the share of emigrant inventors
from Asian countries increased considerably i.e., from
31.8% to 41.9%, while the share of European emigrant
inventors decreased by approximately 10 percentage
points between the same time periods (see Table 1).
Table 2 provides immigrant and emigrant data broken
down by country. The majority of immigrant inventors
were concentrated in the US, which accounted for 57.1%
of all inventors during the 2006-10 period. European
countries, such as France, Germany, Switzerland, the
Netherlands and the UK, lagged far behind.
As can be observed, other high-income countries also
accounted for large numbers of emigrant inventors;
indeed, such countries were ranked among the top 20
in terms of having the largest emigrant communities.
However, for the 2006-10 period, China and India topped
the world ranking, followed by Germany and the UK.
When compared with immigration patterns, emigrant
inventors were more evenly distributed across countries.
On the one hand, the US alone received approximately
57% of all immigrant inventors; on the other, six coun-
tries (Canada, China, France, Germany, India and the
UK) hosted 57% of all emigrant inventors. Interestingly,
countries such as Canada, France, Germany and the
UK, despite being critical attractors of talent, saw more
inventors emigrating than immigrating.

SPECIAL SECTION THE INTERNATIONAL MOBILITY OF INVENTORS
25
Table 2: Top 20 countries with the largest inventor immigrant and emigrant communities, 2006-10
Country ImmigrantsShare of
world total (%) Country EmigrantsShare over
world total (%)United States of America 117,244 57.1 China 33,413 16.3
Germany 14,547 7.1 India 24,807 12.1
Switzerland 12,479 6.1 Germany 19,043 9.3
United Kingdom 9,113 4.4 United Kingdom 15,160 7.4
Netherlands 5,565 2.7 Canada 13,056 6.4
France 5,369 2.6 France 11,790 5.7
Singapore 4,334 2.1 United States of America 6,795 3.3
Canada 4,107 2.0 Republic of Korea 6,101 3.0
Japan 4,092 2.0 Italy 6,092 3.0
China 3,289 1.6 Netherlands 5,052 2.5
Sweden 3,204 1.6 Russian Federation 4,404 2.1
Belgium 3,173 1.5 Japan 4,029 2.0
Australia 2,441 1.2 Australia 3,212 1.6
Finland 1,969 1.0 Spain 3,085 1.5
Austria 1,905 0.9 Austria 2,775 1.4
Spain 1,590 0.8 Sweden 2,506 1.2
Denmark 1,520 0.7 Israel 2,252 1.1
Republic of Korea 1,188 0.6 Turkey 2,046 1.0
Italy 1,108 0.5 Belgium 1,932 0.9
Ireland 1,092 0.5 Greece 1,886 0.9
World 205,446 100 World 205,446 100
Source: WIPO Statistics Database, October 2013
Figure 1: Inventor immigration rates for the largest receiving countries, 2006-10
Inventor immigration rate (%): 1996-2000
44.3 28.6 15.8 17.0 16.9 14.9 8.6 9.8 8.2 10.8 5.6 10.8 6.2 3.4 5.4 6.0 5.1 3.9 3.9 4.0 2.5 0.8 1.0 0.6
52.9
40.4
20.7 19.9 18.5 17.414.7 12.9 12.9 12.0 11.1 10.9 10.5 10.1 9.5
6.8 6.2 5.83.0 2.8 1.8 1.7 1.2 1.0In
vent
or im
mig
ratio
n ra
te (%
): 20
06-1
0
Singa
pore
Switz
erlan
d
Irelan
d
Belgi
um
United
State
s of A
merica
New Ze
aland
Netherl
ands
Austria
United
King
dom
Austral
ia
Norway
Canad
a
Denmark
Finlan
d
Swed
enSp
ainFra
nce
German
yIta
lyChin
aIsr
ael
India
Japan
Repu
blic o
f Kore
a
Receiving country
Source: WIPO Statistics Database, October 2013

SPECIAL SECTION THE INTERNATIONAL MOBILITY OF INVENTORS
26
The US accounted for not only the largest absolute
number of immigrant inventors, but it also had a high
immigration rate of inventors, which is defined as total
number of immigrant inventors over the total number
of inventors (Figure 1). However, during the 2006-10
period, Singapore (52.9%) had the highest immigration
rate, followed by Switzerland (40.4%), Ireland (20.7%)
and Belgium (19.9%). Figure 1 also shows inventor
immigration rates for the 1996-2000 period. Countries
such as Denmark, Finland, Germany, Norway, Sweden,
Switzerland, the Netherlands, and the UK recorded con-
siderable increases in their immigration rates between
the 1996-2000 and the 2006-10 periods.
Who recruits internationally?
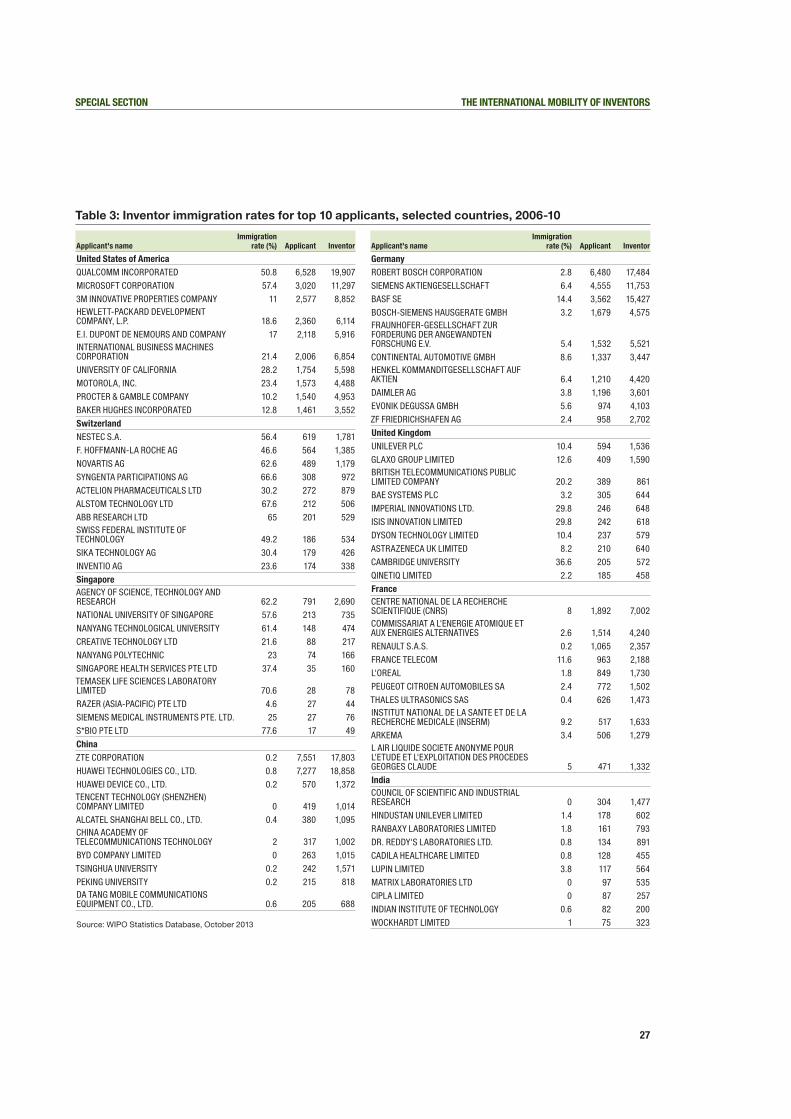
In general, inventor immigration rates differ not only
across countries, but also across different applicants.
For example, Table 3 lists the immigration rates for the
top 10 PCT applicants – based on the residence of
the first-named applicant for the 2006-10 period for a
selection of countries. It shows that the distribution of
immigrant inventors was very uneven across applicants,
even between enterprises of a relatively similar size. In
France, for example, France Telecom’s rate of immigrant
inventors was between four and five times greater than
that of Peugeot-Citroen – an imbalance which cannot
be solely attributed to differences across technology
fields. In another example, Peugeot-Citroen, had an
immigration rate that was more than ten times greater
than that of Renault S.A.S.
One interesting aspect of the data highlighted in Table
3 is the role played by universities and public research
centers in the recruitment of talent from abroad. The
top patenting universities and public research centers
feature some of the highest inventor immigration rates
among the top PCT applicants. This is the case for the
University of California in the US, for example, and also
for Cambridge University, Imperial Innovations (Imperial
College London), and Isis Innovation (Oxford University)
in the UK, among others.
SPECIAL SECTION THE INTERNATIONAL MOBILITY OF INVENTORS
27
Table 3: Inventor immigration rates for top 10 applicants, selected countries, 2006-10
Applicant's nameImmigration
rate (%) Applicant Inventor
United States of AmericaQUALCOMM INCORPORATED 50.8 6,528 19,907
MICROSOFT CORPORATION 57.4 3,020 11,297
3M INNOVATIVE PROPERTIES COMPANY 11 2,577 8,852HEWLETT-PACKARD DEVELOPMENT COMPANY, L.P. 18.6 2,360 6,114
E.I. DUPONT DE NEMOURS AND COMPANY 17 2,118 5,916INTERNATIONAL BUSINESS MACHINES CORPORATION 21.4 2,006 6,854
UNIVERSITY OF CALIFORNIA 28.2 1,754 5,598
MOTOROLA, INC. 23.4 1,573 4,488
PROCTER & GAMBLE COMPANY 10.2 1,540 4,953
BAKER HUGHES INCORPORATED 12.8 1,461 3,552
SwitzerlandNESTEC S.A. 56.4 619 1,781
F. HOFFMANN-LA ROCHE AG 46.6 564 1,385
NOVARTIS AG 62.6 489 1,179
SYNGENTA PARTICIPATIONS AG 66.6 308 972
ACTELION PHARMACEUTICALS LTD 30.2 272 879
ALSTOM TECHNOLOGY LTD 67.6 212 506
ABB RESEARCH LTD 65 201 529SWISS FEDERAL INSTITUTE OF TECHNOLOGY 49.2 186 534
SIKA TECHNOLOGY AG 30.4 179 426
INVENTIO AG 23.6 174 338
SingaporeAGENCY OF SCIENCE, TECHNOLOGY AND RESEARCH 62.2 791 2,690
NATIONAL UNIVERSITY OF SINGAPORE 57.6 213 735
NANYANG TECHNOLOGICAL UNIVERSITY 61.4 148 474
CREATIVE TECHNOLOGY LTD 21.6 88 217
NANYANG POLYTECHNIC 23 74 166
SINGAPORE HEALTH SERVICES PTE LTD 37.4 35 160TEMASEK LIFE SCIENCES LABORATORY LIMITED 70.6 28 78
RAZER (ASIA-PACIFIC) PTE LTD 4.6 27 44
SIEMENS MEDICAL INSTRUMENTS PTE. LTD. 25 27 76
S*BIO PTE LTD 77.6 17 49
ChinaZTE CORPORATION 0.2 7,551 17,803
HUAWEI TECHNOLOGIES CO., LTD. 0.8 7,277 18,858
HUAWEI DEVICE CO., LTD. 0.2 570 1,372TENCENT TECHNOLOGY (SHENZHEN) COMPANY LIMITED 0 419 1,014
ALCATEL SHANGHAI BELL CO., LTD. 0.4 380 1,095CHINA ACADEMY OF TELECOMMUNICATIONS TECHNOLOGY 2 317 1,002
BYD COMPANY LIMITED 0 263 1,015
TSINGHUA UNIVERSITY 0.2 242 1,571
PEKING UNIVERSITY 0.2 215 818DA TANG MOBILE COMMUNICATIONS EQUIPMENT CO., LTD. 0.6 205 688
Source: WIPO Statistics Database, October 2013
Applicant's nameImmigration
rate (%) Applicant Inventor
GermanyROBERT BOSCH CORPORATION 2.8 6,480 17,484
SIEMENS AKTIENGESELLSCHAFT 6.4 4,555 11,753
BASF SE 14.4 3,562 15,427
BOSCH-SIEMENS HAUSGERATE GMBH 3.2 1,679 4,575FRAUNHOFER-GESELLSCHAFT ZUR FORDERUNG DER ANGEWANDTEN FORSCHUNG E.V. 5.4 1,532 5,521
CONTINENTAL AUTOMOTIVE GMBH 8.6 1,337 3,447HENKEL KOMMANDITGESELLSCHAFT AUF AKTIEN 6.4 1,210 4,420
DAIMLER AG 3.8 1,196 3,601
EVONIK DEGUSSA GMBH 5.6 974 4,103
ZF FRIEDRICHSHAFEN AG 2.4 958 2,702
United KingdomUNILEVER PLC 10.4 594 1,536
GLAXO GROUP LIMITED 12.6 409 1,590BRITISH TELECOMMUNICATIONS PUBLIC LIMITED COMPANY 20.2 389 861
BAE SYSTEMS PLC 3.2 305 644
IMPERIAL INNOVATIONS LTD. 29.8 246 648
ISIS INNOVATION LIMITED 29.8 242 618
DYSON TECHNOLOGY LIMITED 10.4 237 579
ASTRAZENECA UK LIMITED 8.2 210 640
CAMBRIDGE UNIVERSITY 36.6 205 572
QINETIQ LIMITED 2.2 185 458
FranceCENTRE NATIONAL DE LA RECHERCHE SCIENTIFIQUE (CNRS) 8 1,892 7,002COMMISSARIAT A L'ENERGIE ATOMIQUE ET AUX ENERGIES ALTERNATIVES 2.6 1,514 4,240
RENAULT S.A.S. 0.2 1,065 2,357
FRANCE TELECOM 11.6 963 2,188
L'OREAL 1.8 849 1,730
PEUGEOT CITROEN AUTOMOBILES SA 2.4 772 1,502
THALES ULTRASONICS SAS 0.4 626 1,473INSTITUT NATIONAL DE LA SANTE ET DE LA RECHERCHE MEDICALE (INSERM) 9.2 517 1,633
ARKEMA 3.4 506 1,279L AIR LIQUIDE SOCIETE ANONYME POUR L'ETUDE ET L'EXPLOITATION DES PROCEDES GEORGES CLAUDE 5 471 1,332
IndiaCOUNCIL OF SCIENTIFIC AND INDUSTRIAL RESEARCH 0 304 1,477
HINDUSTAN UNILEVER LIMITED 1.4 178 602
RANBAXY LABORATORIES LIMITED 1.8 161 793
DR. REDDY'S LABORATORIES LTD. 0.8 134 891
CADILA HEALTHCARE LIMITED 0.8 128 455
LUPIN LIMITED 3.8 117 564
MATRIX LABORATORIES LTD 0 97 535
CIPLA LIMITED 0 87 257
INDIAN INSTITUTE OF TECHNOLOGY 0.6 82 200
WOCKHARDT LIMITED 1 75 323

SPECIAL SECTION THE INTERNATIONAL MOBILITY OF INVENTORS
28
What are inventors’ preferred entrance routes?
Even if the evidence is only anecdotal, it seems reasonable
to argue that universities and public research organiza-
tions act as privileged “points of entry” for high-skilled
workers from abroad. Figure 2 explores this scenario by
depicting inventor immigration rates across countries, bro-
ken down by four types of applicants: university; govern-
ment and research institutions; business, and individuals.
Bearing in mind that the business sector accounts for the
vast majority (over 80%) of PCT applications (WIPO, 2012)
in most of the countries listed in Figure 2, the university
and government sectors accounted for the highest immi-
gration rates. In selected cases, the university/government
immigration rates were considerably higher than the busi-
ness immigration rates – in particular, in Australia, Canada,
Japan, Norway, Sweden, the Republic of Korea, the UK
and the US. Only Belgium, China, Finland, India, Italy, the
Netherlands and Spain did not report higher immigration
rates for inventors working in academic institutions, as
opposed to those working in commercial enterprises.
Figure 2: Immigration rates of inventors by type of applicant: business, university, research/government, and individual, 2006-10
0
20
40
60
Inve
ntor
imm
igra
tion
rate
(%)
Singa
pore
Switz
erlan
d
New Ze
aland
United
State
s of A
merica
Irelan
d
Norway
United
King
dom
Swed
en
Belgi
um
Austral
ia
Austria
Canad
a
Netherl
ands
Denmark
Spain
Franc
e
German
y
Finlan
dIta
lyJap
anChin
aIsr
ael
Repu
blic o
f Kore
aInd
ia
Receiving country
University Research/government Business Individual
Source: WIPO Statistics Database, October 2013
Do inventor immigration rates differ across technological fields?
As is apparent from analysis of applicant-level data, immi-
grant inventors’ contribution to patenting differ markedly
across technology fields. For example, inventors may
be associated with one or more International Patent
Classification (IPC) symbols, which in turn are grouped
into 35 technology fields through the concordance table
developed by WIPO.3 It should be noted that when a
PCT application relates to multiple fields of technology,
3 WIPO has developed a concordance table in
order to link IPC symbols to corresponding fields
of technology (see www.wipo.int/ipstats/en).
the inventor is counted twice. Therefore, adding up the
absolute numbers of inventors across the 35 technology
fields results in a larger number of inventors than that
outlined earlier in this report.
The 35 fields can be divided into broader technology
groupings – electrical engineering, instruments, chemistry,
mechanical engineering and others. As shown in Figure 3,
all technology fields have recorded increases in the rates
of immigration during the 1990-2010 period. However,
electrical engineering and chemistry emerge as the most
attractive sectors for foreign inventors. In contrast, the
field of mechanical engineering has remained more or
less stable.

SPECIAL SECTION THE INTERNATIONAL MOBILITY OF INVENTORS
29
Figure 3: Inventor immigration rates over time by field of technology: three-year moving averages
4
6
8
10
12
14
Inve
ntor
imm
igra
tion
rate
(%)
1990 1995 2000 2005 2010
Year
Electrical engineering Instruments ChemistryMechanical engineering Others
Source: WIPO Statistics Database, October 2013
Table 4 shows inventor immigration rates by field of
technology for the 1996-2000 and 2006-10 periods. As
can be seen, the differences across technology fields –
in terms of how they relied on foreign inventors – were
noticeable. Thus, for example, during the 2006-10 period,
immigration rates varied from 4.1% (mechanical elements)
to 18.3% (micro-structure and nano-technology). Other
fields also relied heavily on immigrant inventors; such
fields included pharmaceuticals (14.6%), biotechnology
(14.6%), digital communication (15.2%), and basic com-
munication processes (16%). The majority of technology
fields had a higher inventor immigration rate for the
2006-10 period compared to the 1996-2000 period.
Despite a decrease, both analyses of biomaterials and
biotechnology fields showed a high inventor immigration
rate for both periods.
Table 4: Inventor immigration rates by technology field, 2006-10
Field of technology
Immigration rate (%),
1996-2000
Immigration rate (%), 2006-10
Electrical engineeringElectrical machinery, energy 5.2 7.2
Audio-visual technology 6.2 9.5
Telecommunications 7.5 11.9
Digital communication 9.7 15.2
Basic communication processes 9.2 16.0
Computer technology 9.6 13.4
IT methods for management 8.0 10.5
Semiconductors 7.0 12.1
InstrumentsOptics 6.5 7.9Measurement 7.0 9.8
Analysis of biological materials 13.9 13.8
Control apparatus 5.3 7.0
Medical technology 6.9 8.3
ChemistryOrganic fine chemistry 9.3 13.9
Biotechnology 16.5 14.6
Pharmaceuticals 11.3 14.6
Macromolecular chemistry, polymers 7.2 10.2
Food chemistry 7.9 11.2
Basic materials chemistry 7.6 11.4
Materials metallurgy 5.7 7.7
Surface technology, coating 5.9 8.1
Micro-structure and nano-technology 13.0 18.3
Chemical engineering 6.5 9.0
Environmental technology 4.6 7.3
Mechanical engineeringHandling 4.5 5.1
Machine tools 3.6 4.6
Engines, pumps, turbines 4.4 6.1
Textile and paper 5.1 6.8
Other special machines 5.0 6.4
Thermal processes and apparatus 4.3 5.2
Mechanical elements 3.8 4.1
Transport 3.9 4.3
Other fieldsFurniture, games 4.7 5.0
Other consumer goods 5.4 5.3
Civil engineering 4.4 7.7
Note: The IPC-technology concordance table (available at: www.wipo.int/ipstats/en) was used to convert IPC symbols into 35 corresponding fields of technology.
Source: WIPO Statistics Database, October 2013
SPECIAL SECTION THE INTERNATIONAL MOBILITY OF INVENTORS
30
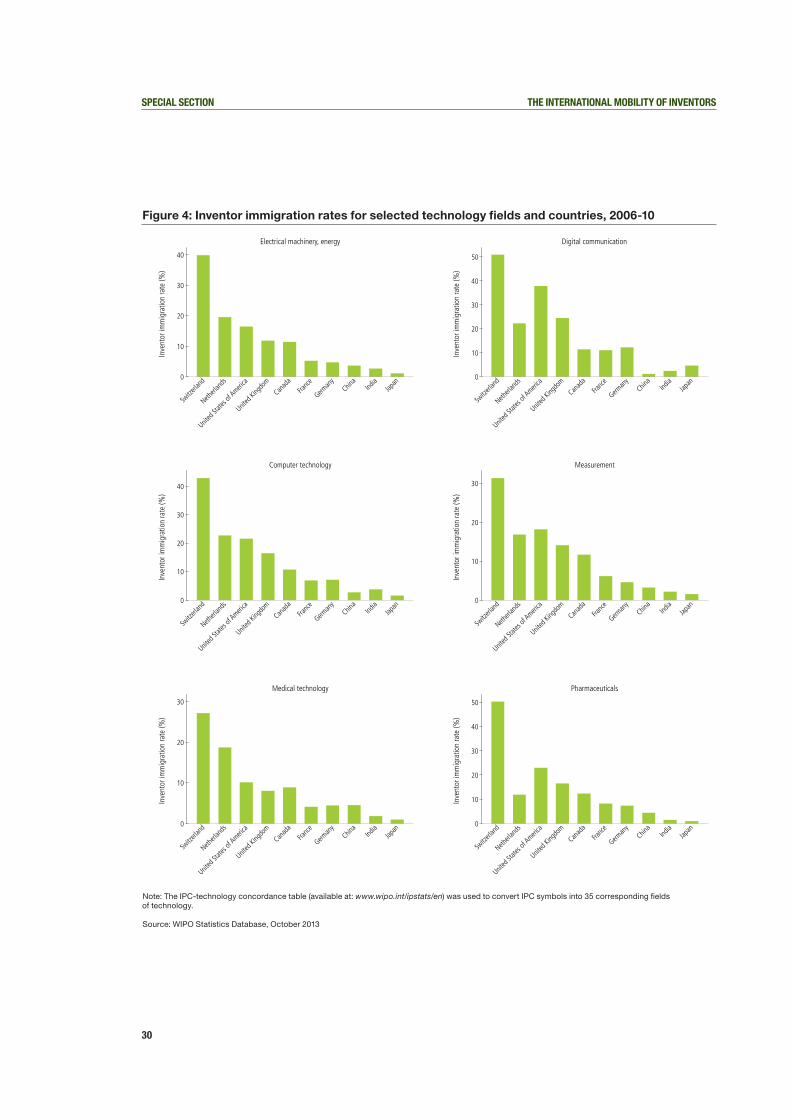
Figure 4: Inventor immigration rates for selected technology fields and countries, 2006-10
0
10
20
30
40
Inve
ntor
imm
igra
tion
rate
(%)
Switz
erlan
d
Netherl
ands
United
State
s of A
merica
United
King
dom
Canad
aFra
nce
German
yChin
aInd
iaJap
an
Electrical machinery, energy
0
10
20
30
40
50
Inve
ntor
imm
igra
tion
rate
(%)
Switz
erlan
d
Netherl
ands
United
State
s of A
merica
United
King
dom
Canad
aFra
nce
German
yChin
aInd
iaJap
an
Digital communication
0
10
20
30
40
Inve
ntor
imm
igra
tion
rate
(%)
Switz
erlan
d
Netherl
ands
United
State
s of A
merica
United
King
dom
Canad
aFra
nce
German
yChin
aInd
iaJap
an
Computer technology
0
10
20
30
Inve
ntor
imm
igra
tion
rate
(%)
Switz
erlan
d
Netherl
ands
United
State
s of A
merica
United
King
dom
Canad
aFra
nce
German
yChin
aInd
iaJap
an
Measurement
0
10
20
30
Inve
ntor
imm
igra
tion
rate
(%)
Switz
erlan
d
Netherl
ands
United
State
s of A
merica
United
King
dom
Canad
aFra
nce
German
yChin
aInd
iaJap
an
Medical technology
0
10
20
30
40
50
Inve
ntor
imm
igra
tion
rate
(%)
Switz
erlan
d
Netherl
ands
United
State
s of A
merica
United
King
dom
Canad
aFra
nce
German
yChin
aInd
iaJap
an
Pharmaceuticals
Note: The IPC-technology concordance table (available at: www.wipo.int/ipstats/en) was used to convert IPC symbols into 35 corresponding fields of technology.
Source: WIPO Statistics Database, October 2013

SPECIAL SECTION THE INTERNATIONAL MOBILITY OF INVENTORS
31
Figure 4 reports inventor immigration rates for selected
technology fields for a number of countries.4 Generally,
countries such as Switzerland, the Netherlands and
the US had high inventor immigration rates in all of the
reported fields for the 2006-10 period. In contrast, China,
India and Japan reported low inventor immigration rates
for the same period. However, across countries and
technology fields, there were considerable variations in
inventor immigration rates.
Do regions play a role in attracting talent?
One striking aspect of immigration, and particularly
skilled immigration, is that migrants tend to concentrate
in specific geographical areas within countries. For
example, the share of skilled foreign-born individuals in
the UK and France in 2000 was estimated at 8.8% and
9.8%, respectively; in contrast, 28% of London residents
and 23% of Paris residents were foreign-born (Freeman,
2006). In particular, immigrant inventors appear to cluster
in metropolitan areas, thus contributing to the spatial
concentration of inventive activity. This issue is analysed
by matching PCT applications with the OECD’s REGPAT
database (Maraut et al, 2008; refer to Miguélez and
Raffo, 2013, for details of the matching procedure).5 By
linking inventor nationality information with REGPAT, it is
possible to study the settlement patterns of immigrant
inventors within countries beyond the settlement patterns
of native inventors.
4 The selection of technology fields was based on the
total number of PCT applications filed in 2010.
5 The latest version of REGPAT provides detailed
regional information on all EPO and PCT applicants,
and information on inventors for all OECD and EU
countries, as well as a few other selected countries.
Table 5 lists the top 20 European NUTS 2 regions in
terms of their inventor immigration rates.6 It shows that
European regions in highly innovative, middle-to-small
European countries ranked well above the European
average – although it should be noted that a few regions
of the UK - a large European country - appear in this list.
On the other hand, only six US states ranked above the
national average; these six were, however, regarded
as the most innovative and dynamic states. In order to
compare regions of similar size from Europe and the
US, it is worth repeating the analysis of the US data on
a more disaggregated level, such as in the Metropolitan
Statistical Areas (MSAs). In particular, some of the biggest
and most innovative MSAs – San Diego, San Jose-Santa
Clara, New York and Boston – appear in the top 20
ranking. When the MSA data are compared with the
European NUTS 2 data, one can see that the top four
European regions attract more talented individuals (in
relative terms) than does San Diego.
However, only few European NUTS2 regions had an
inventor immigration rate above 20%, while for the US
a larger number of MSAs reported immigration rates
greater than 20%. In other words, immigrant inventors’
settlement in European regions seemed to be more
skewed than was the case in the US.
6 NUTS stands for the French acronym “Nomenclature des unités territoriales statistiques”.

SPECIAL SECTION THE INTERNATIONAL MOBILITY OF INVENTORS
32
Table 5: Top 20 immigration rates by region, 2006-10
NUTS2 regionImmigration
rate (%) US statesImmigration
rate (%) US MSAsImmigration
rate (%)NORDWESTSCHWEIZ (CH) 50.7 CALIFORNIA 26.9 San Diego-Carlsbad-San Marcos, CA 36.7
RÉGION LÉMANIQUE (CH) 49.3 NEW JERSEY 24.2 Stockton, CA 33.3
RÉGION DE BRUXELLES (BE) 42.7 MASSACHUSETTS 21.8 Evansville, IN-KY 32.2
ZÜRICH (CH) 42.4 DELAWARE 21.2 Champaign-Urbana, IL 32.0
ZENTRALSCHWEIZ (CH) 36.0 NEW YORK 20.8 San Jose-Sunnyvale-Santa Clara, CA 31.0
LUXEMBOURG (LU) 35.7 TEXAS 18.9 Trenton-Ewing, NJ 30.4
OSTSCHWEIZ (CH) 31.0 MARYLAND 18.2 Albany-Schenectady-Troy, NY 28.5
PROV. BRABANT WALLON (BE) 30.1 CONNECTICUT 17.7 Columbus, IN 28.5
INNER LONDON (UK) 28.0 OREGON 17.4 Lansing-East Lansing, MI 28.3
SOUTHERN AND EASTERN (IE) 22.0 IDAHO 16.4 Athens-Clarke County, GA 28.2
PROV. LUXEMBOURG (BE) 21.5 HAWAII 16.1 Ithaca, NY 28.0
PROV. ANTWERPEN (BE) 19.7 FLORIDA 15.6 Ann Arbor, MI 27.7
OUTER LONDON (UK) 19.4 NEW MEXICO 15.4 Gainesville, FL 27.6
NOORD-BRABANT (NL) 19.3 ARKANSAS 15.1 College Station-Bryan, TX 27.3
ESPACE MITTELLAND (CH) 19.0 ILLINOIS 14.8 New York-Northern New Jersey-Long Island, NY-NJ-PA 24.3
PROV. VLAAMS-BRABANT (BE) 18.8 PENNSYLVANIA 14.6 Santa Barbara-Santa Maria-Goleta, CA 24.0
TICINO (CH) 18.2 GEORGIA 14.3 Ames, IA 23.2
TIROL (AT) 17.8 MICHIGAN 14.2 Dallas-Fort Worth-Arlington, TX 23.1
EAST ANGLIA (UK) 17.4 NORTH CAROLINA 14.1 State College, PA 22.6
PROV. HAINAUT (BE) 17.0 ARIZONA 13.9 Boston-Cambridge-Quincy, MA-NH 22.5
European average 9.7 US average 18.5 US average 18.5
Note: Only NUTS2 (Nomenclature des unités territoriales statistiques) regions with more than 25 native inventors and MSAs with more than 150 native inventors are listed here.
Source: WIPO Statistics Database, October 2013
Table 6: Most populated migration corridors, 2006-10
Largest inventor migration corridors Largest inventor migration corridors (excluding the US)Origin Destination Inventors Origin Destination InventorsChina United States of America 27,698 Germany Switzerland 4,949
India United States of America 21,712 France Switzerland 1,879
Canada United States of America 11,363 France Germany 1,492
United Kingdom United States of America 8,314 China Japan 1,462
Germany United States of America 5,894 Germany Netherlands 1,332
Germany Switzerland 4,949 Austria Germany 1,307
Republic of Korea United States of America 4,876 France United Kingdom 1,210
France United States of America 3,901 China Singapore 1,149
Japan United States of America 2,843 Germany Austria 1,107
Russian Federation United States of America 2,308 United Kingdom Germany 1,080
France Switzerland 1,879 Netherlands Germany 1,049Israel United States of America 1,875 United States of America China 1,041
Australia United States of America 1,783 Germany United Kingdom 969
Netherlands United States of America 1,670 Italy Germany 956
Italy United States of America 1,492 Italy Switzerland 955
France Germany 1,492 France Belgium 934
China Japan 1,462 Germany France 916
Germany Netherlands 1,332 United Kingdom Switzerland 887
Austria Germany 1,307 United States of America Germany 820
Turkey United States of America 1,233 United States of America Canada 807
Source: WIPO Statistics Database, October 2013

SPECIAL SECTION THE INTERNATIONAL MOBILITY OF INVENTORS
33
Which are the most popular inventor migration corridors?Table 6 shows the most populated bilateral corridors
during the 2006-10 period. The US emerged as the most
frequent destination country. Origin countries belong to
the high-income group, except China and India. The top
two corridors are China-US (27,698 inventors) and India-
US (21,712). In both cases, the high-income country is the
destination and the middle-income country is the origin.
When the US as a destination country was excluded from
the analysis, intra-European flows of inventors dominated
the top corridors. There were, however, some interesting
exceptions, such as the China-Japan (1,462) corridor and
the China-Singapore (1,149) corridor.
Asian countries – and to a lesser extent, countries from
Oceania – are important sources of inventors. Figure 5
depicts the top 10 most popular destinations for inven-
tors originating from the Middle East, South Asia, East
Asia and Oceania. As can be seen, the proportion of
inventors going to the US was greater than that going
to other countries. For example, close to nine times as
many migrant inventors from these regions as a whole
immigrated to the US (65,517) than immigrated to Europe
(7,660). They represented 55.9% of all immigrant inven-
tors in the US for the period 2006-10. While China’s and
India’s migration flows to the US were largely responsible
for this phenomenon, other countries also played a role.
Moreover, countries from the above-mentioned broad
geographical region featured among the top 10 destina-
tions for inventors. In particular, Australia, China, Japan,
Malaysia, New Zealand, Singapore and the Republic of
Korea attracted large numbers of inventors from this col-
lection of geographical regions. In addition, within Europe,
the UK received the largest share (28%) of inventors from
these regions, followed by Germany (24%).
For comparison purposes, Figure 6 depicts the top
10 most popular destinations for inventors from Latin
America and the Caribbean (LAC). As Table 1 shows,
the absolute number of inventors emigrating from the
LAC region was substantially lower when compared
with the corresponding figures for Asia. Again, the US
topped the ranking of destination countries. In relative
terms, LAC inventors accounted for approximately 3% of
all immigrants in the US and for approximately 2% of all
immigrants in Europe. Within Europe, Germany topped
the ranking (22% of all inventor migrants from the LAC re-
gion to Europe), and was followed by Switzerland, Spain
and France. A shared colonial heritage and a common
language explain why Spain attracted considerable talent
from LAC countries. The data also show considerable
intra-regional mobility of inventors within the LAC region.
For example, four LAC countries (Brazil, Chile, Colombia
and Mexico) are in the top 10 ranking as destination
countries for inventors originating from the LAC region.

SPECIAL SECTION THE INTERNATIONAL MOBILITY OF INVENTORS
34
Figure 5: Where do inventors from the Middle East, South Asia, East Asia, and Oceania emigrate from?
Source: WIPO Statistics Database, October 2013
Figure 6: Where do LAC inventors emigrate from?
Source: WIPO Statistics Database, October 2013

SPECIAL SECTION THE INTERNATIONAL MOBILITY OF INVENTORS
35
Do sending countries gain from the brain drain?
Despite the adverse consequences of the brain drain
of high-skilled people on a country’s potential develop-
ment, it is also well recognized that emigrants do not
necessarily sever their ties with their homelands and,
as diasporas, they may constitute a valuable resource
in terms of accessing foreign knowledge and technol-
ogies. To explore this point further, one can compute
the share of patents filed by the emigrant inventors of
each country that include at least one inventor residing
in the emigrant country of origin. The idea is to analyze
the extent to which each country’s emigrant inventor
community is committed to their country of origin and,
as a consequence, the extent of their collaboration with
their co-national colleagues at home. As the left axis of
Figure 7 shows, the US diaspora seems to be the most
committed to their homeland; 27.2% of the PCT applica-
tions with US inventor emigrants included US residents
among their co-inventors.
However, bearing in mind that the absolute number of
US resident inventors accounted for the world’s largest
number of resident inventors during the 2006-10 time-
frame, the probability of collaborating with a US resident
inventor was very high, regardless of the commitment of
US inventors abroad and the extent of their collaboration
with their home country colleagues. In order to illustrate
this last point, Figure 7 computes a hypothetical ratio
between the share of patents co-invented with nationals
of the country of origin and the share of total inventors
residing in the country of origin (see black and white
diamonds on right axis). The results show that inventors
from middle-income countries were actually the most
committed to their homelands, in that they collaborated
with their national colleagues at home disproportionately
more than would have been expected, given their share
of total inventors. In fact, the only two countries which
had a ratio lower than 1 during this period were China
and the US, which indicates that inventors from these
countries are less committed to their country of origin
than would have been expected, given their share of the
total number of inventors.
Figure 7: Share of PCT applications with homeland inventors and its ratio with the share of resident inventors with whom to collaborate: 2006-10
60
40
20
0
Ratio
hom
elan
d co
llabo
ratio
nsto
resid
ent i
nven
tors
0
10
20
30
Ratio
of P
CT a
pplic
atio
nsw
ith h
omel
and
inve
ntor
s (%
)
United
State
s of A
merica
German
yJap
anIsr
ael
Franc
e
Netherl
ands
United
King
dom
Russi
aIta
ly
Austral
ia
Canad
a
South
Africa
Repu
blic o
f Kore
aBra
zil
Mexico
China
India
Ukraine
Turkey
Malaysi
a
Origin
Applications' homeland inventors Ratio over countries' number of applications
Source: WIPO Statistics Database, October 2013
SPECIAL SECTION THE INTERNATIONAL MOBILITY OF INVENTORS
36
Conclusion
This special section described a new global dataset on
migrant inventors, using information on inventor nation-
ality and residence gleaned from PCT applications. From
this analysis, two important facts emerged. First, from a
methodological perspective, this section demonstrated
that PCT data are meaningful and are useful in analyzing
the interplay between migration and innovation. Second,
from a more analytical viewpoint, the data reveal a
number of interesting findings that are worth highlighting.
From the methodological perspective, use of patent data
to map the migratory patterns of high-skilled workers can
address some of the limitations associated with existing
migration datasets. In particular, this database covers
a long time period, provides information on an annual
basis, and contains data for a large number of sending
and receiving countries. Inventors constitute a group of
high-skilled workers of special economic importance
who have more homogenous skills than tertiary-educated
workers as a whole.
Broadly speaking, the data clearly demonstrate that
the pattern of inventors’ mobility resembles other high-
skilled migration figures, and in particular, what we know
about the migration of scientists and engineers based
on anecdotal evidence, surveys and media reports.
For example, the majority of immigrant inventors in the
2006-10 period were concentrated in the US, whereas
European countries lagged behind in this respect. The
US not only had the largest absolute number of immi-
grant inventors during this period, but it also stood out
as one of the main receiving countries relative to its total
population of inventors.
The data highlight important differences across countries
as well as within countries and across different cities,
technologies and organizations employing inventors (ap-
plicants). In addition, they highlight that during the 2006-
10 period, immigration rates were remarkably different
across applicant types i.e., university, government and
research institutions, business, and individuals. Within
these groupings, university/government immigration
rates were considerably higher than business sector
immigration rates. In relation to data for fields of technol-
ogy, for example, during the 2006-10 period immigration
rates varied from 4.1% (mechanical elements) to 18.3%
(micro-structure and nano-technology). Other fields
also relied heavily on immigrant inventors; such fields
included pharmaceuticals (14.6%), biotechnology (14.6%),
digital communication (15.2%) and basic communication
processes (16%).
Furthermore, by using unit record data, it becomes
possible to link patent-inventor data with citation and
co-inventorship information. It also becomes possible
to study social relationships between inventors and sub-
sequent knowledge diffusion patterns across countries,
regions and technology fields. Additionally, data can also
be linked to country-, city- and firm-level information in
order to provide new empirical evidence on a broad
range of interrelated topics.
From an analytical standpoint, this special section pro-
vides new evidence on the migration patterns of knowl-
edge workers which, to date, have probably not received
the attention that this subject deserves. As a result, most
analysis on the migration patterns of scientists and engi-
neers has exclusively focused on the US experience and
its major providers of foreign talent, namely China and
India (Breschi et al, 2013). However, high-skilled worker
migration is a multipolar phenomenon, implying a large
number of sending and receiving countries.

SPECIAL SECTION THE INTERNATIONAL MOBILITY OF INVENTORS
37
Thus, for example, it is possible to observe trends in
important talent circulation between Western European
countries during the 2006-10 period. It is also possible
to observe that the number of non-European countries
providing talent to Europe did not necessarily coincide
with migration flows to the US – e.g., from African or
LAC countries. During this period, European countries
also constituted the main providers of talent to the US.
There is large “brain circulation” between Asian econo-
mies, with Singapore standing out as a major receiving
country. For its part, China is a major provider of talent
within its geographical area of influence; however, in
recent years, it has also attracted a large number of
immigrant inventors, both from Asia and the rest of the
world. Finally, albeit to a lesser extent, migrant inventors
also originate in other areas of the world, such as LAC
countries and Africa.
Of course, using patent data for the purpose of economic
analysis does not come without limitations. One import-
ant caveat is that one only observes inventors when they
seek patent protection. Not all inventions are patented,
however, and there is no one-to-one correspondence
between the number of patent applications filed and the
commercial value of the underlying inventions or their
contribution to technological progress. Another limitation
is that the PCT dataset does not include inventors with a
migratory background who have become a host country
national. Unfortunately, the data do not facilitate the as-
sessment of how severe these biases are. In using these
data, one should be aware of such limitations, especially
when drawing policy conclusions.
Notwithstanding these caveats, this new database mean-
ingfully captures a phenomenon of growing importance.
Indeed, the descriptive overview presented in this section
suggests that it is consistent with migratory patterns
and trends elicited from census data. At the same time,
the database opens up new avenues for research and
promises to generate fresh empirical insights that can
inform both innovation policy and migration policy.
SPECIAL SECTION THE INTERNATIONAL MOBILITY OF INVENTORS
38
References
Black, G.C., Stephan, P.E., 2008. “The Economics of
University Lab Science and the Role of Foreign Graduate
Students and Postdoctoral Scholars” (SSRN Scholarly
Paper No. ID 1323429). Social Science Research
Network, Rochester, NY.
Breschi, S., Lissoni, F., Tarasconi, G., 2013. “Inventor
Data for Research on Migration and Innovation: A Survey
and a Pilot. Forthcoming as a WIPO Economic Working
Research Paper.
Fink, C., Miguélez, E., Raffo, J., 2013. The global race
for inventors. www.voxeu.org/article/global-race-inven-
tors
Freeman, R.B., 2006. “People Flows in Globalization”.
The Journal of Economic Perspectives 20, 145–170.
Kerr, W., 2009. “The Agglomeration of US Ethnic
Inventors” (Working Paper No. 15501). National Bureau
of Economic Research.
Kerr, W.R., 2013. “U.S. High-Skilled Immigration,
Innovation, and Entrepreneurship: Empirical Approaches
and Evidence” (Working Paper No. 19377). National
Bureau of Economic Research.
Maraut, S., Dernis, H., Webb, C., Spiezia, V., Guellec,
D., 2008. “The OECD REGPAT Database” (OECD Science,
Technology and Industry Working Papers). Organisation
for Economic Co-operation and Development, Paris.
Miguélez, E., Fink, C., 2013. “Measuring the
International Mobility of Inventors: A New Database”
(WIPO Economic Research Working Paper No. 8). World
Intellectual Property Organization – Economics and
Statistics Division.
Miguélez, E., Raffo, J., 2013. “The spatial distribution
of migrant inventors”. Forthcoming as a WIPO Economic
Research Working Paper.
WIPO, 2012. World Intellectual Property Indicators, 2012
edition (WIPO Economics and Statistics Series). World
Intellectual Property Organization – Economics and
Statistics Division.