special edition: key small business statistics may 2015 · majority female-owned small and...
TRANSCRIPT

Small Business Branch
www.ic.gc.ca/sbstatistics
Majority Female-Owned Small and Medium-Sized EnterprisesSpecial Edition: Key Small Business Statistics
May 2015

This publication is also available online in HTML in print-ready format at www.ic.gc.ca/SMEresearch/reports.
To obtain a copy of this publication or an alternate format (Braille, large print, etc.), please fill out the Publication Request form or contact:
Web Services Centre Industry Canada C.D. Howe Building 235 Queen Street Ottawa, ON K1A 0H5 Canada
Telephone (toll-free in Canada): 1-800-328-6189 Telephone (Ottawa): 613-954-5031 TTY (for hearing-impaired): 1-866-694-8389 Business hours: 8:30 a.m. to 5:00 p.m. (Eastern Time) Email: [email protected]
Permission to Reproduce Except as otherwise specifically noted, the information in this publication may be reproduced, in part or in whole and by any means, without charge or further permission from Industry Canada, provided that due diligence is exercised in ensuring the accuracy of the information reproduced; that Industry Canada is identified as the source institution; and that the reproduction is not represented as an official version of the information reproduced, nor as having been made in affiliation with, or with the endorsement of, Industry Canada.
For permission to reproduce the information in this publication for commercial purposes, please fill out the Application for Crown Copyright Clearance or contact the Web Services Centre (see contact information above).
© Her Majesty the Queen in Right of Canada, as represented by the Minister of Industry, 2015 Cat. No. Iu186-1E-PDF ISSN 1718-3456
Aussi offert en français sous le titre Petites et moyennes entreprises détenues majoritairement par des femmes — Édition spéciale : Principales statistiques relatives aux petites entreprises, mai 2015.

1Majority Female-Owned Small and Medium-Sized Enterprises—Special Edition: Key Small Business Statistics, May 2015
Table of Contents
2 Foreword
2 Highlights
5 Data and Terminology
6 Gender Distribution
6 Overall Distribution
6 Distribution by Firm Size and Industry Sector
6 Firm Size
7 Industry Sector
8 Growth
10 Exporting
11 Innovation
12 Owners’ Managerial Experience
13 Owners’ Educational Attainment
14 Owners’ Access to Financing

Majority Female-Owned Small and Medium-Sized Enterprises—Special Edition: Key Small Business Statistics, May 20152
Foreword
Business statistics segmented by gender provide a unique perspective on the attributes of the population of small and medium-sized enterprise (SME) owners. This special edition of Key Small Business Statistics aims to provide readers with a picture of the general distribution of majority female-owned SMEs in Canada.
Through the use of tables and charts, the report compares and contrasts the distribution of majority female-owned SMEs with that of majority male-owned SMEs and with that of SMEs owned equally by males and females. The report also describes differences among these populations of SMEs in terms of owners’ managerial experience, owners’ educational attainment and owners’ access to financing.
Highlights
Gender Distribution
Majority female-owned SMEs represent only a fraction of Canadian SMEs.
• In 2011, 15.5 percent of SMEs were majority owned by females. In comparison, 66.4 percent of SMEs were majority owned by males. Those owned equally by males and females represented 18.1 percent of SMEs in Canada.
The percentage of majority female-owned SMEs declined between the two years surveyed.
• Between 2007 and 2011, the percentage of majority female-owned SMEs declined slightly from 16.4 percent in 2007 to 15.5 percent in 2011.
Firm Size
Majority female-owned SMEs tend to be smaller than other SMEs.
• In 2011, 59.2 percent of majority female-owned SMEs and 51.4 percent of majority male-owned SMEs were micro firms (1 to 4 employees).
• In 2011, 92.7 percent of majority female-owned SMEs and 86.5 percent of majority male-owned SMEs had fewer than 20 employees.
• The proportion of majority female-owned SMEs with 20 to 99 employees more than doubled over the period surveyed, increasing from 3.1 percent in 2007 to 6.8 percent in 2011.

3Majority Female-Owned Small and Medium-Sized Enterprises—Special Edition: Key Small Business Statistics, May 2015
Industry Sector
Majority female-owned SMEs tend to be concentrated in service-oriented sectors.
• Over 62 percent of majority female-owned SMEs were concentrated within three industrial sectors: health care and social assistance, information and cultural industries, and arts, entertainment and recreation; retail trade; and accommodation and food services.
• In both 2007 and 2011, the distribution of majority female-owned SMEs in the agriculture, forestry, fishing and hunting, and construction sectors was three to four times lower than the distribution of majority male-owned SMEs in these sectors.
• The manufacturing sector also exhibited a lower and decreasing proportion of majority female-owned businesses (4.2 percent in 2007 and 2.8 percent in 2011) in comparison with majority male-owned businesses (6.8 percent in 2007 and 7.5 percent in 2011).
Growth
Majority female-owned SMEs exhibit lower growth rates and lower intentions to grow.
• A lower proportion of majority female-owned SMEs (57.7 percent) experienced growth over the 2009–11 period compared with majority male-owned SMEs (62.4 percent) and SMEs owned equally by males and females (63.6 percent).
• Obstacles to growth most commonly reported by SME owners in 2011 were rising business costs, fluctuations in consumer demand for products or services, and increasing competition.
Exporting
Majority female-owned SMEs are less likely to export.
• In 2011, only 5.0 percent of majority female-owned SMEs exported, whereas 11.8 percent of majority male-owned SMEs and 10 percent of those owned equally by males and females exported.
Innovation
Majority female-owned SMEs are more likely to innovate.
• In 2011, majority female-owned SMEs (39.5 percent) were slightly more likely to engage in innovation activities than majority male-owned SMEs (37.0 percent).
• Majority female-owned SMEs were also more engaged in product innovation when compared with other categories of innovation and with other SMEs.
Majority Female-Owned Small and Medium-Sized Enterprises—Special Edition: Key Small Business Statistics, May 20154
Owners’ Managerial Experience
Majority female owners of SMEs are gaining experience.
• Between 2007 and 2011, the proportion of majority female-owned SMEs whose owners had over 10 years of managerial experience increased from 50 percent to almost 68 percent, narrowing the gap with the approximately 80 percent of majority male-owned SMEs and those owned equally by males and females reporting over 10 years of managerial experience.
Owners’ Educational Attainment
Majority female owners of SMEs are more likely to have postgraduate education.
• The level of university education attained by SME owners exceeds that attained by the general population, with over 35 percent of majority female and majority male owners of SMEs reporting having a university degree. Over 29 percent of equal ownership SME owners also reported having a university degree.
• A larger proportion (18 percent) of majority female owners of SMEs reported having at least a master’s degree compared with 12 percent and 10 percent, respectively, of majority male owners and equal ownership owners.
Owners’ Access to Financing
A very large majority of SME owners—more so in the case of majority female owners—did not request financing from lending institutions.
• Different perceptions exist when considering requesting financing from lending institutions; for instance:
• 4.2 percent of majority female owners were discouraged borrowers compared with 2.7 percent of majority male owners;
• 3.9 percent of majority female owners reported that applying for financing was too difficult or time consuming compared with 2.0 percent of majority male owners.
• The rejection rate for financing was more significant for majority female owners than majority male owners due to insufficient collateral (66.6 percent versus 35.7 percent) and the fact that the lending institution judged that the SME operated in an unstable industry (65.7 percent versus 24.8 percent).

5Majority Female-Owned Small and Medium-Sized Enterprises—Special Edition: Key Small Business Statistics, May 2015
Data and Terminology
Data used in this statistical profile are based on two surveys:
1. Statistics Canada’s Survey on Financing of Small and Medium Enterprises, 2007, which had 15,808 SME respondents for a response rate, as a percentage of in-scope businesses, of 45 percent.1
2. Statistics Canada’s Survey on Financing and Growth of Small and Medium Enterprises, 2011, which had 9,957 SME respondents for a response rate of 56 percent.
The term business refers to “registered business establishments.” To be included in the sample population, a private business establishment had to meet one of the following criteria: have at least one paid employee, have annual sales revenues of at least $30,000, or be incorporated and have filed a federal corporate income tax return at least once in the previous three years. As Industry Canada uses a definition based on the number of paid employees, the analysis presented herein excludes the self-employed2 and “indeterminate” businesses.3 Also excluded from the sample population are businesses in the following industrial sectors: public administration, including schools and hospitals; public utilities; and non-profit organizations.
The size of a business can be measured by sales or by the number of employees. The number of employees is widely used to determine the size of a business and is easy to collect from surveyed businesses. Accordingly, in this report, a small or medium-sized enterprise is defined as a business establishment with 1 to 499 paid employees. Specifically:
• A small business has 1 to 99 paid employees.
• A medium-sized business has 100 to 499 paid employees.
The level of ownership was determined by answers to the following survey questions:
F.6 What percentage of the business ownership is held by women? (2007)
I.8 What percentage of your business is owned by women? (2011)
The definition for each group was then based on the following parameters:
1. Majority female-owned SME: Between 51 and 100 percent owned by one or more females.
2. Majority male-owned SME: Between 51 and 100 percent owned by one or more males.
3. Equal ownership of SME: 50:50 ownership between males and females, which may include married couples.
1. Data from the 2007 survey were adjusted to be comparable with data from the 2011 survey.
2. Self-employed workers include those within incorporated and unincorporated businesses that may or may not use paid help.
3. “Indeterminate” businesses include self-employed and contract workers.

Majority Female-Owned Small and Medium-Sized Enterprises—Special Edition: Key Small Business Statistics, May 20156
Gender Distribution
Majority female-owned businesses in Canada are under-represented in the population of Canadian SMEs and are concentrated in smaller enterprises operating predominantly in service-oriented industrial sectors.
Overall Distribution
Figure 1a and Figure 1b show the distribution of SME ownership by gender. In both 2007 and 2011, the proportion of majority female-owned businesses is small compared with majority male-owned businesses, but to a lesser extent compared with businesses owned equally by males and females. It is interesting to note that between 2007 and 2011, the proportion of majority female-owned SMEs decreased from 16.4 percent to 15.5 percent.4
Distribution by Firm Size and Industry Sector
Firm Size
The population of Canadian SMEs is not evenly distributed by firm size. As shown in Table 1, the vast majority of firms have fewer than 20 employees. While this is true regardless of majority gender ownership of the firm, this concentration is slightly more pronounced for majority female-owned firms. In 2011, 92.7 percent of majority female-owned SMEs had fewer than 20 employees, and
4. It should be noted that, in 2011, 13.4 percent of SMEs had 100 percent female ownership. On the other hand, less than half (46.1 percent) of SMEs had some level of female ownership (1 percent or above of reported ownership). Conversely, 53.9 percent of SMEs had 100 percent male ownership.
19.3%
16.4% 64.3%
Equal OwnershipMajority Female-Owned Majority Male-Owned
Figure 1a: Distribution of SME Ownership by Gender, 2007
Source: Statistics Canada, Survey on Financing of Small and Medium Enterprises, 2007.
Figure 1b: Distribution of SME Ownership by Gender, 2011
Source: Statistics Canada, Survey on Financing and Growth of Small and Medium Enterprises, 2011.
18.1%
15.5% 66.4%
Equal OwnershipMajority Female-Owned Majority Male-Owned
7Majority Female-Owned Small and Medium-Sized Enterprises—Special Edition: Key Small Business Statistics, May 2015
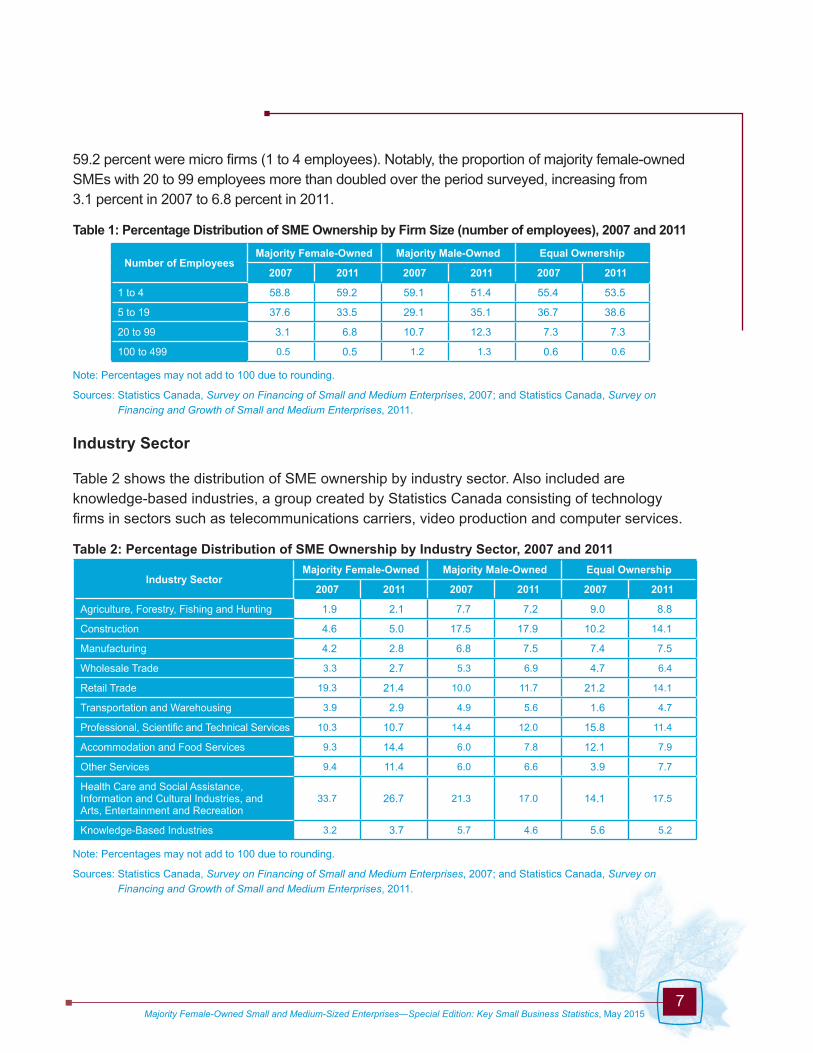
59.2 percent were micro firms (1 to 4 employees). Notably, the proportion of majority female-owned SMEs with 20 to 99 employees more than doubled over the period surveyed, increasing from 3.1 percent in 2007 to 6.8 percent in 2011.
Table 1: Percentage Distribution of SME Ownership by Firm Size (number of employees), 2007 and 2011
Note: Percentages may not add to 100 due to rounding.
Sources: Statistics Canada, Survey on Financing of Small and Medium Enterprises, 2007; and Statistics Canada, Survey on Financing and Growth of Small and Medium Enterprises, 2011.
Industry Sector
Table 2 shows the distribution of SME ownership by industry sector. Also included are knowledge-based industries, a group created by Statistics Canada consisting of technology firms in sectors such as telecommunications carriers, video production and computer services.
Table 2: Percentage Distribution of SME Ownership by Industry Sector, 2007 and 2011
Note: Percentages may not add to 100 due to rounding.
Sources: Statistics Canada, Survey on Financing of Small and Medium Enterprises, 2007; and Statistics Canada, Survey on Financing and Growth of Small and Medium Enterprises, 2011.
Number of EmployeesMajority Female-Owned Majority Male-Owned Equal Ownership
2007 2011 2007 2011 2007 2011
1 to 4 58.8 59.2 59.1 51.4 55.4 53.5
5 to 19 37.6 33.5 29.1 35.1 36.7 38.6
20 to 99 3.1 6.8 10.7 12.3 7.3 7.3
100 to 499 0.5 0.5 1.2 1.3 0.6 0.6
Industry SectorMajority Female-Owned Majority Male-Owned Equal Ownership
2007 2011 2007 2011 2007 2011
Agriculture, Forestry, Fishing and Hunting 1.9 2.1 7.7 7.2 9.0 8.8
Construction 4.6 5.0 17.5 17.9 10.2 14.1
Manufacturing 4.2 2.8 6.8 7.5 7.4 7.5
Wholesale Trade 3.3 2.7 5.3 6.9 4.7 6.4
Retail Trade 19.3 21.4 10.0 11.7 21.2 14.1
Transportation and Warehousing 3.9 2.9 4.9 5.6 1.6 4.7
Professional, Scientific and Technical Services 10.3 10.7 14.4 12.0 15.8 11.4
Accommodation and Food Services 9.3 14.4 6.0 7.8 12.1 7.9
Other Services 9.4 11.4 6.0 6.6 3.9 7.7
Health Care and Social Assistance, Information and Cultural Industries, and Arts, Entertainment and Recreation
33.7 26.7 21.3 17.0 14.1 17.5
Knowledge-Based Industries 3.2 3.7 5.7 4.6 5.6 5.2

Majority Female-Owned Small and Medium-Sized Enterprises—Special Edition: Key Small Business Statistics, May 20158
In both 2007 and 2011, majority female-owned SMEs were three to four times less likely to operate in the agriculture, forestry, fishing and hunting sector and the construction sector than majority male-owned SMEs. The manufacturing sector also exhibited a significantly lower concentration of majority female-owned businesses.
Majority female-owned SMEs were concentrated in service-oriented sectors, with health care and social assistance, information and cultural industries, and arts, entertainment and recreation; retail trade; and accommodation and food services accounting for 62.3 percent and 62.5 percent of majority female-owned SMEs in 2007 and 2011 respectively.
The highest concentration of businesses owned equally by males and females in 2011 was in the health care and social assistance, information and cultural industries, and arts, entertainment and recreation sector at 17.5 percent.
Growth
Many business owners have as an objective an intention to grow their businesses through increased sales and revenues. Firm growth is an important driver of the Canadian economy as increased revenues tend to result in an increase in the number of paid employees.
Table 3 shows the distribution of annual revenue growth rates reported by Canadian SMEs over the three-year period from 2009 to 2011. A lower percentage of majority female-owned SMEs (57.7 percent) reported revenue growth over the period than majority male-owned SMEs (62.4 percent) and SMEs owned equally by males and females (63.6 percent). For all three ownership categories, the dominant growth rate for firms that reported annual revenue growth fell in the range of 1 to 10 percent. Notably, a slightly higher percentage of SMEs owned equally by males and females reported annual revenue growth rates over 10 percent.
Table 3: Percentage Distribution of SME Ownership by Reported Annual Revenue Growth Rates, 2009 to 2011
Note: Percentages may not add to 100 due to rounding.
Source: Statistics Canada, Survey on Financing and Growth of Small and Medium Enterprises, 2011.
Growth Rate Majority Female-Owned Majority Male-Owned Equal Ownership
<0% (decline) 17.5 16.6 12.8
0% (no growth) 24.6 21.0 23.6
1–10% per year 41.2 44.1 44.1
11–20% per year 9.1 10.6 11.5
>20% per year 7.4 7.7 8.0

9Majority Female-Owned Small and Medium-Sized Enterprises—Special Edition: Key Small Business Statistics, May 2015
The fact that business owners have intentions to grow their businesses reflects their confidence in the economy. Table 4 shows the distribution of SME owners that reported on their expectations for sales or total revenue growth over the 2012–14 period. Overall, majority female-owned SMEs had lower growth expectations. While 51.4 percent of majority female owners intended to grow their business by 1 to 10 percent per year, 56.2 percent of majority male owners and 59.9 percent of equal ownership owners intended to grow their businesses by the same amount. As well, majority female owners expressed the highest expectations (28.9 percent) for negative or no growth of their business compared with majority male owners (23.8 percent) and equal ownership owners (21.9 percent).
Table 4: Percentage Distribution of SME Ownership by Expectations for Growth, 2012 to 2014
Note: Percentages may not add to 100 due to rounding.
Source: Statistics Canada, Survey on Financing and Growth of Small and Medium Enterprises, 2011.
Table 5 shows reported obstacles to business growth for 2011. Reported obstacles to business growth were generally consistent across the three categories of business ownership. The most common obstacles reported by business owners in 2011 were rising business costs, fluctuations in consumer demand for products or services, and increasing competition. Notably, finding qualified labour was not deemed one of the top three obstacles to growth in either year.
Table 5: Reported Obstacles (percentage) to Business Growth, 2011
* “Other” includes handling domestic and business responsibilities simultaneously, absence of networks or lack of financial literacy.
Source: Statistics Canada, Survey on Financing and Growth of Small and Medium Enterprises, 2011.
Growth Rate Majority Female-Owned Majority Male-Owned Equal Ownership
<0% (decline) 6.6 6.9 5.3
0% (no growth) 22.3 16.9 16.6
1–10% per year 51.4 56.2 59.9
11–20% per year 12.6 12.2 11.0
>20% per year 7.1 7.7 7.2
Obstacle Majority Female-Owned Majority Male-Owned Equal Ownership
Finding qualified labour 32.4 33.4 32.8
Fluctuations in consumer demand for products or services 48.0 52.5 54.8
Obtaining financing 17.4 16.4 17.5
Government regulations 28.3 34.3 34.8
Rising business costs 64.6 62.1 66.4
Increasing competition 46.1 48.8 45.7
Other* 22.4 21.9 23.1

Majority Female-Owned Small and Medium-Sized Enterprises—Special Edition: Key Small Business Statistics, May 201510
Exporting
Another avenue for growth for many businesses is through exporting. Exporting can provide a strategically important means of growing a firm by expanding its reach beyond the confines of Canada’s relatively small domestic market. It also diversifies a firm’s markets and customer base, thereby reducing its vulnerability to particular market slowdowns.
As illustrated in Figure 2a and Figure 2b, while the proportion of SMEs that claimed to have exported in either 2007 or 2011 was stable, but relatively small, majority female-owned SMEs exported only about half as much as other SMEs. Specifically, only 5.9 percent of majority female-owned SMEs claimed to have exported in 2007, whereas 11.1 percent of majority male-owned SMEs exported. That gap was even wider in 2011, with 5.0 percent of majority female-owned SMEs exporting compared with 11.8 percent of majority male-owned SMEs. In both 2007 and 2011, 10 percent of SMEs owned equally by males and females exported.
The fact that majority female-owned businesses are less likely to export than their counterparts may be related to industry sector selection. Majority female-owned businesses tend to operate in service-oriented industries that serve the domestic market, compared with majority male-owned SMEs that have a greater presence in more export-oriented resource-based and manufacturing sectors.
0 20 40 60 80 100
Non-ExporterExporter
EqualOwnership
MajorityMale-Owned
MajorityFemale-Owned
11.1
88.9
5.9
94.1
10.0
90.0%
Figure 2a: Percentage Distribution of SMEs that Exported in 2007
Source: Statistics Canada, Survey on Financing of Small and Medium Enterprises, 2007.
Figure 2b: Percentage Distribution of SMEs that Exported in 2011
Source: Statistics Canada, Survey on Financing and Growth of Small and Medium Enterprises, 2011.
0 20 40 60 80 100
Non-ExporterExporter
EqualOwnership
MajorityMale-Owned
MajorityFemale-Owned
11.8
88.2
5.0
95.0
10.0
90.0%

11Majority Female-Owned Small and Medium-Sized Enterprises—Special Edition: Key Small Business Statistics, May 2015
Innovation
Creation of new products and processes, including organizational and marketing processes, defines innovation. Innovation is an important driver of growth, and contributes to making an economy stronger and more competitive. Although significantly larger firms engage in innovation, innovation as a driver of growth also applies to smaller firms. Innovation is defined as follows:
• Product innovation: Introduction of a new or significantly improved good or service. This includes significant improvements in technical specifications, components and materials, incorporated software, user friendliness or other functional characteristics.
• Process innovation: Implementation of a new or significantly improved production or delivery method. This includes significant changes in techniques, equipment and/or software.
• Marketing innovation: Implementation of a new marketing method involving significant changes in product design or packaging, product placement, product promotion or product pricing.
• Organizational innovation: Implementation of a new organizational method in a firm’s business practices, workplace organization or external relations.
Figure 3 shows the distribution of SMEs that reported innovation activity in 2011.5 Across all three ownership categories, fewer than 40 percent innovated in 2011, with majority female-owned SMEs (39.5 percent) engaging slightly more in innovation activities than majority male-owned SMEs (37.0 percent) and SMEs owned equally by males and females (39.1 percent).
Figure 3: Percentage Distribution of SMEs that Reported Innovation Activities in 2011
Source: Statistics Canada, Survey on Financing and Growth of Small and Medium Enterprises, 2011.
5. Results for 2007 were not available.
0 20 40 60 80 100
Non-InnovatorInnovator
EqualOwnership
MajorityMale-Owned
MajorityFemale-Owned
%
39.5
37.0
39.1
60.5
63.0
60.9

Majority Female-Owned Small and Medium-Sized Enterprises—Special Edition: Key Small Business Statistics, May 201512
As illustrated in Table 6, a significantly higher proportion of majority female-owned SMEs engaged in product innovation6 compared with other categories of innovation and with other SMEs. A higher proportion of majority female-owned SMEs also engaged in process innovation compared with other SMEs.
Table 6: Percentage Distribution of SME Innovation Activities, 2011
Source: Statistics Canada, Survey on Financing and Growth of Small and Medium Enterprises, 2011.
Owners’ Managerial Experience
Managerial experience represents the number of years a majority owner has been a business owner or manager. It is a measure of the relevant expertise and knowledge that an owner processes. Figure 4a and Figure 4b show the reported level of managerial or ownership experience possessed by SME owners in 2007 and 2011.
In 2007, 50.1 percent of majority female owners of SMEs reported having over 10 years of relevant experience, but this was significantly lower than the more than 75 percent of other SME owners who reported having over 10 years of relevant experience. The proportion of majority female owners of SMEs with 5 to 10 years of experience, on the other hand, was more than double that of other SME owners. Similarly, the proportion of majority female owners with less than 5 years of relevant experience was almost double that of other SME owners. By 2011, the proportion of majority female owners of SMEs with over 10 years of relevant experience increased to almost 68 percent, narrowing the gap with the more than 78 percent of majority male-owned SMEs and those owned equally by males and females reporting over 10 years of relevant experience.
6. Product innovation is broadly defined; for example, introducing a new food item to a restaurant menu would qualify as a product innovation.
Innovation Activities Majority Female-Owned Majority Male-Owned Equal Ownership
Product Innovation 29.6 22.2 24.0
Process Innovation 15.0 14.4 14.5
Marketing Innovation 16.2 16.8 16.4
Organizational Innovation 15.8 14.2 17.0

13Majority Female-Owned Small and Medium-Sized Enterprises—Special Edition: Key Small Business Statistics, May 2015
Figure 4a: Percentage Distribution of Managerial or Ownership Experience Possessed by SME Owners, 2007
Source: Statistics Canada, Survey on Financing of Small and Medium Enterprises, 2007.
Figure 4b: Percentage Distribution of Managerial or Ownership Experience Possessed by SME Owners, 2011
Source: Statistics Canada, Survey on Financing and Growth of Small and Medium Enterprises, 2011.
0
20
40
60
80
100
Equal OwnershipMajority Male-OwnedMajority Female-Owned
More than 10 years5 to 10 years<5 years
%
13.2
6.9 7.0
36.7
17.2 17.6
50.1
75.9 75.5
0
20
40
60
80
100
Equal OwnershipMajority Male-OwnedMajority Female-Owned
More than 10 years5 to 10 years<5 years
%
8.24.5 3.8
24.2
16.9 15.5
67.6
78.6 80.7

Majority Female-Owned Small and Medium-Sized Enterprises—Special Edition: Key Small Business Statistics, May 201514
Owners’ Educational Attainment
The level of formal education provides a general indication of the stock of skills and knowledge among SME owners. It also indicates the potential skills and knowledge they have the capacity to acquire.
Figure 5 shows the distribution of the level of education that Canadian SME owners reported having in 2011. The level of post-secondary attainment reported by SME owners is high and is comparable to levels reported in the general population. Although over 65 percent of SME owners reported having some post-secondary education, 10 percent or less had not attained a high school diploma.
Figure 5: Percentage Distribution of the Level of Education Attained by Canadian SME Owners, 2011
Source: Statistics Canada, Survey on Financing and Growth of Small and Medium Enterprises, 2011.
More specifically, a significantly larger proportion (18.0 percent) of female-majority SME owners reported having at least a master’s degree, compared with 12.2 percent and 10.4 percent for male-majority owners and equal ownership business owners respectively. However, the reverse was true at the bachelor’s degree level, where a noticeably greater proportion of male-majority owners (23.5 percent) held bachelor’s degrees than female-majority owners (17.7 percent) and equal ownership business owners (19.1 percent).
0 10 20 30 40 50Equal OwnershipMajority Male-OwnedMajority Female-Owned
Less than high schooldiploma
High school diploma
College, CEGEP ortrade school diploma
Bachelor's degree
Master's degree ordoctorate
%
18.012.2
10.4
17.723.5
19.1
31.130.6
38.4
25.823.8
22.0
7.49.910.1
Post-secondary

15Majority Female-Owned Small and Medium-Sized Enterprises—Special Edition: Key Small Business Statistics, May 2015
Owners’ Access to Financing
Many entrepreneurs and businesses rely on external financing to launch new businesses or to grow an existing business by, for example, expanding operations, conducting research and development activities that lead to innovation, or exploring exporting opportunities in new markets. Retained earnings, owner equity and other assets are often insufficient to finance these activities and many SME owners must access external sources of capital such as debt, leasing, trade credit and equity financing.
Figure 6 shows the external financing requests of SME owners in 2007 and 2011. Compared with 2007, a greater proportion of owners, across all ownership categories, sought external financing in 2011. In 2007, 20.7 percent of majority female-owned SMEs, 22.9 percent of majority male-owned SMEs and 20.7 percent of SMEs owned equally by males and females requested external financing. In 2011, 29.3 percent of majority female-owned SMEs, 37.5 percent of majority male-owned SMEs and 36.6 percent of SMEs owned equally by males and females requested external financing. As shown in Figure 7, a similar pattern was observed with respect to requests for debt financing.7
Figure 6: Percentage Distribution of External Financing Requests by SME Owners, 2007 and 2011
Sources: Statistics Canada, Survey on Financing of Small and Medium Enterprises, 2007; and Statistics Canada, Survey on Financing and Growth of Small and Medium Enterprises, 2011.
7. These figures should be interpreted with caution as data for 2007 came after a relatively long period of economic growth, which in turn led to higher profitability at the firm level. Hence, financial needs were generally lower in 2007 than in 2011 as businesses were in the midst of economic recovery following the financial crisis of 2008–09. In this economic climate, the financial needs of SMEs were more acute as many businesses experienced lower profitability.
0 20 40 60 80 100Did not request external financingRequested external financing
2007
2011
2007
2011
2007
2011
%
70.7
79.3
62.5
77.1
63.4
79.3
Maj
ority
Fem
ale-
Ow
ned
Maj
ority
Mal
e-O
wne
dE
qual
Ow
ners
hip
29.3
20.7
37.5
22.9
36.6
20.7

Majority Female-Owned Small and Medium-Sized Enterprises—Special Edition: Key Small Business Statistics, May 201516
Figure 7: Percentage Distribution of Debt Financing Requests by SME Owners, 2007 and 2011
Sources: Statistics Canada, Survey on Financing of Small and Medium Enterprises, 2007; and Statistics Canada, Survey on Financing and Growth of Small and Medium Enterprises, 2011.
It is important to note that a very large majority of SME owners—more so in the case of majority female owners—did not request financing. This may suggest that majority female owners, compared with majority male owners, have different perceptions about requesting financing from lending institutions. Statistics Canada’s Survey on Financing and Growth of Small and Medium Enterprises, 2011, reported that 4.2 percent of majority female owners, compared with 2.7 percent of majority male owners, are discouraged borrowers.8 That discouragement was based on the assumption that their request would be turned down or that applying for financing was too difficult or time consuming (3.9 percent of majority female owners versus 2.0 percent of majority male owners).9
Another way to interpret these results is to look at the ratio of authorized to requested financing amounts, which is illustrated in Figure 8. The data suggest that majority female owners experience more difficulty accessing financing than majority male owners and equal ownership owners. Notably, there is little difference in the approval rate for majority male-owned SMEs and SMEs owned equally by males and females.
0 20 40 60 80 100Did not request debt financingRequested debt financing
2007
2011
2007
2011
2007
2011
%
80.1
86.4
73.5
84.5
73.4
80.2
Maj
ority
Fem
ale-
Ow
ned
Maj
ority
Mal
e-O
wne
dE
qual
Ow
ners
hip
19.9
13.6
26.5
15.5
26.6
19.8
8. Note that these statistics on discouraged borrowers refer to 100 percent ownership by both females and males—the 1–49 percent and 51–99 percent ownership categories being suppressed. Source: Statistics Canada, Survey on Financing and Growth of Small and Medium Enterprises, 2011, Table 1.
9. Note that these statistics refer to 100 percent ownership by both females and males—the 1–49 percent and 51–99 percent ownership categories being suppressed. Source: Statistics Canada, Survey on Financing and Growth of Small and Medium Enterprises, 2011, Table 1.

17Majority Female-Owned Small and Medium-Sized Enterprises—Special Edition: Key Small Business Statistics, May 2015
Figure 8: Debt Financing and SME Ownership: Ratio of Authorized Amount to Requested Amount, 2011
Source: Statistics Canada, Survey on Financing and Growth of Small and Medium Enterprises, 2011.
A significantly greater number of majority female owners saw their request for financing rejected because they had, on average, insufficient collateral (66.6 percent versus 35.7 percent) and the lending institution judged that they operated in an unstable industry (65.7 percent versus 24.8 percent).10 As mentioned earlier, most majority female-owned SMEs are concentrated in service-oriented industries, where the environment is characterized by intense competition and lower economic returns. Financial institutions likely view these types of firms as riskier business investments.
10. Note that these statistics refer to 100 percent ownership by both females and males—the 1–49 percent and 51–99 percent ownership categories being suppressed. Source: Statistics Canada, Survey on Financing and Growth of Small and Medium Enterprises, 2011, Table 8.
0 10 20 30 40 5070
75
80
85
90
95
100R
atio
of A
utho
rized
Am
ount
/ R
eque
sted
Am
ount
Requested Debt Financing
MajorityFemale-Owned
Majority Male-Owned
EqualOwnership
%