special committee of the whole monday, january 11, 2021 …
TRANSCRIPT

SPECIAL COMMITTEE OF THE WHOLE Monday, January 11, 2021 at 7pm
City Hall Council Chamber
109 James Street Geneva, IL 60134
In strict adherence to Gov. Pritzker’s Executive Order 2020-74 (with exceptions permitted only for compliance with the Illinois Open Meetings Act), prohibiting indoor meeting gatherings of any size; public City of Geneva meetings are now virtual. Meetings are livestreamed for the public to provide the ability to contemporaneously hear all discussion, testimony and roll call votes of the open meeting in real time. Please visit the City website for details on how to watch the meeting live. While the public may not attend meetings in person, individuals wishing to provide public comment may do so in advance (recommended) or during the meeting by sending an email to mailto:[email protected]. In addition, individuals may be recognized during the meeting (audio only) by accessing the meeting via the link below:
https://attendee.gotowebinar.com/register/1779591867543465999
For more information please see: “Notice Regarding Meeting and Public Comment Rule Modification Due to COVID-19”.
AGENDA 1. CALL TO ORDER 2. ITEMS OF BUSINESS
a. Presentation and Discussion Regarding FY 2022 Budget and FY 2023 Budget Projections
3. NEW BUSINESS/PUBLIC COMMENT 4. ADJOURNMENT
1

FY 22 Draft Budget
And FY 23 Budget
Planning DRAFT
2

FINANCIAL POLICIES & PROVISIONS General Provisions
The City of Geneva’s financial policies and provisions, compiled below, set forth the basic framework for the overall fiscal management of the City. These policies assist the decision-making process of the City Council and the Administration. The policies also provide guidelines for evaluating both current activities and proposals for future programs and budgets.
Financial policies aid the City by improving financial management, financial position and the creditworthiness of the City. They also serve to ensure all financial transactions conducted by or on behalf of the City, its agencies, departments, officials and authorized agents will be made in a manner and method which provides for the most proficient and effective management of the financial resources and funds of the City. These policies provide for the maximum protection of the City taxpayer, in accordance with and utilizing established financial management practices, accounting standards, and auditing requirements. Included are specific policies related to operations, accounting and auditing, reserves, capital projects, cash management, debt, and budget.
The City prepares a balanced itemized budget for each fund and each program within the fund. The budget should be balanced with current revenues equal to or greater than current expenditures/expenses. In any fund in which expenditures/expenses shall exceed revenues, prior year revenues (reappropriation or use of fund balance) will be used to meet the shortfalls.
The City Council is responsible for establishing and authorizing policies and procedures for the management of all financial resources and transactions of the City. The City Administrator and other City officials are responsible for adopting administrative procedures necessary to implement the financial policies.
It is the policy of the City to maintain sound financial practices and policies which are viable and current according to generally accepted accounting principles, auditing standards, and financial management experience, and which are consistent and comply with all applicable State and Federal laws. The City shall regularly review its policies and procedures and reserves its right to change and supplement them as necessary.
The following financial policies were adopted by Resolution by the Geneva City Council on March 4, 2019:
General Policies
1. Economic Development: The City will try to create an economic environment that willencourage businesses to locate in Geneva and create opportunities for existingbusinesses.
2. Investments: Investment practices should have an avoidance of risk as the primaryobjective. Additionally, practices should provide liquidity, diversification, and yield.
DRAFT
3

FINANCIAL POLICIES & PROVISIONS 3. Citizen Participation: The City will develop methods to ensure public participation in
decision making. This endeavor can be accomplished by the Strategic Plan Advisory Committee.
Budgetary Policies
1. Fund Balance: Fund balance is generally defined as the difference between a fund’s assets and liabilities. An adequate fund balance is necessary for numerous reasons, such as to have funds available in case of an emergency or unexpected events, to maintain or enhance the City’s financial position and related bond ratings, to provide cash for operations prior to receipt of property tax revenues, and to maximize investment earnings. The City will strive to maintain an available fund balance of at least 90 days of the current budget year operating expenditures for the General Fund and available cash of at least 90 days of current budget year expenditures in the Electric Fund and the Water/Wastewater Fund.
2. Sources of Revenue: The City will maintain a diversified and stable revenue stream to
shelter the City from short-run fluctuations in any one revenue source. 3. Forecasting: The City will prepare an annual budget for the upcoming year and a
projection of revenues and expenditures for the subsequent year. The City will do its best to estimate revenues and expenditures while realistically taking into account those that have a high degree of elasticity.
4. Goals and Objectives: The City will use the Strategic Plan to direct the budget plan, and
include the accompanying goals and objectives in the budget document.
Operating Policies
1. Pay-As-You-Go: The City will attempt to pay current operating expenses from current revenues. To ensure this activity, the City will not expand services beyond the City’s level of operating revenue.
2. Maintain Existing Service Levels: The City provides a high level of service to our citizens and may find it necessary from time to time to adjust the extent of services, but the primary objective is to maintain the high standard currently in place.
3. Capital Assets: Capital assets are those items having a useful life greater than one year with an initial, individual cost of more than $50,000 for streets, bridges and storm sewers, $20,000 for sidewalks and $5,000 for all other capital assets. Such assets are recorded at historical cost or estimated historical cost if purchased or constructed. Donated capital assets are recorded at estimated fair market value at the date of donation. The cost of normal maintenance and repairs, including street overlays that do not add to the value of the asset or materially extend asset lives, are not capitalized. The City will provide for the adequate maintenance of capital assets.
DRAFT
4

FINANCIAL POLICIES & PROVISIONS 4. Balanced Budget: The City will present a budget annually to the Council that is within the
City’s ability to pay, with the expenditures not exceeding the current revenues and prior year fund balance.
TIF Allocation Policies
1. Allocation of TIF Funds: Tax Increment Finance District (TIF) funds are to be used for community and economic development purposes as one of the City’s public financing methods.
2. Administration: The administration and implementation of these funds are accomplished through the work of the Economic Development Director, who serves as the Tax Increment Finance Administrator, with assistance from the City Administrator, Community Development Director, Business Development Analyst, Finance Director, Accounting Supervisor and City Planner.
3. Salary Allocation: TIF funding may be allocated toward the salaries of these positions, depending on the anticipated level of job-related TIF duties, on a year-to-year basis, in an amount not to exceed 30.0% of the total designated TIF funds.
Investment Policies
1. Scope: This policy includes all funds governed by the Mayor and the City Council. Except for cash in certain restricted and special funds, the City will consolidate cash balances from all funds to maximize investment earnings. Investment income will be allocated to the various funds based on their respective participation and in accordance with generally accepted accounting principles.
2. Safety: Safety shall be the main objective of the Investment Policy and refers to the preservation of capital and protection of investment principal. City investments shall be undertaken in a manner that seeks to ensure the preservation of capital in the City’s overall portfolio by mitigating credit and interest rate risk.
a. Credit Risk: Credit risk is the risk an issuer of a debt security will not pay its par value upon maturity. The goal will be to minimize credit risk by:
i. Limiting investments to the types of securities identified in the policy.
ii. Diversifying the portfolio in accordance with the policy so potential losses on individual securities will be minimized. Diversification reduces the risk that potential losses on individual securities might exceed the income generated from the remainder of the portfolio.
b. Interest Rate Risk: Interest rate risk is the risk that changes in interest rates will adversely affect the fair value of an investment. The goal will be to minimize interest rate risk by:
DRAFT
5

FINANCIAL POLICIES & PROVISIONS i. Structuring the portfolio so securities mature to meet cash requirements
for ongoing operations, thereby avoiding the need to sell securities on the open market prior to maturity.
ii. Investing operating funds primarily in shorter-term securities, money markets or similar investment pools.
3. Liquidity: The portfolio shall maintain sufficient liquidity to enable the City to meet all operating requirements and expected liabilities which may be reasonably anticipated in any City fund.
4. Return: The portfolio shall be designed to obtain a reasonable return, taking into account the City’s investment risk constraints and cash flow needs of the City’s funds and conforming to all State and local statutes governing the investment of public funds.
5. Delegation of Authority: Management and administrative responsibility for the investment program is hereby delegated to the Finance Director, hereinafter referred to as investment officer, who, under the direction of the City Administrator, will act in accordance with established written procedures and internal controls for the operation of the investment program consistent with this investment policy. No person may engage in an investment transaction except as provided under the terms of this policy and the procedures established by the investment officer. The investment officer shall be responsible for all transactions undertaken and shall establish a system of controls to regulate the activities of subordinate officials.
6. Authorized Financial Dealers and Institutions: Financial institutions may include depositories, investment advisors, broker/dealers and local government investment pools as authorized in this policy. Financial institutions who desire to become qualified for transactions must provide certification of having read and understood this policy, agree to comply with this policy and ensure all investments proposed for purchase will conform to this policy and applicable State statutes. Selection of financial institutions authorized to engage in transactions with the City shall be at the sole discretion of the City. Financial institutions will be selected based on financial condition, proper registration, level of service, experience with Illinois municipalities and competitive pricing.
All depositories shall be insured by the Federal Deposit Insurance Corporation (FDIC) or the National Credit Union Administration (NCUA) and may consist of banks, savings and loan associations and credit unions. All financial institutions who desire to become designated depositories must supply the following (as appropriate):
a. Audited financial statements b. Proof of state registration c. Evidence of adequate insurance coverage
DRAFT
6

FINANCIAL POLICIES & PROVISIONS All investment advisors shall be registered under the Investment Advisors Act of 1940. All financial institutions who desire to become designated investment advisors must supply the following (as appropriate):
a. Audited financial statements b. Securities and Exchange Commission (SEC) Form ADV – Parts 1 and 2 c. Proof of state or SEC registration d. Evidence of adequate insurance coverage
All broker/dealers shall be insured by the Securities Investors Protection Corporation (SIPC). All financial institutions who desire to become designated brokers/dealers must supply the following (as appropriate):
a. Audited financial statements b. Proof of Financial Industry Regulatory Authority (FINRA) certification c. Proof of state registration d. Evidence of adequate insurance coverage
A periodic review of the financial condition and registration of all designated financial institutions will be conducted by the Finance Director or designee.
Any financial institution selected by the City of Geneva may be requested to provide cash management services, including but not limited to: checking accounts, wire, and ACH transfers, purchase and sale of investment securities and safekeeping services. Fees for banking services shall be mutually agreed to by an authorized representative of the financial institution and the Finance Director of the City.
7. Authorized and Suitable Investments: Investments may be made in any type of security allowed for in Illinois statutes regarding the investment of public funds. The following investments will be permitted by this policy and are those defined by state law:
a. Bonds, notes, certificates of indebtedness, treasury bills or other securities now or hereafter issued, which are guaranteed by the full faith and credit of the United States of America as to principal and interest.
b. Bonds, notes, debentures or other similar obligations of the United States of America, its agencies and its instrumentalities.
c. Interest-bearing savings accounts, interest-bearing certificates of deposit or interest-bearing time deposits or any other investments constituting direct obligations of any bank as defined by the Illinois Banking Act.
d. Obligations of corporations organized in the United States with assets exceeding $500,000,000 if (i) such obligations are rated at the time of purchase at one of the 3 highest classifications established by at least two standard rating services and which mature not later than three years from the date of purchase, (ii) such purchases do not exceed 10.0% of the corporation’s
DRAFT
7

FINANCIAL POLICIES & PROVISIONS outstanding obligations and (iii) no more than one-third of the City’s funds may be invested in short term obligations of corporations.
e. Money market mutual funds registered under the Investment Company Act of 1940, provided the portfolio of any such money market mutual fund is limited to (i) Bonds, notes, certificates of indebtedness, treasury bills or other securities now or hereafter issued, which are guaranteed by the full faith and credit of the United States of America as to principal and interest and (ii) Bonds, notes, debentures or other similar obligations of the United States of America, its agencies and its instrumentalities.
f. Interest-bearing bonds of any county, township, city, village, incorporated town, municipal corporation or school district of the State of Illinois, of any other state, or of any political subdivision or agency of the State of Illinois or of any other state. The bonds shall be registered in the name of the City or held under a custodial agreement at a bank. The bonds shall be rated at the time of purchase within the four highest general classifications established by a rating service of nationally recognized expertise in rating bonds of states and their political subdivisions.
g. Short term discount obligations of the Federal National Mortgage Association.
h. Shares or other forms of securities legally issuable by State or Federal savings banks or savings and loan associations which are insured by the FDIC. Dividend-bearing share accounts, share certificate accounts or class of share accounts of a credit union chartered under the laws of the State of Illinois or the laws of the United States; provided, however, the principal office of any such credit union must be located within the State of Illinois whose accounts of which are insured by applicable law.
i. A Public Treasurers’ Investment Pool created under Section 17 of the State Treasurer Act (e.g., Illinois Funds).
j. Illinois Metropolitan Investment Fund.
k. Any other investment permitted by Illinois statute.
8. Collateralization: Funds on deposit (checking accounts, certificates of deposit, etc.) in excess of FDIC limits must be secured by some form of collateral allowed by Illinois state statute (30 ILCS 235/6(d)), witnessed by a written agreement and held at an independent third-party institution in the name of the City of Geneva. Securities held as collateral must not be of a type in violation of this investment policy. The amount of collateral provided will not be less than 105.0% of the market value of the net amount of public funds secured. Substitution or exchange of securities held in safekeeping shall not be done without prior written notice of the City at least 10 days prior to any proposed substitutions and provided that the market value of the replacement securities are equal or greater than the market
DRAFT
8

FINANCIAL POLICIES & PROVISIONS value of the securities being replaced. The City must pre-approve all substitution and exchanges of securities. The ratio of the fair market value of collateral to the amount of funds secured shall be reviewed monthly and additional collateral will be requested when the ratio declines below the level required.
9. Safekeeping and Custody: All security transactions entered into by the City where applicable shall be conducted on a delivery-versus-payment (DVP) basis to ensure securities are deposited in an eligible financial institution prior to the release of funds. Securities will be held by an independent third party custodian designated by the Finance Director and evidenced by safekeeping receipts and a written custodial agreement.
10. Diversification: The City shall diversify its investments to the best of its ability based on the type of funds invested and the cash flow needs of those funds. Diversification may be by type of investment, number of institutions invested in and length of maturity.
11. Maximum Maturities: To the extent possible, the City shall attempt to match its investments with anticipated cash flow requirements. Unless matched to specific cash flow, the City will not directly invest in securities maturing more than three (3) years from the date of purchase. However, reserve funds may be invested in securities exceeding three (3) years if the maturities of such investments are made to coincide as nearly as practicable with the expected use of the funds.
12. Readily Available Funds: Because of inherent difficulties in accurately forecasting cash flow requirements, a portion of the portfolio should be continuously invested in readily available funds such as money market funds to ensure appropriate liquidity is maintained to meet ongoing obligations.
13. Internal Control: The Finance Director is responsible for establishing and maintaining an internal control structure designed to insure assets of the City are protected from loss, theft or misuse. The internal control structure shall be designed to provide reasonable assurance these objectives are met. The internal controls shall address the following points:
• Control of collusion • Separation of transaction authority from accounting • Custodial safekeeping • Written confirmation of telephone transactions for investments and wire
transfers
14. Performance Standards: This investment portfolio will be managed in accordance with the parameters specified within this policy. The portfolio should obtain a comparable rate of return during a market/economic environment of stable interest rates. Portfolio performance should be compared to benchmarks with similar maturity, liquidity and credit quality as the portfolio.
DRAFT
9

FINANCIAL POLICIES & PROVISIONS 15. Reporting: The Finance Director shall prepare an investment report quarterly. The report
should be provided to the Mayor, City Council, and City Administrator and made available upon request. The report should be in a format suitable for review by the general public.
16. Legislation and Documentation: The City’s investment program shall comply at all times with the Illinois Public Funds Investment Act (30 ILCS 235/1 et seq.) and other state laws governing the investment of public funds, as amended from time to time. In the event of any conflict between this policy and the Illinois Public Funds Investment Act and other state laws, the provisions of the Illinois Public Funds Investment Act and other state laws shall control.
The Finance Director will maintain a list and is hereby authorized to deposit City monies, in accordance with 65 ILCS 5/3.1-35-50, in financial institutions approved by the City Council. The Finance Director shall review this list from time to time and shall submit any modifications to the City Council for approval.
Debt Policies
1. Use of Debt Financing: The City will limit the use of long-term borrowing to capital improvement projects that cannot be financed from current revenues. Debt financing shall generally be utilized for projects that benefit the citizens of Geneva and have a useful life that will exceed the term of the financing. The City will not use long-term debt for current operations.
2. Limits on Debt Issuance: State statute limits a local government’s debt to 8.625% of its assessed value. Additionally, the City will try to keep the average maturity of all debt at or below fifteen (15) years.
3. Bond Covenants: The City will restrict current activities to a point where bond covenants will be met. The City’s ability to meet these covenants will also reflect on how rating agencies view the City.
Pension Funding Policies
1. Purpose: The financial objective of a defined benefit pension plan is to fund the long term cost of benefits provided to the plan participants. In order to assure the plan is financially sustainable, the plan should accumulate adequate resources in a systematic and disciplined manner over the active service life of benefitting employees. This funding policy outlines the method utilized by the City of Geneva (City) to determine its actuarially determined contribution to the Pension Funds which fund the long term cost of benefits to the plan participants and annuitants.
2. Guidelines: The City believes this funding policy meets the guidelines for State and Local governments set by the Pension Funding Task Force convened by the Center for the
DRAFT
10

FINANCIAL POLICIES & PROVISIONS State and Local Government Excellence. The guidelines set by this task force outline the following objectives for pension funding policy:
• Actuarially determined contributions – a pension funding plan should be
based on an actuarially determined annual required contribution (ARC) that incorporates both the cost of benefits in the current year and the amortization of the plan’s unfunded actuarial accrued liability.
• Funding discipline – a commitment to make timely, actuarially determined contributions to the retirement system is needed to ensure sufficient assets are available for all current and future retirees.
• Intergenerational equity – annual contributions should be reasonably related to the expected and actual cost of each year of service so the cost of employee benefits is paid by the generation of taxpayers who receives services from those employees.
• Contributions as a stable percentage of payroll – contributions should be managed so employer costs remain consistent as a percentage of payroll over time.
• Accountability and transparency – clear reporting of pension funding should include an assessment of whether, how, and when the plan sponsor will ensure sufficient assets are available for all current and future retirees.
3. Policy: The City will determine its ARC to the Police Pension and Firefighters Fund based
upon the advisement of the City’s enrolled actuary1 while maintaining a minimum ARC based upon state statute. The City will make its actuarially determined contributions to the Pension Funds after the property taxes are received each fiscal year.
1Enrolled actuary is a member of the Society of Actuaries or American Academy of Actuaries and is enrolled under Subtitle C of Title III of the Employee Retirement Income Security Act of 1974, or who has been engaged in providing actuarial services to one or more public retirement systems for a period of at least 3 years as of July 1, 1983.
4. Transparency & Reporting: Funding of the Pension Funds should be transparent to vested parties including plan participants, annuitants, the Pension Fund Board of Trustees, City Council, and residents. In order to achieve this transparency, the following information shall be annually distributed:
• A copy of the annual actuarial valuation for the Police Pension Fund and Firefighters Fund shall be made available to the City Council and the respective Pension Fund Board of Trustees.
DRAFT
11

FINANCIAL POLICIES & PROVISIONS • The City’s Comprehensive Annual Financial Report shall be published on the
City’s website. This report includes information on the City’s annual contribution and funded status of the Pension Funds.
• The City Council shall approve the City’s annual contribution to the Pension Funds.
• The City’s annual operating budget shall include the City’s contribution to the Pension Funds as well as include a budget for each of the Pension Funds.
Each Pension Fund budget is controlled by its Pension Fund Board of Trustees, in accordance with State law. The City’s operating budget document shall be published on the City’s website and made available for public inspection at the Geneva Public Library.
5. Review of Funding Policy: Funding a defined benefit pension plan requires a long term horizon. Assumptions and inputs into the policy should focus on long term trends, not year-to-year shifts in the economic or non-economic environments. Generally, assumptions or inputs should be evaluated and changed if long term economic or non-economic inputs have fundamentally changed or are no longer reasonable. As such, the City will review this policy at least every three years to determine if changes to this policy are needed to ensure adequate resources are being accumulated in the Pension Funds. The City reserves the right to make changes to this policy at any time if it is deemed appropriate.
Planning and Goal Setting
The City of Geneva adopted its first strategic plan document in 1997. This document has been updated over the years. In 2017, the City Council identified a need to begin the process for a new strategic plan and tasked this responsibility to the Strategic Plan Advisory Committee (SPAC).
Over the next year and a half, SPAC volunteered countless hours of time to understand what matters most to Geneva. Their efforts included reflecting on the community’s accomplishments, identifying Geneva’s strengths, and acknowledging areas for improvement. The end result is a strategic plan that incorporates the voice of the residents, business owners, and other stakeholders. The plan was formally adopted by the City Council in October of 2018. The plan focuses on five key themes: Economic Vitality (EV), Strong Governance (SG), Environmental Stewardship (ES), Excellent Municipal Services (EMS), and Quality of Life (QL). Within each theme is a vision for 2025, along with outcomes (anticipated changes that will occur as the City achieves each vision’s strategic objectives), objectives (strategies and activities that must be completed to achieve the vision), action items (specific tactics that will take place in pursuit of desired outcomes and objectives), and performance indicators (help to communicate progress in achieving desired outcomes).
In November 2020, at the annual strategic plan workshop (which is traditionally the kickoff to the budget development process), the City Council along with senior management staff and representatives of SPAC met to prioritize the objectives within the plan for the upcoming fiscal year.
DRAFT
12

FINANCIAL POLICIES & PROVISIONS Theme – Objective PRIORITY OBJECTIVES FOR FY 2022
EV – II Develop a resilient local economy through the development of new commercial and industrial opportunities to add to the City’s tax base.
EV – I Maintain an economically healthy population through support of new housing opportunities and changes that may allow for greater diversity of housing.
ES – II Take actions to promote long-term sustainability and reduce the City’s carbon footprint.
ES – III Implement initiatives to protect the Fox River and preserve groundwater resources.
SG – I The City regularly seeks opportunities to increase transparency, solicit feedback and educate its community members.
EMS – IV The City is a data driven organization that relies on quantifiable data and analysis to make informed decisions. The City tracks and measures success in achieving the outcome and objectives defined in this plan.
Several of the priorities remained the same from FY 2021 with a couple new additions. Staff used results of the prioritization exercise to begin the budget development process and include as many projects/programs supporting the top priority goals as resources would allow.
Integration with Other Long-Term Planning Processes
The City Council and staff utilize several processes and documents to help develop long-term goals and objectives, including the following:
• Preliminary Budget Work Sessions – The City Administrator and Finance Director conducted budget-related meetings with management staff to discuss the financial outlook and short-term priorities for the upcoming budget year.
• Economic Development – The City has a dedicated Economic Development Department that works to attract appropriate commercial, office/research and light industrial developments to the City.
• Downtown Enhancements – The downtown business district serves as a focal point for community activities and is a stimulus for the community and creating a destination location. In FY 2013 the City completed and published a downtown/station area master plan describing the City’s overall vision for the future of downtown, together with detailed recommendations on future development/redevelopment sites, land use, government facilities/sites, parking, vehicle/bicycle/pedestrian access, transit housing, open/civic spaces, and urban designs.
DRAFT
13

FINANCIAL POLICIES & PROVISIONS
• Infrastructure Maintenance – The City is committed to infrastructure and property maintenance to maintain property values.
• Two fiscal year budget – The City implemented a two fiscal year budget. Although legally the City Council may only pass one fiscal year (FY 2022); FY 2023 is forecasted (albeit not adopted).
Annual Budget Adoption
During the second quarter of the year, the City Administrator establishes the calendar for the adoption of the annual operating budget for the upcoming year. The calendar is designed to allow sufficient time for preparation of budget requests, public comment, staff and Administrator review, Council consideration, and publication and submission deadlines established by state statute. All dates are considered to be mandatory unless otherwise modified by the City Administrator.
The City Administrator and Finance Director issue budget forms and standards around the end of August. All departments submit their budget requests according to the schedule and standards. The City Administrator, with assistance from the Finance Director, reviews and evaluates the budget requests in formulating the budget to be recommended to the Council. Throughout this process several meetings are scheduled with each Department Head to discuss budget requests. In January 2021, the City Administrator presented a recommended budget and provided an overview of the FY 2022 and FY 2023 budgets at a Special Committee of the Whole City Council meeting. Over the next several weeks, time was set aside at each Committee of the Whole meeting to consider and discuss the budget and specific funds. Staff was available to answer questions, present additional information, or provide justification concerning the requests. In addition, the City Council was able to submit questions regarding the budget for a response from staff and publication on the City’s website.
After the initial review by the Council and action to set a public hearing date, copies of the proposed budget were made available on the City’s website and at City Hall. A public hearing notice was also published in the local newspaper. The public hearing was scheduled at most twenty (20) days after publication of the notice, but not less than ten (10) days, in accordance with state statutes. The Council held a public hearing on the date and at the time specified in the publication for the purposes of hearing taxpayer questions and comments concerning the proposed budget. The budget is scheduled to be adopted on February 1, 2020, prior to the May 1, 2020 deadline as required by state statute.
Budget Development Schedule
Subsequent to the adoption of the budget, the budgeted expenditures are recorded in the general ledger and provide management with an ongoing visual indication of available balances. Each month budget reports are sent to the City Administrator and Department Heads for their review and budget adjustments are made between department line items when operations cause a line item to exceed the budget amount. Quarterly budget to actual reports are presented and accepted
DRAFT
14

FINANCIAL POLICIES & PROVISIONS by the City Council. The major funds, General, Electric and Water/Wastewater, budget to actual reports are presented and accepted on a monthly basis. During the year, the City Administrator may recommend budget amendments to the City Council as needed. The City Council must authorize budget amendments by a 2/3 vote.
DRAFT
15

BUDGET CALENDAR
`
NOV
DEC
JAN
FEB START OF BUDGET
• Budget Schedule
& Standards released to Department Heads
• Computer & Personnel Request Forms Due
• Receive estimated Property Tax from Kane County
• SSA Meeting • Capital & Special
Project Request Forms Due
• Official Budget Kick-off during Strategic Plan
• Acceptance of FY20 CAFR
• Recommend Approval of Est. Property Tax Levy
• Budget Meetings for all departments and divisions.
• Finalize Draft Budget • Final Property Tax Levy to CC • Last month to file Tax Levy
with County • Mission Statement, Goals/
Objectives, Organizational Charts Due
• Present and Review Draft Budget with City Council
• Revisions to Budget as directed by CC. Follow up meetings with DHs if needed.
• Public Hearing for FY 2022-23 Budgets
• Approval of Resolution Adopting the FY 2022 Budget
AUG
SEP
OCT
DRAFT
16

FINANCIAL STRUCTURE
Basis of Presentation In determining the agencies or entities which comprise the City for financial reporting purposes, the criteria of oversight responsibility over such agencies or entities, special financing relationships and scope of public service provided by the agencies or entities are used. Oversight responsibility is determined by the extent of financial interdependency, control over the selection of the governing authority and management, ability to significantly influence operations and accountability for fiscal matters. The City’s accounts are organized on the basis of funds, each of which is considered to be a separate accounting entity. The operations of each fund are accounted for by providing a separate set of self-balancing accounts comprised of assets, liabilities, equities, revenues, and expenditures. The various funds are grouped by type in the financial statements. Within each fund type exists one or more funds. Fund Structure The City has three types of funds: Governmental Funds, Proprietary Funds, and Fiduciary Funds. Governmental Funds are those through which most governmental functions of the City are financed. The acquisition, use, and balances of the City’s expendable financial resources and the related liabilities (other than those in proprietary funds) are accounted for through government funds.
City of Geneva
GovernmentalFunds
GeneralFund
$19,612,815
SpecialRevenue
Funds$2,495,645
DebtServiceFunds
$650,300
CapitalProjectsFunds
$8,761,035
ProprietaryFunds
EnterpriseFunds
$67,060,750
InternalServiceFunds
$1,048,965
FiduciaryFunds
Trust andAgencyFunds
$3,208,590
DRAFT
17

FINANCIAL STRUCTURE • The General Fund is the general operating fund of the City. It is used to account for all
financial resources traditionally associated with governments that are not required to be accounted for in another fund.
• Special Revenue Funds are used to account for the proceeds of specific revenue sources restricted by law or administrative action to expenditures for specified purposes. Special Revenue Funds include:
• Motor Fuel Tax • Cultural Arts Commission (CAC) • Strategic Plan Advisory Committee (SPAC) • Beautification Committee • Tourism • Restricted Police Fines • Public, Educational and Government Access (PEG) • Geneva Community Mental Health Board • Foreign Fire Insurance • Special Service Area #1 • Special Service Area #4 (Randall Square) • Special Service Area #5 (Williamsburg) • Special Service Area #7 (Blackberry) • Special Service Area #9 (Geneva Knolls) • Special Service Area #11 (Eagle Brook) • Special Service Area #16 (Fisher Farms) • Special Service Area #18 (Wildwood) • Special Service Area #23 (Sunset Meadows) • Special Service Area #26 (Westhaven) • Special Service Area #32 (On Brentwood’s Pond)
• Debt Service Funds are used to account for the accumulation of resources for and the
payment of, general long-term debt principal, interest, and related costs other than capitalized leases and compensated absences paid from the governmental funds. The City has only one Debt Service Fund.
• Capital Project Funds are used to account for financial resources to be used for the acquisition or construction of major capital facilities (other than those financed through proprietary funds or fiduciary funds). Capital Project Funds for the City include:
• General Capital Projects • Infrastructure Capital Projects • Prairie Green • Tax Increment Financing #2 (TIF #2)
DRAFT
18
FINANCIAL STRUCTURE • Tax Increment Financing #3 (TIF #3) • Capital Equipment
Proprietary Funds are for those services for which the City charges customers a fee. There are two types of proprietary funds, enterprise, and internal service. Enterprise funds encompass the same functions reported as business-type activities in the government-wide statements. Enterprise fund services are primarily provided to customers external to the City organization such as those of the electric, water and sewer utilities, refuse, and commuter parking functions. Internal service funds provide services and charge fees to customers within the City organization such as equipment services and the insurance funds.
• Enterprise Funds are used to account for operations financed and operated in a manner similar to a private business enterprise. The intent of the City in using this type of fund is to determine the costs (expense, including depreciation) of providing goods or services to the general public on a continuing basis be financed or recovered primarily through user charges. Enterprise funds for the City include:
• Electric • Water/Wastewater • Refuse • Cemetery • Commuter Parking
• Internal Service Funds are used to account for the financing of goods or services provided
by one department or agency to other departments or agencies of the City on a cost-reimbursement basis. Internal Service Funds for the City include:
• Group Dental Insurance • Workers’ Compensation • Compensated Absences (Unbudgeted)
Fiduciary Funds are used to account for assets held by the City in a trustee capacity or as an agent for individuals, private organizations and other governments.
• Trust and Agency Funds consist of resources received and held by the City as trustee or agent to be expended or invested in accordance with the conditions of the trust or in its agency capacity. Pension Trust Funds are accounted for in essentially the same manner as Proprietary funds. Trust Funds for the City include:
• Police Pension Fund • Firefighters’ Pension Fund
DRAFT
19

FINANCIAL STRUCTURE Basis of Accounting Budgets for the governmental fund types (General Fund, Special Revenue Funds, etc.) are adopted on a basis consistent with “Generally Accepted Accounting Principles” (GAAP), utilizing the modified accrual basis of accounting. Revenues are recognized when they become measurable and available. Expenditures are recognized when the liability has been incurred, with the exception of principal and interest payments on general long-term debt that are recognized when due. The proprietary fund types are budgeted on a basis consistent with GAAP, utilizing the accrual basis of accounting, except for capital outlay and debt principal which is budgeted as an expenditure. The Comprehensive Annual Financial Report (CAFR) shows the status of the City’s finances on the basis of GAAP and on a budgetary basis. In most cases, this conforms to the way the City prepares its budget. Exceptions are as follows:
• Capital outlay within the Enterprise Funds are recorded as assets on a GAAP basis and expended on a budget basis.
• Debt principal payments are recorded as reductions of liabilities on a GAAP basis and expended on a budget basis.
The final budget adopted by the City Council must be a balanced budget, where total resources equal or exceed total obligations. The State Budget Law prohibits a budget which projects spending in excess of available resources. The City’s budget is prepared on the modified accrual basis and assumes the prior year’s ending cash balances will be fully utilized to balance the budget. While the fund balance is not an annual source of revenue to fund operations of the City, year-end carryovers are used to fund future year operating and capital budgets. Adequate fund balance reserves are kept to meet unexpected operating or capital demands and to cover any unanticipated revenue shortfalls. Internal Controls The City is responsible for establishing and maintaining an internal control structure designed to ensure the assets of the government are protected from loss, theft or misuse and to ensure adequate accounting data is compiled to allow for the preparation of financial statements in conformity with GAAP. The internal control structure is designed to provide reasonable, albeit not absolute, assurance these objectives are met. The concept of reasonable assurance recognizes the cost of a control should not exceed the benefits likely to be derived and the valuation of costs and benefits requires estimates and judgments by management.
DRAFT
20
FINANCIAL STRUCTURE Budgetary Control Budgetary controls are maintained to ensure compliance with legal provisions embodied in the annual appropriated budget approved by the City Council. Activities of the governmental, proprietary and fiduciary funds are included in the annual appropriated budget. The budgetary level of control, the level at which expenditures cannot legally exceed the appropriated amount, is exercised at the fund level.
DRAFT
21

DEBT SERVICE Overview and Debt Financing Principles
Local governments are often faced with increasing demands for services and infrastructure improvements. These demands often exceed the corresponding revenue necessary to finance the services and improvements producing a need to finance public facilities and infrastructure. Through debt financing, the City can construct improvements in advance of or as the need arises rather than delaying projects. Debt financing more fairly distributes the costs of the improvements to the users of the project over its lifetime.
The goal of the City’s debt policy is to maintain the ability to provide high-quality essential City services and improvements in a cost-effective manner. Policy makers weigh this goal against maintaining the ability to borrow at the lowest possible rates. The City uses the following guidelines before financing projects with long term debt:
• Management staff and elected officials conservatively project the revenue sources to pay off the debt.
• The financing of the improvement will not exceed its useful life. • The benefits of the improvement must outweigh its costs, including the interest costs of
financing. • The use of long-term borrowing will be limited to capital improvement projects that cannot
be financed from current revenues. Debt will not be used to cover deficits (annual spending greater than annual revenue) or to cover short-term cash flow difficulties.
• As a non-home rule government, under Illinois law, the City is limited in issuing debt to 8.625% of the equalized assessed valuation (EAV). Additionally, the City will strive to keep the average maturity of all debt at or below fifteen years.
Outstanding Debt
The following provides a summary of the City’s outstanding debt issues. The City’s bonds have received a credit rating of “Aa2” by Moody’s Investors Service. The rating was reaffirmed on January 27, 2020.
General Obligation Bonds – The City issues general obligation bonds to provide funds for the acquisition and construction of major capital facilities. General obligation bonds have been issued for both general government and proprietary activities. In addition, general obligation bonds have been issued to refund general obligation bonds. General obligation bonds are direct obligations and pledge the full faith and credit of the City. General obligation bonds currently outstanding are as follows:
DRAFT
22

DEBT SERVICE
Description
Fund
Maturity Date
Original Amount
Outstanding Amount
(04/30/21)
Principal Payments FY 2022
2011 Refunding Bonds Electric 05-01-2021 9,935,000 630,000 630,000
2012B Refunding Bonds
Water/ Wastewater 02-01-2030 5,250,000 4,910,000 180,000
2013 Refunding Bonds Electric 05-01-2021 1,505,000 65,000 65,000
2016A Refunding Bonds (Taxable) Debt Service 12-15-2021 365,000 80,000 80,000
2016B Refunding Bonds (Taxable) Debt Service 12-15-2021 2,485,000 545,000 545,000
Total General Obligation Bonds 6,230,000 1,500,000 Special Service Area Bonds – The City also issues bonds where the City pledges property taxes from a separately created special service area. These bonds are not an obligation of the City and are secured by the levy of an annual tax on the real property within the special service area. Special service area bonds currently outstanding are as follows:
Description Maturity
Date
Original Amount
Outstanding Amount
(04/30/21)
Principal Payments FY 2022
2016 Refunding 08-01-2022 200,000 55,000 29,000 Total SSA Bonds 55,000 29,000
Loans Payable – Loans payable represents obligations to the Illinois Environmental Protection Agency for the construction of drinking water or wastewater facilities. Loans payable currently outstanding are as follows:
Description
Maturity
Date
Original Amount
Outstanding Amount
(04/30/21)
Principal Payments FY 2022
IEPA Loan (L17-1854) 06-01-2023 5,500,000 867,224 340,261 IEPA Loan (L17-2330) 12-09-2026 3,148,969 1,122,929 182,162 IEPA Loan (L17-2851) 12-03-2027 8,617,559 3,582,562 474,449 IEPA Loan (L17-2104) 07-01-2027 9,931,439 3,782,615 542,932 IEPA Loan (L17-5415) 06-20-2039 11,626,046 10,927,874 513,834
Total Notes Payable 20,283,204 2,053,638
DRAFT
23

DEBT SERVICE Vehicle Lease – The City entered into an agreement with Enterprise to lease vehicles in July 2019. The first vehicles were delivered in January 2020. The last vehicle was received in September 2020:
Description
Maturity
Date
Original Amount
Outstanding Amount
(04/30/21)
Principal Payments FY 2022
Enterprise Lease Various 594,642 482,775 102,430 Total Lease 482,775 102,430
Legal Debt Margin
The percentage of legal debt margin used measures the City’s ability to issue bonded debt. Direct bonded debt is debt for which the City has pledged its full faith and credit. The debt limit establishes a maximum dollar limitation calculated under existing law. The debt limitations provided by Illinois state statute limit the debt of the City to 8.625% of its EAV.
Legal Debt Margin
2020 Est. Equalized Assessed Valuation $1,091,592,171 Statutory Debt Limitation (8.625% of EAV) 94,149,825
General Obligation Debt: Series 2011 (1) $ 630,000 Series 2012B (1) 4,910,000 Series 2013 (1) 65,000 Series 2016A 80,000 Series 2016B 545,000 Less: Alternate Revenue Bonds (1) (5,605,000) Total Bonds 625,000
Total Applicable Debt 625,000 Legal Debt Margin $93,524,825
Notes: (1) The Series 2011 Bonds, Series 2012B Bonds, and Series 2013 Bonds are General Obligation Alternate Revenue Bonds under Illinois Statute and are not included in the computation of the legal debt margin as long as the debt service levy for such bonds are abated annually and not extended.
DRAFT
24

DEBT SERVICE
Annual Debt Service
The following table provides a summary of the City’s annual debt service requirements (principal and interest) on current debt obligations from the budget year through the final year of debt retirement. The City has never defaulted on the payment of any of its debt obligations.
Annual Debt Service Requirements
Year Principal Interest Total 2022 3,870,068 606,782 4,361,111 2023 2,594,092 515,285 2,993,638 2024 2,634,928 455,452 2,975,871 2025 2,477,510 391,542 2,798,733
2026 – 2030 9,542,606 1,074,780 10,616,400 2031 – 2040 6,002,837 479,131 6,481,968
Unused Legal Debt Margin
$93,524,825 99.3%
Total Applicable Debt
$625,000 0.7%
Legal Debt Margin
DRAFT
25

DEBT SERVICE
Effect of Debt on Current and Future Operations
The table below shows a comparison of budgeted debt service expenditures as a percentage of total City expenditures:
Debt Service as a Percentage of Total Expenditures
FY 2020 Actual
FY 2021 Projected
FY 2022 Budget
Total Expenditures 76,866,449 79,417,494 102,838,100
Debt Service Annually 5,825,506 6,229,415 4,476,850 Debt Service as a Percentage of Total Expenditures
7.6% 7.8% 4.4%
$0.0
$5.0
$10.0
$15.0
$20.0
$25.0
$30.0
Long-Term Debt Obligations(In Millions)
CapitalEquipment
SSA#1
Electric
Water
DebtService
DRAFT
26

DEBT SERVICE
Each year, the City prepares a capital improvement plan (see Capital Improvement Program Section). In preparing the plan, the City forecasts revenues and expenditures for the plan period and beyond. Part of this forecasting involves analyzing the impact of future debt service payments. The forecast indicates alternate revenue sources will provide sufficient funding of future debt service payments abating the use of property tax levies, contributions from operating funds, and minor growth in sales tax revenues.
$0.0
$20.0
$40.0
$60.0
$80.0
$100.0
FY 2020 Actual FY 2021 Projected FY 2022 Budget
Debt Service Compared to Total Expenditures (In Millions)
Total Expenditures Debt Service Annually
DRAFT
27

REVENUE SOURCES Overview of Revenues
The City of Geneva has developed a diverse base of revenues to fund its operational and capital needs. This section describes forecast methods, major revenue sources, trends, and effects on the City. Special emphasis is placed on four major revenue sources for the General Fund. Collectively, these revenues represent 73.3% of the City’s budgeted revenues within the General Fund for FY 2022. Property taxes are noted as a stand out item in this section as these revenues are recognized in several City funds (General Fund, Geneva Community Mental Health, and Debt Service Funds).
Revenue Forecast Methodology
The City of Geneva uses various sources of information to forecast revenue. This includes previous year trends, economic conditions, information from the County and Township assessors, the Illinois Municipal League, and rate studies for the Electric and Water/Wastewater Funds. Trend forecast models are used for sales tax, municipal tax, telecommunications tax, income tax, MFT tax, and electric/water sales. External economic conditions including inflation, unemployment, and interest rates are also taken into consideration when forecasting revenues.
Major Revenues
Ad Valorem Property Tax ($5,871,240)
Property taxes are collected on the assessed valuation of taxable real personal property. The City establishes a legal right to the property tax assessments upon the enactment of a tax levy ordinance by the City Council. These tax assessments are levied in December and attached as an enforceable lien on the property as of January 1 of the same year. Tax bills are prepared by Kane County around May and August of the following year and are due in June and September, respectively. Taxes are collected and remitted to the City by the County Treasurer. The 2020 property taxes are collected in 2021 and provide funding for the FY 2022 budget.
Kane County provides the Equalized Assessed Values (EAV) used in the calculation of property taxes necessary to fund the budget. Total assessed valuation in Geneva increased steadily during the early to mid-2000’s then began a steady descent after Levy Year 2009 with a slow return since Levy Year 2014. The 2020 assessed valuation of $1,091,592,171 shows an increase of $1,415,933 or 0.1% over 2019.
The tax levy rate also used to calculate property taxes, peaked in 2015 at $0.7479 per $100 of taxable assessed value and now continues a downward trend due to a decrease in required debt service payments. The estimated tax rate for 2020 is $0.496186 per $100 of taxable assessed value.
DRAFT
28

REVENUE SOURCES
Property Taxes are reflected in the General, Geneva Community Mental Health and Debt Service Funds. Budgeted FY 2022 ad valorem property taxes total $5,423,240 or 27.7% of current revenue in the General Fund. This year marks the third time in over 20 years property taxes are projected to surpass Sales Tax revenues as the largest revenue source in the General Fund. Geneva Community Mental Health and Debt Service budgeted revenues are $178,000 and $270,000, respectively.
$900.0
$1,000.0
$1,100.0
$1,200.0
2016 2017 2018 2019 2020
Equalized Assessed Valuations(In Millions)
Equalized Assessed Valuations
0.708564
0.605410 0.563163
0.566880.539798
$0.0
$0.1
$0.2
$0.3
$0.4
$0.5
$0.6
$0.7
$0.8
2016 2017 2018 2019 2020
Tax Levy Rate - Last Five Years
DRAFT
29

REVENUE SOURCES
General Fund
Fiscal Year 2022 budget revenues total $19,612,815. The four major revenue sources and their contribution to overall revenues are summarized in the charts below.
Major Revenue Summary – General Fund
Major Revenue Source Budgeted
2022 Revenue
Percent of Total Current
Revenue Property Tax Sales Tax Non-Home Rule Sales Tax State Income Tax Subtotal Major Revenue Sources Other Revenues Total Current Revenues
$5,423,240 $4,900,000 $2,154,000 $1,900,000
27.7% 25.0% 11.0%
9.7% $14,377,240 $5,235,575
73.3% 26.7%
$19,612,815 100.0%
$5.0
$5.5
$6.0
$6.5
$7.0
FY 2017 FY 2018 FY 2019 FY 2020Projected
FY 2020Projected
FY 2021Budget
FY 2022Forecast
Property Taxes Revenues(In Millions)
DRAFT
30

REVENUE SOURCES
Major Revenue Sources – Last Ten Fiscal Years
Fiscal Year
Property Tax
Sales Tax
Non-Home Rule
Sales Tax
State
Income Tax
All Other
Total Revenues
2014 4,450,945 4,666,100 - 2,094,605 4,334,903 15,546,553 2015 4,545,724 4,701,581 - 2,105,104 4,483,152 15,835,561 2016 4,640,915 4,952,394 - 2,290,774 4,465,504 16,349,587 2017 4,683,888 5,094,526 - 2,031,811 4,893,357 16,703,582 2018 4,778,699 5,066,293 - 2,244,013 5,030,922 17,119,967 2019 4,931,337 5,151,383 1,876,571 2,223,771 5,189,073 19,372,135 2020 5,073,829 4,776,660 2,070,514 2,114,785 5,158,474 19,194,262 2021
Projected
5,393,515
4,320,000
1,840,000
2,100,000
5,542,120
19,105,635 2022
Budget
5,423,240
4,900,000
2,154,000
1,900,000
5,235,575
19,612,815 2023
Forecast
5,423,240
4,925,000
2,159,000
1,900,000
6,578,190
20,985,430
Property Tax$5.4
27.6%
Sales Tax$4.9
25.0%
Non-Home Rule Sales Tax$2.2
11.2%
State Income Tax$1.9
9.7%
Other Revenues$5.2
26.6%
Major Revenue Sources - General Fund(In Millions)
DRAFT
31

REVENUE SOURCES
Sales Tax ($4,900,000)
The second-largest source of revenue for the City’s General Fund is from local Sales taxes. Retail Sales Tax of 8.0% is collected by the State, effective July 1, 2018. Sales tax is remitted to the City three months after the liability occurs. The City currently receives 2.0% of the revenues collected. Of the total sales tax revenue received, 1.5% is unrestricted and recorded in the General Fund while the remaining 0.5% is restricted for infrastructure projects and is recorded in the Infrastructure Capital Projects Fund. This figure represents approximately 25.0% of the total revenue in the General Fund.
$0.0
$5.0
$10.0
$15.0
$20.0
$25.0
FY 2014 FY 2015 FY 2016 FY 2017 FY 2018 FY 2019 FY 2020 FY 2021Projected
FY 2022Budget
FY 2023Forecast
Major Revenue Sources - Last Ten Fiscal Years(In Millions)
Property Tax Sales Tax Non-Home Rule Sales Tax State Income Tax All OthtersDRAFT
32
REVENUE SOURCES
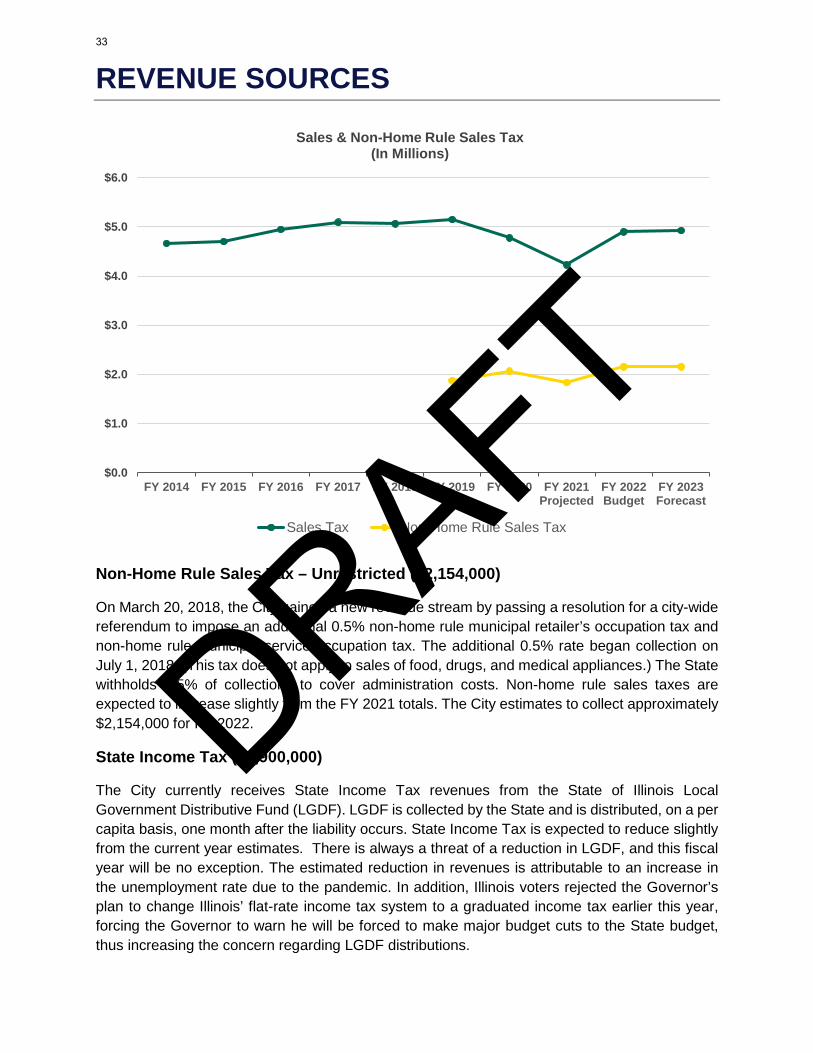
Non-Home Rule Sales Tax – Unrestricted ($2,154,000)
On March 20, 2018, the City gained a new revenue stream by passing a resolution for a city-wide referendum to impose an additional 0.5% non-home rule municipal retailer’s occupation tax and non-home rule municipal service occupation tax. The additional 0.5% rate began collection on July 1, 2018. (This tax does not apply to sales of food, drugs, and medical appliances.) The State withholds 1.5% of collections to cover administration costs. Non-home rule sales taxes are expected to increase slightly from the FY 2021 totals. The City estimates to collect approximately $2,154,000 for FY 2022.
State Income Tax ($1,900,000)
The City currently receives State Income Tax revenues from the State of Illinois Local Government Distributive Fund (LGDF). LGDF is collected by the State and is distributed, on a per capita basis, one month after the liability occurs. State Income Tax is expected to reduce slightly from the current year estimates. There is always a threat of a reduction in LGDF, and this fiscal year will be no exception. The estimated reduction in revenues is attributable to an increase in the unemployment rate due to the pandemic. In addition, Illinois voters rejected the Governor’s plan to change Illinois’ flat-rate income tax system to a graduated income tax earlier this year, forcing the Governor to warn he will be forced to make major budget cuts to the State budget, thus increasing the concern regarding LGDF distributions.
$0.0
$1.0
$2.0
$3.0
$4.0
$5.0
$6.0
FY 2014 FY 2015 FY 2016 FY 2017 FY 2018 FY 2019 FY 2020 FY 2021Projected
FY 2022Budget
FY 2023Forecast
Sales & Non-Home Rule Sales Tax(In Millions)
Sales Tax Non-Home Rule Sales Tax
DRAFT
33

REVENUE SOURCES
Other Revenue Sources
Motor Fuel Tax ($760,000)
The Illinois Motor Fuel Tax (MFT) Fund is derived from a tax on the privilege of operating motor vehicles upon public highways and of operating recreational watercraft upon the waters of the State, based upon the consumption of motor fuel. The Department of Transportation allocates this money according to the MFT Fund Distribution statute (35 ILCS 505/8) and initiates the process for distribution of motor fuel tax to the counties, townships, and municipalities. Effective July 1, 2019, the State of Illinois doubled the motor fuel tax rate for all unleaded gas purchases.
The FY 2021 projection is $765,000. The FY 2022 budget estimates $760,000 in MFT revenues to be recorded in the MFT Special Revenue Fund. The City will use these funds towards the street improvement program.
$0.0
$0.5
$1.0
$1.5
$2.0
$2.5
FY 2014 FY 2015 FY 2016 FY 2017 FY 2018 FY 2019 FY 2020 FY 2021Projected
FY 2022Budget
FY 2023Forecast
State Income Tax(In Millions)
DRAFT
34

REVENUE SOURCES
Non-Home Rule Sales Tax – Restricted ($2,154,000)
The 0.5% non-home rule sales tax was instituted by referendum in 2007 and is restricted to “Infrastructure” related capital projects and recorded in the Infrastructure Capital Projects Fund. This tax does not apply to sales of food, drugs, and medical appliances; therefore, it is not exactly half of the Sales Tax. The State withholds 1.5% of the collections to cover administration costs. Non-home rule sales taxes are expected to increase due to the improving economy and an increase in e-commerce transactions.
$0.0
$0.2
$0.4
$0.6
$0.8
$1.0
FY 2014 FY 2015 FY 2016 FY 2017 FY 2018 FY 2019 FY 2020 FY 2021Projected
FY 2022Budget
FY 2023Forecast
Motor Fuel Tax(In Millions)
$0.0
$0.5
$1.0
$1.5
$2.0
$2.5
FY 2014 FY 2015 FY 2016 FY 2017 FY 2018 FY 2019 FY 2020 FY 2021Projected
FY 2022Budget
FY 2023Forecast
Non-Home Rule Sales Tax(In Millions)
DRAFT
35

REVENUE SOURCES Electric Sales ($36,340,680)
Electric revenues are based on a Class Cost of Service rate structure developed to assure each rate class pays its fair share of the utility’s cost of providing reliable electric service to the community. Geneva’s rates contain a Power Cost Adjustment (PCA) factor, which accounts for variations in the cost of electricity to the utility. Geneva utilizes a third party to conduct Class Cost of Service Studies and make rate recommendations with the last two recommendations made in FY 2014 and FY 2020. The results of these studies have shown the utility rates continue to recover the utility’s projected costs to provide electric service. Therefore, rate adjustment recommendations from these studies have been revenue-neutral to the utility. The City is a partner in the Northern Illinois Municipal Power Agency (NIMPA), which owns part of a coal-fired generating facility in southern Illinois. The City also generates power during peak demand time via the Geneva Generating Facility (GGF), a behind-the-meter natural gas-fired generating station, thereby limiting exposure to seasonal energy and capacity cost market fluctuations. As market costs vary, the PCA factor correspondingly adjusts revenues. The FY 2022 budget of $36,340,680 is based on a flat market expectation and budgeted five percent decrease in NIMPA power supply costs.
$0.0
$10.0
$20.0
$30.0
$40.0
$50.0
FY 2014 FY 2015 FY 2016 FY 2017 FY 2018 FY 2019 FY 2020 FY 2021Projected
FY 2022Budget
FY 2023Forecast
Electric Sales Revenue(In Millions)
DRAFT
36

REVENUE SOURCES Water Sales ($6,123,000)
Water revenues are based on the number of cubic feet used by individual homes and businesses. Water rates are developed to recover the cost of providing potable water to the City users. The City pumps water from underground wells and treats it through a reverse osmosis system at the Water Treatment Plant. Water consumption has been steadily increasing over the past several years and a rate restructuring in 2015 has provided a fixed component that is independent of usage. The FY 2022 budget of $6,123,000 is flat from the FY 2021 projected.
Sewer Sales ($3,736,500)
Sewer sales are largely based on water consumption and have generally followed the same trends. The FY 2022 budget of $3,736,500 is consistent with FY 2021 projected.
$0.0
$1.0
$2.0
$3.0
$4.0
$5.0
$6.0
$7.0
FY 2014 FY 2015 FY 2016 FY 2017 FY 2018 FY 2019 FY 2020 FY 2021Projected
FY 2022Budget
FY 2023Forecast
Water and Sewer Sales Revenue(In Millions)
Water Sales Sewer SalesDRAFT
37

TYPICAL TAX BILL Market Value of Home: Estimated Tax Levy Rate:
$350,000 $0.539798
Annual Tax Liability for City Services: $629.70 To calculate the annual tax bill, multiply the assessed valuation by the tax levy rate and divide the result by 100. $116,655 X 0.539798 = $62,970.13; $62,970.13÷ 100 = $629.70
Assessed Valuation:
$116,655
Monthly Expenses for City Services: $52.22 To determine the monthly tax expenses for City services, divide the tax liability by 12 months: $626.70÷ 12 = $52.22
To determine assessed valuation, multiply Market value by 33.33%: 350,000 X 33.33% = $116,655
City of Geneva property owners pay property taxes which generate revenue used to operate the City, schools, parks, libraries and township road districts. The City must comply with the Property Tax Extension Limitation Law which caps increases in property tax extensions for non-home rule taxing districts. Increases in tax extensions are limited to the lesser of 5.0% or the Consumer Price Index (CPI) for the year preceding the levy year. This limit slows the growth of property tax revenues to taxing districts when property values and assessments are increasing faster than the rate of inflation. A common misconception is all property tax dollars go to the City; the City’s portion of a resident’s total tax bill is approximately __%. The chart below illustrates the breakdown of a typical residential tax bill.
County$0.05
Forest Preserve$0.02
Township<$0.01
City$0.0__
School District$0.69 Waubonsee
College$0.06
Park District$0.06
Library$0.05DRAFT
38

.
2018-2019 2019-2020 2020-2021 2020-2021 2021-2022 2022-2023Fund Actual Actual Budget Projected Budget Forecast
Revenues and Other Financing Sources
General 19,372,148$ 19,194,262$ 19,965,890$ 19,105,635$ 19,612,815$ 20,980,430$
Special Revenue Funds Motor Fuel Tax 558,868 815,692 840,000 1,240,005 1,234,605 1,234,605 Cultural Arts Commission 21,981 9,886 42,410 15 40,265 40,015 SPAC 10,536 8,568 15,330 8,850 16,270 16,270 Beautification 8,312 8,890 15,000 2,650 15,375 15,025 Tourism 259,678 260,102 395,115 140,075 191,350 356,120 Restricted Police Fines 34,001 32,452 29,720 35,500 35,500 35,500 PEG 34,611 34,670 39,500 31,500 30,600 29,600 Mental Health 154,835 155,826 178,600 178,200 179,775 179,775 Foreign Fire Insurance 54,751 56,215 54,505 59,685 62,510 62,510 SSA #1 281,476 272,430 299,625 215,185 312,280 281,665 SSA #4 (Randall Square) 19,324 19,579 34,620 19,450 34,905 35,400 SSA #5 (Williamsburg) 9,122 9,198 9,150 9,330 32,025 10,240 SSA #7 (Blackberry) 3,035 3,062 3,035 2,945 3,555 3,695 SSA #9 (Geneva Knolls) 3,340 3,347 3,340 3,315 7,685 3,355 SSA #11 (Eagle Brook) 55,842 57,427 59,040 56,100 99,040 59,040 SSA #16 (Fisher Farms) 155,600 156,394 155,400 154,600 154,600 154,600 SSA #18 (Wildwood) 3,272 3,336 3,270 3,270 5,865 3,270 SSA #23 (Sunset Meadows) 1,216 1,221 1,160 1,130 8,795 1,885 SSA #26 (Westhaven) 7,450 7,574 7,490 7,835 27,365 8,555 SSA #32 (On Brentwood's Pond) 3,001 3,100 3,185 3,190 3,280 3,375
1,680,252 1,918,969 2,189,495 2,172,830 2,495,645 2,534,500
Debt Service Funds Debt Service 2,027,180 670,848 704,800 703,640 650,300 -
2,027,180 670,848 704,800 703,640 650,300 -
Capital Projects Funds General Capital Projects 153,791 74,919 767,300 83,405 201,000 215,000 Infrastructure Capital Projects 2,328,811 2,495,497 3,880,565 2,003,000 3,331,600 2,725,000 Prairie Green 689,335 32,221 424,615 66,360 419,615 67,500 TIF #2 257,567 274,144 357,125 255,000 1,540,765 379,810 TIF #3 43,529 62,831 330,230 107,000 871,240 219,445 Capital Equipment 1,423,951 1,153,181 2,087,310 82,235 2,396,815 1,951,675
4,896,983 4,092,793 7,847,145 2,597,000 8,761,035 5,558,430
Enterprise Funds Electric 37,970,083 36,094,600 54,304,830 36,734,625 51,620,110 41,050,450 Water/Wastewater 21,048,785 13,681,027 15,746,590 10,597,065 14,231,180 14,404,395 Refuse 528,068 541,525 612,230 546,580 546,580 548,580 Cemetery 79,814 61,102 86,450 70,875 72,400 71,150 Commuter Parking 647,062 655,957 997,470 10,000 590,480 623,750
60,273,811 51,034,211 71,747,570 47,959,145 67,060,750 56,698,325
Internal Service Funds Group Dental Insurance 179,260 178,345 195,040 182,350 196,830 196,830 Workers' Compensation 505,437 824,076 895,855 793,335 852,135 893,855
684,697 1,002,421 1,090,895 975,685 1,048,965 1,090,685
Trust and Agency Funds Police Pension 3,229,067 2,105,076 3,377,020 6,490,300 3,387,400 3,387,400 Fire Pension 921,160 (162,380) 1,919,450 1,919,450 1,934,275 1,941,125
4,150,227 1,942,696 5,296,470 8,409,750 5,321,675 5,328,525
Total Revenues 93,085,299$ 79,856,200$ 108,842,265$ 81,923,685$ 104,951,185$ 92,190,895$
CITY OF GENEVA, ILLINOISBudget Summary - Total by Fund
Fiscal Year Ending April 30, 2022 & 2023
DRAFT
39
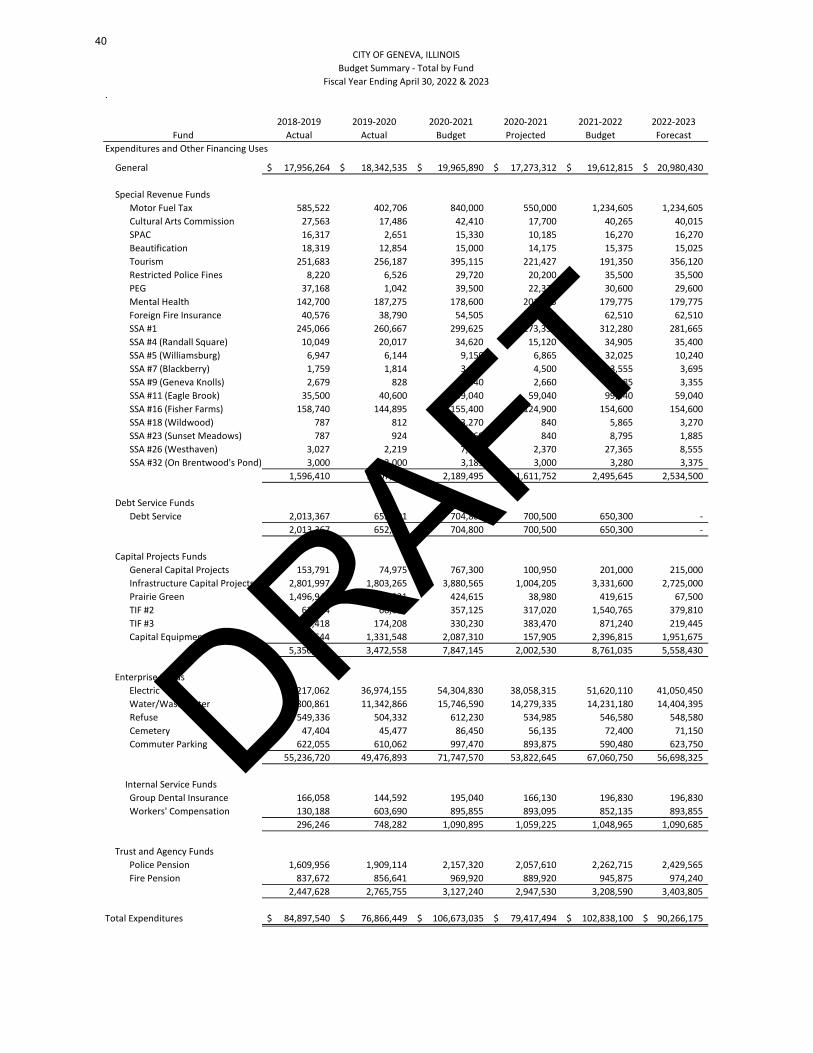
.
2018-2019 2019-2020 2020-2021 2020-2021 2021-2022 2022-2023Fund Actual Actual Budget Projected Budget Forecast
CITY OF GENEVA, ILLINOISBudget Summary - Total by Fund
Fiscal Year Ending April 30, 2022 & 2023
Expenditures and Other Financing Uses
General 17,956,264$ 18,342,535$ 19,965,890$ 17,273,312$ 19,612,815$ 20,980,430$
Special Revenue Funds Motor Fuel Tax 585,522 402,706 840,000 550,000 1,234,605 1,234,605 Cultural Arts Commission 27,563 17,486 42,410 17,700 40,265 40,015 SPAC 16,317 2,651 15,330 10,185 16,270 16,270 Beautification 18,319 12,854 15,000 14,175 15,375 15,025 Tourism 251,683 256,187 395,115 221,427 191,350 356,120 Restricted Police Fines 8,220 6,526 29,720 20,200 35,500 35,500 PEG 37,168 1,042 39,500 22,320 30,600 29,600 Mental Health 142,700 187,275 178,600 201,775 179,775 179,775 Foreign Fire Insurance 40,576 38,790 54,505 60,505 62,510 62,510 SSA #1 245,066 260,667 299,625 273,330 312,280 281,665 SSA #4 (Randall Square) 10,049 20,017 34,620 15,120 34,905 35,400 SSA #5 (Williamsburg) 6,947 6,144 9,150 6,865 32,025 10,240 SSA #7 (Blackberry) 1,759 1,814 3,035 4,500 3,555 3,695 SSA #9 (Geneva Knolls) 2,679 828 3,340 2,660 7,685 3,355 SSA #11 (Eagle Brook) 35,500 40,600 59,040 59,040 99,040 59,040 SSA #16 (Fisher Farms) 158,740 144,895 155,400 124,900 154,600 154,600 SSA #18 (Wildwood) 787 812 3,270 840 5,865 3,270 SSA #23 (Sunset Meadows) 787 924 1,160 840 8,795 1,885 SSA #26 (Westhaven) 3,027 2,219 7,490 2,370 27,365 8,555 SSA #32 (On Brentwood's Pond) 3,000 3,000 3,185 3,000 3,280 3,375
1,596,410 1,407,435 2,189,495 1,611,752 2,495,645 2,534,500
Debt Service Funds Debt Service 2,013,367 652,991 704,800 700,500 650,300 -
2,013,367 652,991 704,800 700,500 650,300 -
Capital Projects Funds General Capital Projects 153,791 74,975 767,300 100,950 201,000 215,000 Infrastructure Capital Projects 2,801,997 1,803,265 3,880,565 1,004,205 3,331,600 2,725,000 Prairie Green 1,496,942 21,931 424,615 38,980 419,615 67,500 TIF #2 62,114 66,630 357,125 317,020 1,540,765 379,810 TIF #3 67,418 174,208 330,230 383,470 871,240 219,445 Capital Equipment 768,644 1,331,548 2,087,310 157,905 2,396,815 1,951,675
5,350,905 3,472,558 7,847,145 2,002,530 8,761,035 5,558,430
Enterprise Funds Electric 37,217,062 36,974,155 54,304,830 38,058,315 51,620,110 41,050,450 Water/Wastewater 16,800,861 11,342,866 15,746,590 14,279,335 14,231,180 14,404,395 Refuse 549,336 504,332 612,230 534,985 546,580 548,580 Cemetery 47,404 45,477 86,450 56,135 72,400 71,150 Commuter Parking 622,055 610,062 997,470 893,875 590,480 623,750
55,236,720 49,476,893 71,747,570 53,822,645 67,060,750 56,698,325
Internal Service Funds Group Dental Insurance 166,058 144,592 195,040 166,130 196,830 196,830 Workers' Compensation 130,188 603,690 895,855 893,095 852,135 893,855
296,246 748,282 1,090,895 1,059,225 1,048,965 1,090,685
Trust and Agency Funds Police Pension 1,609,956 1,909,114 2,157,320 2,057,610 2,262,715 2,429,565 Fire Pension 837,672 856,641 969,920 889,920 945,875 974,240
2,447,628 2,765,755 3,127,240 2,947,530 3,208,590 3,403,805
Total Expenditures 84,897,540$ 76,866,449$ 106,673,035$ 79,417,494$ 102,838,100$ 90,266,175$
DRAFT
40

Special Debt Service Capital Projects Enterprise Internal PensionGeneral Revenue Funds Fund Funds Funds Service Trust Funds Total
Revenues and Other Financing Sources
Taxes 9,422,265$ 908,780$ 270,000$ 2,499,000$ -$ -$ -$ 13,100,045$ Licenses - - - - - - - - Permits 379,200 - - - - - - 379,200 Intergovernmental Revenues 7,806,710 1,232,205 - - - - - 9,038,915 Fines and Forfeits 174,200 51,640 - - 530,000 - - 755,840 Service Charges - 1,820 - - 47,015,825 - - 47,017,645 Service Fees 646,525 2,500 - 5,000 278,220 1,042,400 - 1,974,645 Other Revenues 429,500 38,660 2,200 1,777,710 542,895 1,000 5,321,675 8,113,640 Other Financing Sources 754,415 260,040 378,100 4,479,325 18,693,810 5,565 - 24,571,255
Total Revenues 19,612,815$ 2,495,645$ 650,300$ 8,761,035$ 67,060,750$ 1,048,965$ 5,321,675$ 104,951,185$
Expenditures and Other Financing Uses
Personal Services 16,460,984$ 237,476$ -$ 122,348$ 7,194,741$ -$ 2,980,850$ 26,996,399$ Contractual Services 1,922,576 553,064 - 930,082 32,131,959 1,023,315 227,740 36,788,736 Commodities 812,335 102,020 - - 897,010 - - 1,811,365 Debt Service - 30,335 650,300 67,800 3,543,400 - - 4,291,835 Capital Outlay - 75,000 - 7,625,805 17,943,640 - - 25,644,445 Other Expenditures (536,830) 735,250 - 15,000 5,333,770 - - 5,547,190 Other Financing Uses 953,750 762,500 - - 16,230 25,650 - 1,758,130
Total Expenditures/Expenses 19,612,815$ 2,495,645$ 650,300$ 8,761,035$ 67,060,750$ 1,048,965$ 3,208,590$ 102,838,100$
CITY OF GENEVA, ILLINOISBudget Summary - Total by Category and Fund
Fiscal Year Ending April 30, 2022
DRAFT
41

Special Debt Service Capital Projects Enterprise Internal Pension
General Revenue Funds Fund Fund Funds Service Trust Funds Total
Expenditures and Other Financing Uses
Legislative 140,732$ 251,685$ -$ -$ -$ -$ -$ 392,417$ City Administrator's Office 249,193 - - - - - - 249,193 Administrative Services 2,056,860 60,935 650,300 - 400,000 1,048,965 - 4,217,060 Community Development 1,127,352 377,115 - 419,615 - - - 1,924,082 Economic Development 129,005 191,350 - 2,412,005 - - - 2,732,360 Police Department 8,075,896 75,953 - - 61,320 - 2,262,715 10,475,884 Fire Department 5,367,913 62,510 - - - - 945,875 6,376,298 Public Works 2,465,864 1,476,097 - 5,929,415 66,599,430 - - 76,470,806
Total Expenditures/Expenses 19,612,815$ 2,495,645$ 650,300$ 8,761,035$ 67,060,750$ 1,048,965$ 3,208,590$ 102,838,100$
CITY OF GENEVA, ILLINOISBudget Summary - Total by Department and Fund
Fiscal Year Ending April 30, 2022
DRAFT
42

2018-2019 2019-2020 2020-2021 2020-2021 2021-2022 2022-2023Account Description Actual Actual Budget Projected Budget Forecast
Revenues and Other Financing Sources
410 Property Tax 4,931,337$ 5,073,829$ 5,173,240$ 5,393,515$ 5,423,240$ 5,423,240$ 412 Simplified Telecommunications Tax 791,992 623,783 760,000 490,000 465,000 440,000 413 Municipal Utility Tax 1,339,033 1,273,532 1,315,000 1,140,000 1,310,000 1,310,000 415 Township Fire Tax 75,724 77,754 70,000 78,505 70,000 70,000 416 Auto Rental Tax 47 38 50 25 25 25 419 Non-Home Rule Sales Tax 1,876,571 2,070,514 2,200,000 1,840,000 2,154,000 2,159,000
Total Taxes 9,014,704 9,119,449 9,518,290 8,942,045 9,422,265 9,402,265
420 Business Licenses 193,225 194,065 190,950 20,950 - 190,900 Total Licenses 193,225 194,065 190,950 20,950 - 190,900
430 Building Permits 468,866 330,190 430,400 320,200 366,200 366,200 431 Sign Permits 10,310 8,700 10,000 8,500 10,000 10,000 433 Overweight Permits 2,290 3,230 3,000 3,000 3,000 3,000
Total Permits 481,466 342,120 443,400 331,700 379,200 379,200
440 Sales Tax 5,151,383 4,776,660 5,100,000 4,230,000 4,900,000 4,925,000 442 State Income Tax 2,223,771 2,114,785 2,200,000 2,100,000 1,900,000 1,900,000 443 Replacement Tax 84,451 111,185 85,000 94,500 83,000 83,000 444 Local Use Tax 662,906 768,270 600,000 775,000 825,000 825,000 446 Reimbursements 91,133 87,173 95,100 90,500 95,950 98,775 447 Federal Grants 2,288 968 - 2,760 2,760 2,760 448 State/Local Grants 2,423 2,793 800 1,283,595 - -
Total Intergovernmental Revenues 8,218,355 7,861,834 8,080,900 8,576,355 7,806,710 7,834,535
450 Circuit Court Fines 112,762 156,727 110,000 125,000 125,000 125,000 451 Parking Violations 38,260 33,486 35,000 5,000 8,700 26,000 453 Ordinance Fines 34,770 19,735 35,000 30,000 30,000 30,000 454 False Alarm Fines 7,700 6,933 7,500 8,000 8,000 8,000 456 Compliance Fines 2,100 3,450 2,500 2,000 2,000 2,000 459 Civil Law Violations 1,825 50 1,500 1,000 500 500
Total Fines & Forfeits 197,417 220,382 191,500 171,000 174,200 191,500
471 General Government Fees 413,355 399,985 407,750 377,810 362,800 352,800 472 Community Development Fees 141,892 121,488 141,500 131,500 131,500 131,500 473 Public Safety Fees 199,303 181,180 160,325 127,225 152,225 152,225
Total Service Fees 754,550 702,653 709,575 636,535 646,525 636,525
481 Interest Income 112,854 122,784 95,000 23,000 23,000 23,000 482 Rental Income 184,343 162,478 195,000 195,000 201,500 201,500 483 Insurance & Property Damage 717 3,421 - 1,050 - - 484 Sale of Capital Assets - 261,413 - - - - 485 Reimbursed Expenditures 202,927 190,106 195,000 195,000 195,000 195,000 486 Donations 2,660 - - 3,000 - - 489 Miscellaneous 8,933 13,557 10,000 10,000 10,000 10,000
Total Other Revenues 512,432 753,759 495,000 427,050 429,500 429,500
499 Reappropriation - - 336,275 - 754,415 1,916,005 Total Other Financing Sources - - 336,275 - 754,415 1,916,005
Total Revenues and Other Financing Sources 19,372,148$ 19,194,262$ 19,965,890$ 19,105,635$ 19,612,815$ 20,980,430$
Expenditures and Other Financing Uses
501 Wages - Regular 8,643,329$ 8,833,182$ 9,100,802$ 8,733,072$ 9,384,366$ 9,537,812$ 502 Wages - Part-Time/Seasonal 168,581 161,168 209,623 111,915 184,164 178,277 503 Overtime 758,126 635,473 697,215 491,620 693,545 693,545 504 Stand-By 93,401 86,924 98,650 102,340 96,400 96,400 506 Wages - Meetings 4,641 4,752 9,720 3,225 5,000 5,000 513 POC Holiday 5,502 4,336 13,080 2,060 6,000 6,000 514 Overnight Duty 333,409 300,081 416,800 260,205 375,000 375,000 515 Still Alarms 35,375 39,098 36,000 27,845 36,000 36,000 516 Training 16,292 9,379 14,400 3,520 14,400 14,400
CITY OF GENEVA, ILLINOISBudget Summary by Account
Fiscal Year Ending April 30, 2022 & 2023
Fund 100 - General Fund
DRAFT
43

2018-2019 2019-2020 2020-2021 2020-2021 2021-2022 2022-2023Account Description Actual Actual Budget Projected Budget Forecast
CITY OF GENEVA, ILLINOISBudget Summary by Account
Fiscal Year Ending April 30, 2022 & 2023
Fund 100 - General Fund
521 Group Insurance 1,883,519 2,074,684 2,267,436 2,114,890 2,305,256 2,312,027 522 Medicare 140,296 140,822 153,619 133,140 156,519 159,374 523 Social Security 225,257 224,519 232,354 202,445 247,839 252,928 524 IMRF 348,157 330,852 391,001 349,465 394,420 391,292 525 Police/Fire Pension 1,959,085 2,562,075 2,562,075 2,562,075 2,562,075 2,562,075 528 Unemployment Compensation 2,097 - - - - -
Total Personnel Services 14,617,068 15,407,347 16,202,775 15,097,817 16,460,984 16,620,130
531 Maintenance Service 253,938 277,767 298,665 307,640 297,810 300,895 541 Accounting & Auditing Service 31,165 23,287 30,285 31,550 22,085 27,075 542 Engineering Service 25,048 22,499 20,000 22,500 20,000 20,000 543 Legal Service 143,224 165,871 120,000 150,000 147,000 150,000 544 Medical Services 25,137 13,358 24,650 22,185 23,060 22,890 546 Janitorial Service 56,097 56,107 56,400 56,260 56,400 56,400 547 Banking Service 6,457 7,878 8,000 9,000 9,000 9,000 550 Collection Service - 35 250 50 250 250 551 Advertising 100 - - - - - 552 Data Programming Service - 2,084 1,500 2,085 1,500 1,500 559 Other Professional Services 45,442 48,147 86,135 61,500 69,445 81,445 561 Postage 8,467 8,052 7,365 6,720 7,275 7,275 562 Telephone 64,055 71,097 62,790 72,880 68,730 67,495 563 Publishing 13,204 14,245 14,995 13,195 14,700 14,700 564 Printing 9,990 8,629 13,147 9,270 12,055 10,555 565 Internet 3,427 2,417 2,680 2,680 2,680 2,680 566 Recording Fees 4,235 1,739 3,350 2,610 3,000 3,000 571 Dues & Subscriptions 36,221 38,437 37,763 49,260 51,280 51,280 572 Travel & Meals 10,207 7,369 17,105 6,095 21,515 16,065 573 Training & Professional Development 46,509 43,785 71,680 53,430 69,545 70,935 575 Publications 143 738 825 830 930 930 581 Utilities 10,551 13,005 12,195 12,255 12,315 12,315 582 Street Lighting 538 443 600 600 600 600 584 Landfill Charges 566 3,160 2,000 2,000 2,000 2,000 587 Mosquito Abatement 48,294 49,548 60,000 60,000 60,000 60,000 592 General Insurance 104,601 126,492 220,500 200,500 200,501 200,500 595 Rentals 25,156 23,721 26,325 26,190 27,325 27,265 596 Public Transportation 14,946 13,290 30,000 30,000 30,000 30,000 597 Tri-City Ambulance/Tri-Com 527,083 452,611 484,870 482,785 488,970 488,970 599 Other Contractual Services 130,086 131,077 179,125 157,285 202,605 212,605
Total Contractual Services 1,644,885 1,626,891 1,893,200 1,851,355 1,922,576 1,948,625
601 Maintenance Supplies 372,430 187,290 396,150 388,705 393,650 426,350 621 Office Supplies 19,647 19,214 24,805 22,905 24,330 24,330 622 Office Equipment 8,009 4,616 14,950 10,450 9,200 8,900 623 Office Furniture 2,268 1,079 7,300 2,500 6,500 3,200 624 Operating Supplies 46,067 38,993 72,510 70,920 72,410 72,610 625 Small Tools 4,231 4,232 18,500 16,950 18,500 18,500 626 Janitorial Supplies 3,213 4,692 4,450 4,390 4,450 4,450 627 Motor Fuel & Lubricants 116,061 115,626 143,810 116,400 116,705 116,705 630 Ammunition 4,372 8,557 10,750 10,750 10,750 10,750 631 Clothing 80,279 66,561 80,635 77,785 92,735 80,535 632 Per Copy Charges 8,816 8,671 8,340 7,925 8,440 8,440 641 Books 1,369 659 2,200 1,655 1,700 1,700 642 Periodicals 207 187 350 350 350 350 663 Computer Software 21,637 42,353 50,110 41,660 52,615 52,615
Total Commodities 688,606 502,732 834,860 773,345 812,335 829,435
910 Capitalized Assets (585,522) (402,706) (550,000) (550,000) (550,000) (550,000) 912 Bad Debt (4,221) 1,631 5,000 5,000 5,000 5,000 913 Community Relations 545 975 1,830 755 1,375 1,530 914 State/Federal Permit Fees 500 500 500 500 500 500 916 Property Taxes 60,611 2,714 1,250 2,210 500 - 917 Employee Awards 5,859 5,032 5,675 5,425 5,795 5,095
Total Other Expenditures (522,227) (391,854) (535,745) (536,110) (536,830) (537,875)
DRAFT
44

2018-2019 2019-2020 2020-2021 2020-2021 2021-2022 2022-2023Account Description Actual Actual Budget Projected Budget Forecast
CITY OF GENEVA, ILLINOISBudget Summary by Account
Fiscal Year Ending April 30, 2022 & 2023
Fund 100 - General Fund
951.17 Interfund Transfers Out - SPAC 3,500 3,500 3,500 3,500 3,500 3,500 951.18 Interfund Transfers Out Beautification - - - - - - 951.41 Interfund Transfers Out - Gen Capital Proj. 153,790 74,919 767,300 83,405 201,000 215,000 951.42 Interfund Transfers Out Infrastructure Cap. - - - - - - 951.44 Interfund Transfers Out - Capital Equip 1,370,642 857,840 800,000 - 749,250 1,901,615 951.63 Interfund Transfers Out - Water Fund - 261,160 - - - -
Total Other Financing Uses 1,527,932 1,197,419 1,570,800 86,905 953,750 2,120,115
Total Expenditures and Other Financing Uses 17,956,264$ 18,342,535$ 19,965,890$ 17,273,312$ 19,612,815$ 20,980,430$
DRAFT
45

2018-2019 2019-2020 2020-2021 2020-2021 2021-2022 2022-2023Description Actual Actual Budget Projected Budget Forecast
10 Legislative 108,841$ 99,587$ 131,197$ 103,420$ 140,732$ 129,397$ 30 City Administrator's Office 207,961 213,898 246,237 210,265 249,193 251,615 40 Administrative Services 2,303,517 1,960,955 2,401,871 880,285 1,795,491 2,977,010
40.44 Finance 239,056 242,186 263,369 254,016 261,370 270,470 50 Community Development 1,014,313 1,032,467 1,139,738 1,019,020 1,127,352 1,142,330 60 Economic Development 102,827 111,115 137,111 96,625 129,005 125,641 70 Police 7,279,046 7,624,826 7,964,522 7,505,296 8,075,896 8,211,924 80 Fire 4,609,231 4,957,657 5,266,833 5,020,460 5,367,913 5,344,922 90 Pubic Works 2,091,471 2,099,846 2,415,012 2,183,925 2,465,863 2,527,121
Total General Fund 17,956,264 18,342,535 19,965,890 17,273,312 19,612,815 20,980,430
CITY OF GENEVA, ILLINOISExpenditure Budget Summary by Department
Fiscal Year Ending April 30, 2022 & 2023
Fund 100 - General Fund
DRAFT
46

2018-2019 2019-2020 2020-2021 2020-2021 2021-2022 2022-2023Description Actual Actual Budget Projected Budget Forecast
10 LegislativePersonnel Services 69,031$ 69,024$ 72,947$ 68,805$ 73,857$ 72,947$ Contractual Services 38,252 28,983 54,550 33,415 63,325 53,350 Commodities 1,131 760 2,700 700 2,550 2,100 Other Expenditures 427 820 1,000 500 1,000 1,000 Total 108,841 99,587 131,197 103,420 140,732 129,397
30 City AdministratorPersonnel Services 185,218 188,736 201,972 174,515 205,893 210,015 Contractual Services 21,657 23,747 39,815 33,750 39,500 39,500 Commodities 1,086 1,415 4,300 2,000 3,800 2,100 Other Expenditures - - 150 - - - Total 207,961 213,898 246,237 210,265 249,193 251,615
40 Administrative ServicesPersonnel Services 357,909 356,456 371,141 315,035 352,065 362,390 Contractual Services 349,269 396,711 445,650 463,810 474,621 479,950 Commodities 7,596 7,154 11,830 11,325 13,355 13,355 Other Expenditures 60,811 3,214 2,450 3,210 1,700 1,200 Other Financing Uses 1,527,932 1,197,419 1,570,800 86,905 953,750 2,120,115 Total 2,303,517 1,960,955 2,401,871 880,285 1,795,491 2,977,010
40.44 FinancePersonnel Services 194,764 199,576 207,384 197,421 214,615 218,435 Contractual Services 47,157 38,915 48,485 50,045 40,105 45,235 Commodities 1,357 1,815 2,450 1,500 1,400 1,800 Other Expenditures (4,221) 1,881 5,050 5,050 5,250 5,000 Total 239,056 242,186 263,369 254,016 261,370 270,470
50 Community DevelopmentPersonnel Services 832,490 874,512 894,283 816,405 880,627 897,285 Contractual Services 170,733 148,583 230,280 187,910 231,305 229,720 Commodities 10,593 9,217 14,745 14,350 14,895 14,895 Other Expenditures 497 155 430 355 525 430 Total 1,014,313 1,032,467 1,139,738 1,019,020 1,127,352 1,142,330
60 Economic DevelopmentPersonnel Services 93,282 99,204 108,326 79,565 105,360 103,791 Contractual Services 8,706 11,002 24,485 15,860 20,295 20,150 Commodities 770 859 3,800 1,200 3,100 1,500 Other Expenditures 70 50 500 - 250 200 Total 102,827 111,115 137,111 96,625 129,005 125,641
70 PolicePersonnel Services 6,706,219 7,065,880 7,370,722 6,937,126 7,499,001 7,613,579 Contractual Services 451,525 402,937 403,345 404,320 408,670 430,470 Commodities 118,010 154,012 188,280 161,675 166,130 165,880 Other Expenditures 3,293 1,997 2,175 2,175 2,095 1,995 Total 7,279,046 7,624,826 7,964,522 7,505,296 8,075,896 8,211,924
80 FirePersonnel Services 4,169,397 4,548,470 4,801,868 4,537,800 4,900,388 4,883,397 Contractual Services 337,005 345,116 368,005 389,135 363,335 369,335 Commodities 101,614 62,986 95,760 92,325 102,990 90,990 Other Expenditures 1,216 1,085 1,200 1,200 1,200 1,200 Total 4,609,231 4,957,657 5,266,833 5,020,460 5,367,913 5,344,922
CITY OF GENEVA, ILLINOISExpenditure Budget Summary by Department & Classification
Fiscal Year Ending April 30, 2022 & 2023
Fund 100 - General Fund
DRAFT
47

2018-2019 2019-2020 2020-2021 2020-2021 2021-2022 2022-2023Description Actual Actual Budget Projected Budget Forecast
CITY OF GENEVA, ILLINOISExpenditure Budget Summary by Department & Classification
Fiscal Year Ending April 30, 2022 & 2023
Fund 100 - General Fund
90 Public WorksPersonnel Services 2,008,759 2,005,489 2,174,132 1,971,145 2,229,178 2,258,291 Contractual Services 220,583 230,898 278,585 273,110 281,420 280,915 Commodities 446,450 264,514 510,995 488,270 504,115 536,815 Other Expenditures (584,322) (401,056) (548,700) (548,600) (548,850) (548,900) Total 2,091,471 2,099,846 2,415,012 2,183,925 2,465,863 2,527,121
Total General Fund 17,956,264 18,342,535 19,965,890 17,273,312 19,612,815 20,980,430
Total General FundPersonnel Services 14,617,068$ 15,407,347$ 16,202,775$ 15,097,817$ 16,460,984$ 16,620,130$ Contractual Services 1,644,885 1,626,891 1,893,200 1,851,355 1,922,576 1,948,625 Commodities 688,606 502,732 834,860 773,345 812,335 829,435 Other Expenditures (522,227) (391,854) (535,745) (536,110) (536,830) (537,875) Other Financing Uses 1,527,932 1,197,419 1,570,800 86,905 953,750 2,120,115 Total 17,956,264 18,342,535 19,965,890 17,273,312 19,612,815 20,980,430
DRAFT
48

Department 10 - Legislative
2018-2019 2019-2020 2020-2021 2020-2021 2021-2022 2022-2023Account Description Actual Actual Budget Projected Budget Forecast
Expenditures
Mayor & Council
502 Wages - Part-Time/Seasonal 64,125$ 64,117$ 67,760$ 63,890$ 68,606$ 67,760$ 521 Group Insurance 1 1 8 5 8 8 522 Medicare 930 930 980 930 992 980 523 Social Security 3,976 3,975 4,199 3,980 4,251 4,199
Total Personnel Services 69,031 69,024 72,947 68,805 73,857 72,947
543 Legal Service - 242 - - - - 544 Medical Services 100 - - - - - 559 Other Contractual Services 248 2,250 10,000 - 10,000 10,000 561 Postage 146 86 175 175 175 175 562 Telephone 651 666 725 675 700 725 563 Publishing 7,636 8,927 8,500 8,000 8,500 8,500 564 Printing 371 125 750 500 500 500 566 Recording Fees - 104 150 500 150 150 571 Dues 11,599 11,475 11,400 11,400 11,450 11,450 572 Travel 1,876 1,100 3,500 500 2,500 2,500 573 Training - - 2,500 500 2,500 2,500 599 Other Contractual Services - - - - 10,000 -
Total Contractual Services 22,627 24,974 37,700 22,250 46,475 36,500
621 Office Supplies 741 511 1,000 500 1,000 1,000 622 Office Equipment - - 500 - 500 250 624 Operating Supplies 83 - 500 - 250 250 631 Clothing 27 - 250 - 350 150 632 Per Copy Charges 280 249 200 200 200 200
Total Commodities 1,131 760 2,450 700 2,300 1,850
913 Community Relations 327 820 1,000 500 1,000 1,000 917 Employee Awards 100 - - - - -
Total Other Expenditures 427 820 1,000 500 1,000 1,000
Total Mayor & Council 93,216 95,577 114,097 92,255 123,632 112,297
Fire & Police Commission
559 Other Professional Services 13,840 3,225 15,000 10,200 15,000 15,000 561 Postage 7 48 25 15 25 25 563 Publishing 640 349 650 125 650 650 571 Dues 375 375 375 375 375 375 572 Travel 129 13 150 - 150 150 573 Training 634 - 650 450 650 650
Total Contractual Services 15,624 4,009 16,850 11,165 16,850 16,850
624 Operating Supplies - - 250 - 250 250 Total Commodities - - 250 - 250 250
Total Fire & Police Commission 15,624 4,009 17,100 11,165 17,100 17,100
Total Legislative 108,841$ 99,587$ 131,197$ 103,420$ 140,732$ 129,397$
CITY OF GENEVA, ILLINOISBudget Detail by Department
Fiscal Year Ending April 30, 2022 & 2023
Fund 100 - General Fund
DRAFT
49

Department 30 - City Administrator's Office
2018-2019 2019-2020 2020-2021 2020-2021 2021-2022 2022-2023Account Description Actual Actual Budget Projected Budget Forecast
Expenditures
501 Wages - Regular 121,604$ 128,030$ 128,132$ 125,535$ 130,090$ 132,178$ 502 Wages - Part-Time/Seasonal 14,582 12,330 19,968 - 18,720 19,968 521 Group Insurance 25,043 24,877 26,382 27,020 28,934 29,297 522 Medicare 1,883 1,939 2,147 1,720 2,157 2,206 523 Social Security 7,538 7,770 8,462 5,920 8,556 8,800 524 IMRF 14,568 13,791 16,881 14,320 17,436 17,566
Total Personnel Services 185,218 188,736 201,972 174,515 205,893 210,015
544 Medical Service 85 - 85 - - - 559 Other Professional Services 54 - 500 - 250 250 561 Postage 148 479 150 150 150 150 562 Telephone 761 767 800 775 800 800 563 Publishing - 2,939 - - - - 564 Printing 10 632 250 250 250 250 571 Dues 1,648 2,058 1,930 1,825 1,950 1,950 572 Travel 2,146 2,013 3,000 250 3,000 3,000 573 Training 1,240 1,569 3,000 500 3,000 3,000 575 Publications - - 100 - 100 100 596 Public Transportation 14,946 13,290 30,000 30,000 30,000 30,000 599 Other Contractual Services 619 - - - - -
Total Contractual Services 21,657 23,747 39,815 33,750 39,500 39,500
621 Office Supplies 374 357 750 350 500 500 622 Office Equipment 226 412 750 - 500 500 623 Office Furniture - - 2,000 - 2,000 300 624 Operating Supplies - - 250 1,140 250 250 632 Per copy Charges 379 392 400 400 400 400 641 Books - 146 - - - - 663 Computer Software 108 108 150 110 150 150
Total Commodities 1,086 1,415 4,300 2,000 3,800 2,100
917 Employee Awards - - 150 - - - Total Other Expenditures - - 150 - - -
Total City Administrator's Office 207,961$ 213,898$ 246,237$ 210,265$ 249,193$ 251,615$
CITY OF GENEVA, ILLINOISBudget Detail by Department
Fiscal Year Ending April 30, 2022 & 2023
Fund 100 - General Fund
DRAFT
50

CITY OF GENEVA, ILLINOISBudget Detail by Department
Fiscal Year Ending April 30, 2022 & 2023
Fund 100 - General Fund
Department 40 - Administrative Services
2018-2019 2019-2020 2020-2021 2020-2021 2021-2022 2022-2023Account Description Actual Actual Budget Projected Budget Forecast
Expenditures
Administration
501 Wages - Regular 141,827$ 146,356$ 142,482$ 138,765$ 145,485$ 149,486$ 502 Wages - Part-Time/Seasonal - - - 12,005 14,308 14,702 521 Group Insurance 20,977 21,083 21,709 21,635 22,535 22,939 522 Medicare 1,995 2,053 2,066 2,120 2,317 2,380 523 Social Security 8,528 8,780 8,799 9,060 9,909 10,181 524 IMRF 14,448 14,282 16,246 15,820 17,053 17,213
Total Personnel Services 187,775 192,555 191,302 199,405 211,607 216,901
544 Medical Service - 85 - - - - 559 Other Professional Services - 28 - - - - 561 Postage 163 189 100 175 150 150 562 Telephone 794 767 780 780 800 800 564 Printing 242 - 150 75 150 150 571 Dues 1,457 1,457 1,510 1,520 1,590 1,590 572 Travel 30 - 500 - 500 500 573 Training 521 230 3,880 1,000 2,995 2,995
Total Contractual Services 3,206 2,755 6,920 3,550 6,185 6,185
621 Office Supplies 194 340 300 300 300 300 622 Office Equipment (10) - 250 250 250 250 624 Operating Supplies - 10 150 100 150 150 632 Per Copy Charges 212 277 250 200 250 250
Total Commodities 396 627 950 850 950 950
Total Administration 191,377 195,937 199,172 203,805 218,742 224,036
Information Technology
501 Wages - Regular 39,330 40,408 40,687 37,910 41,342 42,018 521 Group Insurance 9,412 10,531 10,937 9,365 9,558 9,724 522 Medicare 545 561 590 555 599 609 523 Social Security 2,332 2,399 2,524 2,365 2,563 2,605 524 IMRF 4,163 4,022 4,640 4,550 4,844 4,862
Total Personnel Services 55,781 57,921 59,378 54,745 58,906 59,818
531 Maintenance Service 8,035 7,413 7,260 7,160 7,270 6,915 561 Postage 292 - 100 - 100 100 562 Telephone 8,128 10,809 5,250 10,900 10,900 10,900 564 Printing 121 - - - - - 565 Internet 3,427 2,417 2,680 2,680 2,680 2,680 571 Dues 210 272 210 210 210 210 573 Training 325 176 1,400 - 1,400 1,400 581 Utilities 463 505 480 480 480 480 595 Rentals 4,621 3,285 3,285 3,290 3,290 3,290
Total Contractual Services 25,620 24,877 20,665 24,720 26,330 25,975
601 Maintenance Supplies 522 329 2,000 1,000 2,000 2,000 621 Office Supplies 219 23 250 125 250 250 622 Office Equipment 1,281 875 1,000 750 1,000 1,000 626 Janitorial Supplies - - - 30 - - 632 Per Copy Charges 2 - 50 15 50 50 663 Computer Software 372 - - 1,065 1,065 1,065
Total Commodities 2,397 1,227 3,300 2,985 4,365 4,365
DRAFT
51

CITY OF GENEVA, ILLINOISBudget Detail by Department
Fiscal Year Ending April 30, 2022 & 2023
Fund 100 - General Fund
Department 40 - Administrative Services
2018-2019 2019-2020 2020-2021 2020-2021 2021-2022 2022-2023Account Description Actual Actual Budget Projected Budget Forecast
Expenditures
917 Employee Awards 200 - - - - - Total Other Expenditures 200 - - - - -
Total Information Technology 83,999 84,025 83,343 82,450 89,601 90,158
Human Resources
501 Wages - Regular 72,047 74,617 73,345 47,335 63,249 65,773 502 Wages - Part-Time/Seasonal 17,335 7,065 18,237 - - - 521 Group Insurance 10,738 10,818 11,434 4,650 6,050 6,185 522 Medicare 1,249 1,151 1,327 665 917 1,156 523 Social Security 5,339 4,921 5,678 2,835 3,922 4,945 524 IMRF 7,645 7,409 10,440 5,400 7,414 7,612
Total Personnel Services 114,353 105,981 120,461 60,885 81,552 85,671
544 Medical Service 792 767 2,160 1,000 1,500 1,500 561 Postage 248 144 275 120 275 275 563 Publishing - - - 50 - - 564 Printing 299 282 300 100 300 300 571 Dues 724 699 1,005 1,005 1,005 1,005 572 Travel 66 94 230 100 230 230 573 Training 1,635 561 3,800 1,900 3,800 3,800
Total Contractual Services 3,764 2,548 7,770 4,275 7,110 7,110
621 Office Supplies 712 825 1,225 900 1,000 1,000 622 Office Equipment - - 500 500 300 300 624 Operating Supplies 1,198 614 1,500 1,200 1,500 1,500 632 Per Copy Charges 649 488 650 300 650 650
Total Commodities 2,559 1,927 3,875 2,900 3,450 3,450
917 Employee Awards - 500 1,200 1,000 1,200 1,200 Total Other Expenditures - 500 1,200 1,000 1,200 1,200
Total Human Resources 120,676 110,955 133,306 69,060 93,312 97,431
City-Wide Services
531 Maintenance Service 49,107 47,164 49,060 52,140 53,705 56,390 543 Legal Service 143,224 165,629 120,000 150,000 147,000 150,000 559 Other Professional Services 1,675 333 750 750 750 750 562 Telephone 3,498 3,565 4,060 - 4,060 4,060 563 Publishing - 107 250 250 250 250 564 Printing 78 - - - - - 571 Dues 588 2,194 35 12,000 12,755 12,755 572 Travel 25 - 15 - 15 15 581 Utilities 8,970 11,317 10,500 10,500 10,500 10,500 592 General Insurance 104,601 126,492 220,500 200,500 200,501 200,500 595 Rentals 4,912 4,580 5,125 5,125 5,460 5,460 599 Other Contractual Services - 5,151 - - - -
Total Contractual Services 316,678 366,532 410,295 431,265 434,996 440,680
DRAFT
52
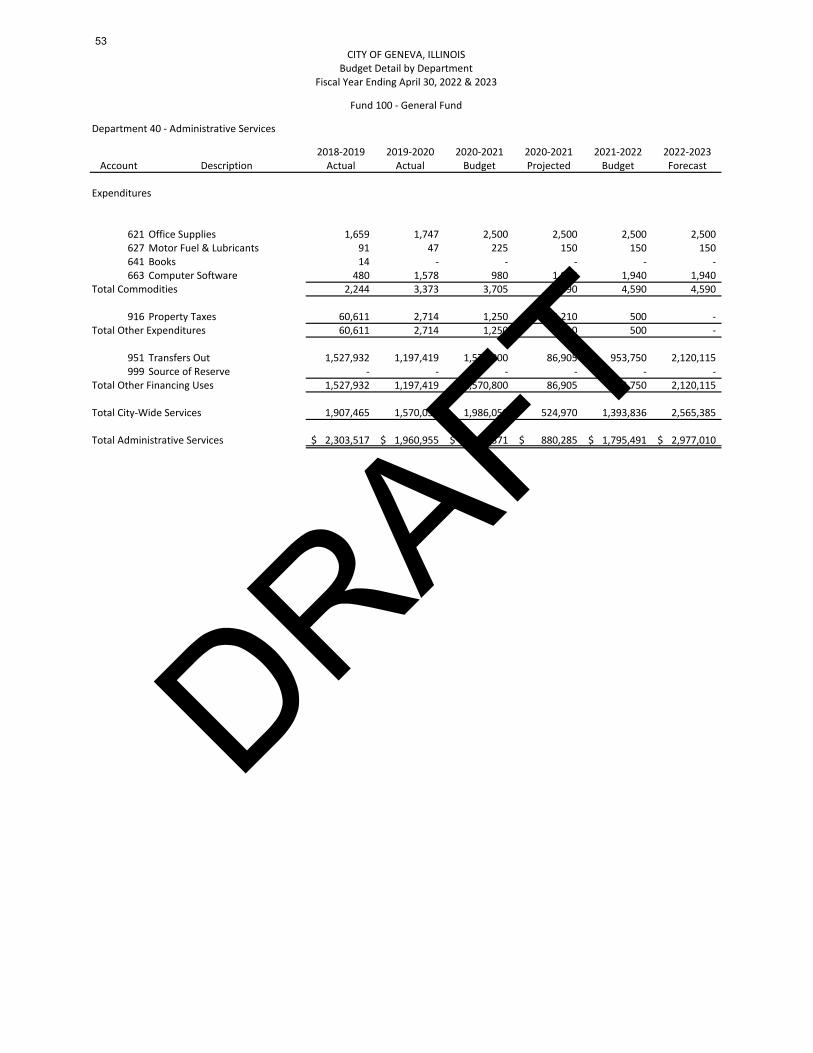
CITY OF GENEVA, ILLINOISBudget Detail by Department
Fiscal Year Ending April 30, 2022 & 2023
Fund 100 - General Fund
Department 40 - Administrative Services
2018-2019 2019-2020 2020-2021 2020-2021 2021-2022 2022-2023Account Description Actual Actual Budget Projected Budget Forecast
Expenditures
621 Office Supplies 1,659 1,747 2,500 2,500 2,500 2,500 627 Motor Fuel & Lubricants 91 47 225 150 150 150 641 Books 14 - - - - - 663 Computer Software 480 1,578 980 1,940 1,940 1,940
Total Commodities 2,244 3,373 3,705 4,590 4,590 4,590
916 Property Taxes 60,611 2,714 1,250 2,210 500 - Total Other Expenditures 60,611 2,714 1,250 2,210 500 -
951 Transfers Out 1,527,932 1,197,419 1,570,800 86,905 953,750 2,120,115 999 Source of Reserve - - - - - -
Total Other Financing Uses 1,527,932 1,197,419 1,570,800 86,905 953,750 2,120,115
Total City-Wide Services 1,907,465 1,570,038 1,986,050 524,970 1,393,836 2,565,385
Total Administrative Services 2,303,517$ 1,960,955$ 2,401,871$ 880,285$ 1,795,491$ 2,977,010$
DRAFT
53

CITY OF GENEVA, ILLINOISBudget Detail by Department
Fiscal Year Ending April 30, 2022 & 2023
Fund 100 - General Fund
Department 40.44 - Finance
2018-2019 2019-2020 2020-2021 2020-2021 2021-2022 2022-2023Account Description Actual Actual Budget Projected Budget Forecast
Expenditures
Finance
501 Wages - Regular 130,960 135,773 137,948 132,086 141,852 144,471 502 Wages - Part-Time/Seasonal 11,533 11,856 12,993 11,955 13,266 13,631 521 Group Insurance 26,645 26,489 27,687 26,445 29,456 29,969 522 Medicare 1,959 2,031 2,188 1,995 2,249 2,293 523 Social Security 8,376 8,686 9,360 8,520 9,615 9,802 524 IMRF 15,292 14,740 17,208 16,420 18,177 18,269
Total Personnel Services 194,764 199,576 207,384 197,421 214,615 218,435
541 Accounting & Auditing Service 31,165 23,287 30,285 31,550 22,085 27,075 547 Banking Service 6,457 7,878 8,000 9,000 9,000 9,000 550 Collection Service - 35 50 50 50 50 544 Medical Services - - - 85 - - 561 Postage 1,110 892 1,100 950 960 960 562 Telephone 62 823 500 500 - - 563 Publishing - - - 300 - - 564 Printing 2,540 1,399 2,250 1,500 1,500 1,500 571 Dues 2,490 2,085 2,460 2,460 2,460 2,460 572 Travel 369 146 600 600 600 600 573 Training 856 261 900 500 900 1,040 575 Publications - - - 130 130 130 595 Rentals 2,053 1,957 2,280 2,280 2,280 2,280 599 Other Contractual Services 56 153 60 140 140 140
Total Contractual Services 47,157 38,915 48,485 50,045 40,105 45,235
601 Maintenance Supplies 19 - - - - - 621 Office Supplies 954 436 1,000 1,100 1,000 1,000 622 Office Equipment 13 520 550 - - 400 623 Office Furniture - 500 - - - - 624 Operating Supplies 45 24 50 50 50 50 632 Per Copy Charges 326 335 350 350 350 350 641 Books - - 500 - - -
Total Commodities 1,357 1,815 2,450 1,500 1,400 1,800
912 Bad Debt (4,221) 1,631 5,000 5,000 5,000 5,000 917 Employee Awards - 250 50 50 250 -
Total Other Expenditures (4,221) 1,881 5,050 5,050 5,250 5,000
Total Finance 239,056$ 242,186$ 263,369$ 254,016$ 261,370$ 270,470$ DRAFT
54

CITY OF GENEVA, ILLINOISBudget Detail by Department
Fiscal Year Ending April 30, 2022 & 2023
Fund 100 - General Fund
Department 50 - Community Development
2018-2019 2019-2020 2020-2021 2020-2021 2021-2022 2022-2023Account Description Actual Actual Budget Projected Budget Forecast
Expenditures
Building Division
501 Wages - Regular 373,710$ 385,568$ 392,800$ 383,405$ 398,518$ 406,450$ 502 Wages - Part-Time/Seasonal - 1,118 - - - - 521 Group Insurance 87,254 95,777 96,998 96,940 99,516 101,404 522 Medicare 5,075 5,263 5,697 5,220 5,779 5,893 523 Social Security 21,699 22,506 24,354 22,305 24,708 25,200 524 IMRF 40,151 38,582 44,780 43,710 46,701 47,026
Total Personnel Services 527,890 548,815 564,629 551,580 575,222 585,973
531 Maintenance Service 11,103 3,780 16,940 5,340 16,940 16,940 544 Medical Services - - - 85 - - 546 Janitorial Service 15,876 15,876 15,880 15,880 15,880 15,880 559 Other Professional Services 4,840 4,544 10,000 10,000 10,000 10,000 561 Postage 606 430 800 675 800 800 562 Telephone 4,758 3,652 3,515 3,515 3,515 3,515 563 Publishing 762 - - - - - 564 Printing 130 464 600 600 600 600 566 Recording Fees 547 52 350 260 - - 571 Dues 430 660 900 600 900 900 572 Travel 612 172 1,300 400 1,300 1,300 573 Training 4,986 3,547 4,340 1,500 4,340 4,340 595 Rentals 1,903 1,835 2,220 2,220 2,220 2,220 599 Other Contractual Services 88,770 78,994 125,420 105,000 125,420 125,420
Total Contractual Services 135,322 114,006 182,265 146,075 181,915 181,915
601 Maintenance Supplies 1,276 2,161 3,250 2,225 3,250 3,250 621 Office Supplies 1,305 1,037 2,000 2,000 2,000 2,000 622 Office Equipment - 22 350 300 350 350 624 Operating Supplies - 229 150 2,500 150 150 625 Small Tools 60 19 150 100 150 150 626 Janitorial Supplies - 11 - 10 - - 627 Motor Fuel & Lubricants 2,822 2,587 3,560 2,630 2,630 2,630 631 Clothing 273 200 750 650 750 750 632 Per Copy Charges 1,213 992 1,000 1,000 1,000 1,000 641 Books 843 428 1,000 1,000 1,000 1,000 663 Computer Software 480 481 485 485 485 485
Total Commodities 8,272 8,168 12,695 12,900 11,765 11,765
917 Employee Awards 150 - - - 350 - Total Other Expenditures 150 - - - 350 -
Total Building Division 671,634 670,989 759,589 710,555 769,252 779,653
Planning Division
501 Wages - Regular 225,960 243,251 235,939 201,495 230,836 236,153 502 Wages - Part-Time/Seasonal 4,808 7,530 14,560 1,285 8,100 8,320 521 Group Insurance 32,624 31,481 33,532 23,835 26,356 26,832 522 Medicare 3,242 3,538 3,632 2,890 3,464 3,622 523 Social Security 13,864 15,128 15,094 12,345 14,505 15,238 524 IMRF 24,102 24,769 26,897 22,975 22,144 21,147
Total Personnel Services 304,600 325,697 329,654 264,825 305,405 311,312
DRAFT
55

CITY OF GENEVA, ILLINOISBudget Detail by Department
Fiscal Year Ending April 30, 2022 & 2023
Fund 100 - General Fund
Department 50 - Community Development
2018-2019 2019-2020 2020-2021 2020-2021 2021-2022 2022-2023Account Description Actual Actual Budget Projected Budget Forecast
Expenditures
544 Medical Service - 85 - 85 85 - 559 Other Professional Services 13,038 13,779 16,150 13,275 16,150 16,150 561 Postage 2,215 128 150 150 150 150 562 Telephone 761 767 840 780 780 780 563 Publishing 3,169 1,836 4,795 3,670 4,500 4,500 564 Printing - - 92 95 1,500 - 566 Recording Fees 3,468 1,583 2,500 1,750 2,500 2,500 571 Dues 2,579 1,569 2,128 1,875 2,450 2,450 572 Travel 83 250 1,285 200 1,200 1,200 573 Training 855 697 2,075 1,955 2,075 2,075 599 Other Contractual Services 9,242 13,883 18,000 18,000 18,000 18,000
Total Contractual Services 35,411 34,577 48,015 41,835 49,390 47,805
621 Office Supplies 639 395 450 350 450 450 622 Office Equipment 639 139 400 200 400 400 623 Office Furniture 383 - 400 400 400 400 632 Per Copy Charges 558 514 600 400 600 600 641 Books 102 - 200 100 200 200 663 Computer Software - - - - 1,080 1,080
Total Commodities 2,321 1,048 2,050 1,450 3,130 3,130
913 Community Relations 147 155 330 255 175 330 917 Employee Awards 200 - 100 100 - 100
Total Other Expenditures 347 155 430 355 175 430
Total Planning Division 342,679 361,478 380,149 308,465 358,100 362,677
Total Community Development 1,014,313$ 1,032,467$ 1,139,738$ 1,019,020$ 1,127,352$ 1,142,330$
DRAFT
56

CITY OF GENEVA, ILLINOISBudget Detail by Department
Fiscal Year Ending April 30, 2022 & 2023
Fund 100 - General Fund
Department 60 - Economic Development
2018-2019 2019-2020 2020-2021 2020-2021 2021-2022 2022-2023Account Description Actual Actual Budget Projected Budget Forecast
Expenditures
501 Wages - Regular 56,501$ 52,082$ 55,298$ 54,110$ 56,411$ 57,896$ 502 Wages - Part-Time/Seasonal 14,535 17,545 20,096 - 18,720 17,472 521 Group Insurance 9,632 17,576 18,643 15,405 15,728 16,001 522 Medicare 819 959 1,092 735 1,089 1,092 523 Social Security 3,502 4,100 4,602 3,145 4,607 4,631 524 IMRF 6,196 6,941 8,595 6,170 8,805 6,699 528 Unemployment Compensation 2,097 - - - - -
Total Personnel Services 93,282 99,204 108,326 79,565 105,360 103,791
544 Medical Service 170 85 85 85 85 - 551 Advertising 100 - - - - - 552 Data Programming Service - 2,084 1,500 2,085 1,500 1,500 559 Other Professional Services - 408 9,000 2,000 5,000 5,000 561 Postage 27 72 200 200 200 200 562 Telephone 641 827 1,440 1,440 1,500 1,440 563 Publishing - - - - - - 564 Printing 212 102 500 250 250 250 571 Dues 6,208 7,323 6,350 6,250 6,350 6,350 572 Travel 362 100 550 250 550 550 573 Training 236 - 2,160 2,100 2,160 2,160 575 Publications - - 200 200 200 200 599 Other Contractual Services 750 - 2,500 1,000 2,500 2,500
Total Contractual Services 8,706 11,002 24,485 15,860 20,295 20,150
621 Office Supplies 184 416 500 500 500 500 622 Office Equipment - - 250 100 250 250 623 Office Furniture 322 - 2,800 - 2,000 400 632 Per Copy Charges 264 443 250 600 350 350
Total Commodities 770 859 3,800 1,200 3,100 1,500
913 Community Relations 70 - 500 - 200 200 917 Employee Awards - 50 - - 50 - 922 Grant Expense - - - - - -
Total Other Expenditures 70 50 500 - 250 200
Total Economic Development 102,827$ 111,115$ 137,111$ 96,625$ 129,005$ 125,641$ DRAFT
57

CITY OF GENEVA, ILLINOISBudget Detail by Department
Fiscal Year Ending April 30, 2022 & 2023
Fund 100 - General Fund
Department 70 - Police
2018-2019 2019-2020 2020-2021 2020-2021 2021-2022 2022-2023Account Description Actual Actual Budget Projected Budget Forecast
Expenditures
Police Services
501 Wages - Regular 3,504,463$ 3,491,842$ 3,643,686$ 3,477,285$ 3,712,952$ 3,830,716$ 503 Overtime 406,746 392,548 405,000 197,785 397,530 397,530 504 Stand-By 15,731 14,275 22,250 25,110 20,000 20,000 521 Group Insurance 576,322 591,642 691,919 629,550 723,129 722,554 522 Medicare 55,020 54,771 59,026 51,800 59,889 61,600 525 Police/Fire Pension 1,389,261 1,756,100 1,756,100 1,756,100 1,756,100 1,756,100
Total Personnel Services 5,947,544 6,301,178 6,577,981 6,137,630 6,669,600 6,788,500
531 Maintenance Service 22,485 41,323 19,675 24,800 18,525 18,525 544 Medical Services 5,330 5,220 2,750 2,750 2,750 2,750 546 Janitorial Service 35,419 35,419 35,460 35,460 35,460 35,460 559 Other Professional Services 1,879 2,549 1,140 1,140 700 700 561 Postage 7 - - - - - 562 Telephone 15,082 15,279 15,200 15,200 15,200 15,200 564 Printing 5,706 4,843 6,635 5,000 5,635 5,635 571 Dues 1,330 1,795 2,140 2,140 2,140 2,140 572 Travel 994 1,206 1,450 500 1,450 1,450 573 Training 9,389 12,581 18,625 18,625 18,625 18,625 575 Publications 143 738 525 500 500 500 595 Rentals 200 - 800 500 800 800 597 Tri-City Ambulance/Tri-Com 298,346 221,774 236,225 236,225 236,225 236,225 599 Other Contractual Services 4,106 4,445 7,590 7,590 27,890 28,490
Total Contractual Services 400,417 347,172 348,215 350,430 365,900 366,500
601 Maintenance Supplies 8,440 5,017 9,015 9,015 9,015 9,015 621 Office Supplies 2 445 - - - - 622 Office Equipment - - 1,400 1,400 1,400 1,400 624 Operating Supplies 1,800 993 1,800 1,900 1,800 2,000 627 Motor Fuel & Lubricants 45,289 48,009 60,000 45,000 45,000 45,000 630 Ammunition 4,372 8,557 10,750 10,750 10,750 10,750 631 Clothing 31,139 43,081 37,050 37,050 37,050 37,050 642 Periodicals 207 187 350 350 350 350 663 Computer Software 2,000 18,020 25,215 14,000 23,590 23,590
Total Commodities 93,250 124,308 145,580 119,465 128,955 129,155
917 Employee Awards 2,957 1,997 1,825 1,825 1,695 1,695 Total Other Expenditures 2,957 1,997 1,825 1,825 1,695 1,695
Total Police Services 6,444,168 6,774,656 7,073,601 6,609,350 7,166,150 7,285,850
Records
501 Wages - Regular 463,066 465,298 471,946 464,676 478,504 485,087 502 Wages - Part-Time/Seasonal 7,989 8,204 8,904 9,085 9,204 9,424 503 Overtime 185 607 1,260 920 1,260 1,260 521 Group Insurance 118,822 121,110 127,245 136,785 143,981 146,621 522 Medicare 6,370 6,402 6,971 6,350 7,090 7,190
DRAFT
58

CITY OF GENEVA, ILLINOISBudget Detail by Department
Fiscal Year Ending April 30, 2022 & 2023
Fund 100 - General Fund
Department 70 - Police
2018-2019 2019-2020 2020-2021 2020-2021 2021-2022 2022-2023Account Description Actual Actual Budget Projected Budget Forecast
Expenditures
523 Social Security 27,236 27,371 29,890 27,150 30,316 30,740 524 IMRF 48,894 46,931 53,802 53,060 56,076 55,688
Total Personnel Services 672,561 675,923 700,018 698,026 726,431 736,010
531 Maintenance Service 12,694 12,780 15,840 15,840 14,635 14,635 544 Medical Service - - 500 - 500 500 559 Other Professional Services 2,579 1,693 1,730 1,730 1,730 1,730 561 Postage 2,316 4,663 3,235 3,000 3,235 3,235 562 Telephone 3,651 5,473 3,000 4,000 3,000 3,000 564 Printing - 514 170 170 170 170 572 Travel 10 - 755 - 250 800 573 Training 793 758 1,850 500 600 1,850 581 Utilities 229 392 395 395 395 395 595 Rentals 5,600 6,488 5,900 6,700 5,900 5,900 599 Other Contractual Services 12,873 11,921 13,555 13,555 4,155 23,555
Total Contractual Services 40,746 44,682 46,930 45,890 34,570 55,770
601 Maintenance Supplies 243 18 - - - - 621 Office Supplies 9,648 10,202 11,450 11,000 11,450 11,450 622 Office Equipment 540 996 7,200 5,000 2,450 2,000 623 Office Furniture 1,563 579 2,100 2,100 2,100 2,100 624 Operating Supplies 2,887 2,235 4,200 4,260 4,200 4,200 631 Clothing 1,891 1,676 3,100 3,100 3,100 3,100 632 Per Copy Charges 3,626 3,705 3,000 3,000 3,000 3,000 663 Computer Software 3,399 8,399 9,950 12,200 9,175 9,175
Total Commodities 23,796 27,811 41,000 40,660 35,475 35,025
917 Employee Awards 336 - 350 350 400 300 Total Other Expenditures 336 - 350 350 400 300
Total Records 737,439 748,417 788,298 784,926 796,876 827,105
Community Service
501 Wages - Regular 32,737 36,703 35,026 55,970 45,756 36,390 502 Wages - Part-Time/Seasonal 29,910 26,550 32,400 13,695 27,000 27,000 503 Overtime 2,187 2,639 2,000 200 2,000 2,000 504 Stand-By 2,282 2,506 2,000 3,030 2,000 2,000 521 Group Insurance 9,978 11,351 11,841 16,685 14,981 12,345 522 Medicare 949 968 1,034 1,020 1,112 976 523 Social Security 4,055 4,139 4,430 4,355 4,759 4,179 524 IMRF 4,015 3,923 3,992 6,515 5,362 4,179
Total Personnel Services 86,114 88,779 92,723 101,470 102,970 89,069
550 Collection Service - - 200 - 200 200 562 Telephone 912 912 1,000 1,000 1,000 1,000 599 Other Contractual Services 9,450 10,170 7,000 7,000 7,000 7,000
Total Contractual Services 10,362 11,082 8,200 8,000 8,200 8,200
DRAFT
59

CITY OF GENEVA, ILLINOISBudget Detail by Department
Fiscal Year Ending April 30, 2022 & 2023
Fund 100 - General Fund
Department 70 - Police
2018-2019 2019-2020 2020-2021 2020-2021 2021-2022 2022-2023Account Description Actual Actual Budget Projected Budget Forecast
Expenditures
624 Operating Supplies 453 1,508 900 900 900 900 631 Clothing 510 384 800 650 800 800
Total Commodities 964 1,892 1,700 1,550 1,700 1,700
Total Community Service 97,440 101,753 102,623 111,020 112,870 98,969
Total Police 7,279,046$ 7,624,826$ 7,964,522$ 7,505,296$ 8,075,896$ 8,211,924$
DRAFT
60

CITY OF GENEVA, ILLINOISBudget Detail by Department
Fiscal Year Ending April 30, 2022 & 2023
Fund 100 - General Fund
Department 80 - Fire
2018-2019 2019-2020 2020-2021 2020-2021 2021-2022 2022-2023Account Description Actual Actual Budget Projected Budget Forecast
Expenditures
Command
501 Wages - Regular 789,776$ 785,632$ 813,508$ 805,400$ 835,963$ 837,420$ 521 Group Insurance 193,071 217,949 229,184 225,060 222,992 223,156 522 Medicare 10,955 10,875 11,795 11,165 12,122 12,144 523 Social Security 10,011 10,397 11,186 10,350 11,361 11,526 524 IMRF 18,442 17,811 20,566 20,160 21,473 21,509
Total Personnel Services 1,022,254 1,042,664 1,086,239 1,072,135 1,103,911 1,105,755
531 Maintenance Service 7,739 5,227 5,210 5,480 5,635 5,635 544 Medical Service 1,138 438 1,465 1,465 1,465 1,465 559 Other Professional Services 448 266 215 215 215 215 561 Postage 473 263 300 300 300 300 562 Telephone 10,434 10,641 10,740 16,565 10,275 10,275 564 Printing 126 42 350 350 350 350 571 Dues 4,895 4,693 4,950 5,055 5,055 5,055 572 Travel 417 161 1,000 1,000 7,000 1,000 573 Training 3,599 661 500 500 500 500 595 Rentals 2,038 1,707 1,940 1,515 1,515 1,515 597 Tri-City Ambulance/Tri-Com 228,737 230,836 248,645 246,560 252,745 252,745
Total Contractual Services 260,043 254,934 275,315 279,005 285,055 279,055
601 Maintenance Supplies 1,491 18 500 500 500 500 621 Office Supplies 1,481 1,080 1,500 1,500 1,500 1,500 622 Office Equipment 3,816 504 300 450 300 300 624 Operating Supplies 69 435 500 500 500 500 631 Clothing 1,986 1,219 2,100 2,100 2,100 2,100 632 Per Copy Charges 700 706 750 750 750 750
Total Commodities 9,543 3,963 5,650 5,800 5,650 5,650
917 Employee Awards 1,216 1,085 1,200 1,200 1,200 1,200 Total Other Expenditures 1,216 1,085 1,200 1,200 1,200 1,200
Total Command 1,293,056 1,302,645 1,368,404 1,358,140 1,395,816 1,391,660
Fire Services
501 Wages - Regular 1,430,564 1,575,562 1,623,387 1,588,975 1,763,589 1,745,918 503 Overtime 269,718 208,797 205,540 210,330 209,340 209,340 506 Wages - Meetings 4,641 4,752 9,720 3,225 5,000 5,000 513 POC Holiday 5,502 4,336 13,080 2,060 6,000 6,000 514 Overnight Duty 333,409 300,081 416,800 260,205 375,000 375,000 515 Still Alarms 35,375 39,098 36,000 27,845 36,000 36,000 516 Training 16,292 9,379 14,400 3,520 14,400 14,400 521 Group Insurance 427,891 505,304 544,677 516,015 520,408 518,334 522 Medicare 29,542 30,171 33,625 28,975 34,935 35,110 523 Social Security 24,384 22,350 12,425 18,540 25,830 26,565 525 Police/Fire Pension 569,824 805,975 805,975 805,975 805,975 805,975
Total Personnel Services 3,147,142 3,505,806 3,715,629 3,465,665 3,796,477 3,777,642
DRAFT
61

CITY OF GENEVA, ILLINOISBudget Detail by Department
Fiscal Year Ending April 30, 2022 & 2023
Fund 100 - General Fund
Department 80 - Fire
2018-2019 2019-2020 2020-2021 2020-2021 2021-2022 2022-2023Account Description Actual Actual Budget Projected Budget Forecast
Expenditures
531 Maintenance Service 7,000 2,759 6,500 6,500 6,500 6,500 544 Medical Service 15,917 5,326 16,185 15,255 15,255 15,255 572 Travel 704 985 1,000 1,000 1,000 1,000 573 Training 12,436 17,776 17,000 17,000 17,000 17,000
Total Contractual Services 36,056 26,846 40,685 39,755 39,755 39,755
601 Maintenance Supplies 9,880 7,827 5,000 5,000 5,000 5,000 624 Operating Supplies 17,202 13,044 21,255 20,755 21,255 21,255 625 Small Tools 699 322 5,000 5,000 5,000 5,000 627 Motor Fuel & Lubricants 17,239 15,019 21,010 16,200 16,200 16,200 631 Clothing 34,775 10,306 24,000 24,000 36,000 24,000 641 Books 410 - 500 500 500 500
Total Commodities 80,205 46,516 76,765 71,455 83,955 71,955
Total Fire Services 3,263,404 3,579,168 3,833,079 3,576,875 3,920,187 3,889,352
Facility Maintenance
531 Maintenance Service 24,292 34,683 20,070 31,020 18,370 18,370 581 Utilities 813 715 660 780 780 780 595 Rentals 505 - 950 950 950 950 599 Other Contractual Services 758 764 1,000 1,000 1,000 1,000
Total Contractual Services 26,369 36,162 22,680 33,750 21,100 21,100
601 Maintenance Supplies 7,544 6,983 6,800 8,630 6,800 6,800 624 Operating Supplies 504 469 1,450 1,450 1,450 1,450 626 Janitorial Supplies 3,035 4,487 3,500 3,500 3,500 3,500
Total Commodities 11,083 11,940 11,750 13,580 11,750 11,750
Total Facility Maintenance 37,452 48,102 34,430 47,330 32,850 32,850
GEMA
531 Maintenance Service 4,143 4,164 5,245 12,435 5,285 5,285 559 Other Professional Services 4,028 16,011 16,000 16,000 4,000 16,000 562 Telephone 6,195 6,999 7,080 7,190 7,140 7,140 573 Training 170 - 1,000 1,000 1,000 1,000
Total Contractual Services 14,536 27,174 29,325 36,625 17,425 29,425
622 Office Equipment 123 38 - - - - 624 Operating Supplies 442 248 500 505 650 650 627 Motor Fuel & Lubricants 219 248 310 200 200 200 631 Clothing - 34 785 785 785 785
Total Commodities 783 568 1,595 1,490 1,635 1,635
Total GEMA 15,319 27,742 30,920 38,115 19,060 31,060
Total Fire 4,609,231$ 4,957,657$ 5,266,833$ 5,020,460$ 5,367,913$ 5,344,922$
DRAFT
62

CITY OF GENEVA, ILLINOISBudget Detail by Division
Fiscal Year Ending April 30, 2022 & 2023
Fund 100 - General Fund
Division 91 - Streets & Walks
2018-2019 2019-2020 2020-2021 2020-2021 2021-2022 2022-2023Account Description Actual Actual Budget Projected Budget Forecast
Expenditures
General Maintenance
501 Wages - Regular 915,049$ 941,350$ 951,575$ 888,170$ 978,274$ 999,664$ 502 Wages - Part-Time/Seasonal 3,420 4,200 6,000 - 6,240 - 503 Overtime 78,764 30,500 82,200 82,200 82,200 82,200 504 Stand-By 75,044 70,176 74,400 74,000 74,400 74,400 521 Group Insurance 273,223 325,469 343,188 296,125 365,478 369,156 522 Medicare 14,896 14,543 16,154 12,320 16,547 16,768 523 Social Security 63,648 62,113 68,898 52,140 70,599 71,550 524 IMRF 112,762 104,369 126,330 101,530 126,566 127,160
Total Personnel Services 1,536,806 1,552,721 1,668,745 1,506,485 1,720,304 1,740,898
531 Maintenance Service 64,037 61,601 79,945 78,500 78,025 78,740 544 Medical Service 1,095 1,055 1,330 1,000 1,330 1,330 546 Janitorial Service 2,401 2,405 2,540 2,400 2,540 2,540 559 Other Professional Services 500 - 500 500 500 500 561 Postage 12 52 250 200 250 250 562 Telephone 2,023 2,252 2,400 2,400 2,400 2,400 563 Publishing 270 87 300 300 300 300 564 Printing 95 7 100 160 100 100 571 Dues 845 870 670 870 890 890 572 Travel 1,345 517 540 540 540 540 573 Training 5,162 4,107 3,200 3,200 3,200 3,200 581 Utilities 76 76 160 100 160 160 582 Street Lighting 538 443 600 600 600 600 584 Landfill Charges 566 3,160 2,000 2,000 2,000 2,000 595 Rentals 1,820 2,070 2,170 1,870 3,170 3,170 599 Other Contractual Services 126 351 500 500 500 500
Total Contractual Services 80,911 79,055 97,205 95,140 96,505 97,220
601 Maintenance Supplies 32,780 13,135 36,610 36,460 36,610 36,610 621 Office Supplies 816 656 800 700 800 800 622 Office Equipment 540 495 500 500 500 500 624 Operating Supplies 15,973 14,403 23,560 22,200 23,560 23,560 625 Small Tools 2,789 1,570 6,000 5,500 6,000 6,000 626 Janitorial Supplies 119 175 400 300 400 400 627 Motor Fuel & Lubricants 42,998 43,223 43,840 39,600 39,900 39,900 631 Clothing 7,147 6,863 8,800 6,500 8,800 8,800 632 Per Copy Charges 326 285 480 350 480 480 663 Computer Software 12,117 13,267 11,360 11,360 11,560 11,560
Total Commodities 115,605 94,073 132,350 123,470 128,610 128,610
910 Capitalized Assets (585,522) (402,706) (550,000) (550,000) (550,000) (550,000) 917 Employee Awards 650 625 600 700 600 600
Total Other Expenditures (584,872) (402,081) (549,400) (549,300) (549,400) (549,400)
Total General Maintenance 1,148,450 1,323,767 1,348,900 1,175,795 1,396,019 1,417,328
DRAFT
63

CITY OF GENEVA, ILLINOISBudget Detail by Division
Fiscal Year Ending April 30, 2022 & 2023
Fund 100 - General Fund
Division 91 - Streets & Walks
2018-2019 2019-2020 2020-2021 2020-2021 2021-2022 2022-2023Account Description Actual Actual Budget Projected Budget Forecast
Expenditures
Snow Control
559 Other Professional Services 2,008 3,005 2,100 2,100 2,100 2,100 Total Contractual Services 2,008 3,005 2,100 2,100 2,100 2,100
601 Maintenance Supplies 227,485 75,820 240,300 240,000 240,300 273,000 624 Operating Supplies 335 20 700 - 700 700 625 Small Tools - - 100 100 100 100
Total Commodities 227,820 75,839 241,100 240,100 241,100 273,800
Total Snow & Ice Control 229,828 78,844 243,200 242,200 243,200 275,900
Forestry
531 Maintenance Service 433 366 2,000 500 2,000 2,000 559 Other Professional Services 250 - 3,000 3,000 3,000 3,000 564 Printing - - 500 - 500 500 571 Dues & Subscriptions 575 575 600 575 600 600 587 Mosquito Abatement 48,294 49,548 60,000 60,000 60,000 60,000
Total Contractual Services 49,552 50,489 66,100 64,075 66,100 66,100
601 Maintenance Supplies 271 480 1,000 750 1,000 1,000 624 Operating Supplies 43 10 600 500 600 600 625 Small Tools 588 2,314 4,000 3,000 4,000 4,000 627 Motor Fuel & Lubricants 143 138 205 200 205 205
Total Commodities 1,045 2,942 5,805 4,450 5,805 5,805
Total Forestry 50,597 53,431 71,905 68,525 71,905 71,905
Total Streets & Walks 1,428,876$ 1,456,042$ 1,664,005$ 1,486,520$ 1,711,124$ 1,765,133$
DRAFT
64

CITY OF GENEVA, ILLINOISBudget Detail by Division
Fiscal Year Ending April 30, 2022 & 2023
Fund 100 - General Fund
Division 91.50 - Fleet Maintenance
2018-2019 2019-2020 2020-2021 2020-2021 2021-2022 2022-2023Account Description Actual Actual Budget Projected Budget Forecast
Expenditures
Fleet Maintenance
501 Wages - Regular 136,189$ 127,971$ 140,924$ 124,000$ 143,623$ 146,457$ 502 Wages - Part Time - - 7,830 - - - 503 Overtime 397 208 1,215 185 1,215 1,215 521 Group Insurance 19,523 22,459 24,029 20,645 24,978 25,433 522 Medicare 1,944 1,825 2,176 1,790 2,101 2,141 523 Social Security 8,311 7,804 9,297 7,625 8,980 9,154 524 IMRF 14,505 12,747 16,202 15,115 16,831 16,793
Total Personnel Services 180,870 173,013 201,673 169,360 197,728 201,193
531 Maintenance Service 41,842 55,786 70,000 67,000 70,000 70,000 544 Medical Services - - - 75 - - 562 Telephone 641 668 660 660 660 660 563 Publishing 30 - - - - - 571 Dues 166 226 510 510 510 510 572 Travel 15 7 - - - - 573 Training 1,658 180 1,500 1,500 1,500 1,500 595 Rentals 939 1,104 1,000 1,000 1,000 1,000 599 Other Contractual Services - 375 1,000 1,000 1,000 1,000
Total Contractual Services 45,292 58,346 74,670 71,745 74,670 74,670
601 Maintenance Supplies 73,941 63,952 78,000 71,500 78,000 78,000 622 Office Equipment 37 - - - - - 624 Operating Supplies 2,336 3,680 10,685 10,100 10,685 10,685 625 Small Tools 94 8 3,200 3,200 3,200 3,200 626 Janitorial Supplies 29 - 500 500 500 500 627 Motor Fuel & Lubricants 5,941 4,762 12,620 11,120 11,120 11,120 631 Clothing 1,464 1,473 1,650 1,600 1,650 1,650 641 Books - 33 - - - - 663 Computer Software 2,681 500 1,970 500 3,570 3,570
Total Commodities 86,524 74,408 108,625 98,520 108,725 108,725
Total Fleet Maintenance 312,686$ 305,768$ 384,968$ 339,625$ 381,123$ 384,588$ DRAFT
65

CITY OF GENEVA, ILLINOISBudget Detail by Division
Fiscal Year Ending April 30, 2022 & 2023
Fund 100 - General Fund
Division 93 - Engineering/Division 94 - Storm Drainage
2018-2019 2019-2020 2020-2021 2020-2021 2021-2022 2022-2023Account Description Actual Actual Budget Projected Budget Forecast
Expenditures
Engineering
501 Wages - Regular 174,038$ 168,336$ 178,264$ 174,835$ 181,484$ 184,530$ 502 Wages - Part-time/Seasonal 344 653 875 - - - 503 Overtime 123 195 - - - - 504 Stand-by 343 - - - - - 521 Group Insurance 32,582 30,680 37,460 38,645 39,990 40,689 522 Medicare 2,433 2,365 2,599 2,430 2,632 2,675 523 Social Security 10,358 10,044 10,933 9,860 11,099 11,304 524 IMRF 19,054 17,076 20,334 19,930 21,267 21,290
Total Personnel Services 239,275 229,349 250,465 245,700 256,472 260,488
531 Maintenance Service 1,029 721 920 925 920 960 542 Engineering Service 25,048 22,499 20,000 22,500 20,000 20,000 544 Medical Service 510 297 90 300 90 90 546 Janitorial Service 2,401 2,408 2,520 2,520 2,520 2,520 559 Other Professional Services 55 57 50 590 50 50 561 Postage 697 608 505 610 505 505 562 Telephone 5,062 6,233 4,800 6,500 6,000 4,800 563 Publishing 698 - 500 500 500 500 564 Printing 60 218 500 220 250 250 566 Recording Fees 220 - 350 100 350 350 571 Dues 103 112 590 590 590 590 572 Travel 1,023 604 1,080 605 1,080 1,080 573 Training 2,012 682 3,300 700 3,300 3,300 595 Rentals 566 695 655 740 740 680
Total Contractual Services 39,485 35,133 35,860 37,400 36,895 35,675
601 Maintenance Supplies 15 - 100 50 100 100 621 Office Supplies 719 743 1,000 1,000 1,000 1,000 622 Office Equipment 803 613 1,000 1,000 1,000 1,000 624 Operating Supplies 197 181 950 300 950 950 626 Janitorial Supplies 30 19 50 50 50 50 627 Motor Fuel & Lubricants 1,320 1,593 2,040 1,300 1,300 1,300 631 Clothing 1,067 1,327 1,350 1,350 1,350 1,350 632 Per Copy Charge 281 285 360 360 360 360 641 Books - 52 - 55 - -
Total Commodities 4,431 4,812 6,850 5,465 6,110 6,110
917 Employee Awards 50 525 200 200 50 - Total Other Expenditures 50 525 200 200 50 -
Total Engineering 283,241 269,818 293,375 288,765 299,527 302,273
GIS
501 Wages - Regular 8,986 7,573 7,394 7,235 7,550 7,757 503 Wages - Overtime - (77) - - - - 521 Group Insurance 1,667 1,646 1,662 1,820 1,961 1,995
DRAFT
66

CITY OF GENEVA, ILLINOISBudget Detail by Division
Fiscal Year Ending April 30, 2022 & 2023
Fund 100 - General Fund
Division 93 - Engineering/Division 94 - Storm Drainage
2018-2019 2019-2020 2020-2021 2020-2021 2021-2022 2022-2023Account Description Actual Actual Budget Projected Budget Forecast
Expenditures
522 Medicare 125 105 107 100 109 113 523 Social Security 535 449 458 425 468 481 524 IMRF 1,053 723 843 825 885 884
Total Personnel Services 12,366 10,420 10,464 10,405 10,973 11,230
572 Travel - - 150 150 150 150 Total Contractual Services - - 150 150 150 150
601 Maintenance Supplies - - 75 75 75 75 621 Office Supplies - - 80 80 80 80 624 Operating Supplies - - 60 60 60 60 625 Small Tools - - 50 50 50 50
Total Commodities - - 265 265 265 265
Total GIS 12,366 10,420 10,879 10,820 11,388 11,645
Storm Drainage
501 Wages - Regular 26,523 26,830 28,461 25,885 28,888 29,448 503 Overtime 5 57 - - - - 504 Stand-By - (34) - 200 - - 521 Group Insurance 8,113 8,440 8,901 8,260 9,217 9,385 522 Medicare 366 371 413 360 419 426 523 Social Security 1,566 1,586 1,765 1,525 1,791 1,828 524 IMRF 2,869 2,737 3,245 2,965 3,386 3,395
Total Personnel Services 39,442 39,987 42,785 39,195 43,701 44,482
599 Other Contractual Services 3,336 4,871 2,500 2,500 5,000 5,000 Total Contractual Services 3,336 4,871 2,500 2,500 5,000 5,000
601 Maintenance Supplies 8,524 11,550 13,500 13,500 11,000 11,000 624 Operating Supplies 2,500 889 2,500 2,500 2,500 2,500
Total Commodities 11,024 12,439 16,000 16,000 13,500 13,500
914 State/Federal Permit Fees 500 500 500 500 500 500 Total Other Expenditures 500 500 500 500 500 500
Total Storm Drainage 54,302 57,797 61,785 58,195 62,701 63,482
Total Engineering & Storm Drainage 349,909$ 338,035$ 366,039$ 357,780$ 373,616$ 377,400$
DRAFT
67

2018-2019 2019-2020 2020-2021 2020-2021 2021-2022 2022-2023Account Description Actual Actual Budget Projected Budget Forecast
Revenues and Other Financing Sources
445 Motor Fuel Tax 545,642$ 793,201$ 820,000$ 765,000$ 760,000$ 760,000$ 448 State/Local Grants - - - 472,205 472,205 472,205
Total Intergovernmental Revenues 545,642 793,201 820,000 1,237,205 1,232,205 1,232,205
481 Interest Income 13,226 22,491 20,000 2,800 2,400 2,400 Total Other Revenues 13,226 22,491 20,000 2,800 2,400 2,400
Total Revenues and Other Financing Sources 558,868$ 815,692$ 840,000$ 1,240,005$ 1,234,605$ 1,234,605$
Expenditures and Other Financing Uses
920 Reimbursed MFT Expenditures 585,522$ 402,706$ 550,000$ 550,000$ 550,000$ 550,000$ Total Other Expenditures 585,522 402,706 550,000 550,000 550,000 550,000
999 Source of Reserves - - 290,000 - 684,605 684,605 Total Other Financing Sources - - 290,000 - 684,605 684,605
Total Expenditures and Other Financing Uses 585,522$ 402,706$ 840,000$ 550,000$ 1,234,605$ 1,234,605$
CITY OF GENEVA, ILLINOISBudget Detail by Account
Fiscal Year Ending April 30, 2022 & 2023
Fund 214 - Motor Fuel Tax Fund
DRAFT
68

2018-2019 2019-2020 2020-2021 2020-2021 2021-2022 2022-2023Account Description Actual Actual Budget Projected Budget Forecast
Revenues and Other Financing Sources
481 Interest Income 639$ 516$ 600$ 15$ 100$ 100$ 486 Donations 17,438 3,564 11,975 - 11,975 11,975 487 Special Event Fees 3,904 4,940 4,250 - 4,250 4,250 489 Miscellaneous - 867 200 - 200 200
Total Other Revenue 21,981 9,886 17,025 15 16,525 16,525
499 Reappropriation - - 25,385 - 23,740 23,490 Total Other Financing Sources - - 25,385 - 23,740 23,490
Total Revenues and Other Financing Sources 21,981$ 9,886$ 42,410$ 15$ 40,265$ 40,015$ - -
Expenditures and Other Financing Uses
547 Banking Service 114$ 117$ 150$ 150$ 150$ 150$ 551 Advertising 250 250 450 200 - - 559 Other Professional Services 826 550 200 - 500 500 561 Postage 162 - 400 - - - 564 Printing 828 3,132 3,460 3,360 3,860 3,860 565 Internet 20 21 25 25 25 25 571 Dues & Subscriptions 146 50 100 50 100 100 572 Travel & Meals 320 - 100 - - - 573 Training & Professional Development - - 250 - - - 595 Rentals 2,926 1,551 2,095 2,000 2,250 2,000 598 Program Support 2,000 4,439 2,000 4,440 - - 599 Other Contractual Services 19,602 7,100 26,400 7,100 27,900 27,900
Total Contractual Services 27,195 17,210 35,630 17,325 34,785 34,535
621 Office Supplies 71 19 300 100 200 200 624 Operating Supplies 13 - 430 - 430 430 632 Copy Charges 4 7 150 25 100 100
Total Commodities 88 26 880 125 730 730
913 Community Relations 280 250 5,900 250 4,750 4,750 Total Other Expenditures 280 250 5,900 250 4,750 4,750
Total Expenditures and Other Financing Uses 27,563$ 17,486$ 42,410$ 17,700$ 40,265$ 40,015$
CITY OF GENEVA, ILLINOISBudget Detail by Account
Fiscal Year Ending April 30, 2022 & 2023
Fund 216 - Cultural Arts Commission Fund
DRAFT
69

2018-2019 2019-2020 2020-2021 2020-2021 2021-2022 2022-2023Account Description Actual Actual Budget Projected Budget Forecast
Revenues and Other Financing Sources
469 Sale of Materials 825$ -$ 1,820$ 400$ 1,820$ 1,820$ Total Service Charges 825 - 1,820 400 1,820 1,820
481 Interest Income 303 823 350 200 200 200 486 Donations 1,115 200 6,500 500 6,500 6,500 487 Special Event Fees 3,643 4,045 1,500 4,000 4,000 4,000 489 Miscellaneous Income 1,150 - 100 250 250 250
Total Other Revenues 6,211 5,068 8,450 4,950 10,950 10,950
491 Transfers In - General Fund 3,500 3,500 3,500 3,500 3,500 3,500 499 Reappropriation - - 1,560 - - -
Total Other Financing Sources 3,500 3,500 5,060 3,500 3,500 3,500
Total Revenues and Other Financing Sources 10,536$ 8,568$ 15,330$ 8,850$ 16,270$ 16,270$
Expenditures and Other Financing Uses
547 Banking Service 3$ 6$ 200$ 200$ 200$ 200$ 559 Other Professional Services 90 - - - - - 561 Postage - - 145 - 145 145 564 Printing 22 - - - - - 571 Dues & Subscriptions 100 100 100 100 100 100 572 Travel & Meals 1,901 815 1,800 1,800 1,800 1,800 595 Rentals 900 - - - - - 599 Other Contractual Services - - - - - -
Total Contractual Services 3,016 922 2,245 2,100 2,245 2,245
621 Office Supplies 24 36 60 60 60 60 624 Operating Supplies 13,258 1,694 13,000 8,000 13,000 13,000 632 Per Copy Charges 19 - 25 25 25 25
Total Commodities 13,301 1,729 13,085 8,085 13,085 13,085
999 Source of Reserves - - - - 940 940 Total Other Financing Uses - - - - 940 940
Total Expenditures and Other Financing Uses 16,317$ 2,651$ 15,330$ 10,185$ 16,270$ 16,270$
CITY OF GENEVA, ILLINOISBudget Detail by Account
Fiscal Year Ending April 30, 2022 & 2023
Fund 217 - SPAC Fund
DRAFT
70

2018-2019 2019-2020 2020-2021 2020-2021 2021-2022 2022-2023Account Description Actual Actual Budget Projected Budget Forecast
Revenues and Other Financing Sources
481 Interest Income 532$ 321$ 500$ 10$ 10$ 10$ 486 Donations 7,780 8,569 3,100 2,640 3,100 3,100
Total Other Revenues 8,312 8,890 3,600 2,650 3,110 3,110
491 Transfers In - General Fund - - - - - - 499 Reappropriation - - 11,400 - 12,265 11,915
Total Other Financing Sources - - 11,400 - 12,265 11,915
Total Revenues and Other Financing Sources 8,312$ 8,890$ 15,000$ 2,650$ 15,375$ 15,025$
Expenditures and Other Financing Uses
531 Maintenance Services -$ 2,000$ 2,050$ 1,500$ 1,900$ 1,550$ 547 Banking Services 20 22 50 25 25 25 561 Postage 66 - 100 - 500 500 564 Printing 397 - 500 - 300 300 599 Other Contractual Services 4,607 - - - - -
Total Contractual Services 5,090 2,022 2,700 1,525 2,725 2,375
624 Operating Supplies 13,229 10,832 12,300 12,650 12,650 12,650 Total Commodities 13,229 10,832 12,300 12,650 12,650 12,650
Total Expenditures and Other Financing Uses 18,319$ 12,854$ 15,000$ 14,175$ 15,375$ 15,025$
CITY OF GENEVA, ILLINOISBudget Detail by Account
Fiscal Year Ending April 30, 2022 & 2023
Fund 218 - Beautification Fund
DRAFT
71

2018-2019 2019-2020 2020-2021 2020-2021 2021-2022 2022-2023Account Description Actual Actual Budget Projected Budget Forecast
Revenues and Other Financing Sources
414 Hotel/Motel Tax 257,496$ 258,148$ 255,000$ 140,000$ 191,250$ 255,000$ Total Taxes 257,496 258,148 255,000 140,000 191,250 255,000
481 Interest Income 2,182 1,954 1,500 75 100 100 489 Miscellaneous - - 25,000 - - -
Total Other Revenues 2,182 1,954 26,500 75 100 100
499 Reappropriation - - 113,615 - - 101,020 Total Other Financing Sources - - 113,615 - - 101,020
Total Revenues and Other Financing Sources 259,678$ 260,102$ 395,115$ 140,075$ 191,350$ 356,120$
Expenditures and Other Financing Uses
501 Wages - Regular 26,518$ 32,612$ 30,879$ 30,212$ 31,449$ 32,233$ 502 Wages - Part-Time/Seasonal 23,128 11,555 24,044 23,455 33,120 29,476 521 Group Insurance 5,562 8,935 8,862 7,325 7,463 7,593 522 Medicare 697 618 796 755 936 894 523 Social Security 2,979 2,643 3,333 3,220 3,952 3,785 524 IMRF 2,837 3,031 3,520 3,445 3,686 3,729 528 Unemployment Compensation 699 - - - - -
Total Personnel Services 62,420 59,395 71,434 68,412 80,606 77,710
531 Maintenance Services - 3,094 - 10,215 18,464 18,460 559 Other Professional Services - - 40,001 - - 40,000 561 Postage - - 100 50 100 100 564 Printing 434 41 2,400 2,100 2,100 2,100 571 Dues & Subscriptions 207 84 150 150 150 150 572 Travel & Meals 185 72 250 150 250 250 573 Training & Professional Development - - 200 100 200 200 575 Publications - - 150 50 150 150 598 Program Support 185,688 169,903 186,150 90,000 49,150 186,150 599 Other Contractual Services 2,692 - 22,865 - 1,000 1,000
Total Contractual Services 189,207 173,193 252,266 102,815 71,564 248,560
621 Office Supplies 56 87 150 100 150 150 624 Operating Supplies - 137 50 50 50 50 632 Per Copy Charges - 10 150 50 150 150
Total Commodities 56 234 350 200 350 350
815 Improvement Other than Buildings - 23,364 71,065 50,000 30,000 29,500 Total Capital Outlay - 23,364 71,065 50,000 30,000 29,500
999 Source of Reserves - - - - 8,830 - Total Other Financing Uses - - - - 8,830 -
Total Expenditures and Other Financing Uses 251,683$ 256,187$ 395,115$ 221,427$ 191,350$ 356,120$
CITY OF GENEVA, ILLINOISBudget Detail by Account
Fiscal Year Ending April 30, 2022 & 2023
Fund 219 - Tourism Fund
DRAFT
72

2018-2019 2019-2020 2020-2021 2020-2021 2021-2022 2022-2023Account Description Actual Actual Budget Projected Budget Forecast
Revenues and Other Financing Sources
440 Sales Tax -$ 4,530$ 1,000$ 13,500$ 13,500$ 13,500$ Total Taxes - 4,530 1,000 13,500 13,500 13,500
457 Restricted Police Fines 34,001 27,922 22,000 22,000 22,000 22,000 Total Fines & Forfeits 34,001 27,922 22,000 22,000 22,000 22,000
499 Reappropriation - - 6,720 - - - Total Other Financing Sources - - 6,720 - - -
Total Revenues and Other Financing Sources 34,001$ 32,452$ 29,720$ 35,500$ 35,500$ 35,500$
Expenditures and Other Financing Uses
503 Overtime -$ -$ 2,500$ -$ 2,500$ 2,500$ 521 Group Insurance - - 83 - 81 81 522 Medicare - - 36 - 36 36
Total Personnel Services - - 2,619 - 2,617 2,617
531 Maintenance Service 5,992 5,438 11,101 11,200 13,103 11,103 573 Training & Professional Development - - 1,000 1,000 1,000 1,000
Total Contractual Services 5,992 5,438 12,101 12,200 14,103 12,103
601 Maintenance Supplies 2,228 912 7,000 - 7,000 7,000 624 Operating Supplies - 175 6,000 6,000 6,000 6,000 631 Clothing Allowance - - 2,000 2,000 3,000 2,000
Total Commodities 2,228 1,087 15,000 8,000 16,000 15,000
999 Source of Reserves - - - - 2,780 5,780 Total Other Financing Uses - - - - 2,780 5,780
Total Expenditures and Other Financing Uses 8,220$ 6,526$ 29,720$ 20,200$ 35,500$ 35,500$
CITY OF GENEVA, ILLINOISBudget Detail by Account
Fiscal Year Ending April 30, 2022 & 2023
Fund 235 - Restricted Police Fines Fund
DRAFT
73

2018-2019 2019-2020 2020-2021 2020-2021 2021-2022 2022-2023Account Description Actual Actual Budget Projected Budget Forecast
Revenues and Other Financing Sources
471 General Government Fees 32,569$ 31,146$ 33,500$ 30,000$ 29,000$ 28,000$ Total Fines & Forfeits 32,569 31,146 33,500 30,000 29,000 28,000
481 Interest Income 2,041 3,524 2,300 1,500 1,600 1,600 Total Other Revenues 2,041 3,524 2,300 1,500 1,600 1,600
499 Reappropriation - - 3,700 - - - Total Other Financing Sources - - 3,700 - - -
Total Revenues and Other Financing Sources 34,611$ 34,670$ 39,500$ 31,500$ 30,600$ 29,600$
Expenditures and Other Financing Uses
622 Office Equipment 232$ 962$ -$ -$ -$ -$ 623 Office Furniture - - - 2,320 - -
Total Commodities 232 962 - 2,320 - -
810 Buildings & Improvements 7,456 - - - - - 835 Computer Equipment 29,480 80 39,500 20,000 25,000 25,000
Total Capital Outlay 36,936 80 39,500 20,000 25,000 25,000
999 Source of Reserves - - - - 5,600 4,600 Total Other Financing Uses - - - - 5,600 4,600
Total Expenditures and Other Financing Uses 37,168$ 1,042$ 39,500$ 22,320$ 30,600$ 29,600$
CITY OF GENEVA, ILLINOISBudget Detail by Account
Fiscal Year Ending April 30, 2022 & 2023
Fund 240 - PEG Fund
DRAFT
74

2018-2019 2019-2020 2020-2021 2020-2021 2021-2022 2022-2023Account Description Actual Actual Budget Projected Budget Forecast
Revenues and Other Financing Sources
410 Property Tax 154,795$ 154,580$ 178,000$ 178,000$ 178,000$ 178,000$ Total Taxes 154,795 154,580 178,000 178,000 178,000 178,000
481 Interest Income 40 1,246 600 200 25 25 486 Donations Gifts - - - - - - 499 Reappropriation - - - - 1,750 1,750
Total Other Revenues 40 1,246 600 200 1,775 1,775
Total Revenues and Other Financing Sources 154,835$ 155,826$ 178,600$ 178,200$ 179,775$ 179,775$
Expenditures and Other Financing Uses
559 Other Professional Services 1,200$ 1,275$ 2,000$ 1,000$ 2,000$ 2,000$ 571 Dues & Subscriptions 500 1,000 775 775 775 775
Total Contractual Services 1,700 2,275 2,775 1,775 2,775 2,775
915 Charitable Donations 141,000 185,000 175,825 200,000 177,000 177,000 Total Other Expenditures 141,000 185,000 175,825 200,000 177,000 177,000
999 Source of Reserves - - - - - - Total Other Financing Uses - - - - - -
Total Expenditures and Other Financing Uses 142,700$ 187,275$ 178,600$ 201,775$ 179,775$ 179,775$
CITY OF GENEVA, ILLINOISBudget Detail by Account
Fiscal Year Ending April 30, 2022 & 2023
Fund 242 - Mental Health
DRAFT
75

2018-2019 2019-2020 2020-2021 2020-2021 2021-2022 2022-2023Account Description Actual Actual Budget Projected Budget Forecast
Revenues and Other Financing Sources
411 Foreign Fire Insurance Tax 51,380$ 53,124$ 52,000$ 59,675$ 60,000$ 60,000$ Total Taxes 51,380 53,124 52,000 59,675 60,000 60,000
473 Public Safety Fees 2,100 2,580 2,500 - 2,500 2,500 Total Service Fees 2,100 2,580 2,500 - 2,500 2,500
481 Interest Income 8 10 5 10 10 10 485 Reimbursed Expenditures 120 500 - - - - 489 Miscellaneous 1,143 - - - - -
Total Other Revenues 1,271 510 5 10 10 10
Total Revenues and Other Financing Sources 54,751$ 56,215$ 54,505$ 59,685$ 62,510$ 62,510$
Expenditures and Other Financing Uses
531 Maintenance Service -$ 6,348$ -$ -$ -$ -$ 547 Banking Service 85 99 100 100 100 100 571 Dues & Subscriptions - - 250 250 250 250 572 Travel & Meals (26) - - - - - 573 Training & Professional Development - 1,000 5,000 5,000 5,000 5,000 592 General Insurance 194 194 195 195 195 195
Total Contractual Services 253 7,641 5,545 5,545 5,545 5,545
601 Maintenance Supplies - 257 500 500 500 500 622 Office Equipment - 232 - - - - 623 Office Furniture 8,524 - - 1,305 - - 624 Operating Supplies 6,789 8,248 20,000 20,000 20,000 20,000 631 Clothing 6,327 3,451 3,200 3,200 3,200 3,200
Total Commodities 21,640 12,188 23,700 25,005 23,700 23,700
810 Buildings & Improvements - 9,977 - - - - 820 Machinery & Equipment 14,512 - - - - -
Total Capital Outlay 14,512 9,977 - - - -
913 Community Relations 300 2,591 1,500 1,500 1,500 1,500 917 Employee Awards 3,871 6,394 2,000 2,000 2,000 2,000
Total Other Expenditures 4,171 8,985 3,500 3,500 3,500 3,500
999 Source of Reserves - - 21,760 26,455 29,765 29,765 Total Other Financing Uses - - 21,760 26,455 29,765 29,765
Total Expenditures and Other Financing Uses 40,576$ 38,790$ 54,505$ 60,505$ 62,510$ 62,510$
CITY OF GENEVA, ILLINOISBudget Detail by Account
Fiscal Year Ending April 30, 2022 & 2023
Fund 245 - Foreign Fire Insurance Board
DRAFT
76

2018-2019 2019-2020 2020-2021 2020-2021 2021-2022 2022-2023Account Description Actual Actual Budget Projected Budget Forecast
Revenues and Other Financing Sources
410 Property Tax 209,339$ 207,625$ 146,435$ 206,035$ 205,335$ 201,630$ Total Taxes 209,339 207,625 146,435 206,035 205,335 201,630
451 Parking Violations 68,869 60,280 61,000 8,400 640 47,460 Total Fines & Forfeits 68,869 60,280 61,000 8,400 640 47,460
481 Interest Income 3,269 4,525 2,600 750 750 750 Total Other Revenues 3,269 4,525 2,600 750 750 750
499 Reappropriation - - 89,590 - 105,555 31,825 Total Other Financing Sources - - 89,590 - 105,555 31,825
Total Revenues and Other Financing Sources 281,476$ 272,430$ 299,625$ 215,185$ 312,280$ 281,665$
Expenditures and Other Financing Uses
501 Wages - Regular 85,535$ 90,026$ 94,044$ 90,760$ 96,012$ 98,294$ 502 Wages - Part-Time - - 6,000 - 6,240 - 503 Overtime 8,812 2,329 - - - - 504 Stand-by 508 3,363 - - - - 521 Group Insurance 26,335 30,181 31,824 30,665 33,062 32,874 522 Medicare 1,315 1,325 1,450 1,255 1,481 1,426 523 Social Security 5,519 5,561 6,058 5,060 6,207 5,968 524 IMRF 10,010 9,600 10,722 10,365 11,251 11,353 528 Unemployment Compensation 350 - - - - -
Total Personnel Services 138,383 142,386 150,098 138,105 154,253 149,915
531 Maintenance Service 38,539 12,632 28,450 28,450 28,450 28,450 547 Banking Fees 296 298 350 100 352 350 561 Postage 652 496 2,100 150 1,100 1,100 564 Printing 893 926 570 570 570 1,200 583 Garbage Disposal - 42,878 11,580 26,875 26,875 26,875 595 Rentals 14,289 14,405 14,840 14,840 14,840 14,840
Total Contractual Services 54,670 71,635 57,890 70,985 72,187 72,815
601 Maintenance Supplies 7,252 4,963 11,200 11,100 11,200 11,200 621 Office Supplies 4 87 - - - - 622 Office Equipment - - 5,002 - - - 624 Operating Supplies 3,874 1,741 13,100 13,100 15,300 9,100 625 Small Tools 372 21 500 500 500 500 663 Computer Software 3,600 8,100 10,800 8,505 8,505 8,505
Total Commodities 15,102 14,912 40,602 33,205 35,505 29,305
820 Machinery & Equipment - - 20,000 - 20,000 - 835 Computer Equipment 4,476 - - - - -
Total Capital Outlay 4,476 - 20,000 - 20,000 -
705 Principal 29,000 29,000 29,000 29,000 29,000 29,000 710 Interest 3,436 2,735 2,035 2,035 1,335 630
Total Debt Service 32,436 31,735 31,035 31,035 30,335 29,630
Total Expenditures and Other Financing Uses 245,066$ 260,667$ 299,625$ 273,330$ 312,280$ 281,665$
CITY OF GENEVA, ILLINOISBudget Detail by Account
Fiscal Year Ending April 30, 2022 & 2023
Fund 251 - SSA #1
DRAFT
77

2018-2019 2019-2020 2020-2021 2020-2021 2021-2022 2022-2023Description Actual Actual Budget Projected Budget Forecast
40 Administrative ServicesDebt Service 32,436 31,735 31,035 31,035 30,335 29,630 Total 32,436 31,735 31,035 31,035 30,335 29,630
70 PolicePersonnel Services 27,133 28,617 29,266 28,715 29,926 30,532 Contractual Services 1,841 1,720 3,020 820 2,022 2,650 Commodities 3,604 8,187 15,802 8,505 8,505 8,505 Capital Outlay 4,476 - - - - - Total 37,054 38,524 48,088 38,040 40,453 41,687
90 Public WorksPersonnel Services 111,249 113,769 120,832 109,390 124,327 119,383 Contractual Services 52,829 69,915 54,870 70,165 70,165 70,165 Commodities 11,498 6,725 24,800 24,700 27,000 20,800 Capital Outlay - - 20,000 - 20,000 - Total 175,576 190,408 220,502 204,255 241,492 210,348
Total SSA #1 245,066 260,667 299,625 273,330 312,280 281,665 - - - - - -
Total SSA #1Personnel Services 138,383$ 142,386$ 150,098$ 138,105$ 154,253$ 149,915$ Contractual Services 54,670 71,635 57,890 70,985 72,187 72,815 Commodities 15,102 14,912 40,602 33,205 35,505 29,305 Debt Service 32,436 31,735 31,035 31,035 30,335 29,630 Capital Outlay 4,476 - 20,000 - 20,000 - Total 245,066 260,667 299,625 273,330 312,280 281,665
CITY OF GENEVA, ILLINOISExpenditure Budget Summary by Department & Classification
Fiscal Year Ending April 30, 2022 & 2023
Fund 251 - SSA #1
DRAFT
78
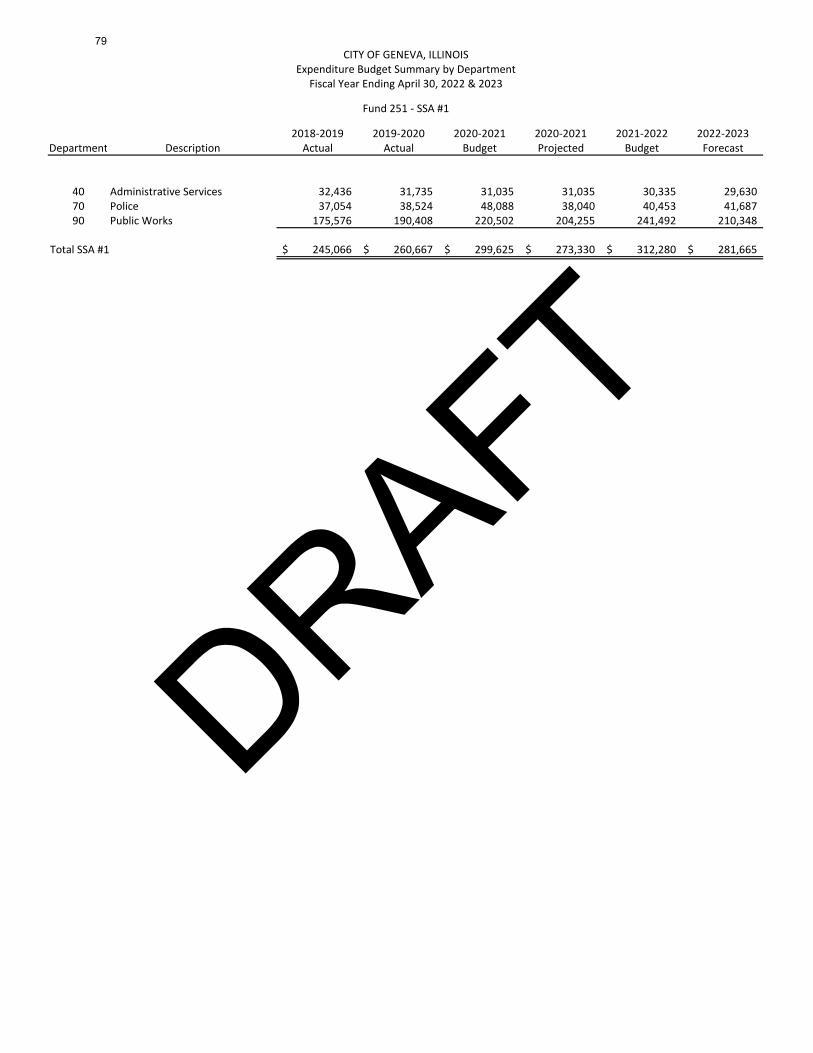
2018-2019 2019-2020 2020-2021 2020-2021 2021-2022 2022-2023Department Description Actual Actual Budget Projected Budget Forecast
40 Administrative Services 32,436 31,735 31,035 31,035 30,335 29,630 70 Police 37,054 38,524 48,088 38,040 40,453 41,687 90 Public Works 175,576 190,408 220,502 204,255 241,492 210,348
Total SSA #1 245,066$ 260,667$ 299,625$ 273,330$ 312,280$ 281,665$
CITY OF GENEVA, ILLINOISExpenditure Budget Summary by Department
Fiscal Year Ending April 30, 2022 & 2023
Fund 251 - SSA #1
DRAFT
79

2017-2018 2019-2020 2020-2021 2020-2021 2021-2022 2022-2023Account Description Actual Actual Budget Projected Budget Forecast
Expenditures
Administration
705 Principal 29,000 29,000 29,000 29,000 29,000 29,000 710 Interest 3,436 2,735 2,035 2,035 1,335 630
Total Debt Service 32,436 31,735 31,035 31,035 30,335 29,630
Total Administration 32,436 31,735 31,035 31,035 30,335 29,630
Community Service
501 Wages - Regular 18,707 19,935 20,014 19,585 20,336 20,794 503 Overtime 40 - - - - - 521 Group Insurance 4,991 5,263 5,440 5,455 5,650 5,758 522 Medicare 260 277 290 275 294 302 523 Social Security 1,113 1,185 1,240 1,165 1,262 1,290 524 IMRF 2,022 1,956 2,282 2,235 2,384 2,388
Total Personnel Services 27,133 28,617 29,266 28,715 29,926 30,532
547 Telephone 296 298 350 100 352 350 564 Other Contractual Services 893 926 570 570 570 1,200 561 Postage 652 496 2,100 150 1,100 1,100
Total Contractual Services 1,841 1,720 3,020 820 2,022 2,650
621 Office Supplies 4 87 - - - - 622 Office Equipment - - 5,002 - - - 663 Computer Software 3,600 8,100 10,800 8,505 8,505 8,505
Total Commodities 3,604 8,187 15,802 8,505 8,505 8,505
835 Computer Equipment 4,476 - - - - - Total Capital Outlay 4,476 - - - - -
Total Community Service 37,054 38,524 48,088 38,040 40,453 41,687
Public Works
501 Wages - Regular 66,828 70,091 74,030 71,175 75,676 77,500 502 Wages - Part Time/Seasonal - - 6,000 - 6,240 - 503 Overtime 8,771 2,329 - - - - 504 Stand-By 508 3,363 - - - - 521 Group Insurance 21,343 24,918 26,384 25,210 27,412 27,116 522 Medicare 1,054 1,048 1,160 980 1,187 1,124 523 Social Security 4,405 4,376 4,818 3,895 4,945 4,678 524 IMRF 7,989 7,644 8,440 8,130 8,867 8,965
CITY OF GENEVA, ILLINOISBudget Detail by Department
Fiscal Year Ending April 30, 2022 & 2023
Fund 251 - SSA #1
DRAFT
80

2017-2018 2019-2020 2020-2021 2020-2021 2021-2022 2022-2023Account Description Actual Actual Budget Projected Budget Forecast
Expenditures
CITY OF GENEVA, ILLINOISBudget Detail by Department
Fiscal Year Ending April 30, 2022 & 2023
Fund 251 - SSA #1
528 Unemployment Compensation 350 - - - - - Total Personnel Services 111,249 113,769 120,832 109,390 124,327 119,383
531 Maintenance Service 38,539 12,632 28,450 28,450 28,450 28,450 583 Garbage Disposal - 42,878 11,580 26,875 26,875 26,875 595 Rentals 14,289 14,405 14,840 14,840 14,840 14,840
Total Contractual Services 52,829 69,915 54,870 70,165 70,165 70,165
601 Maintenance Supplies 7,252 4,963 11,200 11,100 11,200 11,200 624 Operating Supplies 3,874 1,741 13,100 13,100 15,300 9,100 625 Small Tools 372 21 500 500 500 500
Total Commodities 11,498 6,725 24,800 24,700 27,000 20,800
820 Machinery & Equipment - - 20,000 - 20,000 - Total Capital Outlay - - 20,000 - 20,000 -
Total Public Works 175,576 190,408 220,502 204,255 241,492 210,348
Total SSA #1 245,066$ 260,667$ 299,625$ 273,330$ 312,280$ 281,665$
DRAFT
81

2018-2019 2019-2020 2020-2021 2020-2021 2021-2022 2022-2023Account Description Actual Actual Budget Projected Budget Forecast
Revenues and Other Financing Sources
410 Property Tax 18,494$ 18,498$ 18,500$ 19,350$ 19,360$ 19,360$ Total Taxes 18,494 18,498 18,500 19,350 19,360 19,360
481 Interest Income 830 1,081 850 100 100 100 Total Other Revenues 830 1,081 850 100 100 100
499 Reappropriation - - 15,270 - 15,445 15,940 Total Other Financing Sources - - 15,270 - 15,445 15,940
Total Revenues and Other Financing Sources 19,324$ 19,579$ 34,620$ 19,450$ 34,905$ 35,400$
Expenditures and Other Financing Uses
531 Maintenance Service 10,049$ 20,017$ 34,620$ 15,120$ 34,905$ 35,400$ Total Contractual Services 10,049 20,017 34,620 15,120 34,905 35,400
Total Expenditures and Other Financing Uses 10,049$ 20,017$ 34,620$ 15,120$ 34,905$ 35,400$
CITY OF GENEVA, ILLINOISBudget Detail by Account
Fiscal Year Ending April 30, 2022 & 2023
Fund 254 - SSA #4 (Randall Square)
DRAFT
82

2018-2019 2019-2020 2020-2021 2020-2021 2021-2022 2022-2023Account Description Actual Actual Budget Projected Budget Forecast
Revenues and Other Financing Sources
410 Property Tax 8,906$ 8,895$ 8,910$ 9,280$ 9,750$ 10,190$ Total Taxes 8,906 8,895 8,910 9,280 9,750 10,190
481 Interest Income 216 303 240 50 50 50 Total Other Revenues 216 303 240 50 50 50
499 Reappropriation - - - - 22,225 - Total Other Financing Sources - - - - 22,225 -
Total Revenues and Other Financing Sources 9,122$ 9,198$ 9,150$ 9,330$ 32,025$ 10,240$
Expenditures and Other Financing Uses
531 Maintenance Service 6,947$ 6,144$ 6,865$ 6,865$ 7,025$ 7,300$ 599 Other Contractual Services - - - - 25,000 -
Total Contractual Services 6,947 6,144 6,865 6,865 32,025 7,300
999 Source of Reserves - - 2,285 - - 2,940 Total Other Financing Uses - - 2,285 - - 2,940
Total Expenditures and Other Financing Uses 6,947$ 6,144$ 9,150$ 6,865$ 32,025$ 10,240$
CITY OF GENEVA, ILLINOISBudget Detail by Account
Fiscal Year Ending April 30, 2022 & 2023
Fund 255 - SSA #5 (Williamsburg)
DRAFT
83

2018-2019 2019-2020 2020-2021 2020-2021 2021-2022 2022-2023Account Description Actual Actual Budget Projected Budget Forecast
Revenues and Other Financing Sources
410 Property Tax 2,885$ 2,880$ 2,885$ 2,885$ 2,885$ 2,885$ Total Taxes 2,885 2,880 2,885 2,885 2,885 2,885
481 Interest Income 150 181 150 60 60 60 Total Other Revenues 150 181 150 60 60 60
499 Reappropriation - - - - 610 750 Total Other Financing Sources - - - - 610 750
Total Revenues and Other Financing Sources 3,035$ 3,062$ 3,035$ 2,945$ 3,555$ 3,695$
Expenditures and Other Financing Uses
531 Maintenance Service 1,759$ 1,814$ 1,880$ 2,800$ 3,555$ 3,695$ 599 Other Contractual Services - - - 1,700 - -
Total Contractual Services 1,759 1,814 1,880 4,500 3,555 3,695
999 Source of Reserves - - 1,155 - - - Total Other Financing Uses - - 1,155 - - -
Total Expenditures and Other Financing Uses 1,759$ 1,814$ 3,035$ 4,500$ 3,555$ 3,695$
CITY OF GENEVA, ILLINOISBudget Detail by Account
Fiscal Year Ending April 30, 2022 & 2023
Fund 257 - SSA #7 (Blackberry)
DRAFT
84

2018-2019 2019-2020 2020-2021 2020-2021 2021-2022 2022-2023Account Description Actual Actual Budget Projected Budget Forecast
Revenues and Other Financing Sources
410 Property Tax 3,147$ 3,145$ 3,150$ 3,265$ 3,305$ 3,305$ Total Taxes 3,147 3,145 3,150 3,265 3,305 3,305
481 Interest Income 193 202 190 50 50 50 Total Other Revenues 193 202 190 50 50 50
499 Reappropriation - - - - 4,330 - Total Other Financing Sources - - - - 4,330 -
Total Revenues and Other Financing Sources 3,340$ 3,347$ 3,340$ 3,315$ 7,685$ 3,355$
Expenditures and Other Financing Uses
531 Maintenance Service 2,679$ 828$ 860$ 2,660$ 7,685$ 2,730$ Total Contractual Services 2,679 828 860 2,660 7,685 2,730
999 Source of Reserves - - 2,480 - - 625 Total Other Financing Uses - - 2,480 - - 625
Total Expenditures and Other Financing Uses 2,679$ 828$ 3,340$ 2,660$ 7,685$ 3,355$
CITY OF GENEVA, ILLINOISBudget Detail by Account
Fiscal Year Ending April 30, 2022 & 2023
Fund 259 - SSA #9 (Geneva Knolls)
DRAFT
85

2018-2019 2019-2020 2020-2021 2020-2021 2021-2022 2022-2023Account Description Actual Actual Budget Projected Budget Forecast
Revenues and Other Financing Sources
410 Property Tax 55,566$ 55,572$ 55,600$ 55,600$ 55,600$ 55,600$ Total Taxes 55,566 55,572 55,600 55,600 55,600 55,600
481 Interest Income 277 1,855 900 500 500 500 Total Other Revenues 277 1,855 900 500 500 500
499 Reappropriation - - 2,540 - 42,940 2,940 Total Other Financing Sources - - 2,540 - 42,940 2,940
Total Revenues and Other Financing Sources 55,842$ 57,427$ 59,040$ 56,100$ 99,040$ 59,040$
Expenditures and Other Financing Uses
531 Maintenance Services 35,500$ 40,600$ 59,040$ 59,040$ 99,040$ 59,040$ Total Contractual Services 35,500 40,600 59,040 59,040 99,040 59,040
Total Expenditures and Other Financing Uses 35,500$ 40,600$ 59,040$ 59,040$ 99,040$ 59,040$
CITY OF GENEVA, ILLINOISBudget Detail by Account
Fiscal Year Ending April 30, 2022 & 2023
Fund 261 - SSA #11 (Eagle Brook)
DRAFT
86

2018-2019 2019-2020 2020-2021 2020-2021 2021-2022 2022-2023Account Description Actual Actual Budget Projected Budget Forecast
Revenues and Other Financing Sources
410 Property Tax 153,914$ 153,701$ 154,000$ 154,000$ 154,000$ 154,000$ Total Taxes 153,914 153,701 154,000 154,000 154,000 154,000
481 Interest Income 1,686 2,693 1,400 600 600 600 Total Other Revenues 1,686 2,693 1,400 600 600 600
Total Revenues and Other Financing Sources 155,600$ 156,394$ 155,400$ 154,600$ 154,600$ 154,600$
Expenditures and Other Financing Uses
531 Maintenance Service 134,121$ 91,942$ 90,900$ 90,900$ 90,900$ 90,900$ 559 Other Professional Services 12,200 2,750 11,000 11,000 11,000 11,000 581 Utilities 12,420 9,103 23,000 23,000 23,000 23,000 599 Other Contractual Services - - - - - -
Total Contractual Services 158,740 103,795 124,900 124,900 124,900 124,900
815 Improvement Other than Buildings - 41,100 - - - - Total Capital Outlay - 41,100 - - - -
999 Source of Reserves - - 30,500 - 29,700 29,700 Total Other Financing Uses - - 30,500 - 29,700 29,700
Total Expenditures and Other Financing Uses 158,740$ 144,895$ 155,400$ 124,900$ 154,600$ 154,600$
CITY OF GENEVA, ILLINOISBudget Detail by Account
Fiscal Year Ending April 30, 2022 & 2023
Fund 266 - SSA #16 (Fisher Farms)
DRAFT
87

2018-2019 2019-2020 2020-2021 2020-2021 2021-2022 2022-2023Account Description Actual Actual Budget Projected Budget Forecast
Revenues and Other Financing Sources
410 Property Tax 3,240$ 3,240$ 3,240$ 3,240$ 3,240$ 3,240$ Total Taxes 3,240 3,240 3,240 3,240 3,240 3,240
481 Interest Income 32 96 30 30 30 30 Total Other Revenues 32 96 30 30 30 30
499 Reappropriation - - - - 2,595 - Total Other Financing Sources - - - - 2,595 -
Total Revenues and Other Financing Sources 3,272$ 3,336$ 3,270$ 3,270$ 5,865$ 3,270$
Expenditures and Other Financing Uses
531 Maintenance Service 787$ 812$ 840$ 840$ 5,865$ 910$ Total Contractual Services 787 812 840 840 5,865 910
999 Source of Reserves - - 2,430 - - 2,360 Total Other Financing Uses - - 2,430 - - 2,360
Total Expenditures and Other Financing Uses 787$ 812$ 3,270$ 840$ 5,865$ 3,270$
CITY OF GENEVA, ILLINOISBudget Detail by Account
Fiscal Year Ending April 30, 2022 & 2023
Fund 268 - SSA #18 (Wildwood)
DRAFT
88

2018-2019 2019-2020 2020-2021 2020-2021 2021-2022 2022-2023Account Description Actual Actual Budget Projected Budget Forecast
Revenues and Other Financing Sources
410 Property Tax 1,109$ 1,109$ 1,110$ 1,105$ 1,110$ 1,110$ Total Taxes 1,109 1,109 1,110 1,105 1,110 1,110
481 Interest Income 107 112 50 25 25 25 Total Other Revenues 107 112 50 25 25 25
499 Reappropriation - - - - 7,660 750 Total Other Financing Sources - - - - 7,660 750
Total Revenues and Other Financing Sources 1,216$ 1,221$ 1,160$ 1,130$ 8,795$ 1,885$
Expenditures and Other Financing Uses
531 Maintenance Services 787$ 924$ 840$ 840$ 8,795$ 1,885$ Total Contractual Services 787 924 840 840 8,795 1,885
999 Source of Reserves - - 320 - - - Total Other Financing Uses - - 320 - - -
Total Expenditures and Other Financing Uses 787$ 924$ 1,160$ 840$ 8,795$ 1,885$
CITY OF GENEVA, ILLINOISBudget Detail by Account
Fiscal Year Ending April 30, 2022 & 2023
Fund 273 - SSA #23 (Sunset Meadows)
DRAFT
89

2018-2019 2019-2020 2020-2021 2020-2021 2021-2022 2022-2023Account Description Actual Actual Budget Projected Budget Forecast
Revenues and Other Financing Sources
410 Property Tax 7,447$ 7,450$ 7,450$ 7,810$ 8,165$ 8,530$ Total Taxes 7,447 7,450 7,450 7,810 8,165 8,530
481 Interest Income 3 124 40 25 25 25 Total Other Revenues 3 124 40 25 25 25
499 Reappropriation - - - - 19,175 - Total Other Financing Sources - - - - 19,175 -
Total Revenues and Other Financing Sources 7,450$ 7,574$ 7,490$ 7,835$ 27,365$ 8,555$
Expenditures and Other Financing Uses
531 Maintenance Services 3,027$ 2,219$ 2,370$ 2,370$ 27,365$ 2,485$ Total Contractual Services 3,027 2,219 2,370 2,370 27,365 2,485
999 Source of Reserves - - 5,120 - - 6,070 Total Other Financing Uses - - 5,120 - - 6,070
Total Expenditures and Other Financing Uses 3,027$ 2,219$ 7,490$ 2,370$ 27,365$ 8,555$
CITY OF GENEVA, ILLINOISBudget Detail by Account
Fiscal Year Ending April 30, 2022 & 2023
Fund 276 - SSA #26 (Westhaven)
DRAFT
90

2018-2019 2019-2020 2020-2021 2020-2021 2021-2022 2022-2023Account Description Actual Actual Budget Projected Budget Forecast
Revenues and Other Financing Sources
410 Property Tax 3,000$ 3,090$ 3,185$ 3,185$ 3,280$ 3,375$ Total Taxes 3,000 3,090 3,185 3,185 3,280 3,375
481 Interest Income 1 10 - 5 - - Total Other Revenues 1 10 - 5 - -
Total Revenues and Other Financing Sources 3,001$ 3,100$ 3,185$ 3,190$ 3,280$ 3,375$
Expenditures and Other Financing Uses
531 Maintenance Services 3,000$ 3,000$ 3,000$ 3,000$ 3,000$ 3,000$ Total Contractual Services 3,000 3,000 3,000 3,000 3,000 3,000
999 Source of Reserves - - 185 - 280 375 Total Other Financing Uses - - 185 - 280 375
Total Expenditures and Other Financing Uses 3,000$ 3,000$ 3,185$ 3,000$ 3,280$ 3,375$
CITY OF GENEVA, ILLINOISBudget Detail by Account
Fiscal Year Ending April 30, 2022 & 2023
Fund 282 - SSA #32 (On Brentwood's Pond)
DRAFT
91

2018-2019 2019-2020 2020-2021 2020-2021 2021-2022 2022-2023Account Description Actual Actual Budget Projected Budget Forecast
Revenues and Other Financing Sources
410 Property Tax 1,020,714$ 656,371$ 699,400$ 702,640$ 270,000$ -$ Total Taxes 1,020,714 656,371 699,400 702,640 270,000 -
481 Interest Income 6,466 14,477 5,400 1,000 2,200 - Total Other Revenues 6,466 14,477 5,400 1,000 2,200 -
491 Transfer In 1,000,000 - - - - - 499 Reappropriation - - - - 378,100 -
Total Other Financing Sources 1,000,000 - - - 378,100 -
Total Revenues and Other Financing Sources 2,027,180$ 670,848$ 704,800$ 703,640$ 650,300$ -$
Expenditures and Other Financing Uses
705 Principal 1,870,000$ 575,000$ 650,000$ 650,000$ 625,000$ -$ 710 Interest 141,950 76,650 49,400 49,400 24,200 - 715 Paying Agent Fees 1,417 1,341 1,100 1,100 1,100 -
Total Debt Service 2,013,367 652,991 700,500 700,500 650,300 -
999 Source of Reserves - - 4,300 - - - Other Expenditures - - 4,300 - - -
Total Expenditures and Other Financing Uses 2,013,367$ 652,991$ 704,800$ 700,500$ 650,300$ -$
CITY OF GENEVA, ILLINOISBudget Detail by Account
Fiscal Year Ending April 30, 2022 & 2023
Fund 301 - Debt Service Fund
DRAFT
92

2018-2019 2019-2020 2020-2021 2020-2021 2021-2022 2022-2023Account Description Actual Actual Budget Projected Budget Forecast
Revenues and Other Financing Sources
491 Transfer In 153,791$ 74,919$ 767,300$ 83,405$ 201,000$ 215,000$ Total Other Financing Sources 153,791 74,919 767,300 83,405 201,000 215,000
Total Revenues and Other Financing Sources 153,791$ 74,919$ 767,300$ 83,405$ 201,000$ 215,000$
Expenditures and Other Financing Uses
Contractual Services542 Engineering Service -$ 8,173$ -$ -$ -$ -$ 559 Other Professional Service - 7,826 - - - -
Total Contractual Services - 15,999 - - - -
810 Buildings & Improvements 41,100 17,395 649,100 55,350 176,000 215,000 815 Improvement Other Than Buildings 110,204 41,581 107,500 40,000 25,000 - 830 Office Furniture - - 10,700 5,600 - - 835 Computer Equipment 2,487 - - - - -
Total Capital Outlay 153,791 58,976 767,300 100,950 201,000 215,000
Total Expenditures and Other Financing Uses 153,791$ 74,975$ 767,300$ 100,950$ 201,000$ 215,000$
CITY OF GENEVA, ILLINOISBudget Detail by Account
Fiscal Year Ending April 30, 2022 & 2023
Fund 410 - General Capital Projects
DRAFT
93

2018-2019 2019-2020 2020-2021 2020-2021 2021-2022 2022-2023Account Description Actual Actual Budget Projected Budget Forecast
Revenues and Other Financing Sources
419 Non-HR Sales Tax 2,275,450$ 2,070,514$ 2,200,000$ 1,840,000$ 2,154,000$ 2,159,000$ Total Taxes 2,275,450 2,070,514 2,200,000 1,840,000 2,154,000 2,159,000
448 State/Local Grants - - 570,830 150,000 - - Total Intergovernmental Revenues - - 570,830 150,000 - -
471 General Government Fees 210 19,200 5,000 6,000 5,000 5,000 Total Service Fees 210 19,200 5,000 6,000 5,000 5,000
481 Interest Income 12,188 23,446 15,000 7,000 7,000 7,000 485 Reimbursed Expenditures 40,813 6,770 - - - - 489 Miscellaneous 150 375,567 1,830 - 557,895 -
Total Other Revenues 53,151 405,783 16,830 7,000 564,895 7,000
499 Reappropriation - - 1,087,905 - 607,705 554,000 Total Other Financing Sources - - 1,087,905 - 607,705 554,000
Total Revenues and Other Financing Sources 2,328,811$ 2,495,497$ 3,880,565$ 2,003,000$ 3,331,600$ 2,725,000$
Expenditures and Other Financing Uses
815 Improvement Other Than Buildings 2,801,997$ 1,803,265$ 3,880,565$ 1,004,205$ 3,331,600$ 2,725,000$ Total Capital Outlay 2,801,997 1,803,265 3,880,565 1,004,205 3,331,600 2,725,000
Total Expenditures and Other Financing Uses 2,801,997$ 1,803,265$ 3,880,565$ 1,004,205$ 3,331,600$ 2,725,000$
CITY OF GENEVA, ILLINOISBudget Detail by Account
Fiscal Year Ending April 30, 2022 & 2023
Fund 415 - Infrastructure Capital Projects Fund
DRAFT
94

2018-2019 2019-2020 2020-2021 2020-2021 2021-2022 2022-2023Account Description Actual Actual Budget Projected Budget Forecast
Revenues and Other Financing Sources
481 Interest Income 29,837$ 14,579$ 15,000$ 7,500$ 7,500$ 7,500$ 482 Rental Income 74,725 17,641 63,945 58,860 60,000 60,000 489 Miscellaneous 584,773 - - - - -
Total Other Revenues 689,335 32,221 78,945 66,360 67,500 67,500
499 Reappropriation - - 345,670 - 352,115 - Total Other Financing Sources - - 345,670 - 352,115 -
Total Revenues and Other Financing Sources 689,335$ 32,221$ 424,615$ 66,360$ 419,615$ 67,500$
Expenditures and Other Financing Uses
531 Maintenance Services -$ 6,570$ 4,615$ 4,615$ 4,615$ 4,615$ 543 Legal Services 2,493 - - - - - 559 Other Professional Services 2,525 650 - - - - 563 Publishing - 110 - - - - 581 Utilities 341 729 - 150 - -
Total Contractual Services 5,359 8,059 4,615 4,765 4,615 4,615
624 Operating Supplies 988 202 - - - - Total Commodities 988 202 - - - -
916 Property Taxes 15,328 - - 14,215 15,000 15,000 Total Other Expenditures 15,328 - - 14,215 15,000 15,000
951 Transfer to Debt Service 1,000,000 - - - - - 999 Source of Reserves - - - - - 47,885
Total Other Financing Uses 1,000,000 - - - - 47,885
805 Land 475,267 - - - - - 815 Improvement Other Than Buildings - 13,670 420,000 20,000 400,000 -
Total Capital Outlay 475,267 13,670 420,000 20,000 400,000 -
Total Expenditures and Other Financing Uses 1,496,942$ 21,931$ 424,615$ 38,980$ 419,615$ 67,500$
CITY OF GENEVA, ILLINOISBudget Detail by Account
Fiscal Year Ending April 30, 2022 & 2023
Fund 420 - Prairie Green
DRAFT
95

2018-2019 2019-2020 2020-2021 2020-2021 2021-2022 2022-2023Account Description Actual Actual Budget Projected Budget Forecast
Revenues and Other Financing Sources
410 Property Tax 240,780$ 251,254$ 260,000$ 250,000$ 250,000$ 250,000$ Total Taxes 240,780 251,254 260,000 250,000 250,000 250,000
481 Interest Income 16,787 22,891 10,000 5,000 5,000 5,000 485 Reimbursed Expenditures - - 4,160 - 652,715 -
Total Other Revenues 16,787 22,891 14,160 5,000 657,715 5,000
499 Reappropriation - - 82,965 - 633,050 124,810 Total Other Financing Sources - - 82,965 - 633,050 124,810
Total Revenues and Other Financing Sources 257,567$ 274,144$ 357,125$ 255,000$ 1,540,765$ 379,810$
Expenditures and Other Financing Uses
501 Wages - Regular 44,301$ 47,575$ 47,105$ 41,130$ 46,475$ 47,661$ 521 Group Insurance 7,407 8,304 8,692 6,265 6,833 6,943 522 Medicare 614 660 681 575 675 691 523 Social Security 2,576 2,773 2,701 2,315 2,710 2,808 524 IMRF 4,725 4,873 5,365 4,690 4,469 4,509 528 Unemployment Compensation 175 - - - - -
Total Personnel Services 59,799 64,185 64,544 54,975 61,162 62,612
541 Accounting & Auditing Service 1,500 1,550 1,650 1,650 1,750 1,750 543 Legal Service 165 125 4,001 4,000 4,003 4,003 559 Other Professional Services - - 20,000 5,000 5,000 10,000 561 Postage - - 50 - 50 50 563 Publishing - - 200 200 200 200 571 Dues & Subscriptions 650 769 650 770 770 770 573 Training & Professional Development - - 425 425 425 425 599 Other Contractual Services - - 250,000 250,000 651,405 300,000
Total Contractual Services 2,315 2,444 276,976 262,045 663,603 317,198
815 Improvements Other Than Buildings - - 15,605 - 816,000 - Total Capital Outlay - - 15,605 - 816,000 -
Total Expenditures and Other Financing Uses 62,114$ 66,630$ 357,125$ 317,020$ 1,540,765$ 379,810$
CITY OF GENEVA, ILLINOISBudget Detail by Account
Fiscal Year Ending April 30, 2022 & 2023
Fund 425 - TIF #2
DRAFT
96

2018-2019 2019-2020 2020-2021 2020-2021 2021-2022 2022-2023Account Description Actual Actual Budget Projected Budget Forecast
Revenues and Other Financing Sources
410 Property Tax 43,516$ 62,676$ 80,000$ 107,000$ 95,000$ 95,000$ Total Taxes 43,516 62,676 80,000 107,000 95,000 95,000
481 Interest Income 13 156 - - - - 485 Reimbursed Expenditures - - 6,390 - 442,600 -
Total Other Revenues 13 156 6,390 - 442,600 -
499 Reappropriation - - 243,840 - 333,640 124,445 Total Other Financing Sources - - 243,840 - 333,640 124,445
Total Revenues and Other Financing Sources 43,529$ 62,831$ 330,230$ 107,000$ 871,240$ 219,445$
Expenditures and Other Financing Uses
501 Wages - Regular 44,301$ 47,573$ 47,104$ 41,130$ 46,473$ 47,661$ 521 Group Insurance 7,407 8,303 8,693 6,260 6,831 6,940 522 Medicare 615 661 684 575 676 694 523 Social Security 2,575 2,773 2,710 2,315 2,719 2,818 524 IMRF 4,725 4,872 5,382 4,690 4,487 4,531 528 Unemployment Compensation 175 - - - - -
Total Personnel Services 59,797 64,181 64,573 54,970 61,186 62,644
541 Accounting & Auditing Service - - 1,650 1,750 1,750 1,750 543 Legal Service 2,411 - 5,002 5,000 5,004 5,001 559 Other Professional Services 5,210 110,023 50,000 136,700 50,000 100,000 561 Postage - 4 50 50 50 50 599 Other Contractual Services - - 185,000 185,000 200,000 50,000
Total Contractual Services 7,621 110,027 241,702 328,500 256,804 156,801
815 Improvements Other Than Buildings - - 23,955 - 553,250 - Total Capital Outlay - - 23,955 - 553,250 -
Total Expenditures and Other Financing Uses 67,418$ 174,208$ 330,230$ 383,470$ 871,240$ 219,445$
CITY OF GENEVA, ILLINOISBudget Detail by Account
Fiscal Year Ending April 30, 2022 & 2023
Fund 426 - TIF #3
DRAFT
97

2018-2019 2019-2020 2020-2021 2020-2021 2021-2022 2022-2023Account Description Actual Actual Budget Projected Budget Forecast
Revenues and Other Financing Sources
447 Federal Grants -$ 28,851$ -$ -$ -$ -$ 448 State/Local Grants - - - 37,235 - -
Total Intergovernmental Revenues - 28,851 - 37,235 - -
472 Community Development Fees 2,663 - 1,765 - - - 483 Insurance & Property Damage 14,764 16,885 - - - - 484 Sale of Capital Assets 4,625 46,230 70,000 45,000 45,000 45,000 485 Reimbursed Expenditures 25,977 9,209 - - - - 489 Miscellaneous 5,281 4,791 - - - -
Total Other Revenues 53,309 77,113 71,765 45,000 45,000 45,000
491 Transfers In - General Fund 1,370,642 857,840 800,000 - 749,250 1,901,615 493 Other Financing Source - 189,377 1,200,000 - 1,200,000 - 499 Reappopriation - - 15,545 - 402,565 5,060
Total Other Financing Sources 1,370,642 1,047,217 2,015,545 - 2,351,815 1,906,675
Total Revenues and Other Financing Sources 1,423,951$ 1,153,181$ 2,087,310$ 82,235$ 2,396,815$ 1,951,675$
Expenditures and Other Financing Uses
543 Legal Service -$ 9$ -$ -$ -$ -$ 599 Other Contractual Services - 973 - 4,590 5,060 5,060
Total Contractual - 981 - 4,590 5,060 5,060
705 Principal - 9,187 77,520 52,750 60,500 245,500 710 Interest - 1,579 - 4,590 7,300 7,300
Total Debt Service - 10,766 77,520 57,340 67,800 252,800
820 Machinery & Equipment 262,845 116,406 352,500 29,310 370,225 108,000 825 Vehicles 470,230 1,097,190 1,594,180 - 1,886,935 1,545,000 835 Computer Equipment 35,569 106,204 63,110 66,665 66,795 40,815
Total Capital Outlay 768,644 1,319,800 2,009,790 95,975 2,323,955 1,693,815
Total Expenditures and Other Financing Uses 768,644$ 1,331,548$ 2,087,310$ 157,905$ 2,396,815$ 1,951,675$
CITY OF GENEVA, ILLINOISBudget Detail by Account
Fiscal Year Ending April 30, 2022 & 2023
Fund 430 - Capital Equipment
DRAFT
98

2018-2019 2019-2020 2020-2021 2020-2021 2021-2022 2022-2023Account Description Actual Actual Budget Projected Budget Forecast
Revenues and Other Financing Sources
455 Penalties 290,551$ 194,299$ 275,000$ 100,000$ 275,000$ 275,000$ Total Fines & Forfeits 290,551 194,299 275,000 100,000 275,000 275,000
461 Electric Sales 36,380,443 34,899,266 38,433,835 36,001,270 36,340,680 36,492,845 466 Meter Sales 804 1,538 - 2,500 2,500 2,500 468 New Service Installation 95,236 145,239 150,000 150,000 150,000 150,000
Total Service Charges 36,476,483 35,046,043 38,583,835 36,153,770 36,493,180 36,645,345
479 Disconnection/Reconnection Fees 22,725 28,610 30,000 - 30,000 30,000 Total Service Fees 22,725 28,610 30,000 - 30,000 30,000
481 Interest Income 201,660 207,587 160,000 135,000 135,000 135,000 482 Rental Income 111,817 106,017 140,000 140,000 140,000 140,000 483 Insurance & Property Damage 47,919 44,372 - 66,855 - - 484 Sale of Capital Assets (3,310) - 5,000 112,000 5,000 5,000 485 Reimbursed Expenditures 7,913 10,503 17,000 17,000 17,000 17,000 486 Donations 812,895 262,968 - - - - 489 Miscellaneous 1,430 167,669 10,000 10,000 10,000 10,000
Total Other Revenues 1,180,324 799,117 332,000 480,855 307,000 307,000
493 Other Financing Source - 26,532 12,500,000 - 12,500,000 - 499 Reappropriation - - 2,583,995 - 2,014,930 3,793,105
Total Other Financing Sources - 26,532 15,083,995 - 14,514,930 3,793,105
Total Revenues and Other Financing Sources 37,970,083$ 36,094,600$ 54,304,830$ 36,734,625$ 51,620,110$ 41,050,450$
Expenditures and Other Financing Uses
501 Wages - Regular 2,182,256$ 2,246,018$ 2,279,670$ 2,106,205$ 2,343,000$ 2,378,810$ 502 Wages - Part-Time/Seasonal 84,751 79,801 107,420 75,575 98,734 93,864 503 Overtime 62,059 54,923 160,200 52,585 160,200 160,200 504 Stand-By 106,691 108,206 110,430 106,270 110,430 110,430 521 Group Insurance 357,535 465,398 442,826 476,000 550,226 516,158 522 Medicare 34,268 35,054 38,581 33,100 39,376 36,902 523 Social Security 145,352 148,078 160,890 135,520 165,076 155,071 524 IMRF 253,053 239,115 293,784 251,510 294,081 283,775 527 Car Allowance 3,250 3,250 3,250 3,250 3,375 3,250 529 Pension Expense 22,890 69,326 25,000 119,770 119,770 119,770
Total Personnel Services 3,252,104 3,449,168 3,622,051 3,359,785 3,884,268 3,858,230
531 Maintenance Service 501,276 508,803 612,195 460,965 652,590 659,860 541 Accounting & Auditing Service 18,300 14,472 20,005 20,005 20,000 21,000 543 Legal Service 9,333 16,926 30,875 19,000 30,877 30,875 544 Medical Service 1,178 865 2,250 1,450 2,250 2,250 546 Janitorial Service 4,799 4,795 5,160 5,160 5,160 5,160 547 Banking Service 70,971 76,391 95,000 95,000 95,000 95,000 550 Collection Service - 378 1,000 1,000 1,000 1,000 559 Other Professional Services 20,745 24,312 55,095 16,200 54,545 53,495 561 Postage 26,568 25,813 28,600 28,600 27,095 27,095 562 Telephone 54,060 81,364 74,465 59,815 20,315 24,090 563 Publishing 2,850 1,131 2,000 1,640 2,000 2,000 564 Printing 9,543 7,474 8,920 7,420 7,405 7,345 565 Internet 3,307 2,297 2,320 2,320 2,320 2,320 566 Recording Fees 52 416 404 405 400 400 571 Dues & Subscriptions 29,954 25,883 31,470 31,470 31,470 31,745 572 Travel & Meals 6,608 3,847 8,980 2,000 9,080 8,430 573 Training & Professional Development 26,451 19,326 24,775 14,930 24,455 20,725
CITY OF GENEVA, ILLINOISBudget Summary by Account
Fiscal Year Ending April 30, 2022 & 2023
Fund 620 - Electric Fund
DRAFT
99

2018-2019 2019-2020 2020-2021 2020-2021 2021-2022 2022-2023Account Description Actual Actual Budget Projected Budget Forecast
CITY OF GENEVA, ILLINOISBudget Summary by Account
Fiscal Year Ending April 30, 2022 & 2023
Fund 620 - Electric Fund
581 Utilities 406,527 346,897 608,165 444,920 608,165 608,165 583 Garbage Disposal 125 - 200 435 200 200 584 Landfill Charges 122 4,063 3,000 2,000 3,000 3,000 585 Electric Purchases 29,029,642 27,737,266 29,740,190 27,574,175 27,891,675 30,124,590 592 General Insurance 255,178 174,389 288,995 306,215 288,995 288,995 595 Rentals 29,847 30,079 40,385 40,195 41,650 42,390 599 Other Contractual Services 67,892 72,012 80,680 79,465 81,205 81,505
Total Contractual Services 30,575,330 29,179,197 31,765,129 29,214,785 29,900,852 32,141,635
601 Maintenance Supplies 54,437 54,655 106,730 68,785 106,730 106,730 621 Office Supplies 3,949 2,184 5,285 4,250 5,285 6,435 622 Office Equipment 1,098 613 1,000 750 1,750 1,750 623 Office Furniture 11 - 1,000 - 1,000 1,000 624 Operating Supplies 21,819 30,903 33,015 27,215 33,015 33,015 625 Small Tools 5,073 3,905 4,680 4,680 4,680 4,680 626 Janitorial Supplies 311 225 1,100 850 1,100 1,100 627 Motor Fuel & Lubricants 41,467 35,307 64,590 35,550 63,230 63,230 631 Clothing 12,526 8,660 17,150 10,100 17,150 17,150 632 Per Copy Charges 589 554 660 660 660 660 641 Books 122 - 845 - 845 845 663 Computer Software 7,574 8,575 10,545 9,850 10,545 10,545
Total Commodities 148,974 145,581 246,600 162,690 245,990 247,140
705 Principal 2011 Bonds 1,930,000 2,131,818 2,013,510 2,009,650 705,520 10,520 710 Interest 2011 Bonds 221,747 165,175 67,800 69,200 11,945 1,520 715 Paying Agent Fees 1,967 2,012 1,650 1,650 1,100 -
Total Debt Service 2,153,713 2,299,005 2,082,960 2,080,500 718,565 12,040
810 Buildings & Improvements 14,230 7,946 20,000 - 20,000 20,000 815 Improvements Other Than Buildings 1,198,681 2,789,631 14,395,875 1,225,000 14,648,860 2,452,000 820 Machinery & Equipment 25,948 16,551 17,310 7,000 79,000 100,000 825 Vehicles 30,750 26,790 91,500 - 75,000 160,000 835 Computer Equipment 10,226 200,632 35,830 1,000 20,000 31,830 910 Capitalized Assets (2,131,427) (3,103,923) - - - -
Total Capital Outlay (851,592) (62,374) 14,560,515 1,233,000 14,842,860 2,763,830
911 Depreciation 1,948,599 1,940,760 2,000,000 2,000,000 2,000,000 2,000,000 912 Bad Debt (16,220) 16,383 20,000 - 20,000 20,000 914 State/Federal Permits 5,444 5,444 6,875 6,875 6,875 6,875 917 Employee Awards 600 850 500 500 500 500 918 Easements 110 140 200 180 200 200
Total Other Expenditures 1,938,532 1,963,577 2,027,575 2,007,555 2,027,575 2,027,575
Total Expenditures and Other Financing Uses 37,217,062$ 36,974,155$ 54,304,830$ 38,058,315$ 51,620,110$ 41,050,450$ DRAFT
100

2018-2019 2019-2020 2020-2021 2020-2021 2021-2022 2022-2023Program Description Actual Actual Budget Projected Budget Forecast
20 Administration 30,444,923$ 29,278,326$ 31,319,101$ 29,112,355$ 29,524,195$ 31,776,905$ 25 Operation & Maintenance 2,256,485 2,374,254 2,727,561 2,279,165 2,906,326 2,862,975 27 Substations 81,140 84,654 111,700 54,650 111,795 111,700 30 Customer Accounting 197,084 216,487 257,729 204,245 254,035 250,537 35 Electric Generation 846,966 682,303 1,130,330 940,315 1,136,345 1,143,860 40 New Service 55,557 64,713 430 48,900 1,835 1,835 45 Fiber Optics 6,921 10,355 20,650 11,280 20,650 20,650 73 GIS 77,265 85,485 93,854 93,080 102,979 105,293 90 Debt Service & Depreciation 2,172,312 2,108,133 4,082,960 4,081,325 2,719,090 2,012,865 95 Capital Outlay 1,078,408 2,069,445 14,560,515 1,233,000 14,842,860 2,763,830
Total Electric Fund 37,217,062$ 36,974,155$ 54,304,830$ 38,058,315$ 51,620,110$ 41,050,450$
CITY OF GENEVA, ILLINOISExpenditure Budget Summary by ProgramFiscal Year Ending April 30, 2022 & 2023
620 - Electric Fund
DRAFT
101

2018-2019 2019-2020 2020-2021 2020-2021 2021-2022 2022-2023Description Actual Actual Budget Projected Budget Forecast
20 AdministrationPersonnel Services 1,190,293$ 1,284,429$ 1,256,127$ 1,274,360$ 1,360,103$ 1,378,170$ Contractual Services 29,249,655 27,990,801 30,055,409 27,830,955 28,156,527 30,390,170 Commodities 4,866 2,956 7,365 6,860 7,365 8,365 Other Expenditures 110 140 200 180 200 200 Total 30,444,923 29,278,326 31,319,101 29,112,355 29,524,195 31,776,905
25 Operations and MaintenancePersonnel Services 1,743,816 1,850,270 2,126,241 1,774,125 2,280,446 2,239,565 Contractual Services 398,389 406,418 445,955 392,810 476,615 474,145 Commodities 113,680 116,716 154,865 111,730 148,765 148,765 Other Expenditures 600 850 500 500 500 500 Total 2,256,485 2,374,254 2,727,561 2,279,165 2,906,326 2,862,975
27 SubstationContractual Services 76,388 68,797 93,100 46,150 93,195 93,100 Commodities 4,752 15,857 18,600 8,500 18,600 18,600 Total 81,140 84,654 111,700 54,650 111,795 111,700
30 Customer AccountingPersonnel Services 147,099 141,018 161,659 131,625 160,555 155,517 Contractual Services 65,776 59,086 76,070 72,620 73,480 75,020 Commodities 429 - - - - - Other Expenditures (16,220) 16,383 20,000 - 20,000 20,000 Total 197,084 216,487 257,729 204,245 254,035 250,537
35 Electric GenerationPersonnel Services 52,729 34,101 425 55,710 2,785 2,785 Contractual Services 765,924 633,261 1,064,520 845,080 1,063,435 1,070,950 Commodities 22,869 9,498 58,510 32,650 63,250 63,250 Other Expenditures 5,444 5,444 6,875 6,875 6,875 6,875 Total 846,966 682,303 1,130,330 940,315 1,136,345 1,143,860
40 New ServicePersonnel Services 55,557 64,713 430 48,900 1,835 1,835 Total 55,557 64,713 430 48,900 1,835 1,835
45 Fiber OpticsPersonnel Services - 881 - - - - Contractual Services 5,440 9,474 15,780 8,780 15,780 15,780 Commodities 1,481 - 4,870 2,500 4,870 4,870 Total 6,921 10,355 20,650 11,280 20,650 20,650
73 GISPersonnel Services 62,610 73,756 77,169 75,065 78,544 80,358 Contractual Services 13,758 11,175 14,295 17,565 21,295 21,645 Commodities 897 554 2,390 450 3,140 3,290 Total 77,265 85,485 93,854 93,080 102,979 105,293
90 Debt Service and DepreciationContractual Services - 186 - 825 525 825 Debt Service 223,713 167,187 2,082,960 2,080,500 718,565 12,040 Other Expenditures 1,948,599 1,940,760 2,000,000 2,000,000 2,000,000 2,000,000 Total 2,172,312 2,108,133 4,082,960 4,081,325 2,719,090 2,012,865
CITY OF GENEVA, ILLINOISExpenditure Budget Summary by Program and Classification
Fiscal Year Ending April 30, 2022 & 2023
Fund 620 - Electric Fund
DRAFT
102

2018-2019 2019-2020 2020-2021 2020-2021 2021-2022 2022-2023Description Actual Actual Budget Projected Budget Forecast
CITY OF GENEVA, ILLINOISExpenditure Budget Summary by Program and Classification
Fiscal Year Ending April 30, 2022 & 2023
Fund 620 - Electric Fund
95 Capital OutlayCapital Outlay 1,078,408 2,069,445 14,560,515 1,233,000 14,842,860 2,763,830 Total 1,078,408 2,069,445 14,560,515 1,233,000 14,842,860 2,763,830
Total Electric Fund 37,217,062 36,974,155 54,304,830 38,058,315 51,620,110 41,050,450
Total Electric FundPersonnel Services 3,252,104$ 3,449,168$ 3,622,051$ 3,359,785$ 3,884,268$ 3,858,230$ Contractual Services 30,575,330 29,179,197 31,765,129 29,214,785 29,900,852 32,141,635 Commodities 148,974 145,581 246,600 162,690 245,990 247,140 Debt Service 223,713 167,187 2,082,960 2,080,500 718,565 12,040 Other Expenditures 1,938,532 1,963,577 2,027,575 2,007,555 2,027,575 2,027,575 Capital Outlay 1,078,408 2,069,445 14,560,515 1,233,000 14,842,860 2,763,830 Total 37,217,062 36,974,155 54,304,830 38,058,315 51,620,110 41,050,450
DRAFT
103

2018-2019 2019-2020 2020-2021 2020-2021 2021-2022 2022-2023Account Description Actual Actual Budget Projected Budget Forecast
Expenditures
Program 20 - Administration
501 Wages - Regular 932,181$ 877,451$ 892,070$ 861,015$ 903,296$ 917,475$ 502 Wages - Part-Time/Seasonal 5,778 2,194 4,209 2,510 3,302 3,223 503 Overtime 2,208 8,384 - - - - 504 Stand-By 191 - - - - - 521 Group Insurance 79,050 214,240 179,091 221,100 250,159 252,855 522 Medicare 13,178 12,496 13,040 12,135 13,195 13,398 523 Social Security 55,593 52,595 53,725 48,760 54,812 55,967 524 IMRF 90,663 88,236 102,542 98,530 104,904 104,942 527 Car Allowance 3,250 3,250 3,250 3,250 3,375 3,250 529 Pension Expense 8,201 25,582 8,200 27,060 27,060 27,060
Total Personnel Services 1,190,293 1,284,429 1,256,127 1,274,360 1,360,103 1,378,170
531 Maintenance Service 20,425 20,891 21,480 21,380 21,375 22,585 541 Accounting & Auditing Service 18,300 14,472 20,005 20,005 20,000 21,000 543 Legal Service 9,333 16,926 30,875 19,000 30,877 30,875 544 Medical Service - - 600 600 600 600 547 Banking Service 70,971 76,391 95,000 95,000 95,000 95,000 559 Other Professional Services 7,613 17,466 34,300 8,000 34,300 32,700 561 Postage 891 970 2,000 2,000 2,000 2,000 562 Telephone 47,551 68,114 62,960 52,000 12,550 12,550 563 Publishing 2,830 1,131 2,000 1,640 2,000 2,000 564 Printing 1,108 1,104 1,100 1,050 1,100 1,100 565 Internet 3,307 2,297 2,320 2,320 2,320 2,320 566 Recording Fees 52 416 404 405 400 400 571 Dues 29,524 25,453 30,910 30,910 30,910 31,185 572 Travel 2,822 1,966 4,380 400 4,380 4,380 573 Training 4,266 4,750 5,630 715 5,785 5,630 585 Electric Purchases 29,029,642 27,737,266 29,740,190 27,574,175 27,891,675 30,124,590 595 Rentals 1,021 1,190 1,255 1,215 1,255 1,255 599 Other Contractual Services - - - 140 - -
Total Contractual Services 29,249,655 27,990,801 30,055,409 27,830,955 28,156,527 30,390,170
621 Office Supplies 3,231 1,665 4,000 4,000 4,000 5,000 622 Office Equipment 668 413 1,000 750 1,000 1,000 623 Office Furniture 11 - 1,000 - 1,000 1,000 632 Per Copy Charges 589 554 660 660 660 660 663 Computer Software 367 324 705 1,450 705 705
Total Commodities 4,866 2,956 7,365 6,860 7,365 8,365
918 Easements 110 140 200 180 200 200 Total Other Expenditures 110 140 200 180 200 200
Total Administration 30,444,923$ 29,278,326$ 31,319,101$ 29,112,355$ 29,524,195$ 31,776,905$
Program 25 - Operation & Maintenance
501 Wages - Regular 1,048,881 1,168,333 1,266,414 1,043,555 1,316,400 1,335,248 502 Wages - Part-Time/Seasonal 39,948 41,041 47,135 45,425 46,015 47,117 503 Overtime 55,909 43,775 160,200 52,540 160,200 160,200 504 Stand-By 106,500 108,206 110,430 106,270 110,430 110,430 521 Group Insurance 248,202 221,305 235,192 221,955 267,541 230,614 522 Medicare 17,724 19,210 22,970 17,765 23,677 21,044 523 Social Security 75,373 81,286 96,174 73,675 99,556 88,587 524 IMRF 138,729 129,554 175,226 128,730 172,417 162,115
CITY OF GENEVA, ILLINOISBudget Detail by Program
Fiscal Year Ending April 30, 2022 & 2023
Fund 620 - Electric Fund
DRAFT
104

2018-2019 2019-2020 2020-2021 2020-2021 2021-2022 2022-2023Account Description Actual Actual Budget Projected Budget Forecast
Expenditures
CITY OF GENEVA, ILLINOISBudget Detail by Program
Fiscal Year Ending April 30, 2022 & 2023
Fund 620 - Electric Fund
529 Pension Expense 12,549 37,561 12,500 84,210 84,210 84,210 Total Personnel Services 1,743,816 1,850,270 2,126,241 1,774,125 2,280,446 2,239,565
531 Maintenance Service 214,526 230,032 257,405 180,985 287,765 289,480 544 Medical Service 1,130 865 1,650 850 1,650 1,650 546 Janitorial Service 4,799 4,795 5,160 5,160 5,160 5,160 559 Other Professional Services 10,091 6,846 14,295 5,800 13,745 14,295 562 Telephone - 5,489 3,625 3,625 3,625 3,660 571 Dues 430 430 560 560 560 560 572 Travel 3,786 1,882 4,000 1,000 4,100 3,450 573 Training 18,078 12,919 15,340 13,540 15,340 10,940 581 Utilities 31,160 22,584 8,620 26,620 8,620 8,620 584 Landfill Charges 122 4,063 3,000 2,000 3,000 3,000 592 General Insurance 97,805 103,933 115,490 132,710 115,490 115,490 595 Rentals 4,338 4,245 5,110 4,960 5,860 6,140 599 Other Contractual Services 12,124 8,336 11,700 15,000 11,700 11,700
Total Contractual Services 398,389 406,418 445,955 392,810 476,615 474,145
601 Maintenance Supplies 46,073 41,764 65,585 40,885 65,585 65,585 624 Operating Supplies 20,080 30,732 28,015 25,015 28,015 28,015 625 Small Tools 4,763 3,419 4,180 4,180 4,180 4,180 626 Janitorial Supplies 218 182 500 500 500 500 627 Motor Fuel & Lubricants 22,690 23,707 28,750 22,650 22,650 22,650 631 Clothing 12,526 8,660 17,150 10,100 17,150 17,150 641 Books 122 - 845 - 845 845 663 Computer Software 7,207 8,251 9,840 8,400 9,840 9,840
Total Commodities 113,680 116,716 154,865 111,730 148,765 148,765
917 Employee Awards 600 850 500 500 500 500 Total Other Expenditures 600 850 500 500 500 500
Total Operation & Maintenance 2,256,485$ 2,374,254$ 2,727,561$ 2,279,165$ 2,906,326$ 2,862,975$
Program 27 - Substations
531 Maintenance Service 72,057 64,013 88,600 42,650 88,695 88,600 599 Other Contractual Services 4,331 4,784 4,500 3,500 4,500 4,500
Total Contractual Services 76,388 68,797 93,100 46,150 93,195 93,100
601 Maintenance Supplies 3,493 12,527 17,000 7,400 17,000 17,000 626 Janitorial Supplies - - 100 100 100 100 627 Motor Fuel & Lubricants 1,259 3,330 1,500 1,000 1,500 1,500
Total Commodities 4,752 15,857 18,600 8,500 18,600 18,600
Total Substations 81,140$ 84,654$ 111,700$ 54,650$ 111,795$ 111,700$
DRAFT
105

2018-2019 2019-2020 2020-2021 2020-2021 2021-2022 2022-2023Account Description Actual Actual Budget Projected Budget Forecast
Expenditures
CITY OF GENEVA, ILLINOISBudget Detail by Program
Fiscal Year Ending April 30, 2022 & 2023
Fund 620 - Electric Fund
Program 30 - Customer Accounting
501 Wages - Regular 70,987 67,923 67,110 65,615 68,087 69,353 502 Wages - Part-Time/Seasonal 37,649 33,955 52,576 27,640 49,417 43,524 503 Overtime 54 - - - - - 521 Group Insurance 21,149 20,931 22,185 21,480 23,124 23,103 522 Medicare 1,494 1,404 1,736 1,275 1,703 1,637 523 Social Security 6,388 6,003 7,421 5,455 7,285 6,999 524 IMRF 8,601 8,374 9,851 9,510 10,289 10,251 529 Pension Expense 778 2,428 780 650 650 650
Total Personnel Services 147,099 141,018 161,659 131,625 160,555 155,517
531 Maintenance Service 12,427 12,581 12,960 12,960 13,350 14,015 544 Medical Service 48 - - - - - 550 Collection Service - 378 1,000 1,000 1,000 1,000 559 Other Professional Services 2,667 - 2,000 - 2,000 2,000 561 Postage 25,677 24,843 26,600 26,600 25,095 25,095 564 Printing 8,435 6,370 7,820 6,370 6,305 6,245 572 Travel & Meals - - 600 600 600 600 573 Training 95 95 675 675 200 675 595 Rentals 16,426 14,819 24,415 24,415 24,930 25,390
Total Contractual Services 65,776 59,086 76,070 72,620 73,480 75,020
622 Office Equipment 429 - - - - - Total Commodities 429 - - - - -
912 Bad Debt (16,220) 16,383 20,000 - 20,000 20,000 Total Other Expenditures (16,220) 16,383 20,000 - 20,000 20,000
Total Customer Accounting 197,084$ 216,487$ 257,729$ 204,245$ 254,035$ 250,537$
Program 35 - Electric Generation
501 Wages - Regular 42,139 27,368 - 43,350 - - 503 Overtime 1,336 373 - 45 - - 521 Group Insurance 915 832 - 1,315 - - 522 Medicare 610 389 - 615 - - 523 Social Security 2,605 1,650 - 2,630 - - 524 IMRF 4,699 2,705 - 4,970 - - 529 Pension Expense 425 784 425 2,785 2,785 2,785
Total Personnel Services 52,729 34,101 425 55,710 2,785 2,785
531 Maintenance Service 174,053 169,978 212,710 184,600 215,365 219,140 559 Other Professional Services 375 - 4,500 2,400 4,500 4,500 562 Telephone 6,294 7,309 7,480 3,740 3,740 7,480 581 Utilities 375,368 324,313 599,545 418,300 599,545 599,545 583 Garbage Disposal 125 - 200 435 200 200 592 General Insurance 900 2,500 2,100 2,100 2,100 2,100 595 Rentals 157,373 70,456 173,505 173,505 173,505 173,505 599 Other Contractual Services 51,437 58,705 64,480 60,000 64,480 64,480
Total Contractual Services 765,924 633,261 1,064,520 845,080 1,063,435 1,070,950
DRAFT
106

2018-2019 2019-2020 2020-2021 2020-2021 2021-2022 2022-2023Account Description Actual Actual Budget Projected Budget Forecast
Expenditures
CITY OF GENEVA, ILLINOISBudget Detail by Program
Fiscal Year Ending April 30, 2022 & 2023
Fund 620 - Electric Fund
601 Maintenance Supplies 3,210 330 18,170 17,800 18,170 18,170 622 Office Equipment - 200 - - - - 624 Operating Supplies 1,738 171 5,000 2,200 5,000 5,000 625 Small Tools 310 486 500 500 500 500 626 Janitorial Supplies 93 42 500 250 500 500 627 Motor Fuel & Lubricants 17,518 8,269 34,340 11,900 39,080 39,080
Total Commodities 22,869 9,498 58,510 32,650 63,250 63,250
914 State/Federal Permit Fees 5,444 5,444 6,875 6,875 6,875 6,875 Total Other Expenditures 5,444 5,444 6,875 6,875 6,875 6,875
Total Electric Generation 846,966$ 682,303$ 1,130,330$ 940,315$ 1,136,345$ 1,143,860$
Program 40 - New Service
501 Wages - Regular 43,652 50,907 - 39,755 - - 503 Overtime 2,551 2,098 - - - - 521 Group Insurance 890 1,532 - 1,200 - - 522 Medicare 619 749 - 565 - - 523 Social Security 2,645 3,097 - 1,810 - - 524 IMRF 4,769 4,907 - 3,735 - - 529 Pension Expense 431 1,423 430 1,835 1,835 1,835
Total Personnel Services 55,557 64,713 430 48,900 1,835 1,835
Total New Service 55,557$ 64,713$ 430$ 48,900$ 1,835$ 1,835$
Program 45 - Fiber Optics
501 Wages - Regular - 479 - - - - 503 Overtime - 225 - - - - 521 Group Insurance - 21 - - - - 522 Medicare - 10 - - - - 523 Social Security - 43 - - - - 524 IMRF - 80 - - - - 529 Pension Expense - 23 - - - -
Total Personnel Services - 881 - - - -
531 Maintenance Service - 3,871 10,000 3,000 10,000 10,000 595 Rentals 5,440 5,603 5,780 5,780 5,780 5,780
Total Contractual Services 5,440 9,474 15,780 8,780 15,780 15,780
601 Maintenance Supplies 1,481 - 4,870 2,500 4,870 4,870 Total Commodities 1,481 - 4,870 2,500 4,870 4,870
Total Fiber Optics 6,921$ 10,355$ 20,650$ 11,280$ 20,650$ 20,650$
Program 73 - GIS
501 Wages - Regular 44,417 53,556 54,076 52,915 55,217 56,734 502 Wages - Part-Time 1,376 2,611 3,500 - - - 503 Overtime - 68 - - - - 521 Group Insurance 7,328 6,537 6,358 8,950 9,402 9,586 522 Medicare 643 796 835 745 801 823 523 Social Security 2,749 3,404 3,570 3,190 3,423 3,518 524 IMRF 5,592 5,259 6,165 6,035 6,471 6,467
DRAFT
107

2018-2019 2019-2020 2020-2021 2020-2021 2021-2022 2022-2023Account Description Actual Actual Budget Projected Budget Forecast
Expenditures
CITY OF GENEVA, ILLINOISBudget Detail by Program
Fiscal Year Ending April 30, 2022 & 2023
Fund 620 - Electric Fund
529 Pension Expense 506 1,525 2,665 3,230 3,230 3,230 Total Personnel Services 62,610 73,756 77,169 75,065 78,544 80,358
531 Maintenance Service 7,788 7,438 9,040 15,390 16,040 16,040 562 Telephone 216 453 400 450 400 400 563 Publishing 20 - - - - - 573 Training 4,012 1,562 3,130 - 3,130 3,480 595 Rentals 1,722 1,722 1,725 1,725 1,725 1,725
Total Contractual Services 13,758 11,175 14,295 17,565 21,295 21,645
601 Maintenance Supplies 179 35 1,105 200 1,105 1,105 621 Office Supplies 718 520 1,285 250 1,285 1,435 622 Office Equipment - - - - 750 750
Total Commodities 897 554 2,390 450 3,140 3,290
Total GIS 77,265$ 85,485$ 93,854$ 93,080$ 102,979$ 105,293$
Program 90 - Debt Service & Depreciation
599 Other Contractual Services - 186 - 825 525 825 Total Contractual Services 78,162 86,226 96,244 94,355 106,644 109,408
705 Principal 1,930,000 2,131,818 2,013,510 2,009,650 705,520 10,520 710 Interest 221,747 165,175 67,800 69,200 11,945 1,520 715 Paying Agent Fees 1,967 2,012 1,650 1,650 1,100 - 910 Capitalized Assets (1,930,000) (2,131,818) - - - -
Total Debt Service 223,713 167,187 2,082,960 2,080,500 718,565 12,040
911 Depreciation 1,948,599 1,940,760 2,000,000 2,000,000 2,000,000 2,000,000 999 Source of Reserves - - - - - -
Total Other Expenditures 1,948,599 1,940,760 2,000,000 2,000,000 2,000,000 2,000,000
Total Debt Service & Depreciation 2,172,312$ 2,108,133$ 4,082,960$ 4,081,325$ 2,719,090$ 2,012,865$
Program 95 - Capital Outlay
810 Buildings & Improvements 14,230 7,946 20,000 - 20,000 20,000 815 Improvements Other than Buildings 1,198,681 2,789,631 14,395,875 1,225,000 14,648,860 2,452,000 820 Machinery & Equipment 25,948 16,551 17,310 7,000 79,000 100,000 825 Vehicles 30,750 26,790 91,500 - 75,000 160,000 835 Computer Equipment 10,226 200,632 35,830 1,000 20,000 31,830 910 Capitalized Assets (201,427) (972,105) - - - -
Total Capital Outlay 1,078,408$ 2,069,445$ 14,560,515$ 1,233,000$ 14,842,860$ 2,763,830$
Total Electric Fund 37,217,062$ 36,974,155$ 54,304,830$ 38,058,315$ 51,620,110$ 41,050,450$
DRAFT
108

2018-2019 2019-2020 2020-2021 2020-2021 2021-2022 2022-2023Account Description Actual Actual Budget Projected Budget Forecast
Revenues and Other Financing Sources
455 Penalties 122,990$ 88,179$ 100,000$ 50,000$ 100,000$ 100,000$ 458 Industrial Wastewater Surcharge 105,518 97,048 115,000 115,000 115,000 115,000
Total Fines & Forfeits 228,508 185,227 215,000 165,000 215,000 215,000
462 Water Sales 6,112,826 5,968,325 6,012,000 6,239,805 6,123,000 6,123,000 463 Sewer Sales 3,822,108 3,667,119 3,727,500 3,820,110 3,736,500 3,736,500 465 Connection Fees 241,805 124,830 111,520 111,580 111,565 111,565 466 Meter Sales 27,979 16,519 25,000 25,000 25,000 25,000
Total Service Charges 10,204,719 9,776,792 9,876,020 10,196,495 9,996,065 9,996,065
475 Private Fire Service 34,740 34,740 34,740 34,740 34,740 34,740 476 Lawn Permit Fees 950 500 1,000 650 1,000 1,000 479 Disconnection/Reconnection Fees 225 2,100 500 - 500 500
Total Service Fees 35,915 37,340 36,240 35,390 36,240 36,240
481 Interest Income 55,024 65,316 45,000 45,000 45,000 45,000 482 Rental Income 137,445 112,329 146,035 100,000 100,000 100,000 483 Insurance & Property Damage 8,046 730 - 885 - - 484 Sale of Capital Assets - 97,308 10,000 33,850 10,000 10,000 485 Reimbursed Expenditures 1,485 628 8,245 15,445 8,245 8,245 486 Donations 1,901,263 385,387 - - - - 489 Miscellaneous 3,971 133,462 5,000 5,000 5,000 5,000
Total Other Revenues 2,107,234 795,161 214,280 200,180 168,245 168,245
491 Interfund Transfer In - 261,160 - - - - 493 Other Financing Source 8,472,408 2,625,347 - - - - 499 Reappropriation - - 5,405,050 - 3,815,630 3,988,845
Total Other Financing Sources 8,472,408 2,886,507 5,405,050 - 3,815,630 3,988,845
Total Revenues and Other Financing Sources 21,048,785$ 13,681,027$ 15,746,590$ 10,597,065$ 14,231,180$ 14,404,395$
Expenditures and Other Financing Uses
501 Wages - Regular 1,777,518$ 1,814,651$ 1,871,871$ 1,792,940$ 1,899,745$ 1,934,659$ 502 Wages - Part-Time/Seasonal 63,164 55,831 82,071 48,435 74,848 57,616 503 Overtime 77,609 65,965 81,600 67,110 81,600 81,600 504 Stand-By 114,645 120,340 109,980 111,880 109,980 109,980 521 Group Insurance 365,913 441,838 447,320 453,965 513,866 519,391 522 Medicare 28,457 28,892 31,145 28,215 31,457 31,712 523 Social Security 120,917 122,701 131,581 117,520 133,101 134,299 524 IMRF 214,087 201,208 236,417 224,480 245,011 245,286 527 Car Allowance 3,250 3,250 3,250 3,250 3,376 3,250 529 Pension Expense 19,365 58,335 19,375 96,145 96,145 96,145
Total Personnel Services 2,784,925 2,913,011 3,014,610 2,943,940 3,189,129 3,213,938
531 Maintenance Service 180,890 169,611 212,986 214,490 216,861 210,862 541 Accounting & Auditing Service 4,030 5,716 7,080 5,710 4,400 4,550 542 Engineering Service 500 5,755 3,265 3,265 2,265 2,265 543 Legal Service 6,859 17,367 11,500 11,500 11,500 11,500 544 Medical Service 1,262 1,150 2,390 2,390 2,590 2,590 546 Janitorial Service 4,598 4,801 4,900 4,900 4,900 4,900 547 Banking Service 38,752 45,219 43,000 43,000 43,000 45,000 550 Collection Service - 413 1,000 1,000 1,000 1,000 559 Other Professional Services 46,352 49,425 54,640 54,640 52,630 53,600 561 Postage 26,141 25,447 26,700 24,890 24,890 24,890 562 Telephone 15,765 16,103 18,435 18,135 17,565 17,615
CITY OF GENEVA, ILLINOISBudget Summary by Account
Fiscal Year Ending April 30, 2022 & 2023
Fund 630 - Water/Wastewater Fund
DRAFT
109

2018-2019 2019-2020 2020-2021 2020-2021 2021-2022 2022-2023Account Description Actual Actual Budget Projected Budget Forecast
CITY OF GENEVA, ILLINOISBudget Summary by Account
Fiscal Year Ending April 30, 2022 & 2023
Fund 630 - Water/Wastewater Fund
563 Publishing 748 660 650 650 650 650 564 Printing 9,307 7,867 8,510 7,550 8,335 8,335 565 Internet 3,377 2,366 3,700 3,660 3,660 2,360 566 Recording Fees 827 208 500 100 500 500 571 Dues & Subscriptions 1,853 2,492 2,210 2,210 1,970 2,220 572 Travel & Meals 517 470 3,300 1,800 4,550 2,750 573 Training & Professional Development 13,866 10,996 15,875 13,570 18,605 16,755 581 Utilities 799,188 748,074 854,595 795,645 846,645 856,845 584 Landfill Charges 38,293 50,683 51,200 45,200 55,200 55,200 586 Sewer Charges 30,363 53,136 36,000 36,000 36,000 36,000 592 General Insurance 98,471 130,490 118,750 127,695 118,750 118,750 595 Rentals 22,061 20,762 22,810 22,375 20,685 21,175 599 Other Contractual Services 77,861 74,969 82,780 86,195 86,195 86,215
Total Contractual Services 1,421,880 1,444,181 1,586,776 1,526,570 1,583,346 1,586,527
601 Maintenance Supplies 111,137 120,564 128,805 128,980 126,375 126,375 621 Office Supplies 5,679 4,865 7,425 6,890 6,890 6,890 622 Office Equipment 3,155 451 1,875 2,625 2,625 2,625 623 Office Furniture - - - - 600 - 624 Operating Supplies 389,558 372,240 463,635 398,635 443,460 443,460 625 Small Tools 3,522 4,438 4,685 4,765 4,685 4,685 626 Janitorial Supplies 778 790 1,350 1,350 1,350 1,350 627 Motor Fuel & Lubricants 33,318 29,473 39,705 32,400 32,400 32,850 631 Clothing 6,940 6,888 7,975 7,975 7,975 7,975 632 Per Copy Charges 589 554 850 850 850 850 641 Books 110 - - - - - 663 Computer Software 6,504 7,001 10,310 6,235 13,010 17,645
Total Commodities 561,289 547,264 666,615 590,705 640,220 644,705
705 Principal 1,778,037 2,035,762 2,301,675 2,367,200 2,264,990 2,497,015 710 Interest 590,258 606,937 617,254 619,940 559,295 506,865 715 Paying Agent Fees 656 671 550 550 550 550
Total Debt Service 2,368,951 2,643,370 2,919,479 2,987,690 2,824,835 3,004,430
810 Buildings & Improvements 34,997 34,044 52,500 - 255,000 39,000 815 Improvements Other than Buildings 2,740,645 13,263,599 3,871,200 3,053,440 1,837,500 2,707,000 820 Machinery & Equipment 141,226 196,855 335,250 273,210 499,000 230,000 825 Vehicles 29,328 244,441 475,000 - 490,000 43,000 835 Computer Equipment 9,642 37,147 31,830 15,000 19,280 42,175 910 Capitalized Assets 4,311,939 (12,555,271) - - - -
Total Capital Outlay 7,267,777 1,220,814 4,765,780 3,341,650 3,100,780 3,061,175
911 Depreciation 2,365,061 2,535,385 2,400,000 2,500,000 2,500,000 2,500,000 912 Bad Debt (4,901) 1,350 6,500 2,000 6,500 6,500 914 State/Federal Permits 35,879 37,040 39,130 39,130 38,570 38,570 917 Employee Awards - 450 200 150 300 1,050 922 Grant Expense - - 347,500 347,500 347,500 347,500
Total Other Expenditures 2,396,039 2,574,225 2,793,330 2,888,780 2,892,870 2,893,620
Total Expenditures and Other Financing Uses 16,800,861$ 11,342,866$ 15,746,590$ 14,279,335$ 14,231,180$ 14,404,395$
DRAFT
110

2018-2019 2019-2020 2020-2021 2020-2021 2021-2022 2022-2023Program Description Actual Actual Budget Projected Budget Forecast
60 Water Production 268,369$ 294,212$ 354,971$ 316,020$ 345,916$ 356,297$ 65 Water Distribution 1,280,738 1,399,624 1,547,247 1,504,670 1,620,008 1,631,695 70 Water Treatment 1,091,554 1,077,069 1,210,380 1,122,625 1,231,587 1,237,893 73 GIS 92,922 104,986 110,448 116,335 117,294 119,560 75 Wastewater Treatment 1,040,569 1,029,237 1,082,916 1,049,450 1,088,304 1,085,970 80 Wastewater Collection 893,465 915,300 1,229,598 1,209,805 1,267,977 1,271,113 85 Industrial Wastewater 131,455 121,905 125,771 127,675 131,064 132,847 90 Debt Service & Depreciation 2,955,975 3,143,956 5,319,479 5,491,105 5,328,250 5,507,845 95 Capital Outlay 9,045,815 3,256,577 4,765,780 3,341,650 3,100,780 3,061,175
Total Water/Wastewater Fund 16,800,861$ 11,342,866$ 15,746,590$ 14,279,335$ 14,231,180$ 14,404,395$
CITY OF GENEVA, ILLINOISExpenditure Budget Summary by ProgramFiscal Year Ending April 30, 2022 & 2023
630 - Water/Wastewater Fund
DRAFT
111

2019-2020 2020-2021 2020-2021 2021-2022 2022-2023 2022-2023Description Actual Actual Budget Projected Budget Forecast
60 Water ProductionPersonnel Services (30,295)$ -$ 30,000$ -$ 30,000$ 30,000$ Contractual Services 296,998 290,038 321,221 312,270 312,666 323,047 Commodities 1,666 3,973 3,750 3,750 3,250 3,250 Other Expenditures - 201 - - - - Total 268,369 294,212 354,971 316,020 345,916 356,297
65 Water DistributionPersonnel Services 911,676 987,710 1,018,007 997,560 1,098,738 1,105,655 Contractual Services 258,741 294,011 313,510 301,665 308,865 308,850 Commodities 113,436 116,632 144,020 138,235 141,405 145,690 Other Expenditures (3,115) 1,271 71,710 67,210 71,000 71,500 Total 1,280,738 1,399,624 1,547,247 1,504,670 1,620,008 1,631,695
70 Water TreatmentPersonnel Services 449,399 475,874 471,240 472,375 495,487 499,978 Contractual Services 362,326 341,992 423,460 373,460 424,475 425,990 Commodities 279,829 259,203 315,680 276,790 311,425 311,425 Other Expenditures - - - - 200 500 Total 1,091,554 1,077,069 1,210,380 1,122,625 1,231,587 1,237,893
73 GISPersonnel Services 78,262 92,195 93,763 89,785 94,144 96,410 Contractual Services 13,763 12,237 14,295 22,220 21,650 21,650 Commodities 897 554 2,390 4,330 1,500 1,500 Total 92,922 104,986 110,448 116,335 117,294 119,560
75 Wastewater TreatmentPersonnel Services 536,451 521,340 526,221 529,675 547,599 554,145 Contractual Services 346,868 351,830 365,775 358,905 369,735 360,905 Commodities 121,371 118,773 152,300 122,300 132,300 132,300 Other Expenditures 35,879 37,294 38,620 38,570 38,670 38,620 Total 1,040,569 1,029,237 1,082,916 1,049,450 1,088,304 1,085,970
80 Wastewater CollectionPersonnel Services 732,782 734,119 769,948 743,970 808,022 810,778 Contractual Services 126,798 141,589 136,495 144,350 134,980 135,110 Commodities 35,670 39,519 40,155 38,485 41,975 42,225 Other Expenditures (1,786) 74 283,000 283,000 283,000 283,000 Total 893,465 915,300 1,229,598 1,209,805 1,267,977 1,271,113
85 Industrial WastewaterPersonnel Services 106,649 101,775 105,431 107,115 111,679 113,512 Contractual Services 16,386 11,521 12,020 12,020 11,020 11,020 Commodities 8,420 8,610 8,320 8,540 8,365 8,315 Total 131,455 121,905 125,771 127,675 131,064 132,847
90 Debt Service and DepreciationContractual Services - 964 - 3,415 3,415 3,415 Debt Service 590,913 607,607 2,919,479 2,987,690 2,824,835 3,004,430 Other Expenditures 2,365,061 2,535,385 2,400,000 2,500,000 2,500,000 2,500,000 Total 2,955,975 3,143,956 5,319,479 5,491,105 5,328,250 5,507,845
CITY OF GENEVA, ILLINOISExpenditure Budget Summary by Program and Classification
Fiscal Year Ending April 30, 2022 & 2023
Fund 630 - Water/Wastewater Fund
DRAFT
112

2019-2020 2020-2021 2020-2021 2021-2022 2022-2023 2022-2023Description Actual Actual Budget Projected Budget Forecast
CITY OF GENEVA, ILLINOISExpenditure Budget Summary by Program and Classification
Fiscal Year Ending April 30, 2022 & 2023
Fund 630 - Water/Wastewater Fund
95 Capital OutlayCapital Outlay 9,045,815 3,256,577 4,765,780 3,341,650 3,100,780 3,061,175 Total 9,045,815 3,256,577 4,765,780 3,341,650 3,100,780 3,061,175
Total Water/Wastewater Fund 16,800,861 11,342,866 15,746,590 14,279,335 14,231,180 14,404,395
Total Water/Wastewater FundPersonnel Services 2,784,925$ 2,913,011$ 3,014,610$ 2,940,480$ 3,185,669$ 3,210,478$ Contractual Services 1,421,880 1,444,181 1,586,776 1,528,305 1,586,806 1,589,987 Commodities 561,289 547,264 666,615 592,430 640,220 644,705 Debt Service 590,913 607,607 2,919,479 2,987,690 2,824,835 3,004,430 Other Expenditures 2,396,039 2,574,225 2,793,330 2,888,780 2,892,870 2,893,620 Capital Outlay 9,045,815 3,256,577 4,765,780 3,341,650 3,100,780 3,061,175 Total 16,800,861 11,342,866 15,746,590 14,279,335 14,231,180 14,404,395
DRAFT
113
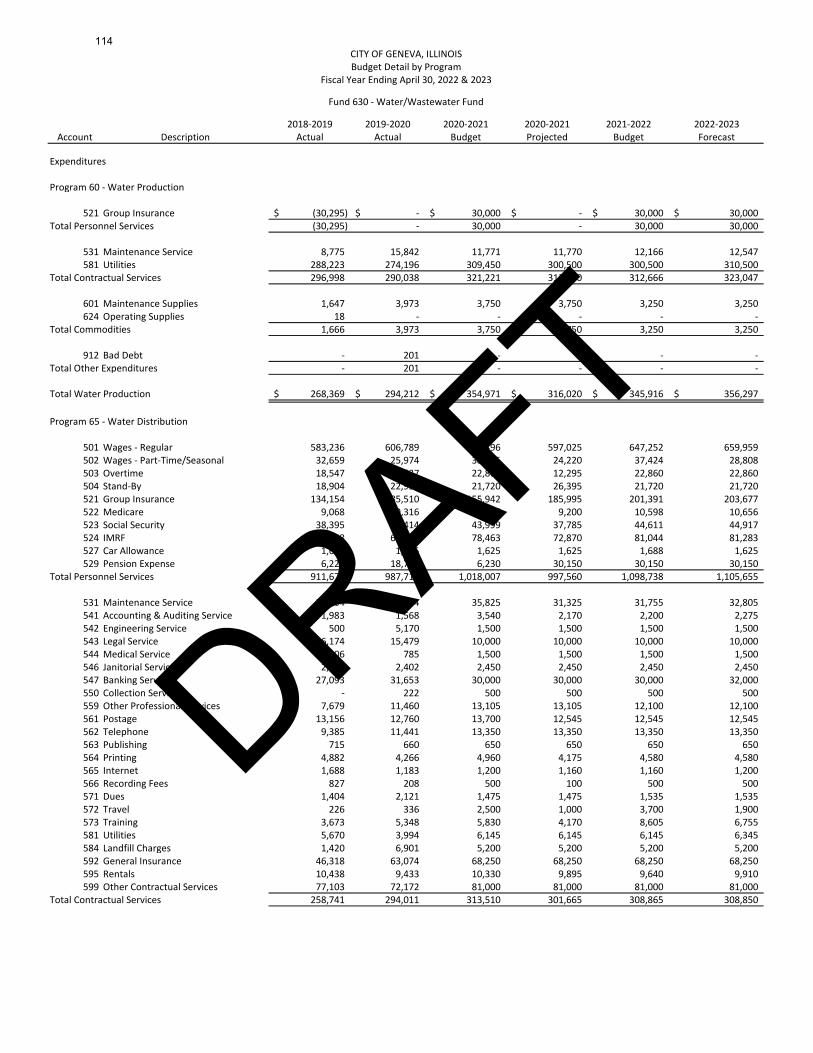
2018-2019 2019-2020 2020-2021 2020-2021 2021-2022 2022-2023Account Description Actual Actual Budget Projected Budget Forecast
Expenditures
Program 60 - Water Production
521 Group Insurance (30,295)$ -$ 30,000$ -$ 30,000$ 30,000$ Total Personnel Services (30,295) - 30,000 - 30,000 30,000
531 Maintenance Service 8,775 15,842 11,771 11,770 12,166 12,547 581 Utilities 288,223 274,196 309,450 300,500 300,500 310,500
Total Contractual Services 296,998 290,038 321,221 312,270 312,666 323,047
601 Maintenance Supplies 1,647 3,973 3,750 3,750 3,250 3,250 624 Operating Supplies 18 - - - - -
Total Commodities 1,666 3,973 3,750 3,750 3,250 3,250
912 Bad Debt - 201 - - - - Total Other Expenditures - 201 - - - -
Total Water Production 268,369$ 294,212$ 354,971$ 316,020$ 345,916$ 356,297$
Program 65 - Water Distribution
501 Wages - Regular 583,236 606,789 638,496 597,025 647,252 659,959 502 Wages - Part-Time/Seasonal 32,659 25,974 38,195 24,220 37,424 28,808 503 Overtime 18,547 12,637 22,860 12,295 22,860 22,860 504 Stand-By 18,904 22,932 21,720 26,395 21,720 21,720 521 Group Insurance 134,154 185,510 155,942 185,995 201,391 203,677 522 Medicare 9,068 9,316 10,477 9,200 10,598 10,656 523 Social Security 38,395 39,414 43,999 37,785 44,611 44,917 524 IMRF 68,858 64,743 78,463 72,870 81,044 81,283 527 Car Allowance 1,625 1,625 1,625 1,625 1,688 1,625 529 Pension Expense 6,229 18,771 6,230 30,150 30,150 30,150
Total Personnel Services 911,676 987,710 1,018,007 997,560 1,098,738 1,105,655
531 Maintenance Service 35,104 31,374 35,825 31,325 31,755 32,805 541 Accounting & Auditing Service 1,983 1,568 3,540 2,170 2,200 2,275 542 Engineering Service 500 5,170 1,500 1,500 1,500 1,500 543 Legal Service 6,174 15,479 10,000 10,000 10,000 10,000 544 Medical Service 1,106 785 1,500 1,500 1,500 1,500 546 Janitorial Service 2,198 2,402 2,450 2,450 2,450 2,450 547 Banking Service 27,093 31,653 30,000 30,000 30,000 32,000 550 Collection Service - 222 500 500 500 500 559 Other Professional Services 7,679 11,460 13,105 13,105 12,100 12,100 561 Postage 13,156 12,760 13,700 12,545 12,545 12,545 562 Telephone 9,385 11,441 13,350 13,350 13,350 13,350 563 Publishing 715 660 650 650 650 650 564 Printing 4,882 4,266 4,960 4,175 4,580 4,580 565 Internet 1,688 1,183 1,200 1,160 1,160 1,200 566 Recording Fees 827 208 500 100 500 500 571 Dues 1,404 2,121 1,475 1,475 1,535 1,535 572 Travel 226 336 2,500 1,000 3,700 1,900 573 Training 3,673 5,348 5,830 4,170 8,605 6,755 581 Utilities 5,670 3,994 6,145 6,145 6,145 6,345 584 Landfill Charges 1,420 6,901 5,200 5,200 5,200 5,200 592 General Insurance 46,318 63,074 68,250 68,250 68,250 68,250 595 Rentals 10,438 9,433 10,330 9,895 9,640 9,910 599 Other Contractual Services 77,103 72,172 81,000 81,000 81,000 81,000
Total Contractual Services 258,741 294,011 313,510 301,665 308,865 308,850
CITY OF GENEVA, ILLINOISBudget Detail by Program
Fiscal Year Ending April 30, 2022 & 2023
Fund 630 - Water/Wastewater Fund
DRAFT
114
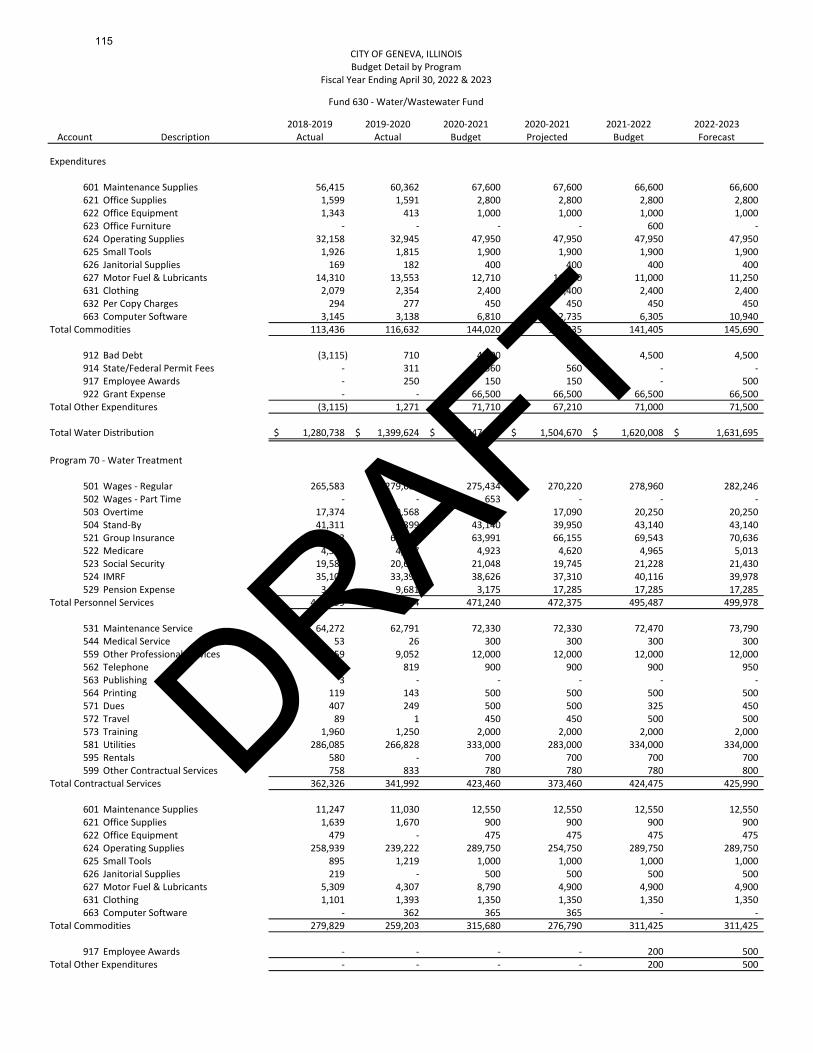
2018-2019 2019-2020 2020-2021 2020-2021 2021-2022 2022-2023Account Description Actual Actual Budget Projected Budget Forecast
Expenditures
CITY OF GENEVA, ILLINOISBudget Detail by Program
Fiscal Year Ending April 30, 2022 & 2023
Fund 630 - Water/Wastewater Fund
601 Maintenance Supplies 56,415 60,362 67,600 67,600 66,600 66,600 621 Office Supplies 1,599 1,591 2,800 2,800 2,800 2,800 622 Office Equipment 1,343 413 1,000 1,000 1,000 1,000 623 Office Furniture - - - - 600 - 624 Operating Supplies 32,158 32,945 47,950 47,950 47,950 47,950 625 Small Tools 1,926 1,815 1,900 1,900 1,900 1,900 626 Janitorial Supplies 169 182 400 400 400 400 627 Motor Fuel & Lubricants 14,310 13,553 12,710 11,000 11,000 11,250 631 Clothing 2,079 2,354 2,400 2,400 2,400 2,400 632 Per Copy Charges 294 277 450 450 450 450 663 Computer Software 3,145 3,138 6,810 2,735 6,305 10,940
Total Commodities 113,436 116,632 144,020 138,235 141,405 145,690
912 Bad Debt (3,115) 710 4,500 - 4,500 4,500 914 State/Federal Permit Fees - 311 560 560 - - 917 Employee Awards - 250 150 150 - 500 922 Grant Expense - - 66,500 66,500 66,500 66,500
Total Other Expenditures (3,115) 1,271 71,710 67,210 71,000 71,500
Total Water Distribution 1,280,738$ 1,399,624$ 1,547,247$ 1,504,670$ 1,620,008$ 1,631,695$
Program 70 - Water Treatment
501 Wages - Regular 265,583 279,687 275,434 270,220 278,960 282,246 502 Wages - Part Time - - 653 - - - 503 Overtime 17,374 19,568 20,250 17,090 20,250 20,250 504 Stand-By 41,311 42,399 43,140 39,950 43,140 43,140 521 Group Insurance 62,693 65,677 63,991 66,155 69,543 70,636 522 Medicare 4,579 4,827 4,923 4,620 4,965 5,013 523 Social Security 19,581 20,642 21,048 19,745 21,228 21,430 524 IMRF 35,102 33,392 38,626 37,310 40,116 39,978 529 Pension Expense 3,175 9,681 3,175 17,285 17,285 17,285
Total Personnel Services 449,399 475,874 471,240 472,375 495,487 499,978
531 Maintenance Service 64,272 62,791 72,330 72,330 72,470 73,790 544 Medical Service 53 26 300 300 300 300 559 Other Professional Services 7,359 9,052 12,000 12,000 12,000 12,000 562 Telephone 641 819 900 900 900 950 563 Publishing 3 - - - - - 564 Printing 119 143 500 500 500 500 571 Dues 407 249 500 500 325 450 572 Travel 89 1 450 450 500 500 573 Training 1,960 1,250 2,000 2,000 2,000 2,000 581 Utilities 286,085 266,828 333,000 283,000 334,000 334,000 595 Rentals 580 - 700 700 700 700 599 Other Contractual Services 758 833 780 780 780 800
Total Contractual Services 362,326 341,992 423,460 373,460 424,475 425,990
601 Maintenance Supplies 11,247 11,030 12,550 12,550 12,550 12,550 621 Office Supplies 1,639 1,670 900 900 900 900 622 Office Equipment 479 - 475 475 475 475 624 Operating Supplies 258,939 239,222 289,750 254,750 289,750 289,750 625 Small Tools 895 1,219 1,000 1,000 1,000 1,000 626 Janitorial Supplies 219 - 500 500 500 500 627 Motor Fuel & Lubricants 5,309 4,307 8,790 4,900 4,900 4,900 631 Clothing 1,101 1,393 1,350 1,350 1,350 1,350 663 Computer Software - 362 365 365 - -
Total Commodities 279,829 259,203 315,680 276,790 311,425 311,425
917 Employee Awards - - - - 200 500 Total Other Expenditures - - - - 200 500
DRAFT
115

2018-2019 2019-2020 2020-2021 2020-2021 2021-2022 2022-2023Account Description Actual Actual Budget Projected Budget Forecast
Expenditures
CITY OF GENEVA, ILLINOISBudget Detail by Program
Fiscal Year Ending April 30, 2022 & 2023
Fund 630 - Water/Wastewater Fund
Total Water Treatment 1,091,554$ 1,077,069$ 1,210,380$ 1,122,625$ 1,231,587$ 1,237,893$
Program 73 - GIS
501 Wages - Regular 55,521 66,944 67,595 - - - 502 Wages - Part-Time 1,720 3,264 4,375 66,140 69,021 70,918 503 Overtime - 85 - - - - 521 Group Insurance 9,160 8,171 7,948 - - - 522 Medicare 804 995 1,043 11,185 11,754 11,982 523 Social Security 3,436 4,255 4,462 935 1,000 1,028 524 IMRF 6,990 6,573 7,705 3,985 4,280 4,397 529 Pension Expense 632 1,906 635 7,540 8,089 8,085
Total Personnel Services 78,262 92,195 93,763 89,785 94,144 96,410
531 Maintenance Service 7,788 7,438 9,040 3,460 3,460 3,460 559 Other Professional Services - - - 15,290 15,290 15,290 562 Telephone 216 815 400 - - - 563 Publishing 25 - - 970 400 400 573 Training 4,012 2,262 3,130 - - - 595 Rentals 1,722 1,722 1,725 2,500 2,500 2,500
Total Contractual Services 13,763 12,237 14,295 22,220 21,650 21,650
601 Maintenance Supplies 179 35 1,105 1,725 - - 621 Office Supplies 718 520 1,285 1,105 - - 622 Office Equipment - - - 750 750 750 663 Computer Software - - - 750 750 750
Total Commodities 897 554 2,390 4,330 1,500 1,500
Total GIS 92,922$ 104,986$ 110,448$ 116,335$ 117,294$ 119,560$
Program 75 - Wastewater Treatment
501 Wages - Regular 309,107 296,569 307,167 300,410 312,879 318,624 502 Wages - Part-time/Seasonal - 2,480 6,278 - - - 503 Overtime 35,012 28,048 30,150 28,810 30,150 30,150 504 Stand-By 42,655 46,028 35,280 39,710 35,280 35,280 521 Group Insurance 75,990 70,966 72,148 74,135 77,942 78,296 522 Medicare 5,422 5,253 5,493 5,115 5,485 5,569 523 Social Security 23,186 22,462 23,489 21,875 23,455 23,811 524 IMRF 41,340 38,401 42,476 41,540 44,328 44,335 529 Pension Expense 3,739 11,133 3,740 18,080 18,080 18,080
Total Personnel Services 536,451 521,340 526,221 529,675 547,599 554,145
531 Maintenance Service 42,443 31,933 56,390 56,390 57,345 47,890 544 Medical Service 53 164 250 250 250 250 559 Other Professional Services 12,321 14,869 15,000 15,000 15,000 15,500 562 Telephone 3,323 749 1,500 630 630 630 563 Publishing 3 - - - - - 571 Dues - 60 235 235 110 235 572 Travel 1 60 100 100 100 100 573 Training 1,450 1,376 1,500 1,500 1,500 1,500 581 Utilities 219,210 203,056 206,000 206,000 206,000 206,000 584 Landfill Charges 36,873 43,782 46,000 40,000 50,000 50,000 586 Sewer Charges 30,363 53,136 36,000 36,000 36,000 36,000 595 Rentals 830 1,647 1,800 1,800 1,800 1,800 599 Other Contractual Services - 1,000 1,000 1,000 1,000 1,000
Total Contractual Services 346,868 351,830 365,775 358,905 369,735 360,905
601 Maintenance Supplies 25,926 25,838 26,800 26,800 26,800 26,800 621 Office Supplies 1,210 875 1,500 1,500 1,500 1,500 622 Office Equipment 1,174 - 300 300 300 300 624 Operating Supplies 87,981 88,612 115,000 85,000 95,000 95,000
DRAFT
116
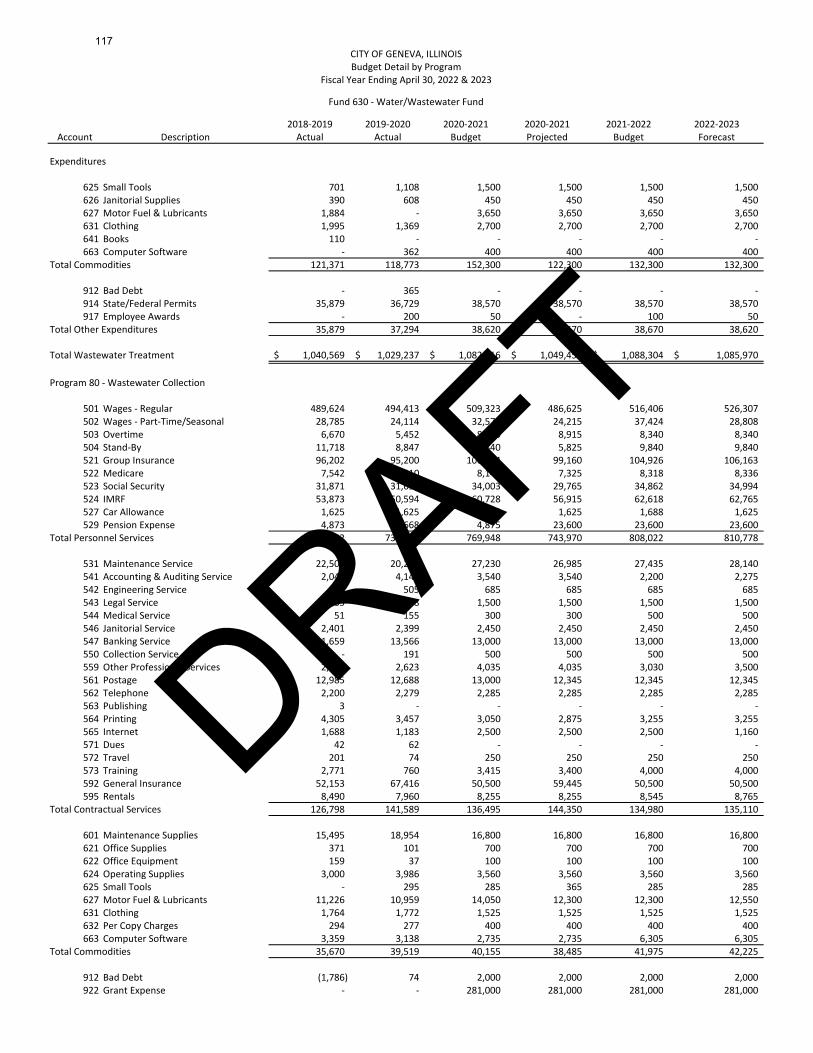
2018-2019 2019-2020 2020-2021 2020-2021 2021-2022 2022-2023Account Description Actual Actual Budget Projected Budget Forecast
Expenditures
CITY OF GENEVA, ILLINOISBudget Detail by Program
Fiscal Year Ending April 30, 2022 & 2023
Fund 630 - Water/Wastewater Fund
625 Small Tools 701 1,108 1,500 1,500 1,500 1,500 626 Janitorial Supplies 390 608 450 450 450 450 627 Motor Fuel & Lubricants 1,884 - 3,650 3,650 3,650 3,650 631 Clothing 1,995 1,369 2,700 2,700 2,700 2,700 641 Books 110 - - - - - 663 Computer Software - 362 400 400 400 400
Total Commodities 121,371 118,773 152,300 122,300 132,300 132,300
912 Bad Debt - 365 - - - - 914 State/Federal Permits 35,879 36,729 38,570 38,570 38,570 38,570 917 Employee Awards - 200 50 - 100 50
Total Other Expenditures 35,879 37,294 38,620 38,570 38,670 38,620
Total Wastewater Treatment 1,040,569$ 1,029,237$ 1,082,916$ 1,049,450$ 1,088,304$ 1,085,970$
Program 80 - Wastewater Collection
501 Wages - Regular 489,624 494,413 509,323 486,625 516,406 526,307 502 Wages - Part-Time/Seasonal 28,785 24,114 32,570 24,215 37,424 28,808 503 Overtime 6,670 5,452 8,340 8,915 8,340 8,340 504 Stand-By 11,718 8,847 9,840 5,825 9,840 9,840 521 Group Insurance 96,202 95,200 100,504 99,160 104,926 106,163 522 Medicare 7,542 7,510 8,140 7,325 8,318 8,336 523 Social Security 31,871 31,696 34,003 29,765 34,862 34,994 524 IMRF 53,873 50,594 60,728 56,915 62,618 62,765 527 Car Allowance 1,625 1,625 1,625 1,625 1,688 1,625 529 Pension Expense 4,873 14,668 4,875 23,600 23,600 23,600
Total Personnel Services 732,782 734,119 769,948 743,970 808,022 810,778
531 Maintenance Service 22,509 20,234 27,230 26,985 27,435 28,140 541 Accounting & Auditing Service 2,048 4,148 3,540 3,540 2,200 2,275 542 Engineering Service - 505 685 685 685 685 543 Legal Service 685 1,888 1,500 1,500 1,500 1,500 544 Medical Service 51 155 300 300 500 500 546 Janitorial Service 2,401 2,399 2,450 2,450 2,450 2,450 547 Banking Service 11,659 13,566 13,000 13,000 13,000 13,000 550 Collection Service - 191 500 500 500 500 559 Other Professional Services 2,607 2,623 4,035 4,035 3,030 3,500 561 Postage 12,985 12,688 13,000 12,345 12,345 12,345 562 Telephone 2,200 2,279 2,285 2,285 2,285 2,285 563 Publishing 3 - - - - - 564 Printing 4,305 3,457 3,050 2,875 3,255 3,255 565 Internet 1,688 1,183 2,500 2,500 2,500 1,160 571 Dues 42 62 - - - - 572 Travel 201 74 250 250 250 250 573 Training 2,771 760 3,415 3,400 4,000 4,000 592 General Insurance 52,153 67,416 50,500 59,445 50,500 50,500 595 Rentals 8,490 7,960 8,255 8,255 8,545 8,765
Total Contractual Services 126,798 141,589 136,495 144,350 134,980 135,110
601 Maintenance Supplies 15,495 18,954 16,800 16,800 16,800 16,800 621 Office Supplies 371 101 700 700 700 700 622 Office Equipment 159 37 100 100 100 100 624 Operating Supplies 3,000 3,986 3,560 3,560 3,560 3,560 625 Small Tools - 295 285 365 285 285 627 Motor Fuel & Lubricants 11,226 10,959 14,050 12,300 12,300 12,550 631 Clothing 1,764 1,772 1,525 1,525 1,525 1,525 632 Per Copy Charges 294 277 400 400 400 400 663 Computer Software 3,359 3,138 2,735 2,735 6,305 6,305
Total Commodities 35,670 39,519 40,155 38,485 41,975 42,225
912 Bad Debt (1,786) 74 2,000 2,000 2,000 2,000 922 Grant Expense - - 281,000 281,000 281,000 281,000
DRAFT
117

2018-2019 2019-2020 2020-2021 2020-2021 2021-2022 2022-2023Account Description Actual Actual Budget Projected Budget Forecast
Expenditures
CITY OF GENEVA, ILLINOISBudget Detail by Program
Fiscal Year Ending April 30, 2022 & 2023
Fund 630 - Water/Wastewater Fund
Total Other Expenditures (1,786) 74 283,000 283,000 283,000 283,000
Total Wastewater Collection 893,465$ 915,300$ 1,229,598$ 1,209,805$ 1,267,977$ 1,271,113$
Program 85 - Industrial Wastewater
501 Wages - Regular 74,448 70,249 73,856 72,520 75,227 76,605 503 Overtime 7 175 - - - - 504 Stand-By 57 133 - - - - 521 Group Insurance 18,009 16,314 16,787 17,335 18,310 18,637 522 Medicare 1,040 990 1,069 1,020 1,091 1,110 523 Social Security 4,448 4,233 4,580 4,365 4,665 4,750 524 IMRF 7,924 7,504 8,419 8,305 8,816 8,840 529 Pension Expense 717 2,176 720 3,570 3,570 3,570
Total Personnel Services 106,649 101,775 105,431 107,115 111,679 113,512
531 Maintenance Service - - 400 400 400 400 542 Engineering Service - 80 1,080 1,080 80 80 544 Medical Services - 20 40 40 40 40 559 Other Professional Services 16,386 11,421 10,500 10,500 10,500 10,500
Total Contractual Services 16,386 11,521 12,020 12,020 11,020 11,020
601 Maintenance Supplies 227 372 200 375 375 375 621 Office Supplies 143 109 240 240 240 240 624 Operating Supplies 7,462 7,474 7,375 7,375 7,200 7,200 627 Motor Fuel & Lubricants 589 655 505 550 550 500
Total Commodities 8,420 8,610 8,320 8,540 8,365 8,315
Total Industrial Wastewater 131,455$ 121,905$ 125,771$ 127,675$ 131,064$ 132,847$
Program 90 - Debt Service & Depreciation
599 Other Contractual Services - 964 - 3,415 3,415 3,415 Total Contractual Services - 964 - 3,415 3,415 3,415
705 Principal 1,778,037 2,035,762 2,301,675 2,367,200 2,264,990 2,497,015 710 Interest 590,258 606,937 617,254 619,940 559,295 506,865 715 Paying Agent Fees 656 671 550 550 550 550 910 Capitalized Assets (1,778,037) (2,035,763) - - - -
Total Debt Service 590,913 607,607 2,919,479 2,987,690 2,824,835 3,004,430
911 Depreciation 2,365,061 2,535,385 2,400,000 2,500,000 2,500,000 2,500,000 Total Other Expenditures 2,365,061 2,535,385 2,400,000 2,500,000 2,500,000 2,500,000
Total Debt Service & Depreciation 2,955,975$ 3,143,956$ 5,319,479$ 5,491,105$ 5,328,250$ 5,507,845$
Program 95 - Capital Outlay
810 Buildings & Improvements 34,997 34,044 52,500 - 255,000 39,000 815 Improvements - Other than Buildings 2,740,645 13,263,599 3,871,200 3,053,440 1,837,500 2,707,000 820 Machinery & Equipment 141,226 196,855 335,250 273,210 499,000 230,000 825 Vehicles 29,328 244,441 475,000 - 490,000 43,000 835 Computer Equipment 9,642 37,147 31,830 15,000 19,280 42,175 910 Capitalized Assets 6,089,976 (10,519,508) - - - -
Total Capital Outlay 9,045,815 3,256,577 4,765,780 3,341,650 3,100,780 3,061,175
Total Capital Outlay 9,045,815$ 3,256,577$ 4,765,780$ 3,341,650$ 3,100,780$ 3,061,175$
Total Water/Wastewater Fund 16,800,861$ 11,342,866$ 15,746,590$ 14,279,335$ 14,231,180$ 14,404,395$
DRAFT
118

2018-2019 2019-2020 2020-2021 2020-2021 2021-2022 2022-2023Account Description Actual Actual Budget Projected Budget Forecast
Revenues and Other Financing Sources
464 Refuse Charges 525,069$ 521,525$ 587,230$ 526,580$ 526,580$ 528,580$ Total Service Charges 525,069 521,525 587,230 526,580 526,580 528,580
486 Donations 2,999 - - - - - 489 Miscellaneous - 20,000 25,000 20,000 20,000 20,000
Total Other Revenues 2,999 20,000 25,000 20,000 20,000 20,000
Total Revenues and Other Financing Sources 528,068$ 541,525$ 612,230$ 546,580$ 546,580$ 548,580$
Expenditures and Other Financing Uses
501 Wages - Regular 35,442$ 35,607$ 33,468$ 32,680$ 34,150$ 34,694$ 502 Wages - Part-Time/Seasonal 329 339 3,177 345 379 389 503 Overtime 5 4 - - - - 521 Group Insurance 4,425 4,597 4,489 4,845 5,229 5,308 522 Medicare 502 507 532 465 501 511 523 Social Security 2,078 2,091 2,134 1,655 2,021 2,064 524 IMRF 3,756 3,504 4,177 3,765 4,045 4,057 529 Pension Expense 340 1,016 340 1,525 1,525 1,525
Total Personnel Services 46,876 47,664 48,317 45,280 47,850 48,548
543 Legal Services 1,500 - - - - - 547 Banking Services 2,870 3,283 3,200 3,200 3,200 3,202 550 Collection Service - 15 100 100 100 100 552 Data Programming Service - - 128 - 130 130 561 Postage 617 95 1,100 150 240 240 564 Printing 337 893 1,210 450 450 450 583 Garbage Disposal 497,511 452,172 542,945 485,305 485,305 485,305
Total Commodities - - - - - -
912 Bad Debt (375) 210 500 500 500 500 999 Source of Reserves - - 14,730 - 8,805 10,105
Total Other Financing Uses (375) 210 15,230 500 9,305 10,605
Total Expenditures and Other Financing Uses 549,336$ 504,332$ 612,230$ 534,985$ 546,580$ 548,580$
CITY OF GENEVA, ILLINOISBudget Detail by Account
Fiscal Year Ending April 30, 2022 & 2023
Fund 643 - Refuse Fund
DRAFT
119

2018-2019 2019-2020 2020-2021 2020-2021 2021-2022 2022-2023Account Description Actual Actual Budget Projected Budget Forecast
Revenues and Other Financing Sources
474 Grave Opening Fees 31,650$ 25,120$ 29,750$ 29,750$ 29,750$ 30,000$ Total Service Fees 31,650 25,120 29,750 29,750 29,750 30,000
481 Interest Income 8,534 11,032 6,500 3,625 3,650 3,650 488 Cemetery Lot Sales 39,400 24,800 50,200 37,500 39,000 37,500 489 Miscellaneous 230 150 - - - -
Total Other Revenues 48,164 35,982 56,700 41,125 42,650 41,150
Total Revenues and Other Financing Sources 79,814$ 61,102$ 86,450$ 70,875$ 72,400$ 71,150$
Expenditures and Other Financing Uses
531 Maintenance Service 14,550$ 15,006$ 16,000$ 16,000$ 16,000$ 16,000$ 543 Legal Service - - 200 200 200 200 547 Banking Service 453 351 750 750 750 750 559 Other Professional Services 26,700 22,378 31,450 31,450 31,450 31,450 563 Publishing - - 50 50 50 50 581 Utilities 386 742 550 800 800 800
Total Contractual Services 42,090 38,476 49,000 49,250 49,250 49,250
601 Maintenance Supplies 693 204 300 300 300 300 624 Operating Supplies 469 35 300 365 400 300 663 Computer Software 435 3,045 2,200 2,200 2,200 2,200
Total Commodities 1,598 3,284 2,800 2,865 2,900 2,800
911 Depreciation 3,717 3,717 4,000 3,720 3,720 3,720 914 State/Federal Permits - - 300 300 300 300
Total Other Expenditures 3,717 3,717 4,300 4,020 4,020 4,020
999 Source of Reserves - - 30,350 - 16,230 15,080 Total Other Financing Uses - - 30,350 - 16,230 15,080
Total Expenditures and Other Financing Uses 47,404$ 45,477$ 86,450$ 56,135$ 72,400$ 71,150$
CITY OF GENEVA, ILLINOISBudget Detail by Account
Fiscal Year Ending April 30, 2022 & 2023
Fund 659 - Cemetery Fund
DRAFT
120

2018-2019 2019-2020 2020-2021 2020-2021 2021-2022 2022-2023Account Description Actual Actual Budget Projected Budget Forecast
Revenues and Other Financing Sources
451 Parking Violations 45,912$ 40,189$ 40,000$ -$ 40,000$ 40,000$ Total Fines & Forfeits 45,912 40,189 40,000 - 40,000 40,000
447 Federal Grants - (85) - - - - Total Intergovernmental Revenues - (85) - - - -
477 Parking Lot Fees 581,260 535,529 561,000 - 182,230 441,740 Total Service Fees 581,260 535,529 561,000 - 182,230 441,740
481 Interest Income 19,889 33,141 19,000 10,000 5,000 2,000 482 Rental Income - 120 - - - - 484 Sale of Capital Assets - 2,375 - - - - 489 Miscellaneous - 44,688 - - - -
Total Other Revenues 19,889 80,323 19,000 10,000 5,000 2,000
499 Reappropriation - - 377,470 - 363,250 140,010 Total Other Financing Uses - - 377,470 - 363,250 140,010
Total Revenues and Other Financing Sources 647,062$ 655,957$ 997,470$ 10,000$ 590,480$ 623,750$
Expenditures and Other Financing Uses
501 Wages - Regular 54,862$ 59,270$ 58,080$ 35,415$ 49,249$ 60,660$ 503 Overtime 91 - - - - - 521 Group Insurance 12,732 13,338 13,820 8,005 11,728 14,809 522 Medicare 766 827 843 505 715 879 523 Social Security 3,223 3,487 3,528 2,070 2,984 3,696 524 IMRF 5,874 5,683 6,620 4,040 5,768 6,978 529 Pension Expense 531 1,647 530 3,050 3,050 3,050
Total Personnel Services 78,078 84,251 83,421 53,085 73,494 90,072
531 Maintenance Service 32,185 13,235 27,100 27,100 27,980 28,070 541 Accounting & Auditing Service 305 241 340 340 350 350 543 Legal Service - 38 - - - - 547 Banking Services 13,433 14,168 14,500 500 641 14,503 561 Postage 1,973 1,362 1,800 500 390 1,320 562 Telephone 1,563 2,151 2,400 2,400 2,400 2,400 564 Printing 3,217 3,789 3,870 - 185 2,125 581 Utilities 31,710 28,756 28,900 29,200 29,200 29,200 595 Rentals 47,435 47,567 47,310 - 47,440 47,310 599 Other Contractual Services 454 457 500 500 500 500
Total Contractual Services 132,276 111,764 126,720 60,540 109,086 125,778
601 Maintenance Supplies 271 40 2,000 2,000 2,000 2,000 621 Office Supplies 2 58 - - - - 622 Office Equipment - - 3,334 - - - 624 Operating Supplies 6 53 500 500 500 500 663 Computer Software 2,400 5,400 5,400 5,400 5,400 5,400
Total Commodities 2,679 5,551 11,234 7,900 7,900 7,900
CITY OF GENEVA, ILLINOISBudget Detail by Account
Fiscal Year Ending April 30, 2022 & 2023
Fund 660 - Commuter Parking Fund
DRAFT
121

2018-2019 2019-2020 2020-2021 2020-2021 2021-2022 2022-2023Account Description Actual Actual Budget Projected Budget Forecast
CITY OF GENEVA, ILLINOISBudget Detail by Account
Fiscal Year Ending April 30, 2022 & 2023
Fund 660 - Commuter Parking Fund
705 Principal 2000 Revenue Bonds 165,000 170,000 365,000 365,000 - - 710 Interest 2000 Revenue Bonds 24,080 17,518 11,095 7,350 - - 715 Paying Agent Fees 106 121 - - - -
Total Debt Service 189,186 187,639 376,095 372,350 - -
820 Machinery & Equipment - 9,990 - - - - 835 Computer Equipment 2,984 - - - - - 910 Capitalized Assets (165,000) (170,000) - - - -
Total Capital Outlay (162,016) (160,010) - - - -
911 Depreciation 381,853 380,866 400,000 400,000 400,000 400,000 Total Other Expenditures 381,853 380,866 400,000 400,000 400,000 400,000
Total Expenditures and Other Financing Uses 622,055$ 610,062$ 997,470$ 893,875$ 590,480$ 623,750$
DRAFT
122

2018-2019 2019-2020 2020-2021 2020-2021 2021-2022 2022-2023Department Description Actual Actual Budget Projected Budget Forecast
40 Administrative Services 406,039$ 398,505$ 776,095$ 772,350$ 400,000$ 400,000$ 70 Police 85,650 91,940 91,836 41,720 61,320 94,375 90 Public Works 130,366 119,617 126,205 79,805 129,160 129,375
Total Commuter Parking Fund 622,055$ 610,062$ 994,136$ 893,875$ 590,480$ 623,750$
CITY OF GENEVA, ILLINOISExpenditure Budget Summary by Department
Fiscal Year Ending April 30, 2022 & 2023
Fund 660 - Commuter Parking Fund
DRAFT
123

2017-2018 2018-2019 2019-2020 2019-2020 2020-2021 2021-2022Description Actual Actual Budget Projected Budget Forecast
40 Administrative ServicesDebt Service 189,186$ 187,639$ 376,095$ 372,350$ -$ -$ Capital Outlay 216,853 210,866 400,000 400,000 400,000 400,000 Total 406,039 398,505 776,095 772,350 400,000 400,000
70 PolicePersonnel Services 61,641 67,163 66,266 35,320 54,704 71,027 Contractual Services 18,623 19,319 20,170 1,000 1,216 17,948 Commodities 2,402 5,458 5,400 5,400 5,400 5,400 Capital Outlay 2,984 - - - - - Total 85,650 91,940 91,836 41,720 61,320 94,375
90 Public WorksPersonnel Services 16,437 17,089 17,155 17,765 18,790 19,045 Contractual Services 113,653 92,445 106,550 59,540 107,870 107,830 Commodities 276 93 2,500 2,500 2,500 2,500 Capital Outlay - 9,990 - - - - Total 130,366 119,617 126,205 79,805 129,160 129,375
Total Commuter Parking Fund 622,055 610,062 994,136 893,875 590,480 623,750
Total Commuter Parking FundPersonnel Services 78,078$ 84,251$ 83,421$ 53,085$ 73,494$ 90,072$ Contractual Services 132,276 111,764 126,720 60,540 109,086 125,778 Commodities 2,679 5,551 7,900 7,900 7,900 7,900 Debt Service 189,186 187,639 376,095 372,350 - - Capital Outlay 219,837 220,856 400,000 400,000 400,000 400,000 Total 622,055 610,062 994,136 893,875 590,480 623,750
CITY OF GENEVA, ILLINOISExpenditure Budget Summary by Department and Classification
Fiscal Year Ending April 30, 2022 & 2023
Fund 660 - Commuter Parking Fund
DRAFT
124

2018-2019 2019-2020 2020-2021 2020-2021 2021-2022 2022-2023Account Description Actual Actual Budget Projected Budget Forecast
Expenditures
Department 40 - Administration
705 Principal 165,000$ 170,000$ 365,000$ 365,000$ -$ -$ 710 Interest 24,080 17,518 11,095 7,350 - - 715 Paying Agent Fees 106 121 - - - -
Total Debt Service 189,186 187,639 376,095 372,350 - -
910 Capitalized Assets (165,000) (170,000) - - - - 911 Depreciation 381,853 380,866 400,000 400,000 400,000 400,000
Total Capital Outlay 216,853 210,866 400,000 400,000 400,000 400,000
Total Administration 406,039$ 398,505$ 776,095$ 772,350$ 400,000$ 400,000$
Department 70 - Police
501 Wages - Regular 42,258 46,246 45,032 22,365 35,588 46,786 503 Overtime 91 - - - - - 521 Group Insurance 11,230 11,842 12,244 6,425 9,889 12,953 522 Medicare 588 644 654 315 516 678 523 Social Security 2,515 2,754 2,792 1,330 2,206 2,900 524 IMRF 4,549 4,401 5,134 2,550 4,170 5,375 529 Pension Expense 411 1,276 410 2,335 2,335 2,335
Total Personnel Services 61,641 67,163 66,266 35,320 54,704 71,027
547 Banking Service 13,433 14,168 14,500 500 641 14,503 561 Postage 1,973 1,362 1,800 500 390 1,320 564 Printing 3,217 3,789 3,870 - 185 2,125
Total Contractual Services 18,623 19,319 20,170 1,000 1,216 17,948
621 Office Supplies 2 58 - - - - 663 Computer Software 2,400 5,400 5,400 5,400 5,400 5,400
Total Commodities 2,402 5,458 5,400 5,400 5,400 5,400
835 Computer Equipment 2,984 - - - - - Total Capital Outlay 2,984 - - - - -
Total Police 85,650$ 91,940$ 91,836$ 41,720$ 61,320$ 94,375$
Department 90 - Public Works
501 Wages - Regular 12,603 13,024 13,048 13,050 13,661 13,874 521 Overtime 1,502 1,496 1,576 1,580 1,839 1,856 522 Stand-By 177 183 189 190 199 201 523 Group Insurance 708 733 736 740 778 796 524 Medicare 1,325 1,281 1,486 1,490 1,598 1,603 529 Social Security 120 371 120 715 715 715
Total Personnel Services 16,437 17,089 17,155 17,765 18,790 19,045
531 Maintenance Service 32,185 13,235 27,100 27,100 27,980 28,070 541 Accounting & Auditing Service 305 241 340 340 350 350 543 Legal Service - 38 - - - - 562 Telephone 1,563 2,151 2,400 2,400 2,400 2,400 581 Utilities 31,710 28,756 28,900 29,200 29,200 29,200 595 Rentals 47,435 47,567 47,310 - 47,440 47,310 599 Other Contractual Services 454 457 500 500 500 500
Total Contractual Services 113,653 92,445 106,550 59,540 107,870 107,830
CITY OF GENEVA, ILLINOISBudget Detail by Department
Fiscal Year Ending April 30, 2022 & 2023
Fund 660 - Commuter Parking Fund
DRAFT
125

2018-2019 2019-2020 2020-2021 2020-2021 2021-2022 2022-2023Account Description Actual Actual Budget Projected Budget Forecast
Expenditures
CITY OF GENEVA, ILLINOISBudget Detail by Department
Fiscal Year Ending April 30, 2022 & 2023
Fund 660 - Commuter Parking Fund
601 Maintenance Supplies 271 40 2,000 2,000 2,000 2,000 624 Operating Supplies 6 53 500 500 500 500
Total Commodities 276 93 2,500 2,500 2,500 2,500
820 Machinery & Equipment - 9,990 - - - - Total Capital Outlay - 9,990 - - - -
Total Public Works 130,366$ 119,617$ 126,205$ 79,805$ 129,160$ 129,375$
Total Commuter Parking Fund 622,055$ 610,062$ 994,136$ 893,875$ 590,480$ 623,750$
DRAFT
126

2018-2019 2019-2020 2020-2021 2020-2021 2021-2022 2022-2023Account Description Actual Actual Budget Projected Budget Forecast
Revenues and Other Financing Sources
478 Insurance Premiums 177,879$ 178,707$ 195,040$ 182,345$ 196,830$ 196,830$ Total Service Fees 177,879 178,707 195,040 182,345 196,830 196,830
481 Interest Income 1,359 (363) - - - - 489 Miscellaneous 22 2 - 5 - -
Total Other Revenues 1,380 (362) - 5 - -
Total Revenues and Other Financing Sources 179,260$ 178,345$ 195,040$ 182,350$ 196,830$ 196,830$
Expenditures and Other Financing Uses
547 Banking Services -$ -$ 50$ -$ 50$ 50$ 549 Claims Administration 11,025 11,040 10,700 11,130 11,130 11,130 594 Dental Claims 155,034 133,552 160,000 155,000 160,000 160,000
Total Contractual Services 166,058 144,592 170,750 166,130 171,180 171,180
999 Source of Reserves - - 24,290 - 25,650 25,650 Total Other Financing Uses - - 24,290 - 25,650 25,650
Total Expenditures and Other Financing Uses 166,058$ 144,592$ 195,040$ 166,130$ 196,830$ 196,830$
CITY OF GENEVA, ILLINOISBudget Detail by Account
Fiscal Year Ending April 30, 2022 & 2023
Fund 710 - Group Dental Insurance
DRAFT
127

2018-2019 2019-2020 2020-2021 2020-2021 2021-2022 2022-2023Account Description Actual Actual Budget Projected Budget Forecast
Revenues and Other Financing Sources
478 Insurance Premiums 525,362$ 821,924$ 873,305$ 792,335$ 845,570$ 857,220$ Total Service Fees 525,362 821,924 873,305 792,335 845,570 857,220
481 Interest Income 3,753 2,152 - 1,000 1,000 1,000 485 Reimbursed Expenditures (23,678) - - - - -
Total Other Revenues (19,925) 2,152 - 1,000 1,000 1,000
499 Reappropriation - - 22,550 - 5,565 35,635 Total Other Financing Sources - - 22,550 - 5,565 35,635
Total Revenues and Other Financing Sources 505,437$ 824,076$ 895,855$ 793,335$ 852,135$ 893,855$
Expenditures and Other Financing Uses
549 Claims Administration 14,015$ 7,486$ 4,000$ 6,000$ 6,000$ 2,000$ 573 Training & Professional Development - - 1,200 300 1,200 1,200 592 General Insurance 127,668 135,516 134,060 130,200 134,060 134,060 593 Workers Compensation Claims (11,495) 460,688 756,595 756,595 710,875 756,595
Total Contractual Services 130,188 603,690 895,855 893,095 852,135 893,855
999 Source of Reserves - - - - - -
CITY OF GENEVA, ILLINOISBudget Detail by Account
Fiscal Year Ending April 30, 2022 & 2023
Fund 715 - Workers' Compensation
DRAFT
128

2018-2019 2019-2020 2020-2021 2020-2021 2021-2022 2019-2020Account Description Actual Actual Budget Projected Budget Forecast
Revenues and Other Financing Sources
480 Pension Contributions 1,720,620$ 2,090,240$ 2,102,020$ 5,215,300$ 2,112,400$ 2,112,400$ 481 Interest Income 1,508,447 14,837 1,275,000 1,275,000 1,275,000 1,275,000
Total Other Revenues 3,229,067 2,105,076 3,377,020 6,490,300 3,387,400 3,387,400
Total Revenues and Other Financing Sources 3,229,067$ 2,105,076$ 3,377,020$ 6,490,300$ 3,387,400$ 3,387,400$
Expenditures and Other Financing Uses
525 Police/Fire Pension 1,471,691$ 1,765,432$ 2,000,000$ 1,900,000$ 2,100,000$ 2,267,000$ 526 Pension Refunds 23,988.40 16,800.64 - - - -
Total Personnel Services 1,495,679 1,782,233 2,000,000 1,900,000 2,100,000 2,267,000
541 Accounting & Auditing Service 20,860 24,709 25,950 26,255 27,145 27,995 543 Legal Service 840 1,816 1,000 1,000 1,000 1,000 544 Medical Service - - 5,000 5,000 5,000 5,000 548 Financial Service 83,708 90,217 112,000 112,000 116,000 115,000 571 Dues & Subscriptions 795 795 795 795 795 795 573 Training & Professional Development 515 1,245 1,875 1,875 1,875 1,875 591 Liability Insurance 7,560 8,099 8,700 8,685 8,900 8,900 599 Other Contractual Services - - 2,000 2,000 2,000 2,000
Total Contractual Services 114,277 126,881 157,320 157,610 162,715 162,565
Total Expenditures and Other Financing Uses 1,609,956$ 1,909,114$ 2,157,320$ 2,057,610$ 2,262,715$ 2,429,565$
CITY OF GENEVA, ILLINOISBudget Detail by Account
Fiscal Year Ending April 30, 2022 & 2023
Fund 801 - Police Pension
DRAFT
129

2018-2019 2019-2020 2020-2021 2020-2021 2021-2022 2019-2020Account Description Actual Actual Budget Projected Budget Forecast
Revenues and Other Financing Sources
480 Pension Contributions 759,831$ 1,008,875$ 1,019,450$ 1,019,450$ 1,034,275$ 1,041,125$ 481 Interest Income 161,330 (1,171,255) 900,000 900,000 900,000 900,000
Total Other Revenues 921,160 (162,380) 1,919,450 1,919,450 1,934,275 1,941,125
Total Revenues and Other Financing Sources 921,160$ (162,380)$ 1,919,450$ 1,919,450$ 1,934,275$ 1,941,125$
Expenditures and Other Financing Uses
525 Police/Fire Pension 782,900$ 803,961$ 904,690$ 830,285$ 880,850$ 907,300$ 526 Pension Refunds 7,158 - - - - -
Total Personnel Services 790,058 803,961 904,690 830,285 880,850 907,300
541 Accounting & Auditing Service 12,050 15,196 16,510 12,650 16,480 17,145 543 Legal Service - - 750 - 750 750 544 Medical Service - - 500 - 500 500 547 Banking Service - 15 - - - - 548 Financial Service 29,427 31,229 36,000 36,000 37,000 38,000 561 Postage - 5 - - - - 571 Dues & Subscriptions 795 795 795 795 795 795 573 Training & Professional Development 140 60 1,875 1,875 1,000 1,000 591 Liability Insurance 5,202 5,380 5,800 5,315 5,500 5,750 599 Other Contractual Services - - 3,000 3,000 3,000 3,000
Total Contractual Services 47,614 52,680 65,230 59,635 65,025 66,940
Total Expenditures and Other Financing Uses 837,672$ 856,641$ 969,920$ 889,920$ 945,875$ 974,240$
CITY OF GENEVA, ILLINOISBudget Detail by Account
Fiscal Year Ending April 30, 2022 & 2023
Fund 802 - Fire Pension
DRAFT
130

Fiscal Year Ending April 30, 2022 & 2023
Fund Account Description FY 2022 FY 2023
219 Tourism815.05 Welcome Signage 30,000$ 29,500$
30,000$ 29,500$ 0.12% 0.28%
240 PEG835 Broadcasting & Chamber Improvements 5,000$ 5,000$ 835 Studio Electronics 20,000 20,000
25,000$ 25,000$ 0.10% 0.24%
251 SSA #1820 Rainman Statue Engineering 20,000$ -$
20,000$ -$ 0.08% 0.00%
410 General Capital Projects810 City Buildings Repairs & Improvements -$ 200,000$ 810 City Hall Exterior Painting 10,500 - 810 Replace City Hall Exterior Landing, Stairs & Doorway 50,000 - 810 Replace City Hall Interior Stair and Landing Coverings 5,500 - 810 Replace City Hall Wheel Chair Lift 35,000 - 810 Roof Replacement of Building C 25,000 - 810 Access Control to Locker Rooms 20,000 - 810 Emergency Call Box 15,000 - 810 PW Building Repairs and Upgrades 15,000 15,000
815.05 SEMP Implementation 25,000 - 201,000$ 215,000$
0.78% 2.05%415 Infrastructure Capital Projects
815.05 ADA Sidewalk Improvement Program 50,000$ -$ 815.05 Annual Sidewalk Program 50,000 50,000 815.05 Annual Streetscape & Median Maintenance Program 25,000 25,000 815.05 Annual Contractual Tree Maintenance 30,000 30,000 815.05 Annual Tree Replacements 30,000 30,000 815.05 Design Engineering 20,000 20,000 815.05 East State Street Phase 2 Engineering 55,000 - 815.05 East State Street Phase 3 Engineering 125,000 675,000 815.05 East State Street ROW Acquisition 705,000 - 815.05 Kautz Road Averill to Division - ROW Acquisition 162,000 - 815.05 Kautz Road Averill to Division - Phase 2 Engineering 185,000 - 815.05 Kautz Road Averill to Division - Phase 3 Engineering 40,000 400,000 815.05 Kautz Road RT 38 to Fabyan - Phase 2 Engineering 40,000 - 815.05 Kautz Road RT 38 to Fabyan - Phase 3 Engineering 50,000 50,000 815.05 Welcome Signage 28,600 - 815.10 Annual Roadway Improvement Program 1,000,000 1,000,000 815.10 Annual Pavement Marking Program 45,000 45,000 815.15 Annual Storm Sewer Maintenance Program 150,000 150,000 815.15 Storm Sewer Infrastructure Improvements 100,000 100,000 815.15 Citywide Watershed Study 151,000 - 815.15 Storm Sewer Rehabilitation 150,000 150,000 815.20 City-wide Culvert/Bridge Inventory Study & Maintenance 40,000 - 815.20 State Street Bridge Railing Replacement Study 100,000 -
3,331,600$ 2,725,000$
CITY OF GENEVA, ILLINOISFY 2022 & 23 Capital Improvement Program by Fund
DRAFT
131

Fiscal Year Ending April 30, 2022 & 2023
Fund Account Description FY 2022 FY 2023
CITY OF GENEVA, ILLINOISFY 2022 & 23 Capital Improvement Program by Fund
12.99% 25.92%420 Prairie Green
815.40 Trail Head Parking Lot 400,000$ -$ 400,000$ -$
1.56% 0.00%425 TIF #2
815.05 East State Street ROW Acquisition 816,000$ -$ 816,000$ -$
3.18% 0.00%426 TIF #3
815.05 East State Street ROW Acquisition 553,250$ -$ 553,250$ -$
2.16% 0.00%430 Capital Equipment
820 Gas Masks & Canisters 20,000$ -$ 820 Replace Fire Boat #2 15,000 - 820 Replacement Fire Hose 5,000 5,000 820 Fire Personal Protective Equipment (PPE) 26,225 27,000 820 SCBA Equipment (Bottles/Packs/Masks) 12,000 11,000 820 Special Team Equipment (Hazmat, TRT, Water Rescue) 10,000 10,000 820 New Truck 201 Equipment 45,000 - 820 Scissor Lift and Trailer 17,000 - 820 Replace Stump Grinder 35,000 - 820 Message/Arrow Board 7,000 - 820 Replacement Trailer 8,000 - 820 Replace New Holland Skidster 170,000 - 820 Replace John Deere Sidewalk Machine - 55,000 825 2021 Chevrolet Tahoe SUV Squad Car 58,185 - 825 2021 Ford Explorer SUV Squad Car 49,375 - 825 2021 Ford Explorer SUV Squad Car 49,375 - 825 Fire Truck 201 Replacement 1,200,000 - 825 GEMA Car Conversions 5,000 - 825 Replace Single Axle Dump Truck with Plow 210,000 - 825 Replace Single Axle Dump Truck with Plow 210,000 - 825 Replace One Ton Dump Truck 105,000 - 825 Replace Single Axle Dump Truck with Plow - 210,000 825 Replace One Ton Truck - 105,000 825 Replace One Ton Dump Truck - 100,000 825 Replace One Ton Dump Truck - 95,000 825 Replace Bucket Truck - 200,000 825 Replace Dump Truck - 185,000 825 Other Vehicles - 650,000 835 Computer Equipment 66,795 40,815
2,323,955$ 1,693,815$ 9.06% 16.11%
620 Electric810 PW Building Repairs and Upgrades 15,000$ 15,000$ 810 Green Initiatives 5,000 5,000
815.05 Community Betterment Projects 2,000 2,000 815.05 Miscellaneous Development 120,000 120,000 815.05 System Model Update and Hosting Study 40,000 - 815.05 Update SPCC Plan 2,000 -
DRAFT
132

Fiscal Year Ending April 30, 2022 & 2023
Fund Account Description FY 2022 FY 2023
CITY OF GENEVA, ILLINOISFY 2022 & 23 Capital Improvement Program by Fund
815.25 Underground/Overhead Cable Replacement 1,010,595 1,000,000 815.25 ERT Meter Replacements 250,000 60,000 815.25 Geneva Generation Facility (GGF) Equipment 100,000 100,000 815.25 GGF Pre-Chamber Check Valve Replacement 500,000 - 815.25 Line Supplies 270,000 270,000 815.25 SEMP Substation and Feeders 12,084,265 - 815.25 Substation Upgrades 100,000 800,000 815.25 Obsolete Voltage Conversion 100,000 100,000 815.25 State St. & Eastside Dr. Vault Cover 20,000 - 815.25 Fault Indicator Replacement 50,000 -
820 Small Equipment Replacement 15,000 15,000 820 Message/Arrow Board 7,000 - 820 Scissor Lift and Trailer 17,000 - 820 Meter Test Set Replacement 40,000 - 820 Other Equipment - 85,000 825 Replace One Ton Dump Truck and Crane 75,000 160,000 835 iPads 2,000 - 835 Computer Replacement/Equipment 18,000 31,830
14,842,860$ 2,763,830$ 57.88% 26.29%
630 Water/Wastewater810 WWTP Landscape Renovations - Pond - 10,000 810 WWTP Administration Building Repairs - 14,000 810 PW Building Repairs and Upgrades 15,000 15,000 810 WWTP Digester Brick Tuck Pointing 25,000 - 810 WWTP Digester Inside Cleaning 170,000 - 810 WWTP Digester Repairs 30,000 - 810 WWTP Water Proof RAW Dry-Pit Pump Building 15,000 -
815.05 Water Main Replacement Engineering - 80,000 815.05 WWTP Digester Engineering Services 25,000 - 815.05 Water Plant Reservoir Inside Inspection - 12,000 815.05 Water System Risk & Resilience Assessment 50,000 - 815.30 Lead Water Service Replacement 20,000 20,000 815.30 Fire Hydrant Painting - 30,000 815.30 Fire Hydrant Replacement 21,000 21,000 815.30 Mainline Water Valve Replacement 12,000 12,000 815.30 Well #13 Rehab 150,000 - 815.30 Well #6 Rehab 150,000 815.30 Water Main Infrastructure Replacement 600,000 - 815.30 Water Main Installation New 200,000 - 815.30 East State Street Water Main - 1,000,000 815.30 Water Meter Replacements 50,000 20,000 815.30 Water Meters for New Construction 15,000 15,000 815.30 Water Plant Pump Services - 5,000 815.30 Water System Leak Survey 30,000 30,000 815.30 Logan Water Tower Washing - 7,000 815.30 RO#3 & RO#4 VFD Installation 50,000 - 815.35 Sanitary Sewer Evaluation 315,500 150,000 815.35 Sanitary Sewer Rehabilitation - Geneva East 200,000 - 815.35 Sanitary Sewer Cleaning & Televising 75,000 75,000 815.35 East State Street Sanitary Sewer - 1,000,000
DRAFT
133

Fiscal Year Ending April 30, 2022 & 2023
Fund Account Description FY 2022 FY 2023
CITY OF GENEVA, ILLINOISFY 2022 & 23 Capital Improvement Program by Fund
815.35 Water Plant Lift Station VFD's & SCADA Improvements - 60,000 815.35 WWTP Dewatering Feed Pump VFD SCADA Control 12,000 - 815.35 WWTP Dewatering Centrifuge VFD SCADA Control 12,000 - 815.35 Western Avenue Lift Station PLC Upgrade - 20,000
820 Sewer Televising Equipment 70,000 - 820 WWTP Security Improvements - 30,000 820 WWTP Modular Shelter for Sampler - 8,000 820 Primary Clarifier Flight Replacement 200,000 - 820 Message/Arrow Board 7,000 - 820 Scissor Lift & Trailer 17,000 - 820 WWTP Dewatering Feed Sludge Pump 10,000 - 820 WWTP Excess Flow Gate Actuator - 7,000 820 HVAC for Water Plant VFD Room 15,000 - 820 Waste Activated Sludge Pump 30,000 - 820 WWTP Conveyor Repair 30,000 - 820 RO#3 & RO#4 VFD Purchase 80,000 - 820 Water Plant Filter Effluent Control Valves 30,000 - 820 Water Plant Pipe Hanging Supports 10,000 - 820 Replacement of Reverse Osmosis Membranes 185,000 825 WTP Van Replacement (2102) - 43,000 825 Vactor Truck Replacement (2069) 490,000 - 835 Computer Replacement - Water Fund 11,780 10,175 835 Itron Collector - 32,000 835 Large Format Scanner 7,500 -
3,100,780$ 3,061,175$ 12.09% 29.12%
Grand Total 25,644,445$ 10,513,320$
DRAFT
134

Fiscal Year Ending April 30, 2022 & 2023
Account Fund Description FY 2022 FY 2023
810 Buildings & Improvements410 City Buildings Repairs & Improvements -$ 200,000$ 410 City Hall Exterior Painting 10,500 - 410 Replace City Hall Exterior Landing, Stairs & Doorway 50,000 - 410 Replace City Hall Interior Stair and Landing Coverings 5,500 - 410 Replace City Hall Wheel Chair Lift 35,000 - 410 Roof Replacement of Building C 25,000 - 410 Access Control to Locker Rooms 20,000 - 410 Emergency Call Box 15,000 - 410 PW Building Repairs and Upgrades 15,000 15,000 620 PW Building Repairs and Upgrades 15,000 15,000 620 Green Initiatives 5,000 5,000 630 WWTP Landscape Renovations - Pond - 10,000 630 WWTP Administration Building Repairs - 14,000 630 PW Building Repairs and Upgrades 15,000 15,000 630 WWTP Digester Brick Tuck Pointing 25,000 - 630 WWTP Digester Inside Cleaning 170,000 - 630 WWTP Digester Repairs 30,000 - 630 WWTP Water Proof RAW Dry-Pit Pump Building 15,000 -
451,000$ 274,000$ 1.76% 2.61%
815.05 Improvements Other Than Buildings - Other219/415 Welcome Signage 58,600$ 29,500$
410 SEMP Implementation 25,000 - 415 ADA Sidewalk Improvement Program 50,000 - 415 Annual Sidewalk Program 50,000 50,000 415 Annual Streetscape & Median Maintenance Program 25,000 25,000 415 Annual Contractual Tree Maintenance 30,000 30,000 415 Annual Tree Replacements 30,000 30,000 415 Design Engineering 20,000 20,000 415 East State Street Phase 2 Engineering 55,000 - 415 East State Street Phase 3 Engineering 125,000 675,000 415 East State Street ROW Acquisition 705,000 - 415 Kautz Road Averill to Division - ROW Acquisition 162,000 - 415 Kautz Road Averill to Division - Phase 2 Engineering 185,000 - 415 Kautz Road Averill to Division - Phase 3 Engineering 40,000 400,000 415 Kautz Road RT 38 to Fabyan - Phase 2 Engineering 40,000 415 Kautz Road RT 38 to Fabyan - Phase 3 Engineering 50,000 50,000 425 East State Street Phase 2 Engineering 816,000 - 426 East State Street Phase 2 Engineering 553,250 - 620 Community Betterment Projects 2,000 2,000 620 Miscellaneous Development 120,000 120,000 620 System Model Update and Hosting Study 40,000 - 620 Update SPCC Plan 2,000 - 630 Water Main Replacement Engineering - 80,000 630 WWTP Digester Engineering Services 25,000 - 630 Water Plant Reservoir Inside Inspection - 12,000 630 Water System Risk & Resilience Assessment 50,000 -
3,258,850$ 1,523,500$ 12.71% 14.49%
CITY OF GENEVA, ILLINOISFY 2022 & 23 Capital Improvement Program by Account
DRAFT
135

Fiscal Year Ending April 30, 2022 & 2023
Account Fund Description FY 2022 FY 2023
CITY OF GENEVA, ILLINOISFY 2022 & 23 Capital Improvement Program by Account
815.10 Improvements Other Than Buildings - Streets415 Annual Roadway Improvement Program 1,000,000$ 1,000,000$ 415 Annual Pavement Marking Program 45,000 45,000
1,045,000$ 1,045,000$ 4.07% 9.94%
815.15 Improvements Other Than Buildings - Storm Sewers415 Annual Storm Sewer Maintenance Program 150,000$ 150,000$ 415 Storm Sewer Infrastructure Improvements 100,000 100,000 415 Citywide Watershed Study 151,000 - 415 Storm Sewer Rehabilitation 150,000 150,000
551,000$ 400,000$ 2.15% 3.80%
815.20 Improvements Other Than Buildings - Culverts415 City-wide Culvert/Bridge Inventory Study & Maintenance 40,000$ -$ 415 State Street Bridge Railing Replacement Study 100,000 -
140,000$ -$ 0.55% 0.00%
815.25 Improvements Other Than Buildings - Electric System620 Underground/Overhead Cable Replacement 1,010,595$ 1,000,000$ 620 ERT Meter Replacements 250,000 60,000 620 Geneva Generation Facility (GGF) Equipment 100,000 100,000 620 GGF Pre-Chamber Check Valve Replacement 500,000 - 620 Line Supplies 270,000 270,000 620 SEMP Substation and Feeders 12,084,265 - 620 Substation Upgrades 100,000 800,000 620 Obsolete Voltage Conversion 100,000 100,000 620 State St. & Eastside Dr. Vault Cover 20,000 - 620 Fault Indicator Replacement 50,000 -
14,484,860$ 2,330,000$ 56.48% 22.16%
815.30 Improvements Other Than Buildings - Water System630 Lead Water Service Replacement 20,000$ 20,000$ 630 Fire Hydrant Painting - 30,000 630 Fire Hydrant Replacement 21,000 21,000 630 Mainline Water Valve Replacement 12,000 12,000 630 Well #13 Rehab 150,000 - 630 Well #6 Rehab 150,000 630 Water Main Infrastructure Replacement 600,000 - 630 Water Main Installation New 200,000 - 630 East State Street Water Main - 1,000,000 630 Water Meter Replacements 50,000 20,000 630 Water Meters for New Construction 15,000 15,000 630 Water Plant Pump Services - 5,000 630 Water System Leak Survey 30,000 30,000 630 Logan Water Tower Washing - 7,000 630 RO#3 & RO#4 VFD Installation 50,000 -
1,148,000$ 1,310,000$ 4.48% 5.11%
815.35 Improvements Other Than Buildings - Sewer System630 Sanitary Sewer Evaluation 315,500$ 150,000$ 630 Sanitary Sewer Rehabilitation - Geneva East 200,000 - 630 Sanitary Sewer Cleaning & Televising 75,000 75,000 630 East State Street Sanitary Sewer - 1,000,000
DRAFT
136

Fiscal Year Ending April 30, 2022 & 2023
Account Fund Description FY 2022 FY 2023
CITY OF GENEVA, ILLINOISFY 2022 & 23 Capital Improvement Program by Account
630 Water Plant Lift Station VFD's & SCADA Improvements - 60,000 630 WWTP Dewatering Feed Pump VFD SCADA Control 12,000 - 630 WWTP Dewatering Centrifuge VFD SCADA Control 12,000 - 630 Western Avenue Lift Station PLC Upgrade - 20,000
614,500$ 1,305,000$ 2.40% 12.41%
815.40 Improvements Other Than Buildings - Parking Lots420 Trail Head Parking Lot 400,000$ -$
400,000$ -$ 1.56% 0.00%
820 Machinery & Equipment251 Rainman Statue Engineering 20,000$ -$
430/620/630 Message/Arrow Board 21,000 - 430/620/630 Scissor Lift and Trailer 51,000
430 Gas Masks & Canisters 20,000 - 430 Replace Fire Boat #2 15,000 - 430 Replacement Fire Hose 5,000 5,000 430 Fire Personal Protective Equipment (PPE) 26,225 27,000 430 SCBA Equipment (Bottles/Packs/Masks) 12,000 11,000 430 Special Team Equipment (Hazmat, TRT, Water Rescue) 10,000 10,000 430 New Truck 201 Equipment 45,000 - 430 Replace Stump Grinder 35,000 - 430 Replacement Trailer 8,000 - 430 Replace New Holland Skidster 170,000 - 430 Replace John Deere Sidewalk Machine - 55,000 620 Small Equipment Replacement 15,000 15,000 620 Meter Test Set Replacement 40,000 - 620 Other Equipment - 85,000 630 Sewer Televising Equipment 70,000 - 630 WWTP Security Improvements - 30,000 630 WWTP Modular Shelter for Sampler - 8,000 630 Primary Clarifier Flight Replacement 200,000 - 630 WWTP Dewatering Feed Sludge Pump 10,000 - 630 WWTP Excess Flow Gate Actuator - 7,000 630 HVAC for Water Plant VFD Room 15,000 - 630 Waste Activated Sludge Pump 30,000 - 630 WWTP Conveyor Repair 30,000 - 630 RO#3 & RO#4 VFD Purchase 80,000 - 630 Water Plant Filter Effluent Control Valves 30,000 - 630 Water Plant Pipe Hanging Supports 10,000 - 630 Replacement of Reverse Osmosis Membranes - 185,000
968,225$ 438,000$ 3.78% 4.17%
825 Vehicles430 2021 Chevrolet Tahoe SUV Squad Car 58,185$ -$ 430 2021 Ford Explorer SUV Squad Car 49,375 - 430 2021 Ford Explorer SUV Squad Car 49,375 - 430 Fire Truck 201 Replacement 1,200,000 - 430 GEMA Car Conversions 5,000 - 430 Replace Single Axle Dump Truck with Plow 210,000 - 430 Replace Single Axle Dump Truck with Plow 210,000 - 430 Replace One Ton Dump Truck 105,000 - 430 Replace Single Axle Dump Truck with Plow - 210,000
DRAFT
137

Fiscal Year Ending April 30, 2022 & 2023
Account Fund Description FY 2022 FY 2023
CITY OF GENEVA, ILLINOISFY 2022 & 23 Capital Improvement Program by Account
430 Replace One Ton Truck - 105,000 430 Replace One Ton Dump Truck - 100,000 430 Replace One Ton Dump Truck - 95,000 430 Replace Bucket Truck - 200,000 430 Replace Dump Truck - 185,000 430 Other Vehicles - 650,000 620 1-Ton Dump Truck and Crane Replacement 75,000 160,000 630 WTP Van Replacement (2102) - 43,000 630 Vactor Truck Replacement (2069) 490,000 -
2,451,935$ 1,748,000$ 9.56% 16.63%
835 Computer Equipment240 Broadcasting & Chamber Improvements 5,000$ 5,000$ 240 Studio Electronics 20,000 20,000 430 Computer Equipment 66,795 40,815 620 iPads 2,000 - 620 Computer Replacement/Equipment 18,000 31,830 630 Computer Replacement - Water Fund 11,780 10,175 630 Itron Collector - 32,000 630 Large Format Scanner 7,500 -
131,075$ 139,820$ 0.51% 1.33%
Grand Total 25,644,445$ 10,513,320$
- -
DRAFT
138

CLASSIFICATION & COMPENSATION PLAN
The classification and compensation plan is the formal system for classifying and compensating all unrepresented positions in the City. This plan establishes a basic salary schedule as approved by the City Council annually. The salary ranges shall include minimum and maximum rates of pay for all non-union positions.
For FY 2022, non-union employees who “meet” or “exceed” performance standards are eligible for a market adjustment of 0.5%. Those employees who “meet” or “exceed” the standards of their respective position will also be eligible for a merit increase of up to 2.25% depending on their performance appraisal and current placement within the approved salary schedule. Employees whose pay rate is at or above the maximum of the salary range for any given position are only eligible to receive a one-time lump sum payment of up to 1.0% depending on their performance appraisal. Employees who “fail to meet” standards on their performance evaluation are ineligible for market and/or merit adjustments.
The classification and compensation plan below should be considered a guideline that is subject to funding through the annual budget process. Questions regarding the plan may be directed to the Human Resources Division.
GRADE PROFESSIONAL – TECHNICAL – MANAGEMENT Minimum Midpoint Maximum
43 City Administrator $136,756 $65.7480
$167,526 $80.5413
$198,296 $95.3346
42 Chief of Police Fire Chief Director of Public Works
$128,700 $61.8752
$157,658 $75.7971
$186,616 $89.7190
41
Asst. City Administrator / DOAS Director of Community Development Director of Economic Development Finance Director
$121,422 $58.3758
$148,741 $71.5102
$176,061 $84.6448
39 Superintendent of Electrical Svcs Deputy Fire Chief Police Commander
$107,466 $51.6666
$131,646 $63.2915
$155,826 $74.9164
38 City Engineer/Assistant Director of Public Works
$101,393 $48.7465
$124,206 $59.7144
$147,019 $70.6824
37
Manager of Electric Operations Fire Marshal Manager of Distribution, Construction, & Maintenance Superintendent of Streets & Fleets Superintendent Water/Wastewater Building Commissioner
$95,298 $45.8165
$116,741 $56.1253
$138,183 $66.4341
36 Information Technologies Manager $89,225 $42.8964
$109,300 $52.5481
$129,376 $62.1998
DRAFT
139
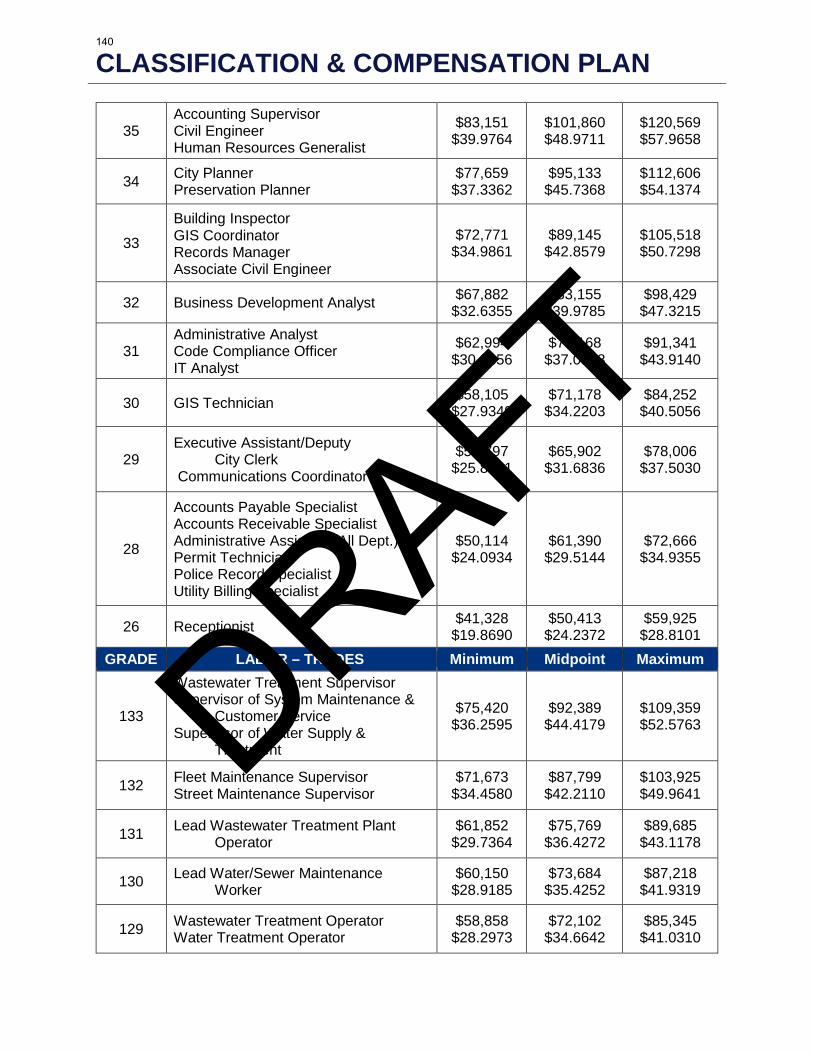
CLASSIFICATION & COMPENSATION PLAN
35 Accounting Supervisor Civil Engineer Human Resources Generalist
$83,151 $39.9764
$101,860 $48.9711
$120,569 $57.9658
34 City Planner Preservation Planner
$77,659 $37.3362
$95,133 $45.7368
$112,606 $54.1374
33 Building Inspector GIS Coordinator Records Manager Associate Civil Engineer
$72,771 $34.9861
$89,145 $42.8579
$105,518 $50.7298
32 Business Development Analyst $67,882 $32.6355
$83,155 $39.9785
$98,429 $47.3215
31 Administrative Analyst Code Compliance Officer IT Analyst
$62,994 $30.2856
$77,168 $37.0998
$91,341 $43.9140
30 GIS Technician $58,105 $27.9349
$71,178 $34.2203
$84,252 $40.5056
29 Executive Assistant/Deputy City Clerk Communications Coordinator
$53,797 $25.8641
$65,902 $31.6836
$78,006 $37.5030
28
Accounts Payable Specialist Accounts Receivable Specialist Administrative Assistant (All Dept.) Permit Technician Police Record Specialist Utility Billing Specialist
$50,114 $24.0934
$61,390 $29.5144
$72,666 $34.9355
26 Receptionist $41,328 $19.8690
$50,413 $24.2372
$59,925 $28.8101
GRADE LABOR – TRADES Minimum Midpoint Maximum
133
Wastewater Treatment Supervisor Supervisor of System Maintenance & Customer Service Supervisor of Water Supply & Treatment
$75,420 $36.2595
$92,389 $44.4179
$109,359 $52.5763
132 Fleet Maintenance Supervisor Street Maintenance Supervisor
$71,673 $34.4580
$87,799 $42.2110
$103,925 $49.9641
131 Lead Wastewater Treatment Plant Operator
$61,852 $29.7364
$75,769 $36.4272
$89,685 $43.1178
130 Lead Water/Sewer Maintenance Worker
$60,150 $28.9185
$73,684 $35.4252
$87,218 $41.9319
129 Wastewater Treatment Operator Water Treatment Operator
$58,858 $28.2973
$72,102 $34.6642
$85,345 $41.0310
DRAFT
140

CLASSIFICATION & COMPENSATION PLAN
128 Water Sewer Maintenance Worker Utility Locator
$52,936 $25.4500
$64,846 $31.1762
$76,757 $36.9025
GRADE PUBLIC SAFETY – POLICE Minimum Midpoint Maximum
236 Police Sergeant $105,454 $50.6994
$111,782 $53.7412
$118,109 $56.7832
226 Community Service Officer $44,881 $21.5776
$54,980 $26.4326
$65,078 $31.2876
GRADE PUBLIC SAFETY – FIRE Minimum Midpoint Maximum
250 Fire Battalion Chief (2920 annual hours) $94,359 $32.3147
$115,590 $39.5856
$136,820 $46.8564
DRAFT
141

CITY ADMINISTRATOR’S OFFICE
DEPARTMENT DESCRIPTION The City Administrator’s Office is responsible for the management and administration of all City operations, directing all internal services, programs, and operations and all external laws, ordinances and public policies as they relate to the City.
MISSION STATEMENT The City Administrator’s Office oversees the management and provision of high level quality services in a cost-effective and efficient manner for internal and external customers through all City Departments.
FY 2022 GOALS
Goal # 1 In conjunction with the Assistant City Administrator, work with Departments to update,
revise, and post regular updates on budgetary and strategic plan performance indicators to City website.
Funding: General Operating, Staff time Completion Date: 06/01/2021 Strategic Plan: SG-1, EMS-IV Goal # 2 Review the Facilities Assessment Study and with input from various departments
formulate recommendations for implementation including funding sources and timelines.
Funding: General Operating, Staff time Completion Date: 12/01/2021 Strategic Plan: EMS-II Goal # 3 Negotiate and effectuate renewal franchise agreement with Nicor Gas.
Funding: General Operating, Staff time Completion Date: 12/01/2021 Strategic Plan: N/A Goal # 4 Initiate best practices for records retention to include migration to electronic retention. Funding: General Operating, Staff time Completion Date: 04/30/2022 Strategic Plan: N/A Goal # 5 Provide resources and training for FOIA officers on an annual basis to include changes
and updates to the law and/or interpretation. Funding: General Operating, Staff time Completion Date: 04/30/2022 Strategic Plan: SG-I
DRAFT
142

ADMINISTRATIVE SERVICES
DEPARTMENT DESCRIPTION
The Administrative Services Department is comprised of three divisions:
• Administration – Handles a wide range of administrative functions including interactions with citizens, the City Council, and management.
• Information Technologies – Responsible for the maintenance and procurement of all telephone and data networks, computers, servers, email and voicemail systems for all City employees.
• Human Resources – Responsible for overseeing Human Resources related business functions and operations including recruitment, job analysis, data tracking, benefit administration, compensation and classification, reporting, employee relations, and payroll.
MISSION STATEMENT
The Administrative Services Department shall provide quality services and programs to internal and external customers in the most effective and efficient manner possible.
FY 2022 GOALS
Goal # 1 Administer the bi-annual community survey and present benchmarked results to City Council & Strategic Plan Advisory Committee.
Funding: General Operating, staff time Completion Date: 10/31/2021 Strategic Plan: SG-1
Goal # 2 In conjunction with the City Administrator, work with Departments to update, revise, and post regular updates on budgetary and strategic plan performance indicators to City website.
Funding: General Operating, staff time Completion Date: 06/01/2021 Strategic Plan: SG-1, EMS-IV
DRAFT
143

ADMINISTRATIVE SERVICES
Goal # 3 Complete a comprehensive review and provide recommendations to the City Council for updates to the City’s Personnel Policy Manual.
Funding: General Operating, staff time Completion Date: 06/30/2021 Strategic Plan: N/A Goal # 4 Review and update the City’s Human Resources webpage and update jobs portal to
better promote City of Geneva career opportunities, including development of a new employee welcome video.
Funding: General Operating, staff time Completion Date: 03/30/2022 Strategic Plan: QL-III, EMS-IV Goal # 5 Evaluate departmental safety policies and develop recommendations to reduce
accidents and improve safety practices throughout the City including revision of reporting forms to better differentiate and track general liability and workers compensation injury reporting.
Funding: General Operating, Staff time Completion Date: 02/28/2022 Strategic Plan: EMS-III
Goal # 6: Evaluate and implement updates to the City’s intranet site to streamline and digitalize processes to improve efficiency and better serve employees.
Funding: General Operating, Staff Time Completion Date: 04/30/2022 Strategic Plan: EMS-III
Goal # 7: Develop policy guidance regarding procedures and best practices for employees and city officials participating in virtual meetings.
Funding: General Operating, Staff Time Completion Date: 06/01/2021 Strategic Plan: EMS-III
DRAFT
144

FINANCE
PROGRAM DESCRIPTION
The Finance Department is responsible for the administration of all fiscal operations of the City. These activities include accounting and financial reporting, budget development, treasury management, debt management, utility billing, accounts payable and accounts receivable.
MISSION STATEMENT
Develop and implement effective and efficient financial planning, reporting, and accounting systems that help the operating departments achieve their objectives. Provide excellent customer service and protecting the City's resources from unauthorized use.
FY 2022 GOALS
Goal # 1 Work with the Fire Department to review and update the intergovernmental agreement with Geneva Township Special Fire District.
Funding: General Operating, Staff time Completion Date: 04/30/2022 Strategic Plan: EMS-II Goal # 2 Assist with a comprehensive review and implementation of recommended updates to
Title 9 (Municipal Utilities) of the Geneva City Code.
Funding: General, Electric and Water/Wastewater Operating, Staff time Completion Date: 10/31/2021 Strategic Plan: SG-I Goal # 3 Work with City Administrator and Economic Development Departments to further the
extension of SSA #1 and determine the parameters of a Tourism Grant Program. Funding: General and SSA 1 Operating, Staff time Completion Date: 04/30/2022 Strategic Plan: EV-II
Goal # 4 Identity all contacts that qualify for new accounting treatment due to the release of GASB 84. Funding: General Operating, Staff time Completion Date: 04/30/2022 Strategic Plan: EV-II
DRAFT
145

COMMUNITY DEVELOPMENT
DEPARTMENT DESCRIPTION
The Community Development Department is comprised of two divisions:
• Building - Responsible for issuing building permits for new construction projects, as well as certain required remodeling and maintenance projects. The division reviews the applications, construction plans, and plats of survey to ensure compliance with local, state, and national standards as recognized by the adopted codes. City Staff also inspects the construction work and provides technical assistance to residents and contractors.
• Planning - Serves residents, business owners, and developers within the City by managing land-use entitlements for proposed residential and commercial projects, including projects requiring review by the Plan Commission and /or Historic Preservation Commission. The Historic Preservation Commission reviews any projects, including building permit applications involving exterior alterations to buildings located within the Historic District.
MISSION STATEMENT
The Community Development Department develops, maintains, and implements plans, policies, codes, and ordinances that provide for orderly development; promote the public health, safety, and general welfare of citizens in the City; protect property values; and preserve the City’s unique historic character.
FY 2022 GOALS
Goal # 1 Revise parking standards to promote cycling, walking, and alternative transit.
Funding: General Operating, Staff time Completion Date: 01/31/2022 Strategic Plan: QL-I
DRAFT
146

COMMUNITY DEVELOPMENT
Goal # 2 Create and maintain a report summarizing the housing characteristics (type, size, affordable) of approved residential developments.
Funding: General Operating, Staff time Completion: 07/31/2021 Strategic Plan: EV-I; EMS-IV
Goal # 3 Evaluate the Community Development Module in New World for all of the
Department’s core functions and work to integrate Project Planning, Permits, and Parcel Management.
Funding: General Operating, Staff time Completion Date: 07/31/2021
Strategic Plan: N/A
Goal # 4 Review the 2008 Historic Preservation Plan and report to the Historic Preservation Commission and City Council on the status of goals and recommended action items.
Funding: General operating, Staff time Completion Date: 10/31/2021
Strategic Plan: N/A
Goal # 5 Review and update the 2010 Design Guidelines for Historic Properties. Funding: General Operating, Staff time Completion Date: 04/30/2022
Strategic Plan: N/A
Goal # 6 Reformatting of Zoning Districts outside of the Downtown area to mirror the user-friendly format of the new Downtown zoning districts.
Funding: General Operating, Staff time Completion Date: 04/30/2022
Strategic Plan: N/A
Goal # 7 Investigate opportunities to streamline the process of issuing building permits and completing inspections by eliminating paper and moving to an online platform where possible.
Funding: General Operating, Staff time Completion Date: 10/31/2021
Strategic Plan: N/A
DRAFT
147

ECONOMIC DEVELOPMENT
DEPARTMENT DESCRIPTION
The Economic Development Department is responsible for developing and implementing strategies and programs to retain, expand and attract appropriate commercial, office/research and light industrial developments within the City.
MISSION STATEMENT
The City of Geneva’s Economic Development Department shall serve the community by attracting appropriate commercial, office/research and light industrial developments to the City as a means to reduce reliance on residential property taxes. The Department creates and fosters successful programs to retain and bolster existing business and promote Geneva as a destination.
FY 2022 GOALS
Goal # 1 Continue work with owners/developers to implement the vision and development goals described in the Southeast Subarea Plan.
Funding: General Operating, Staff time; General Capital Projects, $20,000 (possibly
reimbursable to future TIF fund); General Obligation/TIF bonds Completion Date: 04/30/2022
Strategic Plan: EV-II Goal # 2 Formulate a plan to finalize and close TIF 2 including details about final projects, fiscal
and statutory obligations and timelines. Funding: General Operating, TIF 2, Staff time Completion Date: 04/30/2022 Strategic Plan: EV-II Goal # 3 Collaborate with Public Works, Fire and Community Development to develop
programs and policies to facilitate repurposing properties in commercial corridors to meet changing needs of retail and commercial stakeholders.
Funding: General Operating, Staff time
Completion Date: 08/31/2021 Strategic Plan: EV-III
Goal # 4 Review the Economic Development Policy adopted in November 2014 to recommend any needed updates in light of present strategic plan goals, economic conditions and legal advice.
Funding: General Operating, Staff time Completion Date: 04/30/2022 Strategic Plan: EV-II
DRAFT
148

ECONOMIC DEVELOPMENT
Goal # 5 Work with City Administrator and Finance Department to further the extension of SSA #1 and determine the parameters of a Tourism Grant Program. Funding: General and SSA 1 Operating, Staff time Completion Date: 04/30/2022 Strategic Plan: EV-II
Goal # 6 Catalog existing parking leases to facilitate a recommendation for future public parking policy. Funding: General Operating, Staff time Completion Date: 07/31/2021 Strategic Plan: EV-II
DRAFT
149

POLICE
PROGRAM DESCRIPTION
The Police Department provides for the protection of life and property, enforcement of criminal and traffic laws, prevention of crime, preservation of public peace and apprehension of violators of the law through patrol and response to calls for service. Additionally, the Department is responsible for enforcing parking regulations, providing information and assistance to the general public, handling special events as requested and evidence collection and submission.
MISSION STATEMENT
With steadfast dedication, each member of the Geneva Police Department takes great pride in providing the City of Geneva with QUALITY service, protection and enforcement, while maintaining the utmost level of professionalism and integrity.
FY 2022 GOALS
Goal # 1 In addition to utilizing on call social workers to assist the city, implement and evaluate the use of an in house social worker one day per week.
Funding: General Operating, Staff time Completion Date: 04/01/2022
Strategic Plan: EMS-II Goal # 2 Evaluate cost, viability, and policies relating to body worn cameras in preparation for
the possibility of their use being mandated in the future. Funding: General Operating, Staff time Completion Date: 12/31/2021
Strategic Plan: EMS-II
Goal # 3 Complete an assessment of the parking signage throughout the community to assure that the signage corresponds to the Geneva City Code.
Funding: General Operating, Staff time Completion Date: 04/30/2022
Strategic Plan: EMS-II
Goal # 4 Implement and evaluate a two year peer support program to provide support for our staff members while assuring they are able to provide excellent service to our community.
Funding: General Operating, Staff time Completion Date: 12/31/2021
Strategic Plan: EMS-II
DRAFT
150

FIRE
PROGRAM DESCRIPTION
The Geneva Fire Department provides fire suppression, advanced life support emergency medical response, basic and advanced rescue, hazardous materials mitigation, fire inspection, plans review, public education, fire investigation and emergency preparedness planning and response services to the citizens, employers and visitors of Geneva.
MISSION STATEMENT
We will be a leader among our peers and to the community through compassion, selflessness and the stewardship of the public’s trust. We will do this through education, prevention, mitigation of fire & non-fire risk, collaborative relationships with external partners and providing diverse emergency services.
FY 2022 GOALS
Goal # 1 Complete the CFAI 2021 accreditation cycle: update the Fire and Emergency Service
Self-Assessment Manual (FESSAM) to the 9th Edition, update the 2015 Strategic Plan and update the 2015 Standard of Cover/Community Risk Assessment, undergo a successful Site Visit and successfully appear before the Commission for approval. Funding: General Operating, Staff time Completion Date: 12/31/2021 CFAI Accreditation Criterion: 2D.1, 2D.7 Strategic Plan: EMS-II, EMS-IV
Goal # 2 Update the City of Geneva Domestic Preparedness Planning and Response Plan and
engage all Departments in Citywide emergency preparedness drills. Funding: Staff time Completion Date: 04/30/2022 CFAI Accreditation Criterion: 5D Strategic Plan: EMS-III
Goal # 3 Implement a web-based commercial inspection compliance service to provide
effective management of code inspections, testing, and maintenance of fire protection systems using third party inspection companies.
Funding: 3rd Party Service Vendors, Staff time Completion Date: 12/31/2021
Accreditation Objective: 5A.2, 5A.6 Strategic Plan: EMS-4
DRAFT
151

FIRE
Goal # 4 Research, investigate and if justified, implement an updated training deployment and tracking application.
Funding: General Operating, staff time Completion Date: 10/31/2021 CFAI Accreditation Criterion: 8B, 8C Strategic Plan: EMS-IV
Goal # 5 Review and update the intergovernmental agreement with Geneva Township Special
Fire District with assistance from the Finance Department.
Funding: General Operating, staff time Completion Date: 04/30/2022 CFAI Accreditation Criterion: 10A Strategic Plan: EMS-II
DRAFT
152

PUBLIC WORKS - ENGINEERING
DIVISION DESCRIPTION
The Engineering Division of the Public Works Department administers and supervises all engineering related improvements and activities within the City. This division manages the design, bidding and construction of Public Works projects and reviews plans submitted by developers to ensure the plans comply with City Ordinances and display good engineering judgment. Additionally, the division works with residents to solve an array of engineering and public works issues. The GIS division maintains and oversees the City's land-based GIS and provides information systems support and back up and is responsible for improving workflow of City employees by making data accessible via paper and electronic maps and digital files, as needed for analysis and mapping purposes.
MISSION STATEMENT
To provide the City of Geneva professional engineering design consultation, engineering plan review, project management and construction inspection services of the highest quality and reliability to maintain and expand City infrastructure to support the existing community and remaining build out.
FY 2022 GOALS
Goal # 1 Finalize Design and initiate construction for the East State Street Corridor including finalization of land acquisition with IDOT, Phase II design, project specifications, and coordination of bidding operations with IDOT to target a 2023 road construction start date.
Funding: General Operating, staff time Completion Date: ~11/30/2025 Strategic Plan: EMS-II, EV-III, ES-II, ES-III, QL-I
Goal # 2 Continue the planning for infrastructure necessary for the development of the Southeast Industrial Park.
Funding: General Operating, Staff time Completion Date: 07/01/2021 Strategic Plan: EV-II, EMS-II
DRAFT
153

PUBLIC WORKS - ENGINEERING
Goal # 3 Finalize Citywide Watershed Study. Prioritize needed improvements and develop project budgets. Develop a Capital Improvement Plan that reflects these projects and schedule construction as future budgets resources allow.
Funding: General Operating, Staff time Completion Date: 4/30/2022 Strategic Plan: EMS-II, EMS-III, ES-IV
Goal # 4 Assist all City Departments with reviewing and updating the applicable Titles of the
City Code with current engineering practices and standards.
Funding: General Operating, Staff time Completion Date: 11/30/2021 Strategic Plan: EV-III
Goal # 5 Develop and provide in-house training sessions to City staff to promote the use of the
City’s GIS database system. Funding: General Operating, staff time Completion Date: 04/30/2022 Strategic Plan: EMS-II
Goal # 6 In conjunction with Administrative Services and the Public Works Safety Committee,
update the Public Works Department Safety Manual.
Funding: Staff time Completion Date: 04/30/2022 Strategic Plan: EMS-III
DRAFT
154

PUBLIC WORKS – STREETS & FLEET
DIVISION DESCRIPTION
The Streets and Fleet Maintenance Division of Public Works is responsible for street and sidewalk maintenance and repair, snow and ice control, tree trimming, planting and removal, leaf and brush collections, alley maintenance, public and commuter parking lot maintenance, landscape maintenance, street sweeping, sign maintenance, community festival support, central business district streetscape maintenance operations, cemetery maintenance and operations, fleet maintenance/repair operations and the City’s fuel management system.
MISSION STATEMENT
The Streets and Fleet Maintenance Division is dedicated to providing all associated programs, projects and services in a timely, modernized manner with the highest level of quality to our customers, externally and internally at the most economical cost possible.
FY 2022 GOALS
Goal # 1 Finalize Citywide Watershed Study. Prioritize needed improvements and develop project budgets. Develop a Capital Improvement Plan that reflects these projects and schedule construction as future budgets resources allow.
Funding: General Operating, Staff time Completion Date: 04/30/2022 Strategic Plan: EMS-II, EMS-III, ES-IV
Goal # 2 Expand the anti-icing program to include additional storage for additives to use for
enhanced performance at lower temperatures.
Funding: General Operating, Staff time Completion Date: 03/01/2022 Strategic Plan: ES-III
Goal # 3 Update the Public Works Department Safety Manual in conjunction with the Public
Works Safety Committee and Administrative Services Department.
Funding: General Operating, Staff time Completion Date: 04/30/2022 Strategic Plan: EMS-III
DRAFT
155

PUBLIC WORKS – STREETS & FLEET
Goal # 4 Review and make recommendations to the Tree Preservation Ordinance in conjunction with the Community Development Department and Natural Resources Committee.
Funding: General Operating, Staff time Completion Date: 07/31/2021 Strategic Plan: ES-I
Goal # 5 Develop bid specifications and project estimates to replace the Polyurethane traffic
topping areas throughout the parking garage to protect and extend the longevity of the structure by covering exposed steel and expansion joints in preparation for a capital expenditure in FY 2023.
Funding: General Operating, Staff time Completion Date: 11/30/2021 Strategic Plan: EMS-II
DRAFT
156
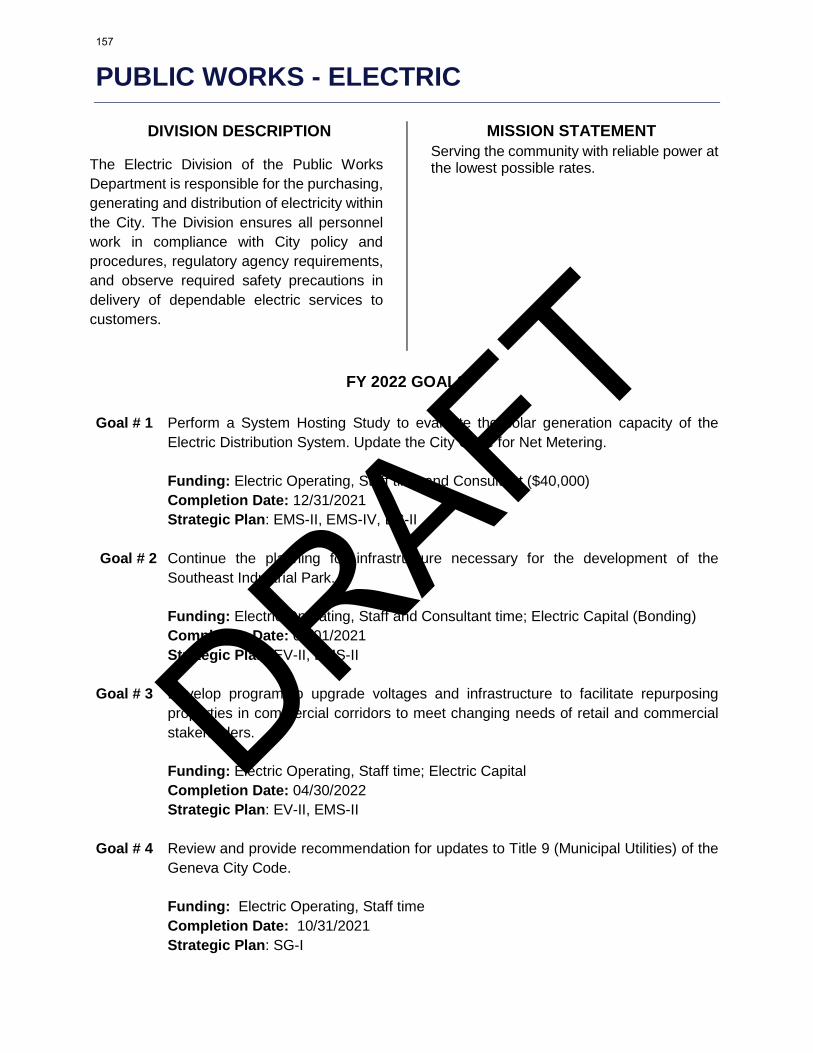
PUBLIC WORKS - ELECTRIC
DIVISION DESCRIPTION
The Electric Division of the Public Works Department is responsible for the purchasing, generating and distribution of electricity within the City. The Division ensures all personnel work in compliance with City policy and procedures, regulatory agency requirements, and observe required safety precautions in delivery of dependable electric services to customers.
MISSION STATEMENT Serving the community with reliable power at the lowest possible rates.
FY 2022 GOALS
Goal # 1 Perform a System Hosting Study to evaluate the solar generation capacity of the
Electric Distribution System. Update the City Code for Net Metering.
Funding: Electric Operating, Staff time and Consultant ($40,000) Completion Date: 12/31/2021 Strategic Plan: EMS-II, EMS-IV, ES-II
Goal # 2 Continue the planning for infrastructure necessary for the development of the Southeast Industrial Park.
Funding: Electric Operating, Staff and Consultant time; Electric Capital (Bonding) Completion Date: 07/01/2021 Strategic Plan: EV-II, EMS-II
Goal # 3 Develop program to upgrade voltages and infrastructure to facilitate repurposing properties in commercial corridors to meet changing needs of retail and commercial stakeholders.
Funding: Electric Operating, Staff time; Electric Capital Completion Date: 04/30/2022 Strategic Plan: EV-II, EMS-II
Goal # 4 Review and provide recommendation for updates to Title 9 (Municipal Utilities) of the Geneva City Code.
Funding: Electric Operating, Staff time Completion Date: 10/31/2021
Strategic Plan: SG-I
DRAFT
157

PUBLIC WORKS - ELECTRIC
Goal # 5 Update Billing Software to handle net metering for residential customers.
Funding: Electric Operating, Staff time Completion Date: 04/30/2022 Strategic Plan: EMS-II, ES-II
Goal # 6 Update the Public Works Department Safety Manual with the assistance of the Public Works Safety Committee and Administrative Services Department.
Funding: Electric Operating, Staff time Completion Date: 04/30/2022 Strategic Plan: EMS-III
DRAFT
158

PUBLIC WORKS – WATER/WASTEWATER
DIVISION DESCRIPTION
The Water/Wastewater Division of the Public Works Department is responsible for all activities regarding water and wastewater including the water supply, water treatment, wastewater collection, treatment and disposal and storm water collection.
MISSION STATEMENT
The Water and Wastewater Division shall provide high-quality, reliable water supply and wastewater treatment-related services which are protective of customer health and safety, 100% compliant with State and Federal Standards, and at the most economical price obtainable.
FY 2022 GOALS
Goal # 1 Advocate for legislation for the replacement of lead service lines on private and public property; educate customers with lead service lines on the health risks when service line is disrupted; and continue to update the service line material inventory on an annual basis to submit to the Illinois Environmental Protection Agency. Funding: Water/Wastewater Operating, Staff time Completion Date: 04/30/2022 Strategic Plan: EMS-II
Goal # 2 Finalize Citywide Watershed Study. Prioritize needed improvements and develop
project budgets. Develop a Capital Improvement Plan that reflects these projects and schedule construction as future budgets resources allow.
Funding: Water/Wastewater Operating, Staff time Completion Date: 04/30/2022 Strategic Plan: EMS-II, EMS-III, ES-IV
Goal # 3 Continue the planning for infrastructure necessary for the development of the
Southeast Industrial Park.
Funding: Water/Wastewater Operating, Staff time Completion Date: 7/01/2021 Strategic Plan: EV-II, EMS-II
Goal # 4 Develop programs and policies to facilitate repurposing properties in commercial
corridors to meet changing needs of retail and commercial stakeholders.
Funding: Water/Wastewater Operating, Staff time Completion Date: 4/30/2022 Strategic Plan: EV-II,
DRAFT
159

PUBLIC WORKS – WATER/WASTEWATER
Goal # 5 Complete year three of the sanitary sewer evaluation contract with Deuchler Engineering. Develop list of improvements identified in year two of the study to reduce inflow and infiltration, improve capacity and reduce bypass events. Complete improvements as budget recourses allow.
Funding: Water/Wastewater Operating, Staff time Completion Date: 04/30/2022 Strategic Plan: ES-III
Goal # 6 Update the Public Works Department Safety Manual with assistance from the Public
Works Safety Committee and Administrative Services Department. Funding: Water/Wastewater Operating, Staff time Completion Date: 04/30/2022 Strategic Plan: EMS-III
Goal # 7 Review and provide recommendations for updates to Title 9 (Municipal Utilities) of the Geneva City Code. Funding: Water/Wastewater Operating, Staff time Completion Date: 4/30/2022 Strategic Plan: SG-I
DRAFT
160