spe 77758 a petrophysics and reservoir performance-based ...avila)_womack_hill_field_study.pdf ·...
TRANSCRIPT

Copyright 2002, Society of Petroleum Engineers Inc.
This paper was prepared for presentation at the SPE Annual Technical Conference andExhibition held in San Antonio, Texas, 29 September–2 October 2002.
This paper was selected for presentation by an SPE Program Committee following review ofinformation contained in an abstract submitted by the author(s). Contents of the paper, aspresented, have not been reviewed by the Society of Petroleum Engineers and are subject tocorrection by the author(s). The material, as presented, does not necessarily reflect anyposition of the Society of Petroleum Engineers, its officers, or members. Papers presented atSPE meetings are subject to publication review by Editorial Committees of the Society ofPetroleum Engineers. Electronic reproduction, distribution, or storage of any part of this paperfor commercial purposes without the written consent of the Society of Petroleum Engineers isprohibited. Permission to reproduce in print is restricted to an abstract of not more than 300words; illustrations may not be copied. The abstract must contain conspicuousacknowledgment of where and by whom the paper was presented. Write Librarian, SPE, P.O.Box 833836, Richardson, TX 75083-3836, U.S.A., fax 01-972-952-9435.
AbstractThe primary objective of this work is to perform a completecharacterization of the Womack Hill (oil) Field in SouthernAlabama using petrophysical and reservoir performance data— and to provide reservoir management strategies that lead toimproved oil recovery activities at Womack Hill Field. Theprocess for achieving this goal requires the following specificobjectives:
To develop correlations between the core and welllog data in order to generate spatial distributions ofreservoir properties such as: porosity, permeability,net pay, etc.
To analyze the production history on a per well basisusing the decline type curve technique to provideestimates of:
—Oil-in-place (N),—Effective permeability (k),—Flow capacity (kh),—Reservoir drainage area (A), and—Near-well skin factor (s).
To determine the Estimated Ultimate Recovery (orEUR) for each well using the production data. TheEUR is used to establish the volume of recoverableoil-in-place.
To draw conclusions and provide recommendationsregarding infill drilling, well completions, and pro-duction practices based on the results of integratingthe geological data and the production history analy-sis.
IntroductionWomack Hill Field is located on the border of Choctaw andClarke counties, Alabama (Fig. 1). Hydrocarbon production isfound in the Jurassic sequence consisting of the Smackoverand Norphlet formations. Bottomhole pressure analysis hasconfirmed the pressure separation of the Lower Smackover-Norphlet reservoir from the Upper Smackover reservoir(Daigre, et al1 (1986)). Womack Hill Field produces from theUpper Smackover carbonate reservoir at depths ranging from11,090 feet (subsea) at the crest of the structure to 11,360 feet(subsea) at the water-oil contact. The oil trap on top of thereservoir is provided by the anhydrite in the overlyingBuckner member of the Haynesville formation. A very largenormal fault to the south of the field provides a lateral seal(Qi, et al2 (1998)). Pruet and Hughes Company discoveredWomack Hill Field, in November 1970 (Carlisle Unit 16-4Well No.1). This well was completed in the Upper Smack-over carbonates and initially flowed 600 STB/D throughperforations at 11,422 to 11,432 feet (measured depth)..
The original oil in place (OOIP or N) at Womack Hill Field isestimated to be 87.1 MMSTB (Core Labs3 (1974)) and thecumulative production has reached over 30 MMSTB, so weestimate the oil recovery to be on the order of 35 percent. Webelieve that because the recovery is apparently high, additionaldevelopment opportunities are probably limited to isolatedcompartments or areas of severe pressure depletion.
The objective of this work is to develop an integrated reservoirdescription for this field in order to establish reservoirmanagement strategies and to provide a basis for reservoirsimulation. To develop such a study we must analyze all ofthe available data. The core and well log data are used togenerate distributions of reservoir properties across the fieldand the production history is analyzed using both simplifiedanalysis of rate (i.e., EUR plots), as well as the decline typecurve technique to obtain estimates of oil-in-place and reser-voir properties. The results of the analysis of the petro-physical and production data will be combined and interpretedsimultaneously in order to draw conclusions and recommenda-tions with regard to the continued operations and develop-ments at Womack Hill Field.
SPE 77758
A Petrophysics and Reservoir Performance-Based Reservoir Characterization of theWomack Hill (Smackover) Field (Alabama)J.C. Avila, PDVSA, R.A. Archer, U. Auckland, E.A. Mancini, U. Alabama, and T.A. Blasingame, Texas A&M U.

2 J.C. Avila, R.A. Archer, E.A. Mancini, and T.A. Blasingame SPE 77758
Current StatusWomack Hill is a mature oil field that has been producing formore than 30 years. Production reached its peak in 1977 asresult of an infill drilling campaign. Since then, oil and gasrates have steadily declined, as shown on Fig. 2. Currently,only 12 production and 3 injection wells are active (Mancini,et al4 (2001)) producing 640 STB/D of oil, 330 MSCF/D ofgas, and 6,700 STB/D of water (Fig. 3). The water cut is over90 percent and the amount of injection water required in theWestern part of the field increases continuously, whichultimately reduces the profitability of the field. As the esti-mated oil recovery is 35 percent, an additional recovery of 5 to10 percent appears quite possible through a detailed reservoirdescription and a better understanding of the reservoir perfor-mance.
The main issues that exist with regard to Womack Hill Fieldare:
1. The high degree of heterogeneity that typically exists incarbonate reservoirs. This requires a substantialamount of data to develop a representative reservoirmodel. The volume of core data is limited, so it issomewhat more difficult to establish relationshipsbetween well log measurements and the results of pro-duction data analysis.
2. There is an incomplete record of the water productiondue to reporting practices in Alabama. Fig. 2 showsthat the water production record began in 1981. As wedo not have a complete record of the water productionrecord, we must limit our analysis and interpretation ofthe WOR (water-oil ratio) and fw (fractional flow ofwater) behavior to essentially a qualitative analysis.
3. The lack of wellbore pressure data in general, as well asthe limited amount of pressure data taken as "shut-in"pressures (surrogates for "local" average reservoirpressures). The lack of wellbore pressure data is fur-ther amplified because production was prorated at earlytimes (the first few years).
The lack of wellbore pressure data and prorated earlyproduction data significantly inhibit our application ofthe decline type curve analysis technique. We can inferan indication of "better" reservoir properties in certainareas of the field, but this is an essentially qualitativeassessment (comparison of one profile to another).
Lastly, the lack of pressure data may also limit theapplication of reservoir simulation, as these data arerequired to calibrate the reservoir model.
Analysis/Interpretation/Integration ProcedureThe following tasks are employed as the mechanisms toanalyze, interpret, and integrate the petrophysical and engi-neering data from Womack Hill Field.
1. Collect/catalog the well log, core, and production data.
2. Convert data into an appropriate electronic format.
3. Develop correlations between core and well log data to
predict reservoir permeability using well log responses.
4. Analyze and interpret the reservoir performance datausing decline type curve analysis and EUR analysis.
5. Integrate the geological data and the results of reservoirperformance analysis by generating maps of distribu-tions of reservoir properties throughout the field.
6. Establish recommendations to optimize the reservoirmanagement strategies, such as: infill drilling, produ-cer/injector conversions, reservoir testing procedures,etc.
Our work to date has focused on points 1-5 — although point6 has received attention, it has proven extremely difficult topropose/perform testing or other operational activities due tothe present economic and technical conditions at Womack HillField.
Correlation of Petrophysical DataAt Womack Hill Field the following well log responses aretypically available:
(SP) Spontaneous potential(ILM) Shallow resistivity(LLS) Deep resistivity(GR) Gamma ray(ROHB) Bulk density(DPHI) Density derived porosity(NPHI) Neutron derived porosity
In addition, substantial volumes of whole and sidewall coredata are available — admittedly, all of these data are quite old(1970's vintage) and we have encountered significant diffi-culties in trying to correlate the core and well log data.
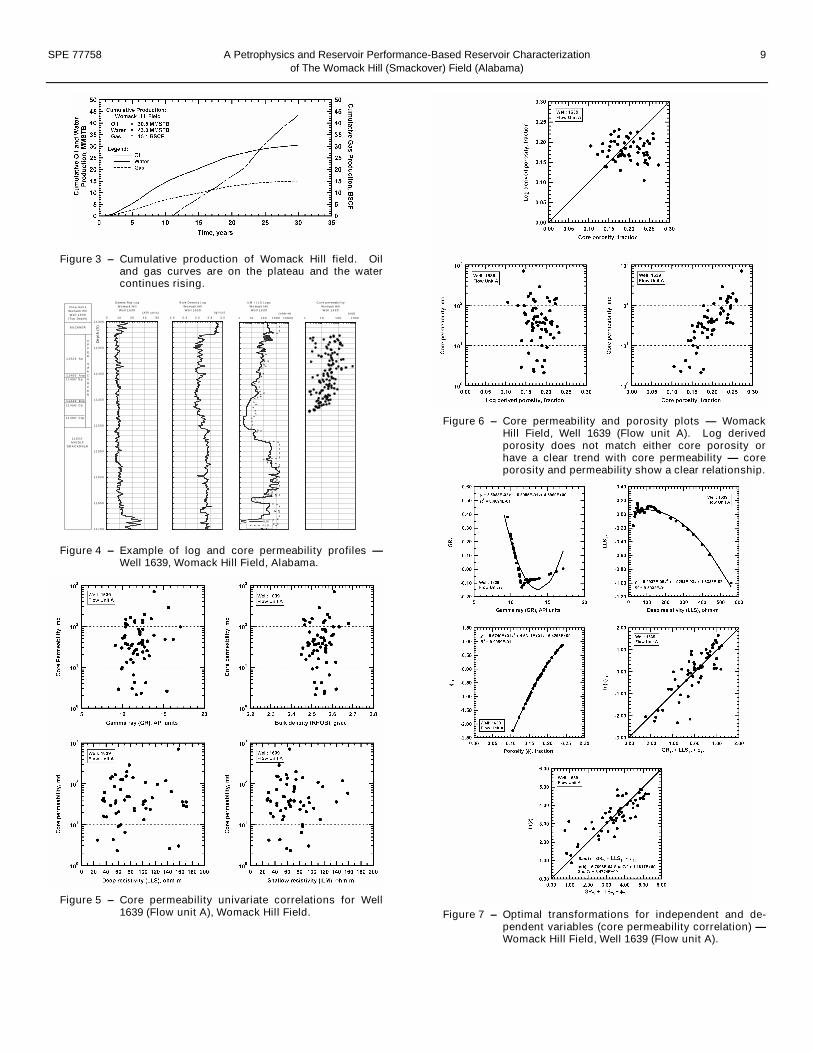
As an example, in Fig. 4 we provide a presentation of the coreand well log data — showing the well log data and core per-meability profiles along of the stratigraphic column for Well1639 (all wells are referenced according to their correspondingstate permit number). The reservoir has been divided intothree "flow units" (Mancini, et al4 (2001)) (A, B, and C), andwe note that our work (using the core and well log data) con-firms these assignments.
As shown, the core permeability data are quite scattered,giving us an indication of the level of heterogeneity in thereservoir. The wells at Womack Hill Field produce from theUpper Smackover carbonate reservoir, which is typicallycharacterized by a high level of heterogeneity. This makes itdifficult to establish correlations between the petrophysicalvariables on a regional scale (Kopaska-Merkel, et al5 (1994)).As such, our approach is to establish correlations for each ofthe three flow units on a local scale (i.e., for individual wells).
As part of our characterization of the petrophysical data, wedistributed the core data (porosity and permeability) into theappropriate flow units and aligned the corresponding well logmeasurements to construct data tables for correlation pur-poses. We have core data for 14 wells in Womack Hill Field— however; we selected the core and well log data for only 9wells (as shown in Table 1). We find that there is no
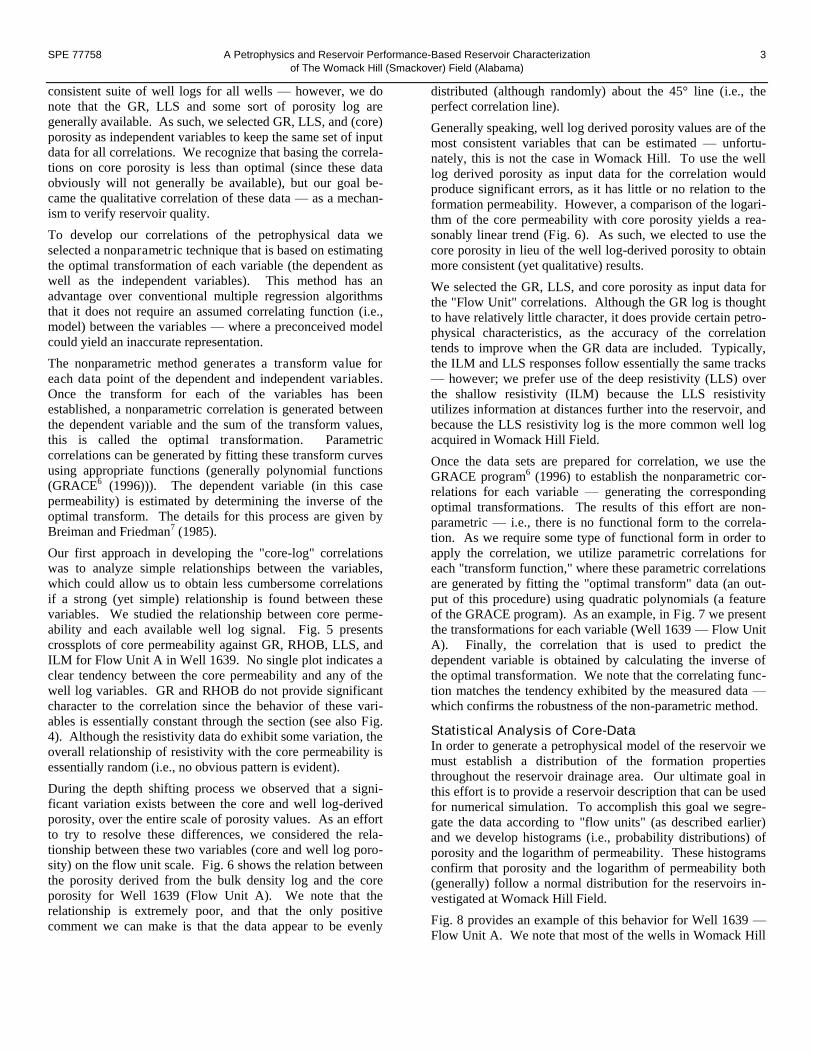
SPE 77758 A Petrophysics and Reservoir Performance-Based Reservoir Characterization 3of The Womack Hill (Smackover) Field (Alabama)
consistent suite of well logs for all wells — however, we donote that the GR, LLS and some sort of porosity log aregenerally available. As such, we selected GR, LLS, and (core)porosity as independent variables to keep the same set of inputdata for all correlations. We recognize that basing the correla-tions on core porosity is less than optimal (since these dataobviously will not generally be available), but our goal be-came the qualitative correlation of these data — as a mechan-ism to verify reservoir quality.
To develop our correlations of the petrophysical data weselected a nonparametric technique that is based on estimatingthe optimal transformation of each variable (the dependent aswell as the independent variables). This method has anadvantage over conventional multiple regression algorithmsthat it does not require an assumed correlating function (i.e.,model) between the variables — where a preconceived modelcould yield an inaccurate representation.
The nonparametric method generates a transform value foreach data point of the dependent and independent variables.Once the transform for each of the variables has beenestablished, a nonparametric correlation is generated betweenthe dependent variable and the sum of the transform values,this is called the optimal transformation. Parametriccorrelations can be generated by fitting these transform curvesusing appropriate functions (generally polynomial functions(GRACE6 (1996))). The dependent variable (in this casepermeability) is estimated by determining the inverse of theoptimal transform. The details for this process are given byBreiman and Friedman7 (1985).
Our first approach in developing the "core-log" correlationswas to analyze simple relationships between the variables,which could allow us to obtain less cumbersome correlationsif a strong (yet simple) relationship is found between thesevariables. We studied the relationship between core perme-ability and each available well log signal. Fig. 5 presentscrossplots of core permeability against GR, RHOB, LLS, andILM for Flow Unit A in Well 1639. No single plot indicates aclear tendency between the core permeability and any of thewell log variables. GR and RHOB do not provide significantcharacter to the correlation since the behavior of these vari-ables is essentially constant through the section (see also Fig.4). Although the resistivity data do exhibit some variation, theoverall relationship of resistivity with the core permeability isessentially random (i.e., no obvious pattern is evident).
During the depth shifting process we observed that a signi-ficant variation exists between the core and well log-derivedporosity, over the entire scale of porosity values. As an effortto try to resolve these differences, we considered the rela-tionship between these two variables (core and well log poro-sity) on the flow unit scale. Fig. 6 shows the relation betweenthe porosity derived from the bulk density log and the coreporosity for Well 1639 (Flow Unit A). We note that therelationship is extremely poor, and that the only positivecomment we can make is that the data appear to be evenly
distributed (although randomly) about the 45° line (i.e., theperfect correlation line).
Generally speaking, well log derived porosity values are of themost consistent variables that can be estimated — unfortu-nately, this is not the case in Womack Hill. To use the welllog derived porosity as input data for the correlation wouldproduce significant errors, as it has little or no relation to theformation permeability. However, a comparison of the logari-thm of the core permeability with core porosity yields a rea-sonably linear trend (Fig. 6). As such, we elected to use thecore porosity in lieu of the well log-derived porosity to obtainmore consistent (yet qualitative) results.
We selected the GR, LLS, and core porosity as input data forthe "Flow Unit" correlations. Although the GR log is thoughtto have relatively little character, it does provide certain petro-physical characteristics, as the accuracy of the correlationtends to improve when the GR data are included. Typically,the ILM and LLS responses follow essentially the same tracks— however; we prefer use of the deep resistivity (LLS) overthe shallow resistivity (ILM) because the LLS resistivityutilizes information at distances further into the reservoir, andbecause the LLS resistivity log is the more common well logacquired in Womack Hill Field.
Once the data sets are prepared for correlation, we use theGRACE program6 (1996) to establish the nonparametric cor-relations for each variable — generating the correspondingoptimal transformations. The results of this effort are non-parametric — i.e., there is no functional form to the correla-tion. As we require some type of functional form in order toapply the correlation, we utilize parametric correlations foreach "transform function," where these parametric correlationsare generated by fitting the "optimal transform" data (an out-put of this procedure) using quadratic polynomials (a featureof the GRACE program). As an example, in Fig. 7 we presentthe transformations for each variable (Well 1639 — Flow UnitA). Finally, the correlation that is used to predict thedependent variable is obtained by calculating the inverse ofthe optimal transformation. We note that the correlating func-tion matches the tendency exhibited by the measured data —which confirms the robustness of the non-parametric method.
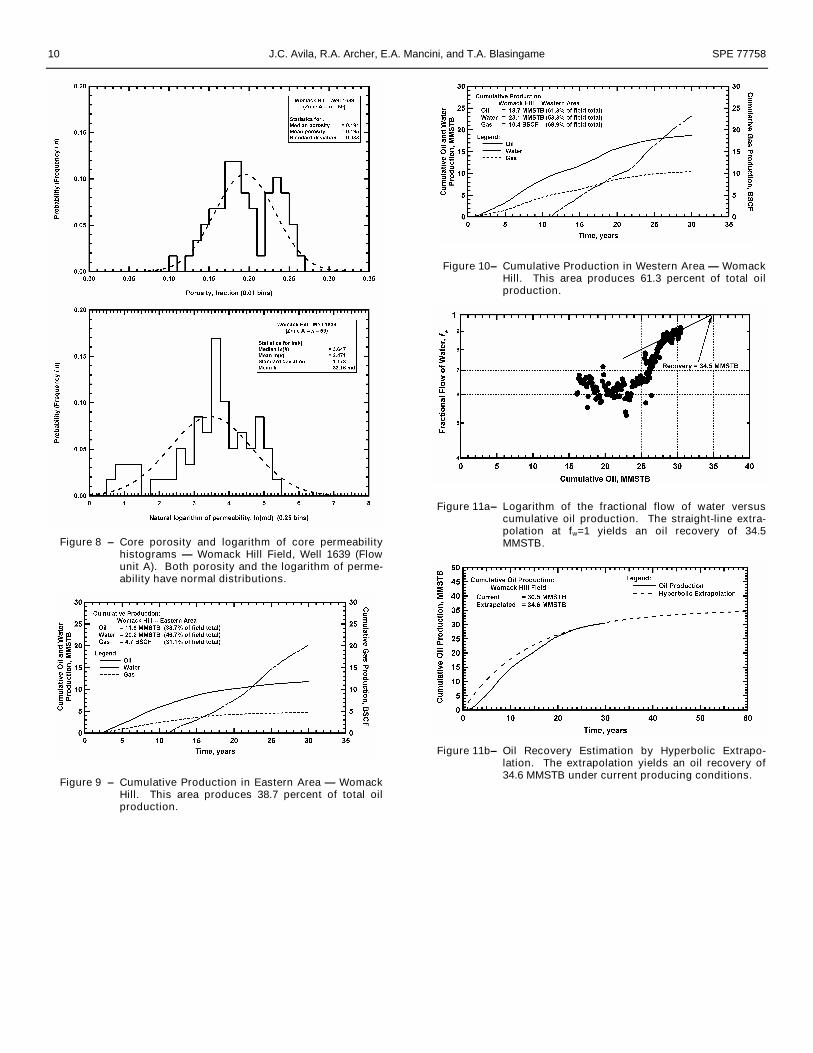
Statistical Analysis of Core-DataIn order to generate a petrophysical model of the reservoir wemust establish a distribution of the formation propertiesthroughout the reservoir drainage area. Our ultimate goal inthis effort is to provide a reservoir description that can be usedfor numerical simulation. To accomplish this goal we segre-gate the data according to "flow units" (as described earlier)and we develop histograms (i.e., probability distributions) ofporosity and the logarithm of permeability. These histogramsconfirm that porosity and the logarithm of permeability both(generally) follow a normal distribution for the reservoirs in-vestigated at Womack Hill Field.
Fig. 8 provides an example of this behavior for Well 1639 —Flow Unit A. We note that most of the wells in Womack Hill
4 J.C. Avila, R.A. Archer, E.A. Mancini, and T.A. Blasingame SPE 77758
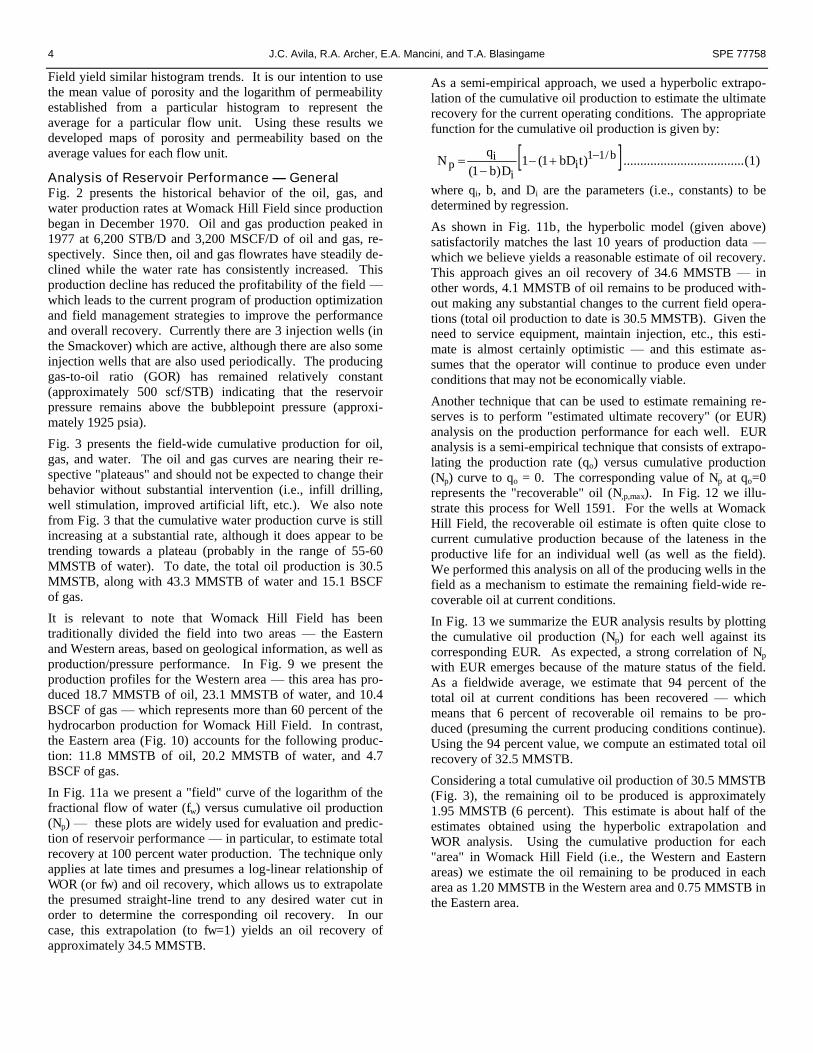
Field yield similar histogram trends. It is our intention to usethe mean value of porosity and the logarithm of permeabilityestablished from a particular histogram to represent theaverage for a particular flow unit. Using these results wedeveloped maps of porosity and permeability based on theaverage values for each flow unit.
Analysis of Reservoir Performance — GeneralFig. 2 presents the historical behavior of the oil, gas, andwater production rates at Womack Hill Field since productionbegan in December 1970. Oil and gas production peaked in1977 at 6,200 STB/D and 3,200 MSCF/D of oil and gas, re-spectively. Since then, oil and gas flowrates have steadily de-clined while the water rate has consistently increased. Thisproduction decline has reduced the profitability of the field —which leads to the current program of production optimizationand field management strategies to improve the performanceand overall recovery. Currently there are 3 injection wells (inthe Smackover) which are active, although there are also someinjection wells that are also used periodically. The producinggas-to-oil ratio (GOR) has remained relatively constant(approximately 500 scf/STB) indicating that the reservoirpressure remains above the bubblepoint pressure (approxi-mately 1925 psia).
Fig. 3 presents the field-wide cumulative production for oil,gas, and water. The oil and gas curves are nearing their re-spective "plateaus" and should not be expected to change theirbehavior without substantial intervention (i.e., infill drilling,well stimulation, improved artificial lift, etc.). We also notefrom Fig. 3 that the cumulative water production curve is stillincreasing at a substantial rate, although it does appear to betrending towards a plateau (probably in the range of 55-60MMSTB of water). To date, the total oil production is 30.5MMSTB, along with 43.3 MMSTB of water and 15.1 BSCFof gas.
It is relevant to note that Womack Hill Field has beentraditionally divided the field into two areas — the Easternand Western areas, based on geological information, as well asproduction/pressure performance. In Fig. 9 we present theproduction profiles for the Western area — this area has pro-duced 18.7 MMSTB of oil, 23.1 MMSTB of water, and 10.4BSCF of gas — which represents more than 60 percent of thehydrocarbon production for Womack Hill Field. In contrast,the Eastern area (Fig. 10) accounts for the following produc-tion: 11.8 MMSTB of oil, 20.2 MMSTB of water, and 4.7BSCF of gas.
In Fig. 11a we present a "field" curve of the logarithm of thefractional flow of water (fw) versus cumulative oil production(Np) — these plots are widely used for evaluation and predic-tion of reservoir performance — in particular, to estimate totalrecovery at 100 percent water production. The technique onlyapplies at late times and presumes a log-linear relationship ofWOR (or fw) and oil recovery, which allows us to extrapolatethe presumed straight-line trend to any desired water cut inorder to determine the corresponding oil recovery. In ourcase, this extrapolation (to fw=1) yields an oil recovery ofapproximately 34.5 MMSTB.
As a semi-empirical approach, we used a hyperbolic extrapo-lation of the cumulative oil production to estimate the ultimaterecovery for the current operating conditions. The appropriatefunction for the cumulative oil production is given by:
bi
i
ip tbD
Dbq
N /11)1(1)1(
....................................(1)
where qi, b, and Di are the parameters (i.e., constants) to bedetermined by regression.
As shown in Fig. 11b, the hyperbolic model (given above)satisfactorily matches the last 10 years of production data —which we believe yields a reasonable estimate of oil recovery.This approach gives an oil recovery of 34.6 MMSTB — inother words, 4.1 MMSTB of oil remains to be produced with-out making any substantial changes to the current field opera-tions (total oil production to date is 30.5 MMSTB). Given theneed to service equipment, maintain injection, etc., this esti-mate is almost certainly optimistic — and this estimate as-sumes that the operator will continue to produce even underconditions that may not be economically viable.
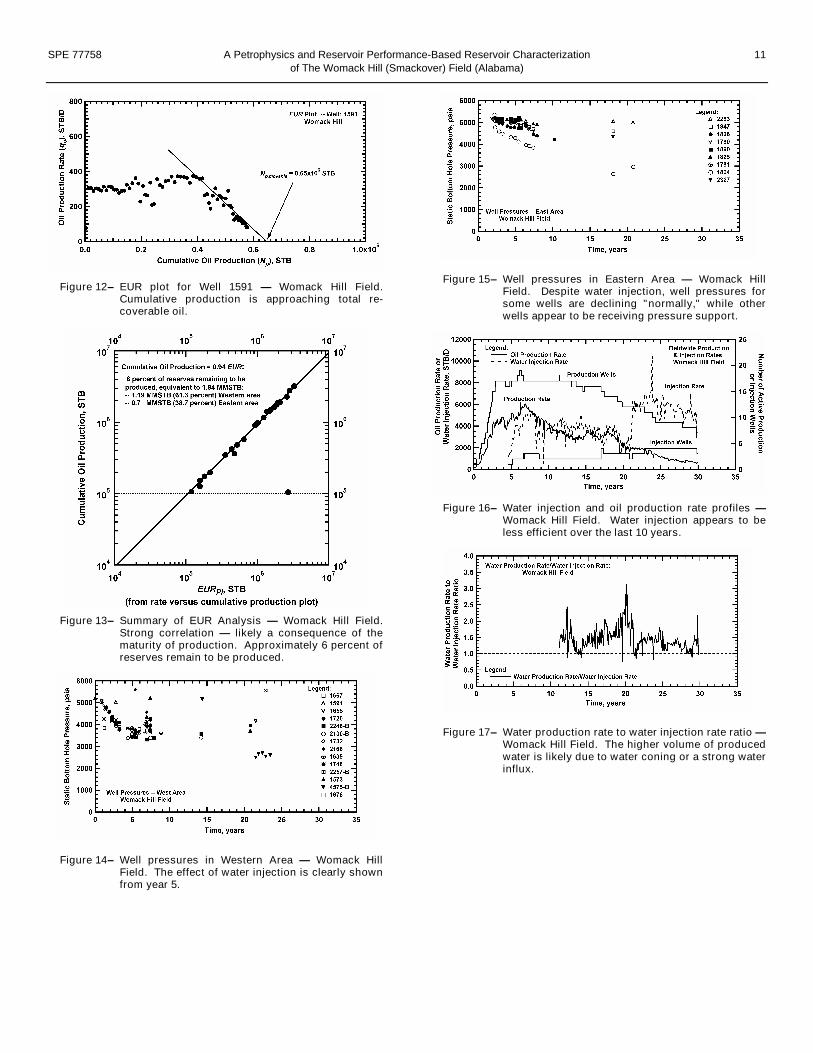
Another technique that can be used to estimate remaining re-serves is to perform "estimated ultimate recovery" (or EUR)analysis on the production performance for each well. EURanalysis is a semi-empirical technique that consists of extrapo-lating the production rate (qo) versus cumulative production(Np) curve to qo = 0. The corresponding value of Np at qo=0represents the "recoverable" oil (N,p,max). In Fig. 12 we illu-strate this process for Well 1591. For the wells at WomackHill Field, the recoverable oil estimate is often quite close tocurrent cumulative production because of the lateness in theproductive life for an individual well (as well as the field).We performed this analysis on all of the producing wells in thefield as a mechanism to estimate the remaining field-wide re-coverable oil at current conditions.
In Fig. 13 we summarize the EUR analysis results by plottingthe cumulative oil production (Np) for each well against itscorresponding EUR. As expected, a strong correlation of Np
with EUR emerges because of the mature status of the field.As a fieldwide average, we estimate that 94 percent of thetotal oil at current conditions has been recovered — whichmeans that 6 percent of recoverable oil remains to be pro-duced (presuming the current producing conditions continue).Using the 94 percent value, we compute an estimated total oilrecovery of 32.5 MMSTB.
Considering a total cumulative oil production of 30.5 MMSTB(Fig. 3), the remaining oil to be produced is approximately1.95 MMSTB (6 percent). This estimate is about half of theestimates obtained using the hyperbolic extrapolation andWOR analysis. Using the cumulative production for each"area" in Womack Hill Field (i.e., the Western and Easternareas) we estimate the oil remaining to be produced in eacharea as 1.20 MMSTB in the Western area and 0.75 MMSTB inthe Eastern area.

SPE 77758 A Petrophysics and Reservoir Performance-Based Reservoir Characterization 5of The Womack Hill (Smackover) Field (Alabama)
Analysis of Reservoir Performance — Field ScaleEarly in the productive life of Womack Hill Field a conceptemerged that the field had two compartments (or areas) — onein the west and one in the east. For field management pur-poses, and based on the belief that a geological division existsin the field, Womack Hill Field has been developed andmanaged as two independent "areas". While this issue of"separation" continues to be debated, it appears conclusivethat some pressure support is benefiting wells in the Easternarea — while all of the injection wells are in the Western area.
It is important to note that all of the water injection wells arelocated in the Western region, so the water injection influenceshould not affect the Eastern area if a "barrier" truly exists.Fig. 3 shows that the water injection rate has always exceededthe oil production rate — the cumulative water injected hasreached 42 MMSTB, which is 11.5 MMSTB higher than theoil withdrawal. So the amount of injected water appears to bemore than sufficient to maintain the reservoir pressure. Figs.14 and 15 present the limited pressure data available forWestern and Eastern areas, respectively. Fig. 14 illustratesclearly the pressure increase (or maintenance) in the Westernwells due to the water injection. However, the pressuremaintenance has not been as effective in the Eastern area (Fig.15), where the pressure in most of the wells has declined(although there certainly are exceptions). This pressure datasuggests that a geological separation could exist between thetwo areas — but these data certainly does not serve to confirmthis concept. As noted, some of the wells in the Eastern areahave experienced pressure maintenance — which suggests thatthe "barrier" is not sealing and that some flow paths may com-municate to both areas.
Fig. 16 presents the historical field-wide oil production andwater injection rates. We first note that from the beginning ofthe water injection program up to about year 20 (1990), thereservoir performance was approximately a 1:1 ratio (thevolume of injected water per volume produced oil). Sincethen the injected water has increased steadily and the oilproduction has declined. This sharp change almost certainlycannot be attributed to a reservoir mechanism — it is far morelikely to be a consequence of operational practices. In fact, in1990 the operator first installed hydraulic "jet pumps" in theproduction wells in order to improve the productivity — but asrevealed in Fig. 16, it appears that just the opposite occurred.
We also consider the phenomenon of "overproduction" ofwater where the ratio of the water production rates to the waterinjection rates versus time is presented in Fig. 17. This profileshows a ratio over unity — so the volume of produced water is(and always has been) higher than the volume of injectedwater. Water coning, water channeling, and/or strong waterinflux could cause this phenomenon. Empirical evidence froma site visit to Womack Hill Field suggests the possibility ofwater channeling and water influx. A numerical simulationmodel should consider the causes and effects of this pheno-menon of "overproduction" of water.
Analysis of Well Performance — Decline CurvesFor this work we have specifically used the Fetkovich-McCray family of decline type curves (Doublet, et al8 (1994))where these type curves are formulated using pseudosteady-state (or boundary-dominated) flow behavior. We use pres-sure-drop normalized rate functions as well as the "materialbalance time" formulation to eliminate the constant pwf con-straint associated with the original Fetkovich method. Inaddition, by adding the rate integral and the rate integral-derivative functions to this analysis technique, we are able toachieve much more consistent (i.e., unique) type curvematches and we generally obtain better matches of transientdata for the estimation of formation flow properties.
The software WPA (Blasingame, et al9 (1998)) provides us amechanism to apply this technique. In addition to productiondata, we also require reservoir and fluid properties, as well asan estimate of the initial reservoir pressure. Once the analysisprocess is completed in the WPA software, we obtain esti-mates of the following parameters:
Flow terms:
Effective permeability, ko, mdSkin factor for near-well damage/stimulation, sFracture-half length, xf
Volumetric results:
Nct product, STB/psiReservoir drainage radius, re, ftDrainage area, A, acres
Fig. 18 illustrates the type curve match we obtained for Well1847. As shown, the q/p, the "integral" of q/p, and the"integral-derivative" of q/p are matched against the corre-sponding type curves. We note that most of the data lie in the"boundary-dominated flow region" — which is logical sincethe "transient flow region" contains few (if any) representativedata (due to the proration of the field). Further, a lack ofwellbore pressure data amplifies the problems encounteredwith the identification/analysis of data in the transient flowregion — we simply have to provide a "best guess" analysis inthis region, which implies that the "flow property:" results arequalitative at best.
As noted, we can only use the transient "flow property" resultsqualitatively, but we can utilize the "volumetric" results in asomewhat more quantitative fashion because for each wellanalyzed we clearly observe the late-time "harmonic" trend —which confirms the material balance correctness of this tech-nique. Unfortunately, the parameters estimated using the "latetime" data are tied to the value of total compressibility (ct)specified for the analysis — this is not a value for which wehave substantial confidence. Having prescribed a value for ct,we can calculate the oil-in-place (N) and the reservoir drainagearea (A). In this particular case we believe that it may be morevaluable to report the Nct-product because our estimate of ct
yields estimates of N and A which are clearly unrealistic.
6 J.C. Avila, R.A. Archer, E.A. Mancini, and T.A. Blasingame SPE 77758
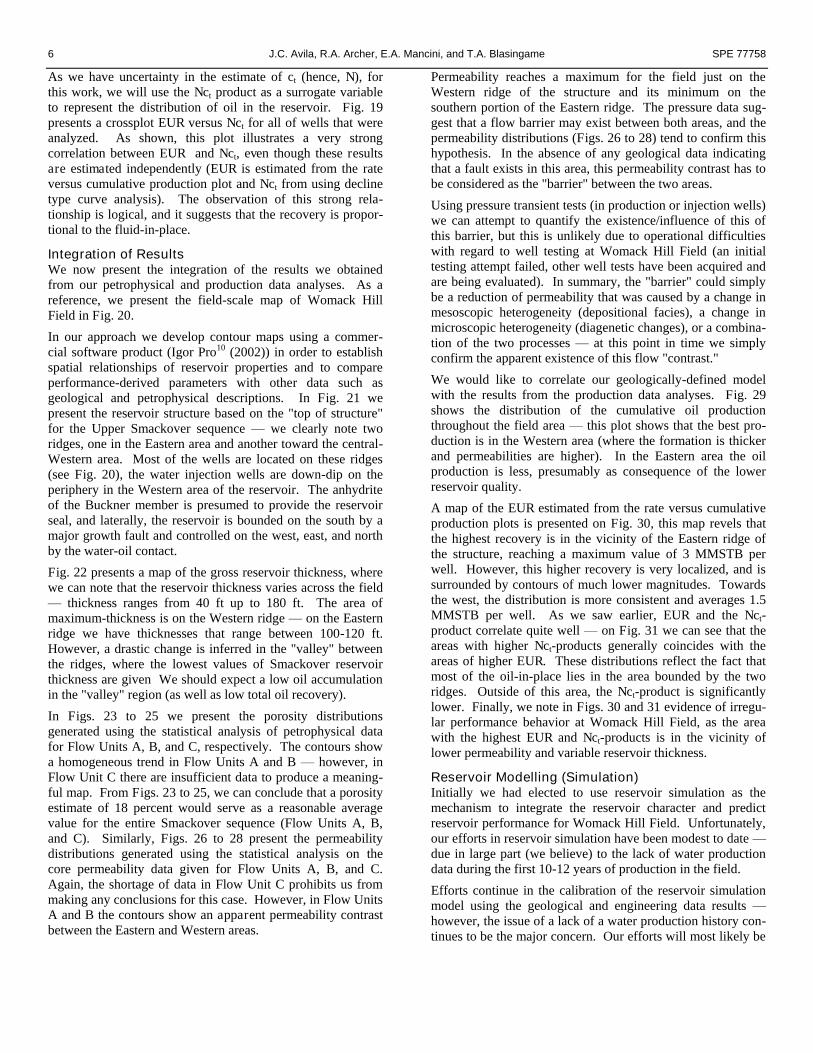
As we have uncertainty in the estimate of ct (hence, N), forthis work, we will use the Nct product as a surrogate variableto represent the distribution of oil in the reservoir. Fig. 19presents a crossplot EUR versus Nct for all of wells that wereanalyzed. As shown, this plot illustrates a very strongcorrelation between EUR and Nct, even though these resultsare estimated independently (EUR is estimated from the rateversus cumulative production plot and Nct from using declinetype curve analysis). The observation of this strong rela-tionship is logical, and it suggests that the recovery is propor-tional to the fluid-in-place.
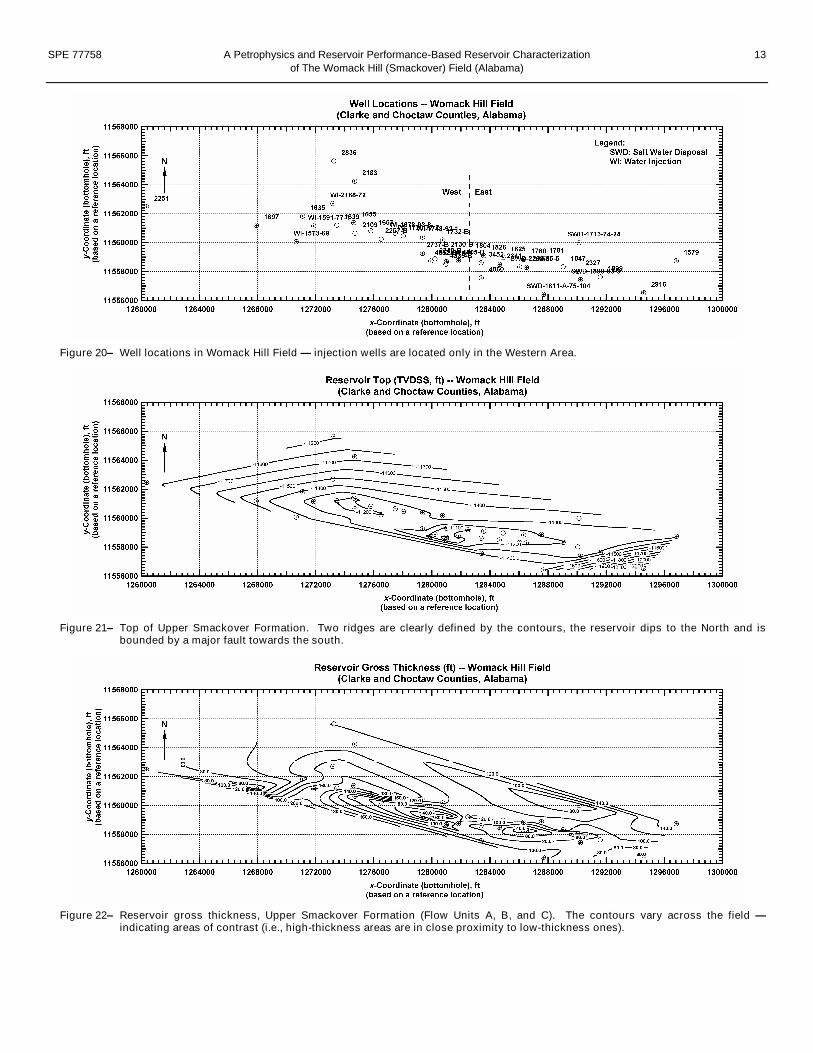
Integration of ResultsWe now present the integration of the results we obtainedfrom our petrophysical and production data analyses. As areference, we present the field-scale map of Womack HillField in Fig. 20.
In our approach we develop contour maps using a commer-cial software product (Igor Pro10 (2002)) in order to establishspatial relationships of reservoir properties and to compareperformance-derived parameters with other data such asgeological and petrophysical descriptions. In Fig. 21 wepresent the reservoir structure based on the "top of structure"for the Upper Smackover sequence — we clearly note tworidges, one in the Eastern area and another toward the central-Western area. Most of the wells are located on these ridges(see Fig. 20), the water injection wells are down-dip on theperiphery in the Western area of the reservoir. The anhydriteof the Buckner member is presumed to provide the reservoirseal, and laterally, the reservoir is bounded on the south by amajor growth fault and controlled on the west, east, and northby the water-oil contact.
Fig. 22 presents a map of the gross reservoir thickness, wherewe can note that the reservoir thickness varies across the field— thickness ranges from 40 ft up to 180 ft. The area ofmaximum-thickness is on the Western ridge — on the Easternridge we have thicknesses that range between 100-120 ft.However, a drastic change is inferred in the "valley" betweenthe ridges, where the lowest values of Smackover reservoirthickness are given We should expect a low oil accumulationin the "valley" region (as well as low total oil recovery).
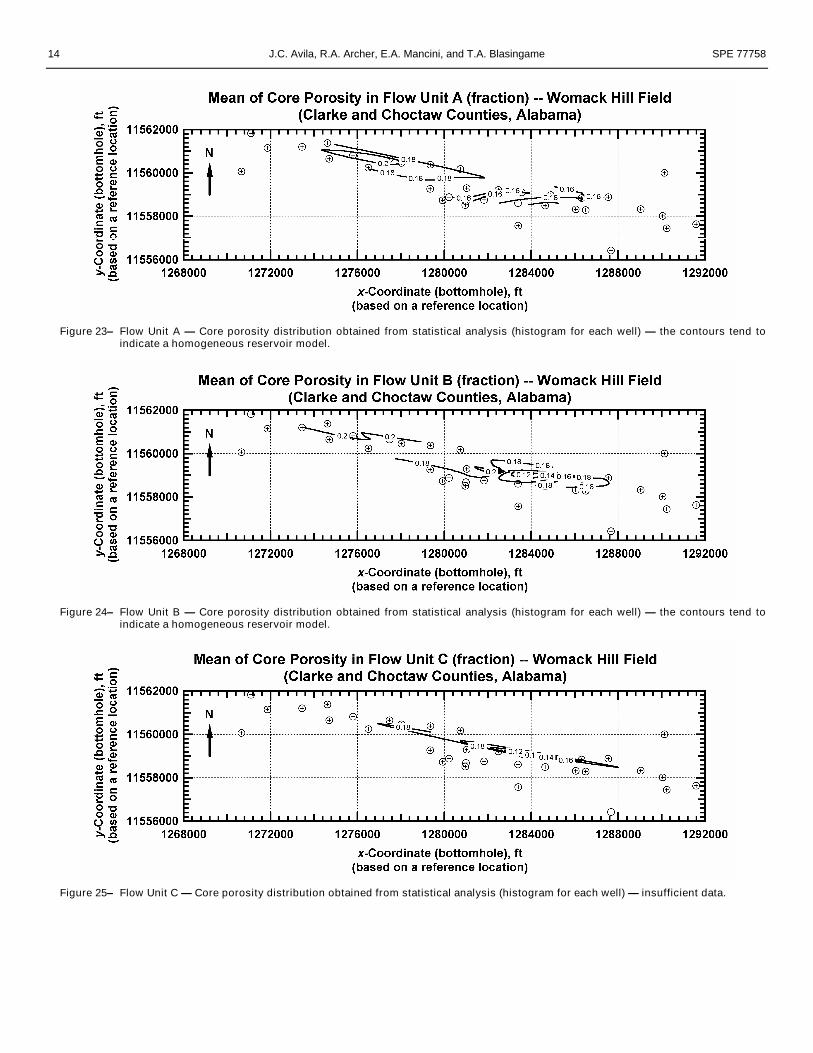
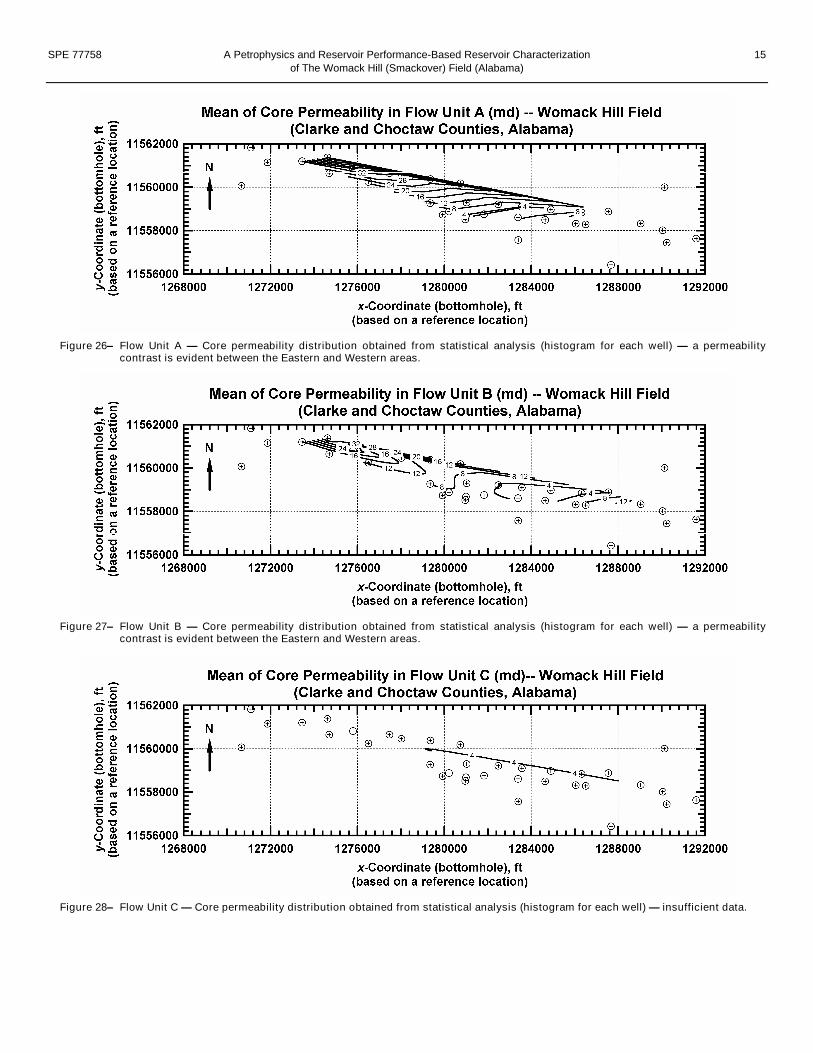
In Figs. 23 to 25 we present the porosity distributionsgenerated using the statistical analysis of petrophysical datafor Flow Units A, B, and C, respectively. The contours showa homogeneous trend in Flow Units A and B — however, inFlow Unit C there are insufficient data to produce a meaning-ful map. From Figs. 23 to 25, we can conclude that a porosityestimate of 18 percent would serve as a reasonable averagevalue for the entire Smackover sequence (Flow Units A, B,and C). Similarly, Figs. 26 to 28 present the permeabilitydistributions generated using the statistical analysis on thecore permeability data given for Flow Units A, B, and C.Again, the shortage of data in Flow Unit C prohibits us frommaking any conclusions for this case. However, in Flow UnitsA and B the contours show an apparent permeability contrastbetween the Eastern and Western areas.
Permeability reaches a maximum for the field just on theWestern ridge of the structure and its minimum on thesouthern portion of the Eastern ridge. The pressure data sug-gest that a flow barrier may exist between both areas, and thepermeability distributions (Figs. 26 to 28) tend to confirm thishypothesis. In the absence of any geological data indicatingthat a fault exists in this area, this permeability contrast has tobe considered as the "barrier" between the two areas.
Using pressure transient tests (in production or injection wells)we can attempt to quantify the existence/influence of this ofthis barrier, but this is unlikely due to operational difficultieswith regard to well testing at Womack Hill Field (an initialtesting attempt failed, other well tests have been acquired andare being evaluated). In summary, the "barrier" could simplybe a reduction of permeability that was caused by a change inmesoscopic heterogeneity (depositional facies), a change inmicroscopic heterogeneity (diagenetic changes), or a combina-tion of the two processes — at this point in time we simplyconfirm the apparent existence of this flow "contrast."
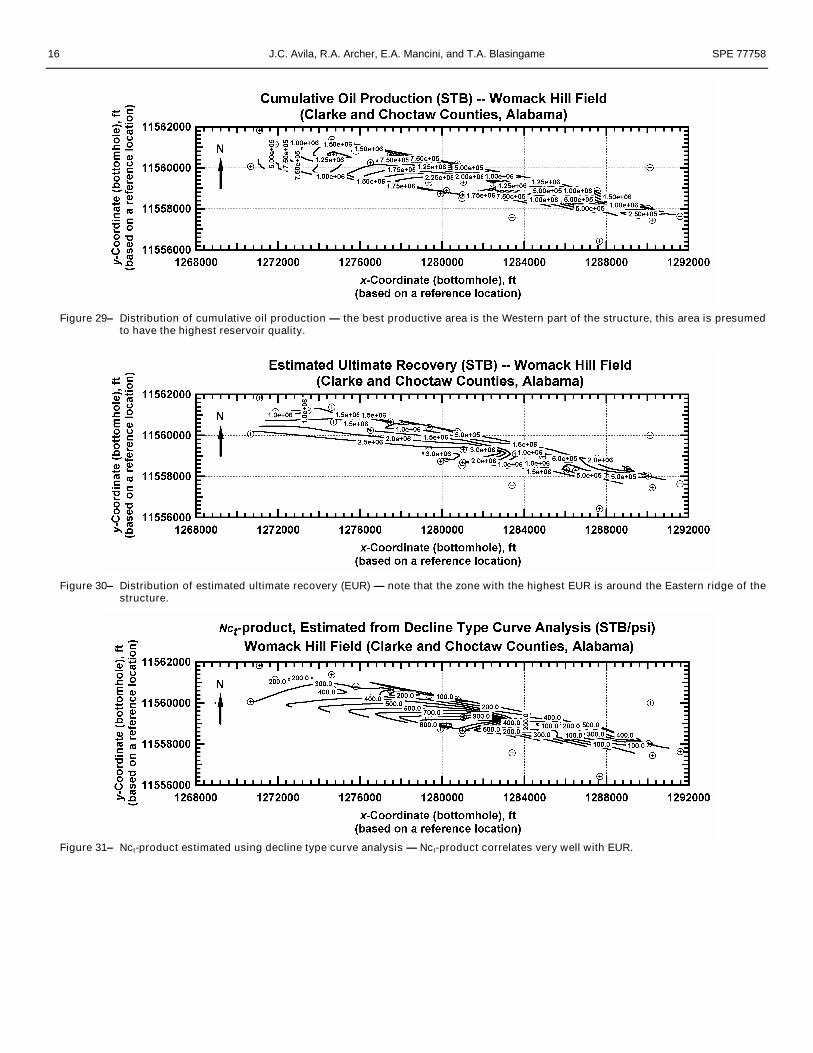
We would like to correlate our geologically-defined modelwith the results from the production data analyses. Fig. 29shows the distribution of the cumulative oil productionthroughout the field area — this plot shows that the best pro-duction is in the Western area (where the formation is thickerand permeabilities are higher). In the Eastern area the oilproduction is less, presumably as consequence of the lowerreservoir quality.
A map of the EUR estimated from the rate versus cumulativeproduction plots is presented on Fig. 30, this map revels thatthe highest recovery is in the vicinity of the Eastern ridge ofthe structure, reaching a maximum value of 3 MMSTB perwell. However, this higher recovery is very localized, and issurrounded by contours of much lower magnitudes. Towardsthe west, the distribution is more consistent and averages 1.5MMSTB per well. As we saw earlier, EUR and the Nct-product correlate quite well — on Fig. 31 we can see that theareas with higher Nct-products generally coincides with theareas of higher EUR. These distributions reflect the fact thatmost of the oil-in-place lies in the area bounded by the tworidges. Outside of this area, the Nct-product is significantlylower. Finally, we note in Figs. 30 and 31 evidence of irregu-lar performance behavior at Womack Hill Field, as the areawith the highest EUR and Nct-products is in the vicinity oflower permeability and variable reservoir thickness.
Reservoir Modelling (Simulation)Initially we had elected to use reservoir simulation as themechanism to integrate the reservoir character and predictreservoir performance for Womack Hill Field. Unfortunately,our efforts in reservoir simulation have been modest to date —due in large part (we believe) to the lack of water productiondata during the first 10-12 years of production in the field.
Efforts continue in the calibration of the reservoir simulationmodel using the geological and engineering data results —however, the issue of a lack of a water production history con-tinues to be the major concern. Our efforts will most likely be
SPE 77758 A Petrophysics and Reservoir Performance-Based Reservoir Characterization 7of The Womack Hill (Smackover) Field (Alabama)
limited to the available data — and appropriate caution will begiven to interpreting the results from reservoir modelling.
Summary1. Petrophysical Data Correlation: Extensive efforts were made
to integrate/correlate the core and well log data for WomackHill Field. In summary, we believe that the porosity deter-mined from well logs may be corrupt, or at least the vintageof the well logs used to estimate porosity may not be pro-perly calibrated — no consistent correlations of well log poro-sity and core porosity were found.
As such, we elected to correlate reservoir permeability withcore porosity, Gamma Ray well log response, and one of theresistivity log responses. We recognize that this is more anexercise in correlation since a prediction would require coreporosity (or an accurate surrogate).
2. Production/Injection Analysis: All of the production andinjection data have been thoroughly interpreted and analyzedusing appropriate mechanisms (decline type curve analysis,EUR analysis, etc.). We believe that the "volumetric" resultsare relevant as virtually every analysis gave an appropriatesignature for decline type curve analysis. However, a discre-pancy in the estimate of the total compressibility for thisreservoir system has arisen, and the volumetric results need tobe revised (i.e., referenced to a more appropriate value of totalcompressibility)
It is relevant to note that independent analyses of the produc-tion data (i.e., decline type curve analysis and EUR analysisdo correlate very well — despite being derived from tech-niques). In addition, on a fieldwide basis, the cumulative oilproduction is on the order to 94 percent of the estimated ulti-mate recovery (or EUR). This leaves approximately 1.95MMSTB to be produced under current producing conditions.
3. Reservoir Simulation Model: The reservoir simulation effortshave largely focused on balancing the volumes of producedwater. A number of different water injection/water influxschemes have been pursued, as well as a systematic study ofthe effect of the water-oil contact.
While revisions to this model will be proposed (based on new/revised geological/engineering data), the issue remains thatthe initial 10-12 years of water production were not recorded.Again, we will attempt to "balance" the unknown water pro-duction with appropriate consideration of injected water andwater influx.
Nomenclatureb = Arps' hyperbolic parameter, dimensionlessct = Total compressibility, psi-1
Di = Arps' "decline" constant, 1/DEUR= Estimated ultimate recovery, STBfw = fractional flow of water, dimensionless
GOR= Gas to oil (rate) ratio, dimensionlessko = Effective permeability, mdq = Production rate, STB/Dqi = Initial production rate, STB/DN = Original oil-in-place, STBNp = Cumulative oil production, STB
Np,max= Maximum (or recoverable) oil production, STBpi = Initial reservoir pressure, psia
pwf = Flowing bottomhole pressure, psiap= (pi-pwf), pressure drop, psis = Skin factor, dimensionlessxf = Fracture half-length, ft
= Porosity, fractionWOR= Water to oil (rate) ratio, dimensionless
References1. Daigre Jr., R.G., Wood, R.T., and Wiggins, G.B.: "Development
of a Well Spacing Program for The South Womack Hill Field,Clarke and Choctaw Counties, Alabama," paper SPE 15530presented at the 1986 SPE Annual Technical Conference andExhibition, New Orleans, 5-8 October.
2. Qi, J., Pashin, J.C., and Groshong Jr., R.H.: "Structure andEvolution of North Choctaw Ridge Field, Alabama, a Salt-Related Footwall Uplift Along the Peripheral Fault Systems,Gulf Coast Basin," Gulf Coast Association of GeologicalSocieties, (1998) 48, Trans., 349.
3. "Suggested program of Operation and Related Future Perfor-mance. Proposed West End Unit Area. Womack Hill Field,Choctaw and Clarke Counties, Alabama," Core Laboratories,Inc., Dallas (July 1974).
4. Mancini, E. et al.: "Improved Oil Recovery from Upper JurassicSmackover Carbonates Through the Application of AdvancedTechnologies at Womack Hill Oil Field, Choctaw and ClarkeCounties, Eastern Gulf Coastal Plain," report for year 1,Contract No. DE-FC26-00BC15129, U.S. DOE, WashingtonDC (April 2000).
5. Kopaska-Merkel, D.C., Mann, S. D., and Schmoker, J.W.:"Controls on Reservoir Development in a Shelf Carbonate: Up-per Jurassic Smackover Formation of Alabama," The AmericanAssociation of Petroleum Geologists (June 1994) 78, No. 8, 938.
6. "GRACE" (software) Ver. 1.0, Texas A&M U., College Station,Texas (1996).
7. Breiman, L. and Friedman, J.: "Estimating Optimal Transforma-tions for Multiple Regression and Correlation," Journal of theAmerican Statistical Association (September 1985) 80, No. 391,590.
8. Doublet, L.E. et al.: "Decline Curve Analysis Using TypeCurves—Analysis of Oil Well Production Data Using MaterialBalance Time: Application to Field Cases," paper SPE 28688presented at the 1994 Petroleum Conference and Exhibition ofMexico, Veracruz, 10-13 October.
9. Blasingame, T.A. et al.: "Well Performance Analysis (WPA)"(software) Ver. 1.8b, Texas A&M U., College Station, Texas(1998).
10. "IgorPro" (software) Ver. 4.0, WaveMetrics, Inc., Lake Os-wego, Oregon (2002).
AcknowledgementsThe authors would like to acknowledge that the U.S. Depart-ment of Energy (DOE) funded this work through Contract No.DE-FC26-00BC15129.
8 J.C. Avila, R.A. Archer, E.A. Mancini, and T.A. Blasingame SPE 77758
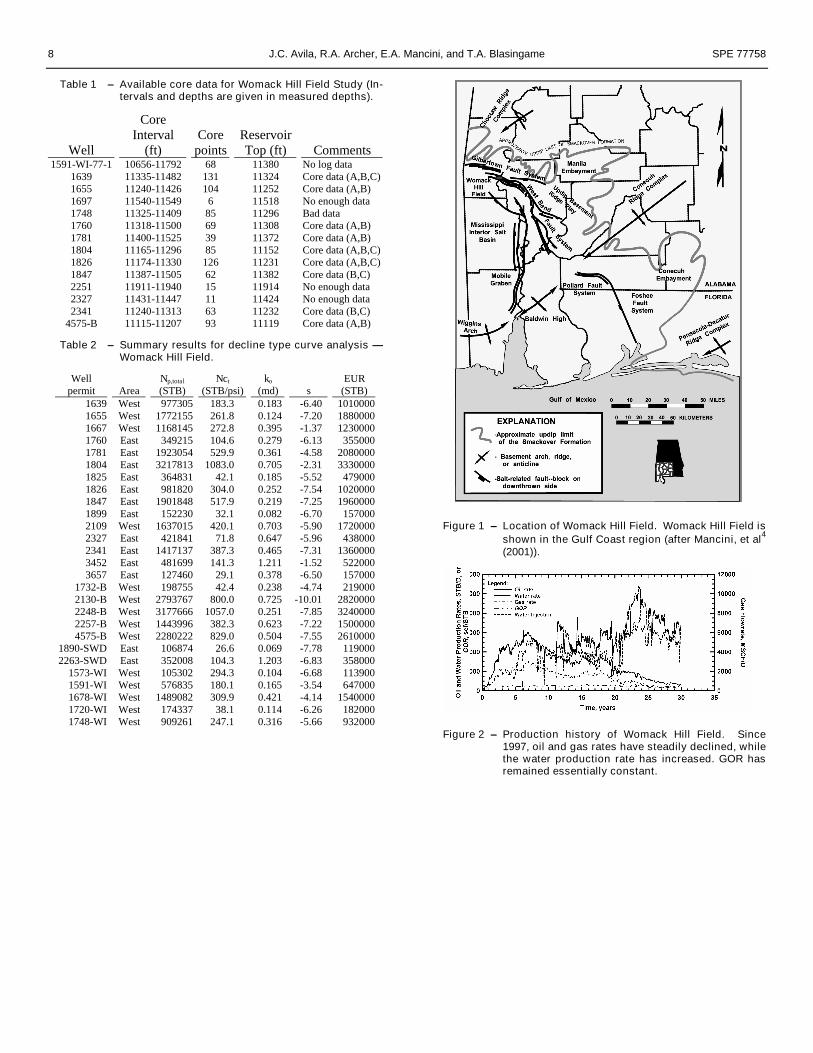
Table 1 –Available core data for Womack Hill Field Study (In-tervals and depths are given in measured depths).
Well
CoreInterval
(ft)Core
pointsReservoirTop (ft) Comments
1591-WI-77-1 10656-11792 68 11380 No log data1639 11335-11482 131 11324 Core data (A,B,C)1655 11240-11426 104 11252 Core data (A,B)1697 11540-11549 6 11518 No enough data1748 11325-11409 85 11296 Bad data1760 11318-11500 69 11308 Core data (A,B)1781 11400-11525 39 11372 Core data (A,B)1804 11165-11296 85 11152 Core data (A,B,C)1826 11174-11330 126 11231 Core data (A,B,C)1847 11387-11505 62 11382 Core data (B,C)2251 11911-11940 15 11914 No enough data2327 11431-11447 11 11424 No enough data2341 11240-11313 63 11232 Core data (B,C)
4575-B 11115-11207 93 11119 Core data (A,B)
Table 2 –Summary results for decline type curve analysis —Womack Hill Field.
Wellpermit Area
Np,total
(STB)Nct
(STB/psi)ko
(md) sEUR
(STB)1639 West 977305 183.3 0.183 -6.40 10100001655 West 1772155 261.8 0.124 -7.20 18800001667 West 1168145 272.8 0.395 -1.37 12300001760 East 349215 104.6 0.279 -6.13 3550001781 East 1923054 529.9 0.361 -4.58 20800001804 East 3217813 1083.0 0.705 -2.31 33300001825 East 364831 42.1 0.185 -5.52 4790001826 East 981820 304.0 0.252 -7.54 10200001847 East 1901848 517.9 0.219 -7.25 19600001899 East 152230 32.1 0.082 -6.70 1570002109 West 1637015 420.1 0.703 -5.90 17200002327 East 421841 71.8 0.647 -5.96 4380002341 East 1417137 387.3 0.465 -7.31 13600003452 East 481699 141.3 1.211 -1.52 5220003657 East 127460 29.1 0.378 -6.50 157000
1732-B West 198755 42.4 0.238 -4.74 2190002130-B West 2793767 800.0 0.725 -10.01 28200002248-B West 3177666 1057.0 0.251 -7.85 32400002257-B West 1443996 382.3 0.623 -7.22 15000004575-B West 2280222 829.0 0.504 -7.55 2610000
1890-SWD East 106874 26.6 0.069 -7.78 1190002263-SWD East 352008 104.3 1.203 -6.83 358000
1573-WI West 105302 294.3 0.104 -6.68 1139001591-WI West 576835 180.1 0.165 -3.54 6470001678-WI West 1489082 309.9 0.421 -4.14 15400001720-WI West 174337 38.1 0.114 -6.26 1820001748-WI West 909261 247.1 0.316 -5.66 932000
Figure 1 –Location of Womack Hill Field. Womack Hill Field isshown in the Gulf Coast region (after Mancini, et al4
(2001)).
Figure 2 –Production history of Womack Hill Field. Since1997, oil and gas rates have steadily declined, whilethe water production rate has increased. GOR hasremained essentially constant.
SPE 77758 A Petrophysics and Reservoir Performance-Based Reservoir Characterization 9of The Womack Hill (Smackover) Field (Alabama)
Figure 3 –Cumulative production of Womack Hill field. Oiland gas curves are on the plateau and the watercontinues rising.
Gamma Ray LogW omack HillW el l 1 6 3 9
1 1 3 0 0
1 1 3 5 0
1 1 4 0 0
1 1 4 5 0
1 1 5 0 0
1 1 5 5 0
1 1 6 0 0
1 1 6 5 0
1 1 7 0 0
0 1 5 3 0 4 5 6 0
( A PI unit s)
De
pth
(ft)
B ulk D ensit y LogW omack HillW el l 1 6 3 9
1 1 3 0 0
1 1 3 5 0
1 1 4 0 0
1 1 4 5 0
1 1 5 0 0
1 1 5 5 0
1 1 6 0 0
1 1 6 5 0
1 1 7 0 0
2 .0 2 .3 2 .5 2 .8 3 .0
( gr / cc)
ILM / LLS LogsW o mack Hi llW ell 1 6 3 9
1 1 3 0 0
1 1 3 5 0
1 1 4 0 0
1 1 4 5 0
1 1 5 0 0
1 1 5 5 0
1 1 6 0 0
1 1 6 5 0
1 1 7 0 0
1 1 0 1 0 0 1 0 0 0 1 0 0 0 0
( ohm- m)
ILMLLS
Flo w U nit sW omack HillW ell 1 6 3 9
( Top Dep t h)
B U CKN ER
UPPER
SMACKOVER
1 1 3 2 4 ' A p
1 1 4 0 6 ' Bp
1 1 5 0 4 'M ID D LE
SM A C KOV ER
1 1 4 0 0 ' A np
1 1 4 4 9 ' B np1 1 4 5 6 ' Cp
1 1 4 8 0 ' Cnp
C ore permeabi lit yW omack HillW ell 1 6 3 9
1 1 3 0 0
1 1 3 5 0
1 1 4 0 0
1 1 4 5 0
1 1 5 0 0
1 1 5 5 0
1 1 6 0 0
1 1 6 5 0
1 1 7 0 0
1 1 0 1 0 0 1 0 0 0
( md)
Figure 4 –Example of log and core permeability profiles —Well 1639, Womack Hill Field, Alabama.
Figure 5 –Core permeability univariate correlations for Well1639 (Flow unit A), Womack Hill Field.
Figure 6 –Core permeability and porosity plots — WomackHill Field, Well 1639 (Flow unit A). Log derivedporosity does not match either core porosity orhave a clear trend with core permeability — coreporosity and permeability show a clear relationship.
Figure 7 –Optimal transformations for independent and de-pendent variables (core permeability correlation) —Womack Hill Field, Well 1639 (Flow unit A).
10 J.C. Avila, R.A. Archer, E.A. Mancini, and T.A. Blasingame SPE 77758
Figure 8 –Core porosity and logarithm of core permeabilityhistograms — Womack Hill Field, Well 1639 (Flowunit A). Both porosity and the logarithm of perme-ability have normal distributions.
Figure 9 –Cumulative Production in Eastern Area — WomackHill. This area produces 38.7 percent of total oilproduction.
Figure 10–Cumulative Production in Western Area — WomackHill. This area produces 61.3 percent of total oilproduction.
Figure 11a–Logarithm of the fractional flow of water versuscumulative oil production. The straight-line extra-polation at fw=1 yields an oil recovery of 34.5MMSTB.
Figure 11b–Oil Recovery Estimation by Hyperbolic Extrapo-lation. The extrapolation yields an oil recovery of34.6 MMSTB under current producing conditions.
SPE 77758 A Petrophysics and Reservoir Performance-Based Reservoir Characterization 11of The Womack Hill (Smackover) Field (Alabama)
Figure 12–EUR plot for Well 1591 — Womack Hill Field.Cumulative production is approaching total re-coverable oil.
Figure 13–Summary of EUR Analysis — Womack Hill Field.Strong correlation — likely a consequence of thematurity of production. Approximately 6 percent ofreserves remain to be produced.
Figure 14–Well pressures in Western Area — Womack HillField. The effect of water injection is clearly shownfrom year 5.
Figure 15–Well pressures in Eastern Area — Womack HillField. Despite water injection, well pressures forsome wells are declining "normally," while otherwells appear to be receiving pressure support.
Figure 16–Water injection and oil production rate profiles —Womack Hill Field. Water injection appears to beless efficient over the last 10 years.
Figure 17–Water production rate to water injection rate ratio —Womack Hill Field. The higher volume of producedwater is likely due to water coning or a strong waterinflux.

12 J.C. Avila, R.A. Archer, E.A. Mancini, and T.A. Blasingame SPE 77758
Figure 18–Decline type curve analysis — match plot, WomackHill Well 1847. Most of the data lie in the boundary-dominated flow region — the transient flow regimeis less well-defined.
Figure 19–EUR versus. Nct — Womack Hill Field. EUR and.Nct are estimated using independent mechanisms— however, these variables are clearly correlated.
SPE 77758 A Petrophysics and Reservoir Performance-Based Reservoir Characterization 13of The Womack Hill (Smackover) Field (Alabama)
Figure 20–Well locations in Womack Hill Field — injection wells are located only in the Western Area.
Figure 21– Top of Upper Smackover Formation. Two ridges are clearly defined by the contours, the reservoir dips to the North and isbounded by a major fault towards the south.
Figure 22–Reservoir gross thickness, Upper Smackover Formation (Flow Units A, B, and C). The contours vary across the field —indicating areas of contrast (i.e., high-thickness areas are in close proximity to low-thickness ones).
14 J.C. Avila, R.A. Archer, E.A. Mancini, and T.A. Blasingame SPE 77758
Figure 23– Flow Unit A — Core porosity distribution obtained from statistical analysis (histogram for each well) — the contours tend toindicate a homogeneous reservoir model.
Figure 24– Flow Unit B — Core porosity distribution obtained from statistical analysis (histogram for each well) — the contours tend toindicate a homogeneous reservoir model.
Figure 25– Flow Unit C — Core porosity distribution obtained from statistical analysis (histogram for each well) — insufficient data.
SPE 77758 A Petrophysics and Reservoir Performance-Based Reservoir Characterization 15of The Womack Hill (Smackover) Field (Alabama)
Figure 26– Flow Unit A — Core permeability distribution obtained from statistical analysis (histogram for each well) — a permeabilitycontrast is evident between the Eastern and Western areas.
Figure 27– Flow Unit B — Core permeability distribution obtained from statistical analysis (histogram for each well) — a permeabilitycontrast is evident between the Eastern and Western areas.
Figure 28– Flow Unit C — Core permeability distribution obtained from statistical analysis (histogram for each well) — insufficient data.
16 J.C. Avila, R.A. Archer, E.A. Mancini, and T.A. Blasingame SPE 77758
Figure 29–Distribution of cumulative oil production — the best productive area is the Western part of the structure, this area is presumedto have the highest reservoir quality.
Figure 30–Distribution of estimated ultimate recovery (EUR) — note that the zone with the highest EUR is around the Eastern ridge of thestructure.
Figure 31–Nct-product estimated using decline type curve analysis — Nct-product correlates very well with EUR.