spe 172025 developments on relative permeability ...zaleski/papers/spe-172025-ms_final.pdf · spe...
TRANSCRIPT

SPE 172025
Developments on Relative Permeability Computation in 3D Rock Images Tomas Arrufat, Igor Bondino, SPE, TOTAL; Stephane Zaleski, U. Pierre et Marie Curie; Bertrand Lagrée, TOTAL and U. Pierre et Marie Curie; Noomane Keskes, TOTAL UAE.
Copyright 2014, Society of Petroleum Engineers This paper was prepared for presentation at the Abu Dhabi International Petroleum Exhibition and Conference held in Abu Dhabi, UAE, 10–13 November 2014. This paper was selected for presentation by an SPE program committee following review of information contained in an abstract submitted by the author(s). Contents of the paper have not been reviewed by the Society of Petroleum Engineers and are subject to correction by the author(s). The material does not necessarily reflect any position of the Society of Petroleum Engineers, its officers, or members. Electronic reproduction, distribution, or storage of any part of this paper without the written consent of the Society of Petroleum Engineers is prohibited. Permission to reproduce in print is restricted to an abstract of not more than 300 words; illustrations may not be copied. The abstract must contain conspicuous acknowledgment of SPE copyright.
Abstract Digital Rock Physics (DRP) is commonly perceived as a range of technologies finalized at the calculation of properties of interest to geophysical, geological and reservoir engineering disciplines starting from 3D high resolution x-ray micro-CT images. Provided that verified, physically validated and controllable image acquisition and modelling workflows are available, petrophysical properties computed in this way can in theory be used in association to traditional difficult-to-obtain or often scarce core laboratory measurements to achieve higher insight of the reservoir and reduce the uncertainty in both static and dynamic models. DRP’s potential for the industry is also expressed by the possibility of achieving better understanding of recovery mechanisms by probing fluid distributions at the pore scale, as is being nowadays investigated thanks to the utilization of miniaturized flow cells in micro-CT set ups or synchrotron facilities. This could be key for optimization of EOR processes.
From the point of view of operating companies, most efforts are still deployed in the R&D Lab with deployment of the technology in operational context still at its infancy and hindered by the issue of representativity of the microscopic imaged or computed scales (or image resolution-scale trade off), by the difficulty one has to unambiguously inform pore scale models with a sufficiently limited but precise set of physico/chemical information and by lack of robust validation procedures. In this dynamic and improving context, we update on our R&D efforts to evaluate and test one particular technology for the simulation of multi-phase flow in digital rocks, the Volume-of-Fluid method embedded in Paris simulator: the objective is to verify the potential interest in the medium and long term, knowing that other simulation technologies, being simpler to apply, are more mature for utilization in today’s context. In this work Paris simulator is utilized to compute single and multi-phase flow properties on TOTAL’s supercomputers for both a sandstone outcrop sample from Scotland and two carbonate rocks from UAE. First the simulator is tested for simpler permeability computations and benchmarked against a Lattice-Boltzmann solver; then the code is used for two-phase flow and for relative permeability computations. It is concluded that the particular simulator used in this work, still under development, can be used for different rock types and is particularly efficient in HPC environment: it has therefore strong potential. We conclude describing the future steps of development that will be needed to make the simulator applicable for digital petrophysics. Introduction It can be proposed that DRP essentially and ultimately consists in increasing the knowledge of the physics that take place inside the reservoir rocks, specifically the pore-scale interactions between the oil, water and the walls of the pores that constitute the rocks. This can be achieved with a combination of techniques from experimental 3D image acquisitions of rocks in various flooded or non flooded states to more or less simplified modelling and numerical simulation tools. In the past (Caubit et al., 2009; Bondino et al., 2013) TOTAL has performed a number of evaluations about the applicability of DRP simulation techniques to the petrophysical context: it was concluded that even the most mature DRP simulation technique (pore network modeling, PNM) is in general not fully predictive. Nevertheless a number of interesting applications for DRP simulation were also proposed, which rely less on attempts for a-proiori prediction and more on the understanding of (difficult) recovery mechanisms.
In this paper, we review a different (than PNM) type of simulation technology to study its potential in view of medium/long term applicability in industrial context: the Volume-of-Fluid (VOF) method embedded in an open source software platform called Paris simulator.
After a brief review on common numerical methods, we introduce the simulator for direct simulation of single and two-phase flow in digital images as well as the methods used to compute permeability and relative permeability from the

2 SPE 172025
knowledge of local and global pressure/velocity fields; then permeabilities and drainage relative permeabilities for one outcrop sandstone and two carbonate rocks from UAE reservoirs are computed on one of TOTAL’s R&D supercomputers. We conclude with a review of the steps which will be required, in future research work, to render this simulation approach an engineering tool for petrophysicists, DRP specialists or reservoir engineers.
Review of numerical methods During the last 10 years, the pore scale modelling has widely evolved from some specific academic techniques to understand the internal displacement processes, to solutions that are currently commercialized to the Oil & Gas Industry (Blunt et al., 2013). Generally speaking, the current available numerical approaches are on one hand direct simulation, where the fluids equations are directly solved in the 3D complex geometry defined by the tomography images, and on the other pore network models (PNM) where the inner geometry of the rock is simplified to a set of pores and channels where a set of simplified equations and rules are solved or applied.
Twenty years ago, computational resources were very limited and because pore-network models (PNM) were (and still are) the least computational demanding, nowadays they are in the most advanced state of development. In these methods the void spaces of the rock are represented by a lattice of pores and throats; the cross section shape of the throats depends on the particular method that is used, in the most complex ones the shape is chosen to resemble the real pores as maximum as possible. On the other hand, flows are simplified by assuming certain flow patterns that depend on the simulated flow regimes. A demonstration of the advanced state of the art of such methods could already be appreciated in the work of Valvatne and Blunt (2004) where it was concluded that it was possible to successfully perform predictions of relative permeability and oil recovery for water wet to oil wet samples of in Berea sandstone. One of the main drawbacks of pore-network models is also one of its strongest points, because the model is quite simplified from both geometric and physical perspective, a lot of detail is lost in the whole simplification method which is translated in predictions with added uncertainty (Bondino et al., 2013). Neverteless these authors would agree with Blunt et al. (2013) that PNM remains today the most successful approach for multi-phase flow: in practical terms, and as a matter of fact, it is today the only technology to compute relative permeability for a range of wettability conditions which is very rapid, which only requires a conventional workstation/Pc and which can be used with profit by the educated petrophysicist or reservoir engineer who is not necessarily a specialist in numerical simulation and/or high performance computing.
As for the medium and long term future, it is nevertheless reasonable to assume that, with the increase in computing power and if predictions with lower uncertainty level are required, direct methods should be used; the core idea of these methods is to perform predictions with a higher level of confidence because fewer simplifications are done. But the challenges are much higher than with PNM.
Direct numerical simulation techniques for multiphase flows are reasonably new. Dispite this, many different approaches have arisen (Tryggvason et al., 2011) although the application of such methods in the field of digital rock physics has been quite more limited than with PNM. Three main lines have appeared in the literature in this field: the Smoothed particle, Lattice-Boltzmann and Eulerian methods. Smoothed particle hydrodynamics method, discussed in (Tartakovsky and Meakin, 2006), is a Lagrangian method that does not require the use of a mesh and it also does not require an explicit complex interphase tracking algorithm. At the same time, it keeps a sharp interphase between two fluids. Nevertheless, it is the most computationally expensive method. On the other hand, there are the Lattice-Boltzmann methods as seen in (Gunstensen et al., 1991) that describe the motion of fluids in terms of the movement and collision of particles. The key factor of these methods is that they do not solve the implicit pressure equation (which represents a theoretical loss on the accuracy of the results) but offer instead a gain in performance. Finally, there are the Eulerian grid-based methods which are traditionally the most used approaches to solve the Navier-Stokes equations: these methods present the advantage of being capable to handle effectively larger viscosity ratios of the two fluids and present generally a good numerical efficiency. It is important to remark that the main challenge of these methods is the representation of the surface tension and interphase tracking.
Although Lattice-Boltzmann methods are today the front runners in this domain of direct simulation (Tolke et al., 2013) and their potential and drawbacks are well documented, scope of this paper is to investigate in detail althernative methods, which could for example offer a wider range of applicability conditions (example: higher viscosity contrasts). The challenge of interface tracking Within all the previous stated methods, it is important to emphasize that there are two different approaches when solving multiphase flows: it is possible to solve the governing equations of two fluids separately and then make use of the jump conditions to couple the solutions, or to use the single-fluid approach that consists on treating both fluids as a single one with abrupt changing material properties. If we focus on the Eulerian methods within the first stated approach (governing equations for two fluids) to perform interface tracking, it will be necessary to transform the shape of the mesh as time progresses in the simulation, which is translated in a very high algorithmic complexity. That is the reason why it is much more convenient to adopt the single-fluid approach which will allow the reutilization of simple single-phase integration algorithms. Within the frame of single-fluid approximation for Eulerian methods, it is possible to define two sub-groups based on the way the interface tracking is done: front tracking, and volume tracking algorithms.

SPE 172025 3
Front tracking The principle of the front tracking methods is to advect an ensemble of particles initially located at the interphase of the two fluids (Tryggvason, et al., 2001). In the two and three dimensional cases, these particles represent a line or a surface respectively. One advantage of these methods is that the advection of the particles is quite simple to perform, however it is challenging to perform an efficient maintenance of the interphase, especially when there are connection and disconnection events since such events are not resolved naturally by the method. Volume tracking This approach is based on the idea of advecting a marker function through the entire domain; such function takes different values for each phase. The advection follows the velocity field computed from the Navier-Stokes integration. Nevertheless, this simple idea is very challenging to apply in practical terms, since from a numeric point of view it is difficult to advect a marker function without introducing diffusion and at the same time ensuring volume conservation. Here, some specific methods will be very shortly exposed.
Volume-of-Fluid (VOF) All the attempts to directly advect a discontinuous marker function, show large diffusion in the interphase and are only practical for a very limited period of time (Hirt and Nichols, 1981). The volume of fluid solves this problematic by imposing simple transport rules, such as that it is not possible to fill a cell with the colour function until the neighbour cells are completely filled. As a direct consequence, the time step used in this method must be small enough to ensure that the phase front does not traverse more than one cell each iteration. The two most challenging concepts of the method are how to reconstruct the interphase from the mapping provided by the colour function (Noh and Woodward, 1976) and its latest advection.
Level-set method The main difference between Level-set and VOF methods is that instead of using a discontinuous marker function as in VOF, a smooth one is used (Osher and Shu, 1991). The marker function has positive values in one phase and negative in the other one, thus the interphase is found when this smooth colour function takes the value of zero. Then, through an intermediate reconstruction process a standard colour function is reconstructed from the smooth marker. The main difficulty of the method is to maintain constant the transition region of the smooth marker function; this is still nowadays a topic of research.
Diffuse interphase methods In these methods, the interphase is maintained sharp by modifying the governing equations, it is also assumed to be of a finite thickness. A smooth colour function to identify the different fluids is also used, but in this case it is advected with the Cahn-Hilliard equation to limit diffusion (Jacqmin, 1999). Generally speaking, the method is similar to the level-set approach but with different assumptions. It has been shown that it is able to reproduce small-scale phenomena that methods using the sharp interphase hypothesis find it more difficult to reproduce (Jacqmin, 2000). Paris simulator As discussed above, there are multiple approaches to address two phase flow simulations, and it is not easy to evaluate which one offers better accuracy and performance since it is quite difficult to access all the knowledge required to perform this judgement. However, Eulerian methods with Volume-of-Fluid approach for interphase tracking have the potential to become, in the future, a good answer for two-phase simulations in porous media. That is why in this study, Paris simulator has been selected as the simulation tool.
Paris simulator is an open source code, mainly developed at the Université Pierre et Marie Curie (UPMC) in Paris (http://parissimulator.sourceforge.net): the algorithms are implemented in FORTRAN 95 and one of its key features is that it makes use of MPI libraries which allows it to be easily ran in high parallel environments. It is a direct numerical simulator that allows solving the Navier-Stokes equations making use of implicit and explicit numerical schemes; it also provides the option to perform the interphase tracking through the Volume-of-Fluid or by the front tracking method. The computation of surface tension is done with the continuous surface force method (Tryggvason et al., 2011) using heigth functions to compute the curvature.
Paris simulator uses the finite volume approach where the conservation principles of mass and momentum are applied to small control volumes. The grid is structured and regular, which means that all the voxels of the mesh are the same size and cubic shape. Boundary conditions It is known that one of the major challenges of fluid mechanics is the correct definition of the boundary conditions (Gennes et al., 2004). In this paper the classical non slip boundary condition Eq. 1 will be considered for the fluid in contact with the solid walls of the pores where 𝑢 is the velocity of the fluid:
4 SPE 172025
𝑢 !"## = 0 (1)
On the other hand, it gets more complicated when choosing the right boundary conditions of the faces of the rock parallel to the injecting face. Our simulations will take into account only a small rock cube that belongs to a larger imaged core; as the computational effort is very intense our aim is to try to find boundary conditions that are as close as possible to reality considering reality as the real fluid state at the boundaries of the small cube. A quite sensible approach could be to consider periodic boundary conditions bearing in mind periodicity of the rock, which means that the simulation is done in a domain which is periodic in the directions normal to the injection velocity. To have periodicity of the rock in these directions, it is necessary to consider as many rock samples as possible mirror transformations, which makes four rock samples. However, as commented before, performing a simulation over four rock samples clashes with the main constrain which is the computational capacity; that is why in this study, periodic boundary conditions will be considered but without rock periodicity.
Finally, at the inlet and outlet faces, constant velocity field will be considered, allowing us to efficiently control the capillary number of the simulations (which is defined as the product between injection velocity and viscosity divided by the surface tension): 𝑣 0, 𝑦, 𝑧 = 𝑣 𝐿, 𝑦, 𝑧 = 𝑈 (2)
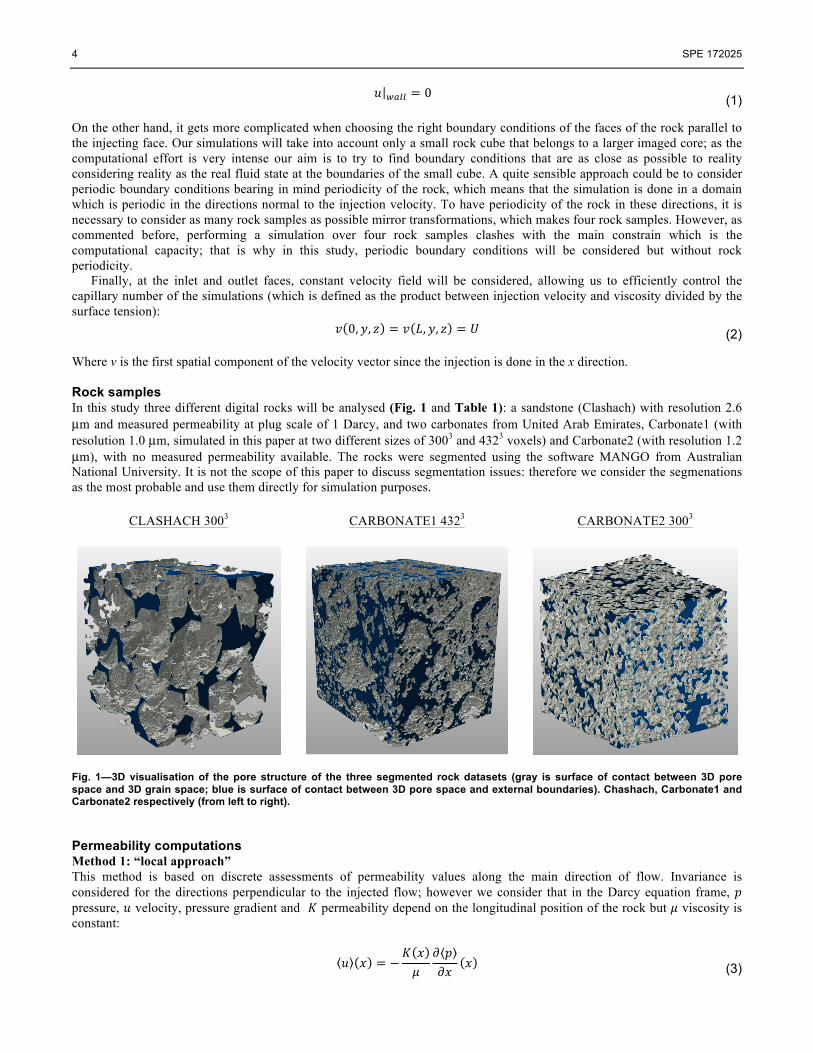
Where v is the first spatial component of the velocity vector since the injection is done in the x direction. Rock samples In this study three different digital rocks will be analysed (Fig. 1 and Table 1): a sandstone (Clashach) with resolution 2.6 µm and measured permeability at plug scale of 1 Darcy, and two carbonates from United Arab Emirates, Carbonate1 (with resolution 1.0 µm, simulated in this paper at two different sizes of 3003 and 4323 voxels) and Carbonate2 (with resolution 1.2 µm), with no measured permeability available. The rocks were segmented using the software MANGO from Australian National University. It is not the scope of this paper to discuss segmentation issues: therefore we consider the segmenations as the most probable and use them directly for simulation purposes.
CLASHACH 3003 CARBONATE1 4323 CARBONATE2 3003
Fig. 1—3D visualisation of the pore structure of the three segmented rock datasets (gray is surface of contact between 3D pore space and 3D grain space; blue is surface of contact between 3D pore space and external boundaries). Chashach, Carbonate1 and Carbonate2 respectively (from left to right). Permeability computations Method 1: “local approach” This method is based on discrete assessments of permeability values along the main direction of flow. Invariance is considered for the directions perpendicular to the injected flow; however we consider that in the Darcy equation frame, 𝑝 pressure, 𝑢 velocity, pressure gradient and 𝐾 permeability depend on the longitudinal position of the rock but 𝜇 viscosity is constant:
𝑢 𝑥 = −𝐾 𝑥𝜇
𝜕 𝑝𝜕𝑥
𝑥 (3)

SPE 172025 5
Where the symbol ∅ stands for the volumetric average of a physical variable. If Eq. 3 is rewritten in a discretised form we obtain:
𝑢 ! = −𝐾!𝜇
𝑝 !!! ! − 𝑝 !!! !
∆𝑥! (4)
where the index 𝑖 stands for the position of the slice in the injection direction. The permeability remains defined by calculating the overall pressure drop as:
∆𝑃 = 𝜕 𝑃 =𝜇𝑞𝐴
𝜕𝑥𝐾
!
!
!!"
!!"# (5)
Where 𝑃!" and 𝑃!"# are the average pressure in the inlet and outlet of the rock, 𝑞 is the flow rate going through the rock and 𝐴 is the surface of the cros section perpendicular to the injection direction. Then, substituting Eq. 5 for the overall pressure drop in the rock in the global Darcy equation, we find an equivalent value of permeability in both integral and discrete form:
𝐾!"# =1𝐾
!!
=1∆𝑥!
∆𝑥!𝐾!
!!
(6)
Method 2: “global approach” In laboratory experiments the permeability is evaluated by taking a cylindrical sample and injecting a fluid through the symmetry axis. In such experiments the pressure gradient within the symmetry axis is assumed to be the driving mechanism for fluid transport and the gradients in the other directions are neglected. A similar approach will be taken numerically as it is the most direct way to compute the permeability. The main two assumptions are to consider the problem invariant in the directions perpendicular to the flow injection and assume that the inlet and outlet pressure of the rock system are homogeneous. Then the permeability is computed by simply applying the discrete form of the Darcy equation: 𝐾 = −
𝜇𝑞𝐿𝐴 ∙ 𝑃!" − 𝑃!"#
(7)
Where L is the length of the rock.
Results for permeability In this section, absolute permeability values have been computed from single phase flow simulations. The absolute permeability values have been obtained using the two approaches discussed above (“local”, M1, and “global”, M2) and also using a Lattice Boltzmann solver (from the Morphy package of Australian National University). Furthermore, a convergence study of the absolute permeability is done by carrying out the same simulation in three samples of the same rock but with different mesh resolutions.
It is important to start our discussion about the results of single phase simulations by highlighting the physical differences between the sandstone sample (Clashach) and the carbonates (Carbonate 1-2). In Fig. 2 it is easy to appreciate from both the segmented images and the velocity field distribution images that there are clear differences between these rocks at the selected working scale. Because carbonates are rocks with a wide range of scales, it is possible to see that in our sample there are a large number of pores of different sizes. On the other hand, for the sandstone the number of pores and channels is much less but their dimensions are quite constant. Of course, in both cases the overall simulated dimension is inferior to 1mm3 and it cannot be assumed that such small domains are physically representative or equivalent to plug/core dimensions.
Table 1 provides information on the validity of the computed output for both Paris simulator (PS, methods 1 and 2) and the Lattice-Boltzmann solver (LBM): the results are relatively similar (relative error around 10%). It is also seen that the lower the permeability of the rock, the larger is the relative difference of the results between Paris simulator and the Lattice-Boltzmann solver. The results of the global and local method for absolute permeability are quite similar for all cases with the global method always predicting slightly higher permeability values. Nevertheless, it is very difficult to determine which of both methods is more accurate since no experimental iso-scale data are available for the selected rock samples and the solution convergence criteria for the Lattice Boltzmann solver were not known. When considering the difference of computational performance between Lattice Boltzmann and Paris simulator there is a performance factor of 10 in favour of the first.
With the absolute permeability computations performed with the local method, it is possible to extract valuable information such as the distributed permeability values. If such information is displayed with the distributed porosity plot, it is possible to determine if there is any correlation between the two magnitudes. As seen in Fig. 3 there only seems to be a clear correlation between permeability and porosity in the case of Carbonate2 (Fig 3d) where the permeability and porosity

6 SPE 172025
TABLE 1—RESULTS OF PERMEABILITY BENCHMARK
Rock Name Size (Mpx) Nx*Ny*Nz
PS M1 (mD)
PS M2 (mD)
LBM (mD)
Relative Error M1
Relative Error M2
Computational time single core
PS (h) LBM (h)
CLASHACH 27 300x300x300 984 1025 929 0.059 0.103 91.5 8.9
CARBONATE1 27 300x300x300 382 400 397 0.038 0.007 94.0 15.6
80.6 432x432x432 376 394 348 0.080 0.132 255.5 46.3
CARBONATE2 27 300x300x300 47 49 27 0.739 0.813 91.5 10.8
(a) (b) (c) (d)
Fig. 2—Original segmented image for Clashach sandstone (a) and corresponding visualization of the 3D velocity field (b); Original segmented image for Carbonate2 (a) and corresponding visualization of the 3D velocity field (d).
(b) (b) (c) (d)
Fig. 3—Porosity/permeability as a function of the longitudinal dimension parallel to the main flow for 3003 Clashach (a), 3003 Carbonate1 (b), 4323 Carbonate1 (c) and 3003 Carbonate2 (d). The horizontal dotted lines make the reference to the arithmetic average of porosity and to the harmonic average of permeability. The dots represent each a local porosity/permeability value.
(a) (b) (c)
Fig. 4—Illustration of the mesh refinement process. Refinement level 1 (i.e. no refinement from original resolution) in (a); refinement level of 2 in (b); results of convergence study in (c). curves follow similar shapes. Such plots can be very useful to determine if the size of the selected samples is large enough to provide representative data for the whole rock: as it is seen, in none of the plots the porosity and permeability curves oscillate
SPE 172025 7
around their mean values with a defined variance. This might be taken as an indication that the selected rock samples are not large enough for extracting representative data, even for single-phase flow. In addition to comparing the absolute permeability solutions with the results of a Lattice-Boltzmann solver, another alternative way to investigate the validity of the solutions is to study their convergence. A convergence study is based on the idea that when the mesh of a given problem is refined, its solution should converge to a single value. A simple refinement algorithm was developed to refine the mesh without changing the geometry of the rock. The values of absolute permeability were computed for three different refinement values of Carbonate1 3003. It is seen in Fig. 4 that there is a tendency towards a stabilization of the K value since the error between refinement level 2 and 3 is smaller than the error between 1 and 2. Nevertheless, the main drawback is that the solution changes by 25%, which could indicate that even if the absolute permeability results for Paris simulator and Lattice Boltzmann are quite similar, the “real” permeability value might differ by 25%. In a well posed convergence study, when the mesh is refined, more information about the geometry of boundary conditions is found: however, this is not the case for the current convergence study because no more detailed information about the geometry of the rock is available, and therefore the geometry is the same for different refinement values. This fact could explain why the value of absolute permeability shows large variations when the mesh is refined: it is possible that if the geometry was refined as well, such variations would decrease. Relative permeability computations In the case of two phases, an indication function 𝜒! is used to identify each phase. This function has unitary value when the control volumes are filled with the phase of interest and zero value otherwise. Then the relative Darcy velocity and pressure are redefined the following way considering that 𝑉 is the representative elementary volume that is being considered: 𝑢! =
1𝑉
𝜒! 𝑥, 𝑡 ∙ 𝑢 𝑥, 𝑡 𝑑𝑥!
! (8)
𝑝! =1𝑉!
𝜒! 𝑥, 𝑡 ∙ 𝑝 𝑥, 𝑡 𝑑𝑥!
!𝑤ℎ𝑒𝑟𝑒 𝑉! = 𝜒! 𝑥, 𝑡
!𝑑𝑥! (9)
It is important to remark that the velocity and pressure fields are volume averaged in different ways: the velocity is averaged considering the whole representative elementary volume and the pressure is averaged considering the volume of the phase of interest. When working with a 2-phase flow, the relative Darcy velocity is assumed to depend on the cross permeability and the forces applied to each face:
𝑢! = 𝜆!"𝑓!
!
!!!
(10)
Where f! are the forces acting in phase j, and λ!" is the interaction tensor, which in this paper will be considered as identity meaning that the velocity of one phase only depends on the forces applied to the same phase, in the specific 2-phase approach i=1, 2 and Darcy law reads:
𝑢 ! 𝑥 = −𝑘!,! 𝑥 ∙ 𝐾 𝑥
𝜇𝜕 𝑝 !
𝜕𝑥𝑥 (11)
𝑘!,! are the relative permeability for each phase, these functions being dependent on the saturation of their phase. Another important difference in the 2-phase flow approach is that, because the presence of an interface, an additional linking equation is generated with the capillary force 𝑝!: 𝑝! 𝑆! = 𝑝! − 𝑝! (12)
Nevertheless, in the present approach the gradient of capillary forces is assumed to be compressed in the pressure gradient term and the viscous and capillary effects are lumped into the relative permeability as carefully discussed in (Cense and Breg, 2009).
In this study we will focus on the computation of dynamic relative permeability where the interface is not in equilibrium, (Zhang et al., 2014). The proposed methodology will be to evaluate a drainage transient simulation: then following analogous concepts introduced in the computation of single flow permeability, to compute the relative permeability. Even in this context we distinguish a local and a global approach.
Method 1: “local approach” The method that has been selected for the relative permeability estimation is similar to the one developed by Silin and Patzek, (2009) although in our case we compute the pressure and velocity field for the whole domain and not on a slice at the time

8 SPE 172025
basis, which should translate in a more precise estimation. Again, as in the single phase case, the rock is splitted in several slices perpendicular to the injection flow and Darcy law is applied where each slice is considered thin enough to consider that the flow rate of both faces (for each phase) is the same within the inlet and outlet of each slice. Another important assumption is to consider that the pressure in the directions perpendicular to the injected flow remains constant for each phase, i.e. it is equivalent to the slice average pressure for each phase. The interest is here that, with this approach, it is possible to obtain the relative permeability as a function of longitudinal position but also saturation, and because the thickness of each slice is small compared with the total length of the rock, relative permeability for much lower saturation values can be derived than if using Method 2 below. Finally, applying the harmonic average for the local Kr values it is possible to compute an equivalent relative permeability function. Method 2: “global approach” In this approach the relative permeability will be computed by direct application of Eq. 11 over the totality of the rock. In addition, the volumetric flow rate or Darcy velocity is considered as an overall volumetric average. One of the main drawbacks of this approach is that no relative permeability values can be computed until the injected phase reaches the outlet of the rock (breakthrough) in order to consider its pressure drop.
Results for relative permeability In this section, results of oil drainage simulations will be shown. The simulations are for oil and water of the same density, a viscosity ratio of 0.85 (oil less viscous) and a capillary number (Ca) ranging between 10-2 and 10-4. A simulation with capillary number 10-5 was also performed successfully, although in a much smaller sample (Carbonate2, 1203) but is not reported in this paper. A visualization for the oil phase in three rocks at Ca=10-4 is provided in Fig. 5.
Fig. 5—Visualisation of the oil drainage at Ca=10-4 for Chashach, Carbonate1 and Carbonate2 respectively (from left to right).
(a) (b) Fig. 6—Evolution of saturation of oil during drainage in Clashach for different capillary numbers (a); differences in fingering morphology at Ca=10-2 (blue and shaded blue) and Ca=10-4 (green).

SPE 172025 9
Fig. 7—Drainage relative permeability curves for the Clashach model at Ca=10-2 (top), Ca=10-3 (center), Ca=10-4 (bottom). Semi-log plot on the right.
During drainage, the strong surface tension effects characteristic of low capillary numbers (10-4) make the oil fingers only
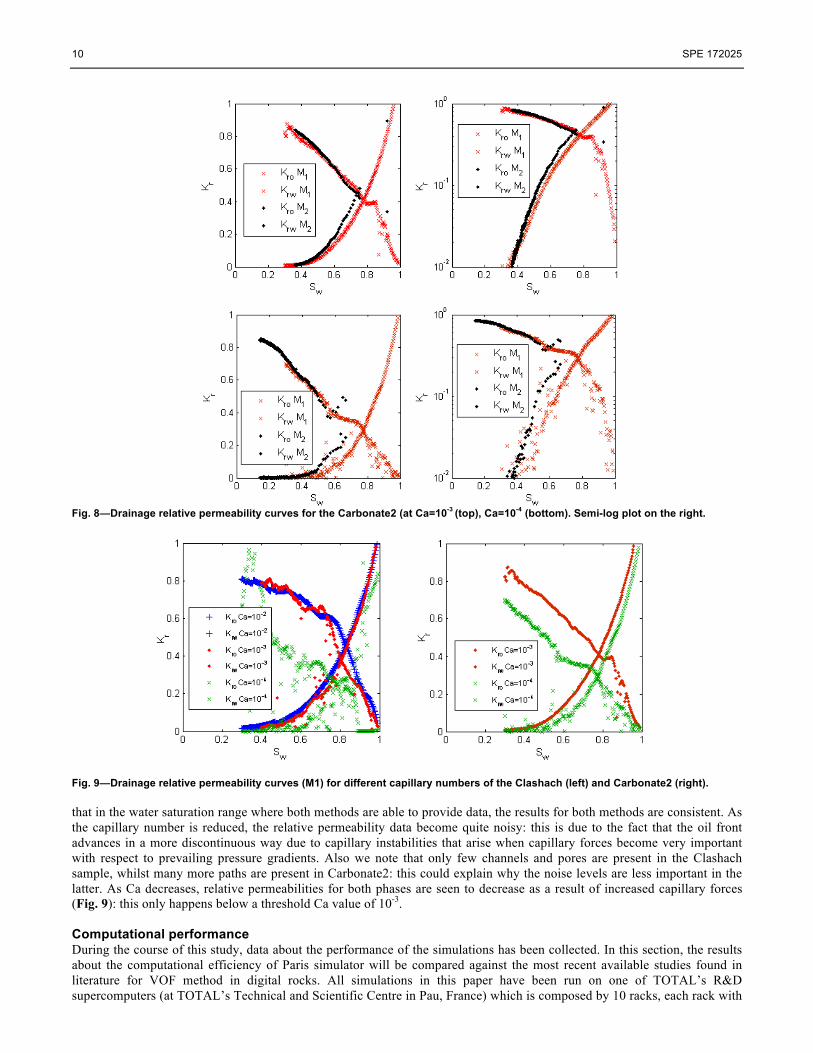
selects or go through the largest pores. Another direct consequence as seen in Fig. 6a is that in the range between 0 and 0.3 injected oil pore volumes, at high capillary number the injected oil reaches the outlet faster than for low capillary regimes. This can be easily understood also by looking at Fig. 6b which shows a graphical superposition of the oil fingers at two different capillary numbers. It is seen that the oil tends to fill only the centre of the pores at large capillary number (blue and shaded blue) while at lower capillary numbers, the oil fills practically the totality of the pore (green). By applying basic mass conservation principles it is possible to deduce that the fingers at high capillary number will reach the outlet first. Consequently, for the range of oil injected pore volumes (in a saturation range close to breakthrough) higher saturation levels are reached for low capillary numbers since the breakthrough is delayed with respect to higher capillary regimes. Fig. 7 and 8 show the results for drainage relative permeabilities for Clashach and Carbonate2 at different capillary numbers. Relative permeability curves have been generated making use of 900 cores (for a given simulation) and considering both the local (M1) and global (M2) relative permeability methods. The results for Carbonate1 show similar overall behavior and are not reported.
It is noted that the global method (M2) covers a shorter range of saturations since it is strictly necessary to wait for the injected oil to reach the outlet before being able to calculate any value of oil relative permeability. Another remarkable fact is
10 SPE 172025
Fig. 8—Drainage relative permeability curves for the Carbonate2 (at Ca=10-3 (top), Ca=10-4 (bottom). Semi-log plot on the right.
Fig. 9—Drainage relative permeability curves (M1) for different capillary numbers of the Clashach (left) and Carbonate2 (right). that in the water saturation range where both methods are able to provide data, the results for both methods are consistent. As the capillary number is reduced, the relative permeability data become quite noisy: this is due to the fact that the oil front advances in a more discontinuous way due to capillary instabilities that arise when capillary forces become very important with respect to prevailing pressure gradients. Also we note that only few channels and pores are present in the Clashach sample, whilst many more paths are present in Carbonate2: this could explain why the noise levels are less important in the latter. As Ca decreases, relative permeabilities for both phases are seen to decrease as a result of increased capillary forces (Fig. 9): this only happens below a threshold Ca value of 10-3. Computational performance During the course of this study, data about the performance of the simulations has been collected. In this section, the results about the computational efficiency of Paris simulator will be compared against the most recent available studies found in literature for VOF method in digital rocks. All simulations in this paper have been run on one of TOTAL’s R&D supercomputers (at TOTAL’s Technical and Scientific Centre in Pau, France) which is composed by 10 racks, each rack with

SPE 172025 11
64 nodes and each node with 12 cores Intel Xeon with a clock speed of 2.8GHz; the tests presented here range from 12 to 3072 cores and from a domain size between 1.7 to 80.6 million cells.
A program is said to be scalable when its performance increases proportionally to the hardware resources that are added to it. The measure that will be used to evaluate the performance of Paris simulator will be the number of cell updates per core and second, noting that a cell update is the state transition of one voxel from a given time step to the following one.
𝑐𝑒𝑙𝑙 𝑢𝑝𝑑𝑎𝑡𝑒𝑠 𝑝𝑒𝑟 𝑐𝑜𝑟𝑒 𝑎𝑛𝑑 𝑠𝑒𝑐𝑜𝑛𝑑 = 𝑁! ∙ 𝑁! ∙ 𝑁! ∙ 𝑁!"𝑇!"# ∙ 𝑁!"#$%
(13)
Three different cases have been addressed with Paris simulator, all of them regarding a 2-phase simulation with a capillary number of 10-4. As it can be appreciated in Fig. 10 the results are quite interesting since Paris simulator shows higher computational speed and better scalability than Gerris (Lagrée et al., 2014) or OpenFOAM (Raeini, 2013). For the latter cited work and as reported by the author, we derived the cell updates per core per second noting that for simulations of drainage in rocks of 1.6 million grid-blocks, generally one simulation required the integration of 1 million time steps (making use of an unstructured mesh): since one simulation step took between one or two minutes in a single 3GHz processor, then between 13 – 26K cell updates per core and second were performed.
Some general conclusions can be drawn: in the selected core range, the simulation efficiency only decreases by 40% while in the case of Gerris simulator it decreases by 90%. Paris simulator seems to have similar scalability than OpenFOAM in the frame of small domains (1.6M cells) and between 12 to 100 cores: but in that range it is shown that Paris simulator is about 20 and 40 times faster than OpenFOAM. We think that this result is due to the fact that OpenFOAM simulations were making use of unstructured meshes where memory access can be slower. In terms of speed compared with Gerris, Paris simulator is between 5 and 50 times faster: this is due to a less efficient memory management in Gerris and therefore its memory access is also slow.
Fig. 10—Scalability plot for Paris simulator for three different simulations ranging from 12 to 3072 cores and from 1.7M to 80.6M cells. In the same plot, two scalability regions are added, one for Gerris, one for OpenFOAM.
Future work The two main directions for future research are to achieve the ultimate objective, which is the computation of the relative permeability curves from simulations with Ca=10-6-10-7 (reservoir engineering domain) and at the same time on a scale bigger than what can be done today. When decreasing the capillary number in the simulations the most restricting factor is the used time step: two important measures that could be taken to increase the time step could be to transform Paris simulator into a Stokes solver and to implement implicit surface tension.
Important work that remains to be done is to test different boundary conditions to explore their effects on the relative permeability results.
In a longer term, it would be very interesting to implement contact angle functionality to study the effects of the contact angle over the relative permeability curves.
Nowadays, Paris simulator allocates computational resources to those regions of the domain which are filled with rock: if we consider that the porosity of our rocks is between 10% and 30%, it means that about a 70-90% of the dedicated resources were not used to solve the fluid equations. A large performance jump could therefore potentially be achieved.
12 SPE 172025
Conclusions In this work the Paris simulator platform with Volume-Of-Fluid method was adapted for simulation in 3D rock images from x-ray micro-CT tomography and was implemented on one of TOTAL’s supercomputers. It was tested with success for single and two phase flow simulations, for one outcrop sandstone and two carbonate rocks from UAE.
A successful preliminary benchmark was performed showing consistency for the absolute permeability results which were compared with a reference Lattice-Boltzmann solver.
Simulations at different capillary numbers were performed and relative permeabilities calculated: it is concluded that the results are promising and further research will be carried out to extend the applicability of this approach and validate its potential in view of a future application in industrial context.
Finally, it is also very important to emphasize the fact that Paris simulator has, according to the data available to the authors, a superior computational performance than other VOF codes that have been used for similar applications.
Acknowledgements We wish to thank TOTAL for permission to publish this study. We also wish to express our sincere gratitude to the TOTAL’s High Performance Computing Support Team for the invaluable assistance in the course of this study. References Blunt, M.J. et al. 2013. Pore-scale imaging and modelling. Adv Water Resources Vol 51: 197-216. 10.1016/j.advwatres.2012.03.003.
Bondino, I., Hamon, G., Kallel, W. and Kachuma, D. 2013. Relative Permeabilities from Simulation in 3D Rock Models and Equivalent Pore Networks: Critical Review and Way Forward. Petrophysics J. Vol 54 (06): 538-546.
Caubit, C., Hamon, G., Sheppard, A. P. and Øren, P. E. 2009. Evaluation Of The Reliability Of Prediction Of Petrophysical Data Through Imagery And Pore Network Modelling. Petrophysics J. Vol 50 (04): 322-334.
Cense, A.W. and Breg, S. 2009. The Viscous-Capillary Paradox in 2-Phase Flow in Porous Media. International Symposium of the Society of Core Analysts, Noordwijk, Netherlands, 27-30 September. SCA2009-13.
Gennes, P.-G., Françoise B.-W. and Quéré, D. 2004. Capillarity and Wetting Phenomena, first edition. New York, USA: Springer.
Gunstensen, A.K., Rothman, D.H., Zaleski, S. and Zanetti, G. 1991. Lattice Boltzmann model of immiscible fluids. Phisical Review A Vol 43 (08): 4320-4327.
Hirt, C.W. and Nichols, B.D. 1981. Volume-of-Fluid (VOF) method for the dynaics of free boundaries. Journal of computational physics Vol 39(01): 201-226. 10.1016/0021-9991(81)90145-5.
Jacqmin, D. 1999. Calculation of two-phase Navier–Stokes flows using phase-field modeling. Journal of computational Physics Vol 155 (01): 96-127. 10.1006/jcph.1999.6332.
Jacqmin, D. 2000. Contact-line dynamics of a diffuse fluid interface. Journal of Fluid Mechanics Vol 402: 57–88.
Lagrée, B., Zaleski, S. and Bondino, I. 2014. Numerical Simulations of Invasion of 3D Porous Media. 14th European Conference on the Mathematics of Oil Recovery (ECMOR), Catania, Italy, 8-11 September. We B24. Noh, W.F. and Woodward, P. 1976. SLIC (simple line interphase calculation). Lecture Notes in Physics, Vol 59: 330-340. 10.1007/3-540-08004-X_336.
Osher, S. and Shu. C-W. High-order essentially nonsocillatory schemes for Hamilton–Jacobi equations. SIAM Journal on Numerical Analysis Vol 28 (04): 907-922. 10.1137/0728049.
Qaseminejad Raeini, Ali. 2013. Modelling multiphase flow through micro-CT images of the pore space. PhD thesis. Department of Earth Science and Engineering of Imperial College, London, United Kingdom. Silin, D.B. and Patzek, T.W. 2009. Predicting Relative-Permeability Curves Directly From Rock Images. SPE Annual Technical Conference and Exhibition, New Orleans, Louisiana, USA, 4-7 October. 10.2118/124974-MS.

SPE 172025 13
Tartakovsky, A.M. and Meakin, P. 2006. Pore-scale modeling of immiscible and miscible fluid flows using smoothed particle hydrodynamics. Advances in Water Resources Vol 29: 1464-1478.
Tölke, J., Prisco, G.D. and Mu, J. 2013. A lattice Boltzmann method for immiscible two-phase Stokes flow with a local collision operator. Computers and Mathematics with Applications Vol 65: 864-881.
Tryggvason, G. et al. 2001. A Front-Tracking Method for the Computations of Multiphase Flow. Journal of Computational Physics 169 (2): 708-759. 10.1006/jcph.2001.6726.
Tryggvason, G., Scardovelli, R. and Zaleski, S. 2011. Direct Numerical Simulations of Gas–Liquid Multiphase Flows, first edition. Cambridge, United Kingdom: University Press.
Valvatne, P. H. and Blunt, M.J. 2004. Predictive pore-scale modeling of two-phase flow in mixed wet media. Water Resources Research Vol 40: W07406. 10.1029/2003WR002627.
Zhang, H., He, S., Jiao, C., Guohua, L., Mo, S. and Guo, X. 2014. Determination of dynamic relative permeability in ultra-low permeability sandstones via X-ray CT technique. Journal of Petroleum Exploration and Production Technology, 20 January: 1-13. 10.1007/s13202-014-0101-6.