spe 158655 design, qualification, and installation of ... · spe 158655 design, qualification, and...
TRANSCRIPT

SPE 158655
Design Qualification and Installation of Openhole Gravel Packs Mari B Field Offshore Israel John Healy SPE Jack Sanford SPE and Donald Reeves SPE Noble Energy Kerby Dufrene SPE (formerly with Schlumberger) Mark Luyster SPE Matt Offenbacher SPE and Eze Ezeigbo SPE M-I SWACO
Copyright 2012 Society of Petroleum Engineers This paper was prepared for presentation at the SPE Annual Technical Conference and Exhibition held in San Antonio Texas USA 8-10 October 2012 This paper was selected for presentation by an SPE program committee following review of information contained in an abstract submitted by the author(s) Contents of the paper have not been reviewed by the Society of Petroleum Engineers and are subject to correction by the author(s) The material does not necessarily reflect any position of the Society of Petroleum Engineers its officers or members Electronic reproduction distribution or storage of any part of this paper without the written consent of the Society of Petroleum Engineers is prohibited Permission to reproduce in print is restricted to an abstract of not more than 300 words illustrations may not be copied The abstract must contain conspicuous acknowledgment of SPE copyright
Abstract A case history from Offshore Israel is presented that describes the successful delivery of two ultra high-rate gas wells (gt200 MMscfD) completed in a depleted gas reservoir with 9⅝-in production tubing and an openhole gravel pack (OHGP) Maximizing gas off-take rates from a volumetric drive gas reservoir that possesses high flow capacity (kh) requires large internal diameter (ID) tubing coupled with efficient sand face completions When sand control is required the OHGP offers the most efficient as well as the most reliable long-term track record of performance A global study of wells completed with 9⅝-in production tubing (ldquobig borerdquo) determined that this design concept was feasible and deliverable in a short time frame while still maintaining engineering rigor The paper will highlight key accomplishments within various phases of a completion delivery process with particular emphasis on the sand control design testing and execution The completions were installed with minimal issues (NPT asymp 9) and have produced without incident The two wells Mari-B 9 and 10 achieved a peak gas rate of 223 and 246 MMscfD respectively
Introduction Operated by Noble Energy the Mari-B field was discovered by the Yam Tethys co-venture group (Noble Energy Mediterranean Limited Delek Drilling LP Delek Investments and Properties Ltd and Avner Oil Exploration LP) in 2000 in 796 feet (243 meters) of water at a total depth of 5905 feet (1800 meters) Mari-B is part of a group of fields (Figure 1) in the offshore waters of Israel in the Pliocene stratigraphic-structural play part of the Pleshet Basin Original gas-in-place estimates range from 12 to 13 trillion cubic feet (Tcf) In 2004 the field began producing at gas rates in the 100-150 million standard cubic feetday (MMscfD) range from a production platform with 600 MMscfD of capacity
Figure 1 - Location Map
The gas is sold to various customers with the Israel Electric Corporation consuming the majority for power generation Since 2004 as more electrical generation stations were converted to dual fuel and many smaller customers converted to
2 SPE 158655
natural gas the peak demand had risen to over 500 MMscfD by 2009 As Israel began to see the benefits of burning natural gas the market expanded Because the Mari-B field was depleting quickly with higher demand it was apparent the existing wells would not be able to meet the peak gas demand by the summer of 2010 Therefore two new big bore wells were planned and executed in 2010
By 2009 there were seven wells drilled in the structure (Figure 2) The exploration well Mari-B 1 was drilled to a depth of 2070 m and encountered 171 m of pay section before reaching the gaswater contact (the only well on the structure to do this) This well was not kept as a producer and was ldquotwinnedrdquo by the Mari-B 7 production well The Mari-B 2 was an appraisal well drilled into the eastern lobe of the structure and was kept as a subsea tieback to the Mari-B Platform This well is now shut-in due to mechanical issues Mari-B 3 well was drilled as a straight hole close to the apex of the structure The Mari-B 4 5 and 6 wells were all deviated wells drilled from the platform
Figure 2 ndash Well Location Map
In order to meet the gas delivery rates and schedule the following objectives were established by the planning team
bull Efficient sandface completion to promote long-term production bull Maximize gas rates bull Control and minimize sand production bull Nil to minimum NPT bull No incident rates
Subsequently these objectives were used to develop criteria for the drilling and completion phases
Drilling and Completion Overview The drilling and completion phases required discrete and specific criteria The final completion installation was predicated upon delivering production rates greater than 200 MMscfD for up to 2 years (followed by ge20 years of possible injection service) The following (Table 1) summarizes the objectives as set by the engineering team
Table 1 ndash Drilling amp Completion Objectives for Mari-B Gas Wells
Drilling Objectives bull Nil to minimal fluid loss in a depleted reservoir (ie 2-3 lbgal less than initial) bull Produce a stable wellbore in order to successfully deploy gravel pack equipment and effect a 100 gravel pack bull Ability to weight-up drilling system without compromising filtercake quality bull Drill gauge hole and ability to underream to 12frac14 in bull Use of an aqueous-based system to minimize environmental risks and meet local regulations
Completion Objectives bull Minimal skin attributed to residual filtercake bull Mitigate risk of plugging gravel and sand control screen bull Eliminate need for a breaker treatment post-gravel pack bull Eliminate use of an acid-based breaker system bull Use of a RDF that minimizes formation damage attributed from inherent solids viscosifiers inhibitors etc
SPE 158655 3
The key parameters that were considered for the completion design are listed in Table 2
Table 2 ndash Completion Design Parameters Parameter Units Min mL Max
Water Depth ft 800 Interval Depth ft 6085 Deviation at Sandface degree lt20 Gross Formation Thickness ft 30 145 145 True Vertical Thickness ft 30 145 145 Net-to-Gross Ratio gt90 BHP initial psi 3400 BHP current psi 2270 BHP abandonment psi 1200 SITP current psi 1960 BHT degf 150 Condensate bblMMscf 0017 Produced Water bblMMscf 0 Water of Condensation bblMMscf 02 Gas Gravity 0557 CO2 mol 0095 H2S mol 00 N2 mol 01
Reservoir Overview Reservoir and Seal The reservoir formation is interpreted as being Yafo sandstone deposited in moderate water depths The overlying seal is predominantly claystone and shale and the reservoir is immediately overlain by intercalated sands and shales The top of the reservoir is faulted in places and there are signs of leakage
Stratigraphy from Logs and Cores The Mari-B 3 was sidetracked and five conventional cores were taken Routine (Table 3) and special core analyses were performed in order to significantly improve the understanding of the reservoir and its properties conduct detailed engineering studies and improve future completion designs An illustration of the different reservoir facies and the productive interval is illustrated in Figure 3
Table 3 - Summary of Routine Core Analysis
Reservoir Property Value Range Average Permeability (mD) 15 ndash 18000 3600 Porosity () 13 ndash 37 29 Grain Density (gmL) 258 ndash 266 264 Water Saturation () 11 ndash 109 52 Oil Saturation () 04 ndash 85 3 Total Saturation () 12 ndash 120 55
Formation Strength and Sand Production Risk A core study concluded that ldquoframework sand grains are angular to subangular in shape and loosely consolidated Grains have a relatively loose open packing arrangement indicative of minimal burial compaction Grains have both floating and point-to-point contact in thin section The low degree of compaction and minimal cementation resulted in poor formation consolidation and mechanical strength thus rendering the zone susceptible to mechanical failure during completion and production Sand control will be necessary in this zonerdquo In addition to these conclusions several other contributing factors supported sand control of the new wells including the need for ultra high rate gas and high reliability risk of sanding with depletion in an over-pressured formation erosion risks for high rate gas production with sand and the risk of sanding with water production
4 SPE 158655
Figure 3 - Yafo Formation Openhole Log and Core Photos
Lower Completion Concept Select Of the various sand control options available (ie open-hole standalone screens expandable sand screens and frac packs) the only option that was seriously entertained was the openhole gravel pack (OHGP) A global review (Cannan et al 1993 McKenna et al 1993 Teng et al 1998 Dolan et al 2001 Benesch et al 2004 Hartmann et al 2004 Bourgeois et al 2006 Healy et al 2007 Clancey et al 2007 Benesch et al 2007 Ledlow et al 2008 Gunningham et al 2008 Healy et al 2008) was made of ultra high-rate gas wells which found the predominant sand control method employed to be the OHGP The OHGP offers the most efficient and most reliable sand control method with a proven track record This selection was also consistent with the completion type for the Mari-B 7 which was the last well completed and the best performing well on the platform (+170 MMscfD)
Fluid Design Qualification amp Testing
RDF Design A laboratory phase was initiated to design and optimize a reservoir drill-in fluid (RDF) solids-free RDF (SF-RDF) and breaker system using the aforementioned drilling and completion objectives (Table 1) as guidelines Thus specific objectives were established for the design and optimization for this pre-planning phase The RDF system was designed to meet the following
bull Demonstrate relatively good fluid loss with respect to the unconsolidated 36 Darcy (average) Yafo Sand bull Provide andor demonstrate inhibition of potential reactive shale minerals using a compatible inhibitor bull Rheological properties for drillingunder-reaming that effectively removes solids and deposits a homogeneous
filtercake bull Use of environmentally acceptable components
In addition the selected RDF system and subsequent filtercake was designed to achieve the following completion targets bull Use of a system for RIH with sand control screens that minimizes risk of plugging bull Filtercake degradable by a non-acid component(s) to reduce skin and plugging of gravelsand control screen bull Ability to use the above component(s) in the gravel pack carrier fluid bull Concurrent with the use of non-acid component(s) provide a delay of not less than four hours to allow POOH
with no NPT and nil losses It should be noted that at the time the Mari-B 7 was drilled the reservoir pressure had been depleted to 2980 psi as
compared to the initial reservoir pressure of 3400 psi However at the time this laboratory phase was initiated the reservoir pressure was depleted to approximately 2270 psi (69 lbgal equivalent reservoir) Consequently the water-based RDF was
GR (gAPI)00 1000
CALI (in)60 160
ROP (mh)
1000 00
TVD MD ILD (ohmm)02 2000
TGAST (m3m3)
00 100
NPHI_SAN (m3m3)
06 00 DENPOR (m3m3)
06 00 DT (usft)
2000 500
SW (m3m3)00 10
Cores
CORE 5 990
CORE 4 160 CORE 3 820 CORE 2 980
CORE 1 980
MW
124
ppg
11 p
pg
9-58 Casing 19048m
Perfs BASE 179096m M
Perfs TOP 176036m M
op
op
se
1950
1900
1850
1800
1750
1700
1650
1950
1900
1850
1800
1750
1700
1650
MARI-B 3 ST-1
Interbedded Claystone Siltstone
EVAPORITESECTION
PAY ZONE ndash Massive Sandstone
PAY ZONE
EVAPORITESECTION
SPE 158655 5
designed for 90 lbgal that would provide sufficient shale inhibition through the brine phase and contain sufficient bridging material to minimize losses filtrate and spurt during the drilling phase
To address and reduce the environmental risk a water-based RDF was required therefore non-aqueous systems were never considered for use A potassium chloride (KCl) brine was considered as the base brine for the RDF and for inhibition of clay mineral phases within the Yafo Sand While no shale material (ie whole core) was available to assess previous field experience showed that a 7 wt KCl demonstrated effective inhibition of relatively reactive shale rock (ie predominantly smectitic) As such it was decided to use a 7 KCl as the base fluid Other components included in the test matrix were
bull hydroxypropylated starch bull polyanionic low-molecular-weight cellulose bull organophilic components bull xanthan bull internal breaker bull sized calcium carbonate
A clarified xanthan was selected to provide viscosity as well as hole cleaning and to promote a pseudoplastic system Sized calcium carbonate was used primarily for effective bridgingfluid loss as opposed to weighting the RDF system as the base brine could readily be adjusted for any unanticipated weight-up requirement
In an attempt to reduce the logistics of mobilizing products a polyanionic cellulose was compared to the hydroxypropylated starch and organophilic starch as well in an attempt to assess effective fluid loss and the ability to forego the use of acid
The test matrix also included assessments for relative rheology fluid loss and the ability to simulate production without the use of a breaker and externalinternal breakers to degrade and dissolve filtercakes formed from the selected RDF systems a total of seven systems were evaluated
The highly unconsolidated nature of the Yafo Sand prevented using return permeability as core plugs were difficult to acquireproduce and the subsequent application of confining pressure to these cores yielded a higher risk for test failure Thus aloxite discs were used as an analog to establish filtercakes and assess filtrate invasion of the RDF systems as well as flow initiation pressures Based on optical data (Figure 4) the Yafo Sand exhibited maximum pores ranging from 200 to 400 microns and common pore sizes that ranged from 30 to 100 microns However the unconsolidated nature of the core recovered from this sand was surmised to skew the maximum pores as observedmeasured optically Thus a more realistic maximum likely ranged from 200 to 250 microns Next a bridging solids blend was designed using a proprietary software program (Dick et al 2000) with the resulting data shown below in Table 4
Table 4 - Optimized Bridging Solids Blend for the Yafo Sand
Grade D10 D50 D90 Percent Calcium Carbonate 10 09 98 240 3 Calcium Carbonate 20 10 196 810 7 Calcium Carbonate 40 27 480 1960 77 Calcium Carbonate 250 560 2400 4640 13 Totals (Blend) 3 52 248 100
This blend was incorporated at a total loading of 30 lbbbl A FAO-10 disc was selected to simulate the Yafo Sand as this
disc has measured median poresopenings that range from 27 to 77 microns and a maximum poreopening of 200 microns As return permeability testing could not be performed filtercakes were deposited on this medium and relative fluid loss and simulated flowback tests were performed
The next assessment compared the use of polyanionic cellulose to hydroxypropylated starch and to organophilic starchcarbonate when blending the laboratory-prepared RDF systems A matrix was formulated which included seven tests One system incorporated organophilic starchcarbonates and the other six were divided equally with three systems using only hydroxypropylated starch and the other three using only polyanionic cellulose (Table 5) The rheological properties of these systems exhibited relatively low plastic viscosity (PV) and elevated yield point (YP) (peusdoplastic) and low-shear-rate viscosity (LSRV) The ratio of PVYP is typically less than one for a biopolymer viscosified water-based system The addition of the fluid loss agents at equal concentrations of hydroxypropylated and polyanionic cellulose also yielded a similar ratio However with the addition of the polyanionic cellulose a decrease in the low-end rheology was evident Both the 6 and 3-rpm readings as well as the LSRV were reduced and when compared to the LSRV of the hydroxypropylated systems was approximately 35 times less This is most likely due to the highly anionic nature of this product Fluid loss tests were performed for a 16-hour period at approximately 155degF and revealed comparative results for the hydroxypropylated and organophilic systems However the systems that utilized the polyanionic cellulose exhibited lower fluid loss ndash 36 mL compared to 48 mL ndash as expected
6 SPE 158655
Figure 4 - Digital image of a thin section of the Yafo Sand Note pores of approximately 200 microns to 400 microns in width are maximum measured while common pores range from
approximately 30 to 100 microns
Table 5 - Comparison of Rheology Fluid Loss and Simulated Flowback for RDF Systems Using Selected Fluid Loss Additives
Fluid Loss Additive Used in
RDF System Organophilic
Starch Hydroxypropylated
Starch Hydroxypropylated
Starch Hydroxypropylated
Starch Polyanionic
Cellulose Polyanionic
Cellulose Polyanionic
Cellulose
Rheology 600-rpm Reading 77 69 69 69 67 67 67 300-rpm Reading 61 55 55 55 47 47 47 200-rpm Reading 53 48 48 48 38 38 38 100-rpm Reading 41 40 40 40 27 27 27 6-rpm Reading 15 19 19 19 9 9 9 3-rpm Reading 12 17 17 17 7 7 7 10-sec10-min Gel (lb100 ft2) 12 14 18 21 18 21 18 21 8 11 8 11 8 11
PV (cP) 16 14 14 14 20 20 20 YP (lb100 ft2) 45 41 41 41 27 27 27 LSRV 1 min (cP) 43691 55687 55687 55687 16596 16596 16596 LSRV 2 min (cP) 44491 61687 61687 61687 17796 17796 17796 LSRV 3 min (cP) 44291 61287 61287 61287 17496 17496 17496 Other Test Results pH (Direct) 96 101 101 101 969 969 969 16-hr Fluid Loss (mL) 49 48 48 48 36 36 36
Simulated Flowback Breaker Type None None Acid2 Chelant3 None Acid2 Chelant3
Soak Time at 155oF na na 24 hr 5 day na 24 hr 2 day Return to Flow 74 59 43 94 21 9 4 1 Using 2040 gravel and a 175-micron screen coupon All filtercakes formed after hot-rolling at 155degF and fluid loss for 16 hours at 155degF on a FAO-10 disk 2 15 HCl + 5 Acetic at initial pH lt1 3 Amylase plus protonated chelant at initial pH 46
Next relative or simulated flowback were performed using the aforementioned 16-hour filtercakes (Figure 5) Two
baseline tests were included where no breaker system was applied It should be noted that organophilic systems do not require the use of a breaker system as the organophilic components promote preferential flow of hydrocarbons (Ravitz et al 2005 Napalowski et al 2008 Ravitz et al 2009 Trieb et al 2009 Ezeigbo et al 2012 Randell et al 2012) These flowbacks were performed using LVT-200 mineral oil as gas cannot be used with this methodapparatus This method reports the percent return to flow after application of a breaker system (ie acid chelant etc) or no breaker to an initial flow rate For
SPE 158655 7
these tests the initial or baseline was measured using a combination of aloxite disk 2040 gravel and screen coupon Thus the baseline was established using a blank aloxite disk (eg no filtercake) placed inside an HTHP cell 2040 gravel placed on top and a 175-micron screen coupon on top of the gravel whereby flowrates were measured at 1 2 4 and 8 psi The aforementioned array was used to simulate a gravel pack and the LVT-200 was used to simulate hydrocarbon and was flowed in an arbitrary production direction Using this method all RDF systems and subsequent removal or dissolution by a breaker system were comparedcontrasted using the calculated slopes
The RDF systems formulated with polyanionic cellulose were compared to baselines where no breaker was applied as well as to two breaker systems acid based and a chelant based which included amylase for degrading the polymers used as fluid loss additives The acid breaker was blended as HCl plus acetic In this simulation of the field application the acid was not targeted for stimulating as the Yafo is predominantly quartz The chelant plus amylase was formulated to dissolve the calcium carbonate and degrade the starch respectively both components of the residual filtercake In addition as chelants and enzymes are relatively slow-acting compared to inorganic and organic acids it was surmised that this chemistry would provide a delay such that these components could be incorporated as part of the gravel packing carrier fluid andor as a post spot if the gravel packing tool was convertible to allow a suitable pumping path For these tests the acid-based breaker was applied for 24 hours and the chelant plus amylase breaker for two and five days
Figure 5 ndash Comparison of relative flowback for selected RDF systems with and without breaker systems
The results (Table 5) show that the organophilic-based RDF system while demonstrating a relatively high return to flow
approximately 74 percent could not be considered for use as the initial start-up or kick-off of a well required bullheading the tubing volume (eg KCl brine) through the gravel pack and residual filtercake and as this system is hydrophobic would mitigate this process The relatively low percent return to flow for tests where polyanionic cellulose was incorporated into the RDF exhibited incompatibility with the protonated breaker systems (ie pH less than 55) The baseline RDF with polyanionic cellulose yielded approximately 21 percent return to flow A comparison of the chelant plus amylase breaker system and the acid system showed return of the initial flow of 9 percent and 4 percent respectively The combination of the polyanionic cellulose and protonated chemistry most likely resulted in precipitation and yielded a more tenacious filtercake In comparison the RDF that utilized hydroxypropylated starch exhibited a return to flow of approximately 59 percent The application of an acid system yielded a return to flow of 43 percent and may be attributable to the lack of proper additives volume andor concentration used Although acid was not a desired breaker system it was however considered as a baseline for these tests The use of the chelant-based breaker system yielded 94 percent return to flow
It is evident from these relative tests that the polyanionic cellulose when incorporated into the RDF system at only 35 lbbbl yielded a more tenacious filtercake that was relatively more difficult to remove and degrade It was also concluded that the use of the chelant-based system plus an internal breaker would provide less risk and promote degradation of the
Pressure
Hydrox + Chelant
Baseline
Organophilic
Hydrox No Breaker
Hydrox + Acid
Polyanionic Cell No Breaker
Polyanionic Cell + Acid Polyanionic Cell + Chelant
8 SPE 158655
polymers in the residual filtercake specifically the hydroxypropylated starch In addition the use of relatively slow-acting chemistry or chelants would allow incorporation into the gravel pack carrier system
As a final interpretation of the relative flowback testing the pressure required to initiate flow with respect to the residual filtercake gravel and screen coupon was also assessed The pressure required to initiate flow or effluent for each RDF with and without a breaker system can be approximated from the x-axis the baseline (no filtercake) and each other A measureable difference is apparent for the hydroxypropylated RDF where a five-day chelant soak was used and all other RDF systems andor breakers In addition the flow rate at each pressure was greater for this combination of breaker system and hydroxypropylated RDF
Based on the test results the optimized RDF formulation is shown in Table 6 Note that this system included an internal breaker that was used to enhance localized degradation
Table 6 - Optimized 90 lbgal RDF
Products Conc Units Primary Function 7 KCl 09507 bbl Density Xanthan 125 lbbbl Polymer Viscosifier Hydroxypropylated Starch 70 lbbbl Fluid Loss Control Magnesium Oxide 05 lbbbl Maintain pH Calcium Carbonate 10 10 lbbbl Bridging Calcium Carbonate 20 20 lbbbl Bridging Calcium Carbonate 40 230 lbbbl Bridging Calcium Carbonate 250 40 lbbbl Bridging Biocide 019 lbbbl Pre-treat water Oxygen Scavenger 054 lbbbl Scavenger for breaker Internal Breaker 20 lbbbl Localized degradation of polymers
The final objective was to assess delay The carrier fluid section tested relative delay of the chelant based-systems when
incorporated into the gravel pack carrier system Solids-Free Reservoir Drill-In Fluid (SF-RDF) A solids-free version of the RDF or SF-RDF was formulated and optimized for use as a liner or screen running system This system excludes the calcium carbonate bridging material and uses the brine phase to attain a target density The target density is typically equal to or up to 10 lbgal heavier than the RDF This density difference promotes an effective openhole displacement whereby the RDF and nearly all residual is removed commingling it mitigated reduces the interface This density difference also allows for a head-to-head displacement thus eliminating an additional spacer The SF-RDF is also formulated more viscous than the RDF at all measured shear points typically 15 times that of the RDF which aids and promotes an effective displacement of the residual RDF from the open hole Typically this displacement is designed to push the tail of the RDF above the casing shoe and above the area where the packer is set The elevated viscosity of the SF-RDF also helps to reduce losses in the event that the filtercake is disturbed The SF-RDF is spotted in the open hole on the last trip prior to screen running whereby the casing is displaced to clear brine fluid after the drillstring is pulled above the open hole The solids-free nature of this system is also intended to prevent plugging when the screen system is run into the wellboreopen hole Table 7 shows the laboratory formulation used to blend a 95 lbgal SF-RDF
Table 7 - Optimized 95 lbgal SF-RDF
Products Conc Units Primary Function 22 KCl 0995 bbl Density Xanthan 225 lbbbl Polymer Viscosifier Hydroxypropylated Starch 40 lbbbl Fluid Loss Control Magnesium Oxide 05 lbbbl Maintain pH Biocide 019 lbbbl Pre-treat water
Prior to pumping the SF-RDF a production screen test (PST) is performed in the field (Sorgard et al 2001 Svoboda
2002) This quality control method requires a coupon cut from the same filtration media that is utilized as part of the sand control system (eg wire-wrap premium weave etc) This SF-RDF system was then used to assess relative plugging of the sand control screen Based on the volume of the wellbore and open hole two 1-L volumes were used and flowed through the same coupon to assess the potential to plug the sand control screen Plugging is defined as the inability to flow one liter through the coupon when using 20-psi differential to air This event is referred to as a FAIL Thus the specification for this test is a PASS versus FAIL for each one-liter volume and is not predicated upon time The laboratory results are shown in Table 8
Table 8 ndash Plugging test for SF-RDF
No Volume (mL) Time (sec) Result 1 1000 957 PASS 2 1000 134 PASS
SPE 158655 9
Two consecutive one-liter volumes of the laboratory SF-RDF did not plug a coupon that represented the sand control screen The ratio of 2000 mL for the 2-in diameter coupon can be used to expandextend to the actual length diameter and volumes for the completion whereby the laboratory volumearea used is greater than the volumearea of the actual completion
Completion Brine The completion brine selected was a single salt potassium chloride brine for simplicity and shale inhibition The displacement to completion fluid from RDF inside the casing was designed to include a series of cleaning spacers to remove the RDF and leave the metal tubulars water wet The entire displacement sequence was simulated using proprietary hydraulics software to optimize fluid volumes for pump pressures contact time and to minimize fluid interface
Packer Fluid Packer fluid chemicals were selected for corrosion inhibition considering metallurgy and anticipated temperatures A standard treatment package consisting of an oxygen scavenger biocide and corrosion inhibitor selected using a database of compatible products at bottomhole temperature for the production tubing metallurgy
Corrosion Testing Corrosion testing was performed to establish the corrosion rate of the 91-lbgal chelantenzyme breaker system and the completion brine system Tests were performed for 7 and 21 days (168 and 504 hours) with and without the addition of a corrosion inhibitor
The 316L coupons were weighed and photographed and then placed in glass bottles with the fluid samples for aging at 147degF After the 7 and 21-day time periods the coupons were cleaned weighed and photographed Microphotographs were also taken to capture any corrosion effects that were not immediately visible Table 9 demonstrates that the corrosion rates were well below the required limit of 5 mils per year (mpy)
Table 9 - Measured Corrosion Rates for Breaker and Completion Brine Systems
Fluid Initial pH Final pH Time (hr) mpy Breaker System 6 608 168 01 Breaker System with Corrosion Inhibitor 6 605 168 013 86-lbgal KCl 7 854 168 011 Breaker System 6 608 504 005 Breaker System with Corrosion Inhibitor 6 605 504 004 86-lbgal KCl 7 854 504 003
Gravel Pack Design
Sand Screens The sand screens selected were premium mesh 175 micron centralization was added to ensure adequate
stand-off from the underreamed (12frac14-in) borehole Proppant 2040 Synthetic proppant was selected for gravel pack sand
Carrier Fluid The planned short and vertical production intervals provided a relatively low risk environment for gravel packing especially water packing To maximize breaker access to the filter cake the enzyme and chelant components were incorporated as part of the gravel pack carrier fluid This would provide immediate intimate and adjacent contact with the residual filter cake This specific chemistry (eg pH) was also designed to activate the internal breaker which was added to the RDF before the drilling phase thus incorporating this component as part of the filter cake
It was critical to establish that this component as designed for filtercake destruction would not result in premature degradation that may compromise the gravel pack due to losses during pumping To simulate the gravel packing process and potential breakthrough a test sequence was established using a proprietary dynamic high-temperature high-pressure (HTHP) apparatus The matrix was designed to simulate a series of dynamic and static conditions with an aged filter cake that simulated the drilling and completion operations This dynamic HTHP (Figure 6) is similar to a conventional HTHP however it is equipped with a shaft that allows rotation at a predetermined rate up to approximately 800 rpm Fluid loss is monitored continuously throughout the test to document a breakthrough event whereby the filter cake fails to restrict the loss of a fluidsystem
It was decided that the following sequence (Table 10) of pressure rotation and time would simulate the deposition of the filter cake displacement circulation of gravel and a static period whereby the workstring is POOH to close the fluid loss valve
A test was initiated by simulating the drilling of the reservoir or deposition of a filter cake on the FAO-10 aloxite at 650 rpm The test was converted to a static test to simulate the filtercake formation between drilling and the gravel pack operation For the gravel pack the equivalent of 1 ppa with the breaker system were placed inside the cell using the rotating
10 SPE 158655
shaft at 120 rpm to simulate pumping of the gravel pack Finally a static fluid loss was monitored to simulate retrieving the washpipe through the mechanical fluid loss control device Figure 7 shows the results of this test
Figure 6 ndash Dynamic HTHP apparatus
collecting fluid loss
Table 10 ndash Sequence of Events to Simulate Downhole Activities Step Field Procedure
Simulated Pressure
(psi) Temp (degF)
Rotation (rpm)
Time (hr)
1 Drilling 500 147 650 40 2 Tripping pipe 500 147 none 110 3 Circulating BU 600 147 650 10 4 Decant RDF none 5 Add gravel pack slurry none 6 Gravel Packing 500 147 120 05 7 POOH 300 147 none 30
From the data (Figure 7) no premature breakthrough or increase in fluid loss was evident throughout the duration of the
dynamic and static phases that would be considered indicative of premature degradation of the residual filter cake
Figure 7 ndash Summary of fluid loss data for simulating gravel packing with a breaker system with 1 ppa of 2040 gravel
SPE 158655 11
QAQC of Fluids in the Field During Operations Several QAQC protocols were performed on the fluid systems (RDF SF-RDF completion brine and breakercarrier fluid) during field execution to ensure compliance with the laboratory test protocols which minimize damage mechanisms to the reservoir These QAQC steps also established standardization of fluid operational procedures in the Mari B field
The QAQC protocols included specification sheets identifying acceptable properties for fluids prior to shipping to the rig site as well as confirming properties once received The tables were completed by the technical specialist and witnessed Each batch of fluid mixed was tested prior to loading on inspected transport vessels The rig systems also received inspections to avoid contamination of fluids During drilling properties were reported and maintained as specified in the program Key QAQC procedures were established for the following activitiesphases
bull Mixing Preparation Mixing and transfer system cleanliness bull RDF Density rheology pH and fluid loss bull SF-RDF Density rheology pH and production screen test bull Completion Brine Density total suspended solids clarity bull Breaker System Base brine density total suspended solids and clarity breaker chemistry activity
Execution The importance of flawless execution is obvious as this is where the ldquorubber meets the roadrdquo Even with the right design detailed engineering and equipment integrity a single human act can imperil all of the hard work performed prior to this critical phase Constant supervision and focus on both the procedure and final goal is paramount Project engineers facilitated Complete Well on Paper (CWOP) sessions and detailed procedure reviews (most hosted in the Supplierrsquos facility where the equipment was easily accessible) with key supplier personnel and company wellsite supervisors Learning from mistakes and successes (yours and others) is one of the most important tactics of flawless execution This includes during and after the job The purpose of the after-action reviews is to capture lessons learned in order to immediately improve on subsequent operations andor improve future designs procedures and operations A detailed review of all the lessons learned is outside the scope of this paper however a couple of examples of several key tactics are described below
bull On-Site Supervision bull After-Action Reviews
On-Site Supervision Significant effort was put into the inspection assembly and test of the gravel-pack equipment A Shop Quality Plan (QP) was developed and implemented which required witnessing by company wellsite supervisors QAQC procedures and plans were not only developed for tangible and rental items but also for the completion fluids Figure 8 is an example of a Fluid QAQC inspection sheet that was utilized to ensure that the SF-RDF pill which is spotted in the open hole prior to gravel packing met the specified acceptance criteria Screen plugging during gravel packing can result from contaminated (solids laden) fluids left in the open hole which can lead to screen erosion during pumping ndash a catastrophic failure The screen plugging test of the clean pill was witnessed by the company wellsite supervisor The test results are documented on the inspection sheet (verifying document) and is signed-off by the company wellsite supervisor
Figure 8 ndash SF-RDF QAQC Inspection Sheet
Screen Plugging Test
Field Mari B RequirementsWell 9 Approximately 2000 mls (calculated 01-Jun-2010)
Actual Sand Screens 175 um EXCELFLOScreen Coupon 175 um (provided by Weatherford) Acceptance Rejection Criteria
Fluid 92 ppg FLOPRO RDF No increasing trend in times (per 01-Jun-2010)Screen 175 um
Lab Appartus Modified HPHT Cell (175 mls)Test Date 2-Jun-10Lab Tech
TimeVolume (secs) (F)
(mLs) Aliquot Actual Temp Comments175 1 9 82175 2 9 82175 3 9 82175 4 9 82175 5 9 82175 6 9 82175 7 9 82175 8 9 82175 9 9 82175 10 9 82175 11 9 82
1925
red = input data
Test Data
0
5
10
15
20
25
30
35
40
45
50
0 2 4 6 8 10 12
Tim
e (s
econ
ds)
Actual
12 SPE 158655
After-Action Review (Lessons Learned - Gravel Packing Operations) Even with the most careful planning and process problems always occur Usually these problems are a result of poor communication and even the simplest things can jeopardize the execution
On the first gravel packing operation the gravel pack slurry return tank was sent on another job for different operator thus it was not available for the first gravel pack (Mari-B 9) The purpose of a slurry return tank is to measure the amount of sand reversed-out after the job This amount is subtracted from the total amount sand pumped to determine how much sand was left in the hole Four other methods contingencies were planned to cover this function They were as follows
1 Non-radioactive densitometer (NRD) A NRD was utilized to measure the proppant concentration in the slurry However the NRD proved to be inaccurate for proppant loadings less than 1 ppa (the designed proppant concentration) The NRD measured over 17000 lb of proppant pumped however only 10000 lb was actually pumped
2 Re-stress Re-stressing (after reversing out) would be a positive indication that there was sufficient blank coverage and potentially a good annular pack which is the primary objective Without knowing the actual amount of sand remaining in the well the re-stress would be one indicator of a good pack
3 Gravel Pack Log A gravel pack log conveyed on the washpipe was designed to evaluate the quality of the gravel pack and identify any voids Unfortunately due to logistical issues this tool was also not available for the first gravel pack
4 Contingency Plan A contingency plan was to take slurry returns back to the active pit system However this was not considered feasible due to the small pit volumes (plusmn600 bbl) as well as the possibility of uncontrolled losses after the job due to the depleted reservoir pressure and the need to have completion fluid available
As detailed above returns were set-up to go overboard due to the small pit volume and lack of return catch tank However the return line had inadvertently been placed in to the active system The returns were shut down shortly after getting the fluid moving during reverse out to move the returns to the overboard positions This shut-down was not communicated to the engineer in charge and only came out during the after-action review The authors believe that during the shutdown the proppant was allowed to fall back and settle around the crossover tool After the well was reversed clean the tool was moved back into the circulating position to re-stress the pack At this time the tool became ldquostickyrdquo requiring over 100000 lb of overpull to free the tool The re-stress and ensuing post-gravel pack breaker treatment were eliminated due to tool issues A contingency clean-out run was performed
Ultimately the lack of communication could have caused a severe NPT event This risk (sticky crossover tool or failure of the post-gravel pack breaker treatment module) was identified during the operational review and contingency procedures were put in place to ensure that the reliability and productivity of the well was not put in jeopardy
The breaker fluid (chelant) was pumped as part of the gravel packing fluid If either of the above risks were experienced the chelant would already be in place without requiring the acid stimulation module of the crossover tool
Mari-B 9 did not pump a post acid stimulation However the productivity results validated our breaker plans as defined in the detailed engineering phase
The lessons learned from these operations included (but not limited to) the following bull Have the correct equipment available (sand return tank radioactive densitometer radio headsets gravel pack
log) bull Utilize more reliable method of measuring proppant loading (mass balance radioactive densitometer bull Improve communication Require single point-of-contact (SPOC) for all operations for the service company
Based on the previous wellrsquos learnings the next well (Mari-B 10) proppant loading was measured three ways non-radioactive densitometer radioactive densitometer and load cell (mounted on sand silo) Based on these results the load cell was the best method Mari-B 10 was pumped without incident and was considered a ldquotextbookrdquo operation
Operations
Background The oilfield infrastructure in Israel to support offshore and deepwater rig operations is nascent Most equipment and personnel are dispatched from other regions (Egypt Italy and the UK) A complete discussion of all the pre-job planning and rig operations is beyond the scope of this paper
Platform Rig A platform workover drilling rig (Figure 9) was selected and installed on the Mari-B platform There was limited space for the various completion equipment which made for a very challenging operation
SPE 158655 13
Figure 9 ndash Platform Workover Drilling Rig on Mari-B Platform
Completion Phases The completion operations were broken down into sequential phases (Table 11) to drive focus with regard to the detailed pre-job planning detailed procedures and contingency plans
Table 11 ndash Completion Operational Phases
Phase Operation 1 Wellbore Clean-out 2 Displacement from WBM to Seawater to RDF 3 Drill Reservoir Section 4 Underream Reservoir Section 5 Displace from RDF to SF-RDF to Completion Fluid 6 Run and pump OHGP 7 Run Upper Completion 8 ND BOPsNU Tree 9 Flow Back
The actual rig operations were performed tracked and evaluated by phase An after-action review was held with key
Supplier personnel to determine potential improvements and key lessons learned An action tracker and lessons learned log were utilized to capture the results and eliminate potential NPT on the next well
As-Built Completion The as-built completions (Figure 10) were delivered as designed
Operational Performance The results (operational performance) of the Mari-B new drill wells are considered an overwhelming success The project was delivered under-budget and on schedule A summary of the completion time analysis is presented in Table 12
Table 12 - Completion Time Analysis
Well
Actual Time (hr)
Total NPT (hr)
Scope Change NPT (hr)
Rig NPT (hr)
Normalized NPT (hr)
Normalized NPT
Mari-B 9 6475 2320 1880 00 440 96 Mari-B 10 5215 1200 755 245 200 47 Total 11690 3520 2635 245 640 73
The total normalized NPT for both wells was less than 3 days Normalized NPT is defined as total NPT minus (Rig +
Scope Change NPT) Scope change NPT is defined as any non-productive time that was not originally AFErsquod (that did not originate with trouble associated with the well) Scope change NPT is defined as any non-productive time that was not originally AFErsquod that did not originate with trouble associated with the well
14 SPE 158655
Figure 10 ndash Mari-B 9 As-Built Completion Schematic
13⅜rdquo 72ft L-80 VAM TOP 1360m (4462rsquo)
18⅝rdquo 875ft X-56 780m (2602rsquo)
24rdquo 1862ft X-56 352m (1148rsquo)SCSSV
Completion Interval1779 - 1822m MD (OAL = 43m)5837 - 5978rsquo MD (OAL = 141rsquo)1714 ndash 1757m TVD (5623 ndash 5764rsquo TVD)Mid Interval 1736m TVD (5696rsquo TVD)Hole Angle Reservoir = verticalPore Pressure = 686 ppgeBHP asymp 2034 psiBHT = 150oF (offset wells)
9⅝rdquo x 6rdquo GP Packer 1703m (5588rsquo) MD
SCSSV 548m (1780rsquo)9⅝rdquo Baker ONYX 5Valve ID = 8535rdquoLanding Profile= 8405rdquoOD = 11770rdquoMin Casing = 13⅜rdquo 92ft
TOL 1256m (4122rsquo) MD
Mudline temp = 58oF
Production String9⅝rdquo 47ft 13CR80 VAM TOP
Under-reamed 12frac14rdquo
FMC 9rdquo 5K Tree w single 9rdquo outlet
Water depth = 224m (800rsquo)
LegendBlack font = actualBlue italic font = proposedRed italic font = calculated
contingency plan
Weatherford Sand Screens6-58rdquo EXCELFLO 175umOD = 7388rdquo
SITP asymp 1796 psi
9⅝rdquo 47ft 13CR80 VAM TOP 1779m (5837rsquo) MD
Based on MB7 gauge pressure of 2130 psi 17185m TVD RKB on 4202010
TOC 531 m (1742rsquo) MD
Cement top job 18⅝rdquo x 24rdquo annulus
Drawn by JCHealyJr
Top of Completion Interval 1779 m
TOC (Lead) 1287 m (4223rsquo) MD
2040 Carbolite
TOC (Tail) 1769 m (5803rsquo) MDFIV (456rdquo ID) 1718m (5636rsquo) MD
Top of Blank 1726mTop of screen 1772mScreen Assembly OAL = 4796m (15735rsquo)
Bottom of Drilled Interval 1824 m21m of fill
AreaField East Med Mari-B
Well 9
Version As-Built (Final Rev 0)
Scoop Head Isolation Assembly 1702m
Packer Fluid87 ppg KCl (7) with additives
SPE 158655 15
Well Performance Because the project was ldquofast-trackedrdquo from a 2009 start the facility engineering of new flowlines ultrasonic flow meters and the upgrade and tie-in to the existing manifold lagged the drilling and completion campaign by about nine months The complexity and enormity of the flowline design and installation cannot be understated Because of the ultra high-rate flow rates required from each well 14-in diameter flowlines were necessary for velocity reasons The design fabrication and installation of these enormous flowlines were completed in March of 2011 In the nine months between the completion of the wells and the completion of the new flowlines each well was produced thru smaller temporary 8-in flowlines that were borrowed from two of the original wells Because the new wells had to be produced thru 8-in diameter flowlines the gas flow rate had to be limited to about 120 MMscfd per well There was a period of several months between the completion of the Mari-B 9 and 10 wells where the 9 well had access to two temporary 8-in flowlines and the production rate reached 220 MMscfD
Initial Unloading and Performance As originally designed with a large overbalance the completion fluid was allowed to leak-off into the depleted formation Once sufficient time had passed for the wells to swap over to gas the wells were brought online and gradually unloaded into the test separator Initial performance was tracked and the pre-drill NODAL1 analysis models were adjusted for actual performance The initial performance from both wells was unexpectedly lower than predicted The pre-drill NODAL models were based on actual performance from the offset well Mari-B 7 that was completed with an almost identical lower completion However initial mechanical skins on the Mari-B 9 and 10 were in the range of 80-100 assuming all the screen was producing If the assumption was made the wells had a mechanical skin of 10 the associated length of screen that would be flowing would have only been about five meters Since a production log was not run to assess how much interval was open to flow it will never be know if the initial skins were very high and most of the interval was flowing or if the skin was low and there was a limited area open to flow
Extended Well Cleanup In the months that followed the initial production for each well the wells gradually improved their performance to the point where they matched the sandface productivity of the Mari-B 7 well with a mechanical skin of around ten (S asymp 10) It took months for the performance to improve but to the delight of the production and completion team the well productivity ultimately reached the level stated in the project objectives Figure 11 shows the improvement of the sandface Productivity Index (PI) in MMscfdpsi2
Figure 11 ndash Mari-B 9 Improvement to Productivity Index vs Time
While the mechanism of improvement to well performance will never be known it is believed that calcium carbonate
(CaCO3) in the RDF filter cake may have had higher embedment (due to a significantly higher overbalance at the time of completion) as compared to the Mari-B 7 Because the drawdown and associated velocity across an openhole gravel pack is relatively low it simply took a while to move calcium carbonate back out of the matrix
Post Cleanup Well Performance After months of extended cleanup the Mari-B 9 and 10 have continued to perform extremely well As the reservoir pressure has declined to 48 lbgal equivalent the non-Darcy coefficient for turbulent skin has increased but not as much as
1 Mark of Schlumberger
040
050
060
070
080
090
100
110
6112010 712010 7212010 8102010 8302010 9192010 1092010 10292010 11182010
Sand
face
PI (
MM
scfd
psi
^2)
MB-9 Productivity Index Cleanup Progress
16 SPE 158655
expected compared to the performance of the older frac-packed wells Table 13 shows the well performance of the Mari-B 9 and 10
Table 13 ndash Key Well Performance Parameters (as of November 2011)
Parameter Units Mari-B 9 Mari-B 10 Peak Gas Rate MMscfD 2231 2461 Current Gas Rate Range MMscfD 65 - 210 65 - 210 Condensate Rate BCPD 0 0 Water (Condensation) Ratio BWMMscf 02 02 Flowing Wellhead Pressure psig 1220 - 700 1220 - 700 Mechanical Skin Dimensionless 12 12 Produced Solids None None
Because the Mari-B field sells into a market that has a huge swing in demand (ramp up from 200 ndash 500 MMscfD in six
hours is common) the wells will also swing enormously over a 24-hour period That is why the following two graphs showing the production trend for the Mari-B 9 and 10 are very scattered The graphs (Figure 12) below show the daily production and flowing tubing pressure for the wells since start-up
Figure 12 ndash Daily Production Plots for Mari-B 9 and 10
Conclusions The fast-track delivery of two world-class big bore (9⅝-in production tubing) wells in a remote area was directly attributable to the development and adherence to guiding principles and a completion delivery process Technical rigor and due diligence in all phases of the completion delivery process is imperative to achieve successful execution rate delivery and well reliability
Acknowledgments The authors wish to thank the Management of Noble Energy and the Yam Tethys co-venture group (Noble Energy Mediterranean Limited Delek Drilling LP Delek Investments and Properties Ltd and Avner Oil Exploration LP) for their permission to publish this work In addition the authors acknowledge the significant efforts and contributions of the Noble Energy Operations (Drilling amp Completion) and Production Teams to install the wells and facilities to produce these big bore completions In addition we thank the Management of M-I SWACO for their permission to publish this paper Nomenclature AFE = Authorization for expenditure BHP = Bottomhole pressure BHT = Bottomhole temperature LSRV = Low-shear-rate viscosity mpy = mils (thousandths of an inch) per year penetration NPT = Non-productive time Ppa = pounds per proppant POOH = Pull out of hole PV = Plastic viscosity
0
200
400
600
800
1000
1200
1400
1600
1800
2000
0
50
100
150
200
250
300
350
400
450
500
062010 092010 122010 032011 072011 102011
Flow
ing
Tubi
ng P
ress
ure
(psi
g)
Gas
Rat
e (M
Msc
fd)
Mari-B 9 Production History
Gas Rate
Tubing Pressure
0
200
400
600
800
1000
1200
1400
1600
1800
0
50
100
150
200
250
300
350
400
450
500
072010 092010 122010 032011 072011 092011 122011
Flow
ing
Tubi
ng P
ress
ure
(psi
g)
Gas
Rat
e (M
Msc
fd)
Mari-B 10 Production History
Gas Rate
Tubing Pressure
SPE 158655 17
RDF = Reservoir drill-in fluid RIH = Run in hole SITP = Shut-in tubing pressure YP = Yield point Conversion Factors and Units 1 mmyr = 394 mpy lb100 ft2 x 4788 026 E-01 = Pa bbl x 1589 873 E-01 = m3 cP x 10 E+00 = mPas lbgal x 1198 264 E-01 = sg psi x 6894 757 E+00 = kPa Conversion factor is exact References Benesch JM Gahr JZ Al-Mohsin AH and Schmidt MH 2007 ldquoOptimization of High-Pressure High-Rate (HPHR) Gas Wells in a
Giant Offshore Fieldrdquo SPE 105712 SPE Middle East Oil amp Gas Show Kingdom of Bahrain 11-14 March Benesch JM Nor N and Ngatijan 2004 ldquoOptimization of Big-Bore HPHT Wells to Exploit a Low-Pressure Reservoir in Indonesiardquo
SPE 87171 IADCSPE Drilling Conference Dallas 2-4 March and SPE Drilling amp Completion (March 2006) 44 Bourgeois A Bourgoin S and Puyo P 2006 ldquoBig Bore Completion and Sand Control for High Rate Gas Wellsrdquo SPE 102550 SPE
Russian Oil and Gas Technical Conference Moscow 3-6 October Cannan WL McKenna DL Sukup R A Calvert DG Quitzau R Sardjono S and Ellison PC 1993 ldquoBigbore Well Completions
A New Completions Technique for Arun Fieldrdquo SPE 25384 SPE Asia Pacific Oil amp Gas Conference Singapore 8-10 February Clancey BM Khemakhem ASD Bene TF and Schmidt MH 2007 ldquoDesign Construction and Optimization of Big-Bore Gas
Wells in a Giant Offshore Fieldrdquo SPE 105509 SPEIADC Drilling Conference Amsterdam 20-22 February Dick MA Heinz TJ Svoboda CF and Aston M 2000 ldquoOptimizing the Selection of Bridging Particles for Reservoir Drilling
Fluidsrdquo SPE 58793 SPE International Symposium on Formation Damage Control Lafayette Louisiana 23-24 February Dolan SP Williams GJ and Crabtree RJ 2001 ldquoPlanning and Execution of Big Bore Wells ndash Offshore NW Australiardquo SPE 67820
SPEIADC Drilling Conference Amsterdam 27 February ndash 1 March Ezeigbo E Luyster M Ravitz R Pereira A and Nguyen C 2012 ldquoA Specially Designed Organaphilic Chloride-Free Reservoir Drill-
In Fluid Meets the Challenges of the First Horizontal Well in Mozambiquerdquo SPE 151837 SPE International Symposium on Formation Damage Control Lafayette Louisiana 16-17 February
Gunningham M Varley C and Cagienard P 2008 ldquoThe Integrated Use of New Technology in the Development of the Sakhalin II Projectrdquo SPE 114805 SPE Russian Oil amp Gas Technical Conference Moscow 28-30 October
Hartmann R Vikesaring GO and Kjaeligrnes PA 2004 ldquoBig bore high flowrate deep water gas wells for Ormen Langerdquo OTC 16554 Offshore Technology Conference Houston 3-6 May
Healy JC Martin J McLaury B Jagroop R 2008 ldquoErosion Study for a 400 MMcfD Completion Cannonball Field Offshore Trinidadrdquo SPE 115546 SPE Annual Technical Conference Denver Colorado 21-24 September and SPE Drilling amp Completion (March 2010) 137
Healy JC Powers JT Maharaj M and Ramlogan M 2007 ldquoCompletion Design Installation and Performance - Cannonball Field Offshore Trinidadrdquo SPE 110524 SPE Annual Technical Conference Anaheim California 11-14 November and SPE Drilling amp Completion (December 2009) 626
Ledlow LB Gilbert WW Omsberg NP Mencer GJ and Jamieson DP 2008 ldquoRevised Big Bore Well Design Recovers Original Bayu-Undan Production Targetsrdquo SPE 114011 SPE Annual Technical Conference Denver Colorado 21-24 September
McKenna D Sukup R Stambaugh T and Biggs RA 1993 ldquoArun Indonesia Big Bore Completion Tool Designrdquo OTC 7328 Offshore Technical Conference Houston 3-6 May
Napalowski R Hill R Stomp R Fagervik E Derkach E and Manning D 2008 ldquoSuccessful Implementation of Horizontal Open-Hole Gravel Packing in the Stybarrow Field Offshore Western Australiardquo SPE 116434 SPE Asia Pacific Oil amp Gas Conference Perth 20-22 October
Randell B 2012 ldquoMonobore Well Design Utilizing Technology to Improve Well Execution Efficiencyrdquo SPE 154013 SPE Western Regional Meeting Bakersfield California 19-23 March
Ravitz R Juprasert M Billingsley J Young G Growcock F Luyster M and Rodriguez C 2009 ldquoThe Use of Smart-Filter-Cake Reservoir Drilling Fluid in the Wilmington Fieldrdquo AADE 2009 NTCE-15-02 AADE National Conference New Orleans 31 March 31 ndash 2 April
Ravitz R McCarter M Taglieri A Colazas G Montes E and Rizkalla S 2005 ldquoActive Filtercake Technology ndash Eliminating the Need for Post Completion Cleanuprdquo SPE 94726 SPE European Formation Damage Conference Scheveningen The Netherlands 25-27 May
Sorgard E Alteras E Swanes G and Dzialowski A 2001 ldquoNew Apparatus Allows to Test Drill-In Fluid Flowback Through Production Screen at Wellsiterdquo Offshore Mediterranean Conference Ravenna Italy 28-30 March
Svoboda C 2002 ldquoTest Device Evaluates Compatibility of Reservoir Drill-In Fluid and Production Screenrdquo 2002 AADE-02 DFWM-HO-09 AADE National Drilling Conference Houston 2-5 April
Teng D Nettleship G Hicking S and Hindmarsh K 1998 ldquoHigh Rate Gas Well Design Issues and Solutions ndash Goodwyn Gas Condensate NWS Australiardquo SPE 50081 SPE Asia Pacific Oil amp Gas Conference Perth 12-14 October
Trieb A Philippovich N Uberer W Nederlof E and FlorianT 2009 ldquoSkin Free Production Through a New Gravel Pack Completionrdquo SPE 122135 SPE European Formation Damage Conference Scheveningen The Netherlands 27-29 May
- SPE 158655
- Design Qualification and Installation of Openhole Gravel Packs
- Mari B Field Offshore Israel
- John Healy SPE Jack Sanford SPE and Donald Reeves SPE Noble Energy Kerby Dufrene SPE (formerly with Schlumberger) Mark Luyster SPE Matt Offenbacher SPE and Eze Ezeigbo SPE M-I SWACO
- Abstract
- Nomenclature
- Conversion Factors and Units
-
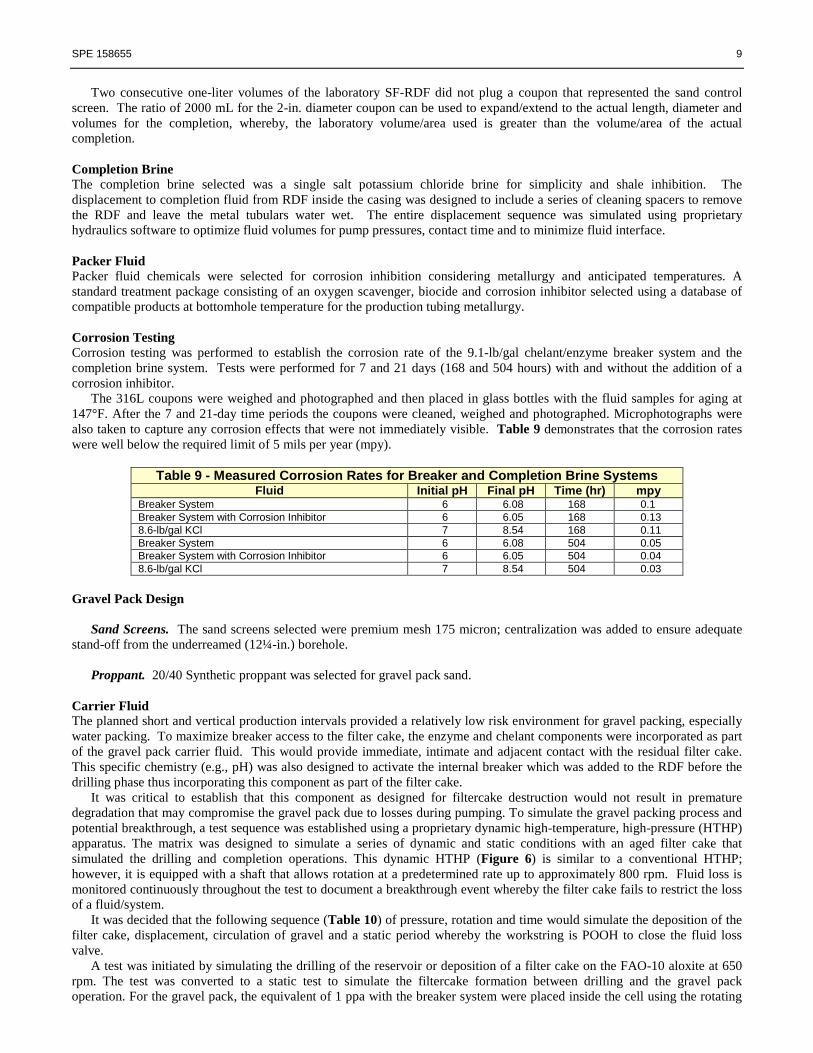
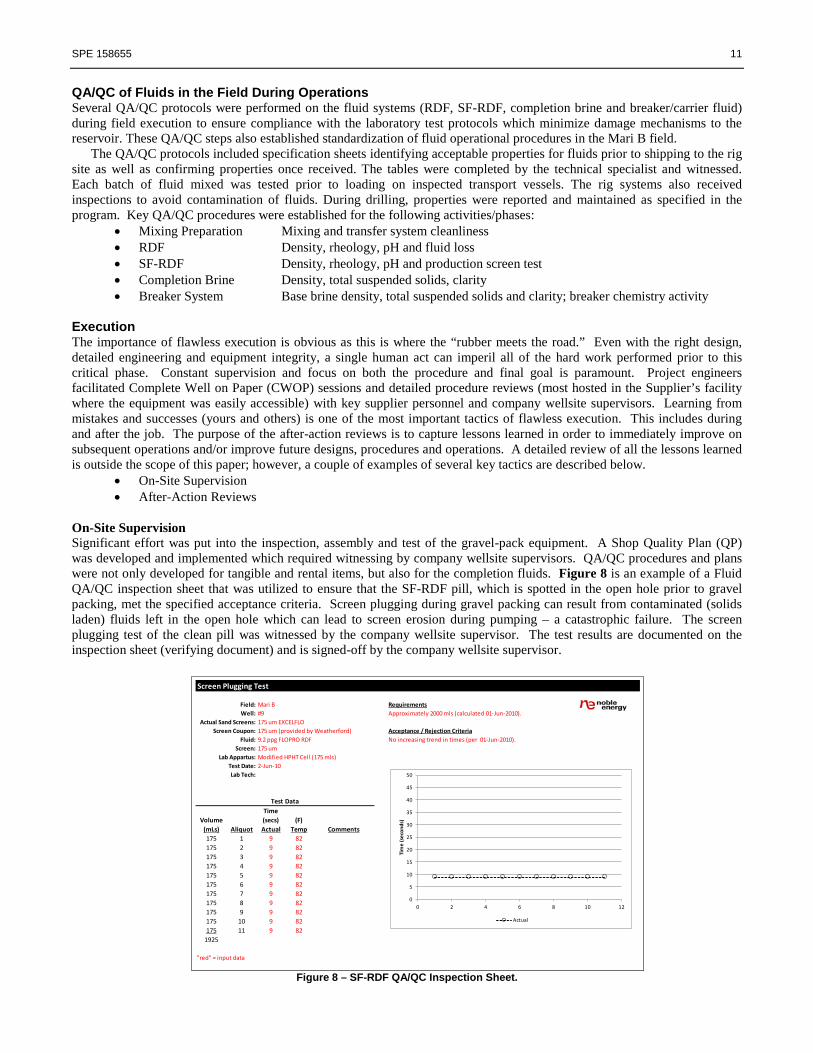