spe 113260 reservoir management of the gullfaks main...
TRANSCRIPT

Copyright 2008, Society of Petroleum Engineers This paper was prepared for presentation at the 2008 SPE Europec/EAGE Annual Conference and Exhibition held in Rome, Italy, 9–12 June 2008. This paper was selected for presentation by an SPE program committee following review of information contained in an abstract submitted by the author(s). Contents of the paper have not been reviewed by the Society of Petroleum Engineers and are subject to correction by the author(s). The material does not necessarily reflect any position of the Society of Petroleum Engineers, its officers, or members. Electronic reproduction, distribution, or storage of any part of this paper without the written consent of the Society of Petroleum Engineers is prohibited. Permission to reproduce in print is restricted to an abstract of not more than 300 words; illustrations may not be copied. The abstract must contain conspicuous acknowledgment of SPE copyright.
Abstract The giant Gullfaks Main Field comprises Statfjord, Cook and Brent Formations of Early to Middle Jurassic. The reservoir is complex due to large number of faults and extreme permeability contrast ranging from several Darcies in the Tarbert to milli-Darcy in the Cook. The highly productive sands are poorly consolidated causing sand production problem. Reservoir fluid in some of the areas contains high H2S. Uncertainties associated with structures, degree of communication, extreme contrast in reservoir properties and effective control of sand and H2S pose a great challenge for reservoir management.
Despite the challenges, the recovery factor on Gullfaks Main Field is high. A total of 335 Sm3 of oil has so far been produced, which amounts to an overall recovery factor of 56% (60% in the Brent Formation). This high recovery factor is attributed to effective reservoir management. The management strategy involves conservation of reservoir energy, implementation of simple and advanced strategies, systematic and sustained collection of data, and continuous application of improved recovery technologies.
Conservation of energy is achieved through water and gas injection. Simple and advanced strategies include selective perforation of wells, sand control, zone isolation, multi-target wells, controlled drainage through DIACS technology, through-tubing drilling, etc. Data collection involves 3D and 4D seismic, core and well log, RFT/MDT pressure, PLT, RST saturation, well completion, production and injection, etc. Improved recovery techniques, studied and some of them implemented, consist of infill-drilling, water and WAG injections, polymer assisted surfactant flooding, microbial injection, CO2 injection, etc. The current IOR initiatives are meant to extend the production life of the field to 2030 and thus meet the ambition of recovering 400 MSm3 of oil.
This paper summarizes the reservoir management challenges, techniques and technologies applied to evaluate and monitor the reservoir performance, and the strategies to enhance oil production.
Introduction The Gullfaks field is currently owned 70% by StatoilHydro and 30% by Petoro. StatoilHydro is the operator. The field is located mostly in block 34/10 in the Norwegian sector of the North Sea (Fig. 1). The Gullfaks area with field, discoveries and prospects are shown in Fig. 2. The area includes nine production licenses. The red dotted line divides the area into two: Gullfaks main and Gullfaks satellites. Gullfaks satellites consist of Gullfaks Sør, Rimfaks, Gullveig, Skinfaks and Gulltopp. Gullfaks main represents the main reservoir containing 78% of the total in-place oil volumes and 88% of the recoverable reserves. This paper solely deals with reservoir management of the main field and hence no more discussion will be made on the satellites. Hereafter, if not stated otherwise, the main field will be referred to as the Gullfaks field.
Block 34/10 was awarded to Statoil, Norsk Hydro and Saga Petroleum in June 1978. The Gullfaks field was discovered in the same year by the first exploration well 34/10-1, which encountered a 160m oil column in the Brent Group and penetrated water-bearing Cook and Statfjord formations. Exploration wells 34/10-3 to 6 appraised the western part of the field and established the oil-water-contact (OWC) in the Brent Group. A deeper hydrocarbon system in the Cook formation was discovered by 34/10-7, whereas well 34/10-11 in the north-eastern part of the block showed a deeper OWC and a new oil-bearing system in the Statfjord formation. The appraisal phase of the main field ended in 1983, while the appraisal of the satellites continued up to 2002. More than 20 exploration and appraisal wells were drilled to assess the full potential of the field.
Based on structural understanding from seismic and well data, a 2-phase development plan was proposed1. Following the commerciality report in late 1980, the authorities approved a field development plan (Phase-I) in October 1981 allowing the production of Brent Group reserves in the western part of the field from two concrete gravity base platforms. The field was set on production in December 1986 from five pre-drilled subsea wells connected to Gullfaks A-platform (GFA). Gullfaks B platform (GFB) was commissioned in February 1988. The authorities approved the development of the eastern part (Phase-II) in 1985 from a third concrete gravity base platform. Gullfaks C platform (GFC) was put on production in January 1990.
GFA, GFB and GFC have 42, 42 and 52 well slots respectively. Each of the platforms has two drilling shafts and one drilling rig. GFA and GFC are all-purpose with drilling,
SPE 113260
Reservoir Management of the Gullfaks Main Field Saifullah Talukdar, SPE and Rune Instefjord, SPE, StatoilHydro ASA, Norway

2 SPE 113260
production and living facilities. These platforms have fully independent three-stage separation facilities. GFB has limited process installations with only first stage separation. The partly stabilized crude oil is transported to GFA and GFC for further processing. The associated gas is transported to GFA through a separate pipeline. Under the current operating conditions, the oil, water and gas production capacities respectively are 50000 Sm3/d, 38000 Sm3/d and 16.4 MSm3/d on GFA, 60000 Sm3/d, 50000 Sm3/d and 1.8 MSm3/d on GFB, and 56000 Sm3/d, 61000 Sm3/d and 17 MSm3/d on GFC. The water and gas injection capacities respectively are 77000 Sm3/d and 3.2 MSm3/d on GFA, 30000 Sm3/d and 0.0 MSm3/d on GFB, and 78000 Sm3/d and 2.7 MSm3/d on GFC. However, the installation allows transferring 20000 Sm3/d water injecting capacity from GFA to GFB.
The processed crude oil is stored in the concrete base of the platforms and loaded into tankers via two separate mooring buoys. Part of the produced gas is reinjected into the reservoir and the rest is exported through the Statpipe network. The field infrastructure is shown in Fig. 3.
Production from whole Gullfaks is at decline from its highest rate of 90000 Sm3/d in 1994. Startup of the satellites in 1998 slowed down the decline somewhat and the rate was almost constant at 60000 Sm3/d for about one year. During 2001-04 the rate was at about 35000 Sm3/d before it started declining again in 2005. The current rate is about 25000 Sm3/d.
Gullfaks main is a giant field comprising shallow marine to fluvial sediments of Cook Formation, Statfjord Formation and Brent Group ranging in age from Early to Middle Jurassic. The seismic and well data have revealed a complicated structural picture with numerous faults at seismic and subseismic resolutions causing major impacts on flow patterns and reservoir performance. Extreme permeability contrast ranging from several Darcies in the Tarbert to milli-Darcy in the Cook further emphasizes the reservoir complexity. The highly productive sands are poorly consolidated causing sand production problem specially, after water breakthrough. Reservoir fluid in some of the areas contains high H2S, which complicates the situation even further. These factors pose a formidable challenge for an effective reservoir management of the field.
The field is now at the late phase where 93% of the basic oil reserves are produced as per 31 December 2007. The current estimates of the in-place volume and recoverable reserves are 599 and 358 MSm3 respectively. The ambition of the asset team is to increase the recoverable reserves to 400 MSm3. Effective reservoir management practices are the essence to fulfill this goal.
This paper presents the reservoir management challenges, techniques and technologies applied to evaluate and monitor the reservoir performance, and the strategies to enhance oil production. The paper summarizes the experiences gained from reservoir management and IOR activities of this giant and challenging field which may be of great value for further development of this field as well as for other fields of similar nature. Reservoir Description Structural mapping of the Gullfaks area is complicated due to
relatively poor seismic data and complex structural geology. However, the advances in seismic surveys and processing techniques have improved the data quality significantly in the recent years. This has resulted in higher resolution data and greater confidence in structural interpretation.
The Tampen area was highly deformed during the late Jurassic extensional period. The Gullfaks Main Field is located on a big rotated fault block on the western side of Vikinggraben and defines the structural height in the area. This rotated block consisting of internal rotated blocks forms the architecture of the Gullfaks field.
The field is divided into three main structural areas (Fig. 4). A domino system consisting of westerly dipping fault blocks dominates the central and western part of the field. In the eastern part of the field, a nonrotatet (or slightly easterly dipping) horst complex dominates the structural picture. In between these two systems, a complex accommodation area characterized by a fragmented anticline is observed. Coexistence of westerly and easterly dipping faults may have caused spatial problems accompanied by local reverse faulting. The Stratigraphy shows progressive erosion towards the east. Whereas the Middle Jurassic Brent Group is not eroded in the western part, some 600-800m of Middle and Early Jurassic sediments are eroded on the horst block to the east. The large-scale normal faults and a major drop in the Base Cretaceous Unconformity (BCU) define the northern, eastern and southern limits of the Gullfaks structure.
The terrace-like structure consists of nine main fault blocks (called D in the west and L in the east) which are typically spaced 1.0-1.5 km apart and have throws between 50-250m. The dipping for the main faults in the domino area is approximately 30 degrees towards the east, whereas, it is about 60-65 degrees towards the west in the horst area. Each of the main fault blocks are subdivided into number of smaller fault segments (Fig. 5). These fault segments consist of numerous small-scale, east-west trending normal faults (over 300 are identified on the main field). The main faults (observable on seismic) and small-scale faults (sub-seismic) have variable sealing potentials depending on their location and juxtaposition.
The Gullfaks Main Field consists of Brent Group and the underlying Cook, Statfjord and Lunde Formations. Status of different formations in terms of in-place volume, cumulative production, recovery factor and basic reserves is presented in Table 1. The lithology and reservoir properties vary considerably among the formations and within each formation. The lithostratigraphy of the field is shown in Fig. 6. The figure describes the stratigraphy, lithology, permeability, depositional environment and quality of different reservoir units. The variability of some of the important reservoir parameters in different fault segments are shown in Table 2. The reservoir pressure and temperature are around 310 bar and 74oC respectively at the datum depth of 1850m TVD MSL. The oil gravity is between 32-36 oAPI and the initial GOR in Brent is approximately 100 Sm3/Sm3.
The Brent Group represents the main reservoir containing more than 73% of the in-place volumes. The current recovery factor is approximately 60%. It consists of Broom, Rannoch, Etive, Ness and Tarbert. Tarbert and Ness are collectively called Upper Brent and the rest is called Lower Brent. From

SPE 113260 3
production point of view, Broom does not represent any significant reservoir. While vertical communication is seen in Tarbert 3-2, Etive and Rannoch 3-1 zones, it has been affected to some degree in Tarbert-1 and Ness 3-1 due to presence of calcite, coal and shale layers. The impermeable layers are broken down by numerous faults which affect the overall communication pattern.
The Cook Formation is characterized by big permeability contrast between Cook-3 and Cook-2 (Table 2). Internally in Cook-3, there is also big permeability contrast in some of the heterogeneous facies. Frequent calcite layers are observed in both layers which affect the fluid flow in Cook. The overall recovery factor in Cook is much lower than in Brent or Statfjord.
The Statfjord Formation consists of Nansen, Eiriksson and Raude. While Raude is graded as moderate to bad reservoir, Eiriksson and Nansen are considered to be very good reservoirs (Fig. 6). Petrophysical analysis of the faults shows very low permeable siderite filling which is a deciding factor for flow pattern in the Stafjord Formation.
The Lunde reservoir of moderate to bad quality is relatively small compared to other reservoirs on the Gullfaks Main Field. The porosity is in the order of 0.22 to 0.25. The permeability varies considerably from segment to segment ranging from 300 mD to 1900 mD. In large areas the initial water saturation is relatively high (more than 40%), which makes oil production challenging. This formation has not yet been fully developed and therefore, the current recovery factor is relatively low (Table 1). Due to relatively small volumes and difficult saturation distribution, the reservoir will probably be produced commingled with the Statfjord reservoir. Reservoir Management Challenges and Strategies The main reservoir management objectives on Gullfaks have been to maximize profit for the owners, exploite resources to a highest level, secure safe and long term workplace, and execute activities without causing any damage to people, environment and the installations. For a complex reservoir, such as, Gullfaks where uncertainty is high for many key parameters, it is difficult to adopt a concrete but sound reservoir management strategy to meet the aforementioned objectives. In such a situation, the reservoir managers must constantly monitor the reservoir performance and must be ready to modify the strategy based on new data, new requirements and immerging technologies. Keeping this in mind, a flexible reservoir management strategy was adopted from the very beginning which had enabled to make critical adjustments when necessary. In this section, the main reservoir management challenges and the strategies to cope with those challenges are described.
Some of the main challenges on Gullfaks can be summarized as follows:
• Complex structural geology: The reservoir contains a large number of faults. The structural picture is complex and somewhat uncertain due to relatively poorer seismic quality. Placing the wells in the intended reservoir intervals is challenging. Moreover, the communication pattern among different fault segments is very uncertain. Therefore, formulating an
optimum drainage and pressure maintenance strategy is difficult.
• Large permeability contrasts: The permeability in the
high permeable sands is as high as 10 Darcies (Tarbert) while it is only few milli-Darcies in the low permeable zones (lower Cook) (see Fig. 6). This high contrast in permeability causes uneven fluid movement, pressure differential and crossflow in different zones. This creates operational problems and results in poor recovery in low permeable reservoirs. The main challenge is the ability to control and monitor production and injection from different reservoirs. A large number of wells and well intervention operations are needed to achieve an acceptable recovery factor.
• Unconsolidated reservoir sand: The highly productive
reservoir sands are poorly consolidated and after water breakthrough the maximum sand free rate is to be reduced. Therefore, effective sand control is necessary to maintain high production rate.
• H2S content: Massive water circulation creates
favorable conditions for H2S generating bacteria, specially, close to the injection wells placed in the oil zone. As a result, excessive H2S has formed in some part of the reservoir. It is corrosive, harmful to the health and polluter to the export gas and therefore, unwanted in the process installations. This is a growing concern for the late-life production from the field. It is necessary to have an effective strategy to reduce/avoid its production or have an effective plan for its handling.
The strategies to overcome the challenges can be summarized as below:
• Considering the complexity of the reservoir, the main reservoir management efforts were directed towards improving the understanding of the reservoir. Considerable flexibility was introduced in the development plan in order to accommodate changes necessary to reflect the current understanding based on structural and stratigraphic information, and pressure, well log, well productivity, fluid movement, well test, tracer, and other data. Location of new wells and their perforation intervals and completion methods were optimized based on the data from the previously drilled wells.
In order to reduce the risk, a 2-phase development plan consisting of development of the western part from two platforms in Phase-I and the eastern part from a third platform in Phase-II was considered. This greatly helped to optimize the overall development of the field. The initial strategy was to develop the Brent reservoir first starting from the highly productive Lower Brent Formations (Etive and Rannoch). The development would then continue sequentially upward, i.e., Ness and Tarbert
4 SPE 113260
Formations respectively. Early wells revealed a thicker and better Tarbert Formation specially, in the northern parts. This formation is now considered as the main reservoir.
Production from the Statfjord and Cook Formations were planned to start when a plateau production from Brent reservoirs was reached. However, the plan was changed in early 90’s due to severe water breakthrough together with sand production in the Lower Brent producers. Due to sharp decline in oil rate, the development of the Tarbert and Statfjord Formations was accelerated. Sand control measures were put in place in the Lower Brent wells and thus restored the oil rate to the original level. The Ness and Cook Formations were subsequently developed to maintain the oil rate.
Due to extensive faulting, a large number of wells were foreseen on the Gullfaks Field. As a result, the platforms were developed with a total of 136 slots. More than 250 well targets have so far been drilled. Dedicated producers and injectors are normally placed in each reservoir unit. The producers are placed upflank on the structure while the injectors are placed downflank close to the OWC within the same major fault block or communication unit. Long-reach highly deviated and horizontal wells have also been drilled penetrating more than one fault blocks. This has reduced the number of development wells, dependency on reservoir continuity and the need for subsea development.
• Several measures were considered to counteract the
large permeability contrasts among different reservoir zones. In addition to drilling dedicated wells in each reservoir unit, selective perforation was used actively to balance production and pressure support in different sands. Hydraulic fracturing was done at different places to establish communication between low and high permeable zones. Long horizontal wells were drilled in low production sands. PLT logs were run routinely to obtain production profiles along perforation intervals and large number of well intervention operations were carried out to shut-off the high water production intervals. This improved sweep efficiency and oil recovery from the low permeable zones.
It was important at an early stage to establish an economic production level. Therefore, six subsea wells were pre-drilled in the highly productive Lower Brent Formation prior to production startup.
• Sand control measures were undertaken in many of
the production wells. Gravel packing, chemical sand control, sand screens, pre-packed screens and propped hydraulic fracturing were some of the important sand control measures on Gullfaks. Monobore well construction was used to facilitate gravel packing operations.
• A huge amount of chemicals were used to remove H2S from the well stream. Due to emission to water and treatment of huge amount of chemicals, the production from H2S wells was reduced or periodically shut down. Careful selection of the distance between production and injection wells had also been helpful. Biocide injection had been tried but no significant effect was observed. In the meantime, it shows that the mixing of nitrate in the injection water in 1999 slowed down H2S development in the Lower Bent reservoir. Recently, a suction separator has been installed on GFA, but it is too early to conclude its effect on the regularity of the H2S producing wells.
A more detailed account of the reservoir management practices on Gullfaks is given in the next section. An overview of reservoir description and some aspects of reservoir management can be found elsewhere2. Reservoir Management Practices The main focuses of the reservoir management on Gullfaks have been continuous collection of relevant data to minimize uncertainty, revision of management strategies based on new data and knowledge, and application of simple, cost effective and new technologies to maximize economic recoveries. Data acquisition and reservoir monitoring Significant efforts have been made over the years to collect geologic, petrophysical and fluid data, and to monitor fluid movement, pressure alteration and well performance. A brief review of the efforts is given in this section. Geologic data The geologic data, such as, structure maps, gross and net thickness maps, faults maps etc. are essential for creating structural frameworks of the reservoir. Extensive seismic and logging programs were undertaken to acquire those data. The first 3D seismic survey (ST8511) was done in 1985 one year before the production startup. In 1995, the first 4D pilot (ST9508) was acquired over the northern part of the field. The results were so promising that four conventional seismic acquisitions were performed afterwards in 1996 (ST9607), 1999 (ST9901), 2003 (ST0304) and 2005 (ST0504).
A big area under the five fixed installations on the field was not covered by the conventional data. Therefore, three ocean bottom data acquisitions were done in these areas in 2001 (ST0101), 2003 (ST0302) and 2005 (ST0508). Acquisition in 2005 was a repetition of 2003 to evaluate 4D potential in the observation data. One additional objective for 2001 investigation was to utilize multiazimuth components in the observation data to map the Gullfaks Horst Complex. Area coverage of different seismic surveys is shown in Fig. 7.
Both 3D and 4D inversion data exist for the Gullfaks Main Field. The cubes resulted from a 4D simultaneous AVO-inversion performed in 2005-2006. In addition, results from 3D and 4D rock physics inversion are the important data basis on Gullfaks.
PSDM processing has been done on Gullfaks and has showed to be useful to improve the structural picture. In spring
SPE 113260 5
2005, the oldest 3D seismic dataset (ST8511) was PSDM processed (ST05M02). The northwest lines were extended by splicing data from the ST9607 investigation. A new PSDM processing was done in 2006 on ST0504 data with focus on the northern part and the east flank of the Gullfaks structure. In this processing, grid based tomography and detailed velocity cube was utilized to capture the frequent velocity variations. The PSDM data have made significant contribution to the structural picture with better defined deep structures and faults together with more accurate positioning of the structural elements.
The time-lapse inversion is a natural extension of 3D-inversion where different vintages are inverted separately, and then subtracted to obtain the changes. A new inversion technique that inverts simultaneously different angle stacks from different vintages has recently been developed3.
Different seismic data are calibrated against the wells with the help of synthetic seismogram generated from sonic, density and VSP/time-depth data collected from the exploration wells. Structural interpretation is mainly based on ST05M02, ST8511R92, ST9607, partly ST9901 and the ocean bottom seismic (ST0101). However, ST05M02 gives the best structural picture except eastern part of the field where ST9607 contributes the most in the interpretation of the Statfjord Formation and ST8511 (4th wave) generally in the I-segment. There is unsystematic time shift between the cubes and all interpretations are incorporated in ST05M02 to achieve a single velocity model for the whole field.
Structural mapping is based on signal analysis of Base Cretaceous, top Brent, intra Ness reflector, partly bottom Brent, top Cook, top Statfjord, and partly Lunde. I addition, Lomvi and an intra Teist reflectors are interpreted to map the bigger structures with depth. Other horizons are based on isopacks between the interpreted surfaces which are finally adjusted along faults. Core, well log and well test data Intensive coring program was undertaken in most of the exploration wells in order to understand the geology and the rock properties. A huge amount of data has been extracted from core samples of different shapes and sizes. To name a few are the absolute and relative permeabilities, porosity, capillary pressure, facies, rock mineralogy, biostratigraphy, fault information, etc.
Standard logging operations were conducted on the exploration wells. The logs have been extensively used to extract petrophysical data, such as, rock properties, fluid type and fluid saturation, and information about reservoir intervals and thickness. Standard logging operations are routinely done on almost every development well. RST saturation logs are routinely run on selected wells to monitor the saturation change and fluid contact movement. A new interpretation technique has made it possible to distinguish between formation and injection water in flooded zone4. As an example, the time-lapsed saturation logs taken in B-8 in 1989, 1992, 1993, 1994, 1995, 1997 and 2007 are compared in Fig. 8. The oil saturation development over time at five intervals in B-8 (shown by red vertical lines in Fig. 8) is shown in Fig. 9. The figures clearly depict the fluid movement and saturation change over time. This can be very helpful to tune the
simulation model and to locate the current fluid contacts and remaining oil.
Production tests were performed on most of the prospective intervals in almost all exploration wells. The important data collected from those tests are the fluid type and fluid properties, and productivity and effective permeability of the intervals.
Extensive fluid data have been collected from bottom hole, separator and MDT/RFT fluid samples taken from the exploration wells. The important PVT data collected from those samples are the compositions, saturation pressure, gas-oil-ratio, compressibility, density, viscosity, formation volume factor, etc. Fluid samples are occasionally collected and analyzed from the development wells when deemed necessary. Pressure data MDT pressure measurements have routinely been done in most of the exploration and development wells in the important reservoir intervals. The pressure data in the undepleted areas have been very useful to identify initial fluid gradients and fluid contacts. MDT pressure measurements in wells drilled after production start-up has given important clues about fluid communications through different fault blocks. This information has also been very useful to decide on completion strategies of the new wells.
Since the first permanent downhole pressure gauge installed in 1987, most of the production wells are now equipped with pressure and temperature gauges usually 200-600 meters above the top perforation. Gauge pressure and temperature as well as the upstream and downstream choke pressures are continuously recorded for all production wells. The downhole data are invaluable piece of real time information at various locations of the reservoir. These data had been tremendously helpful for reservoir management and thus contributed directly to increased oil production. This has also reduced the need for wireline logging, which is a time consuming, hazardous operation requiring personnel to be present on site. Using permanent cases, a reservoir engineer onshore can initiate and supervise a well test. In addition to reduced need for personnel offshore, the operational hazard is eliminated, the overall safety is improved and the possibility for downtime caused by potential failures is avoided. This is particularly more favorable in high deviated wells where downhole data acquisition would require coiled tubing or snubbing equipment otherwise.
One of the important reservoir monitoring aspects is to identify the degree of communication between the fault blocks. The downhole data have given insight into interwell communication at various locations in the reservoir. The data have also been used to monitor and optimize well performance with time, for transient well-test analysis, to monitor gravel-pack performance and for history matching of reservoir models. The availability of real-time downhole pressure data has made it possible to optimize fracturing operations during execution. For operational reasons, wireline gauges cannot be used while resin-coated sand is pumped. The data from gauges at different fault segments have been useful to calculate pore pressure and optimize mud weight necessary for well control. Without these data, frequent drilling problems could have been encountered in this mature reservoir5.
6 SPE 113260
Tracer data Different types of tracers (PMCP, PMCH, PDMCB, Tritium, for example) were injected in 38 injection wells in the period 1987-2007 and the breakthrough times at different production wells were recorder. Seventeen of these injections were analyzed during 1987-2000 and four types of response curves were interpreted from water tracers. Type 1 response normally takes place in high velocity flow (10 m/day) where the Cpeak is good but the tail is small. This is opposite to Type 2 response which is seen in low velocity flow (1 m/day) where the Cpeak is small but the tail is long. Type 3 response is similar to Type 2 response, but without the tail. No continuous curve is observed in Type 4 response6 (see Fig. 10).
The data provided valuable insight into communication between injectors and producers, as well as relative conductivity of different reservoir intervals. Production / injection data Total surface production of oil and gas are recorded on daily basis and are allocated to individual producers based on choke opening, and observed bottom hole and choke pressures. Approximately one thirds of the produced gas is reinjected to the reservoir and the rest is exported through the Statpipe network. Only a small fraction is used for power generation. The injection gas is measured and allocated to individual injectors based on pressure differential across individual flow meters. Routine separator test are conducted on the production wells to measure oil and gas productions from individual wells. The data is used to adjust the allocation scheme. PLT data PLT data is extremely useful to know the oil and gas contributions from individual reservoir intervals, which contribute to decision-making on zone isolation, selection of perforation intervals of the neighboring wells, and requirement for new injection and production wells. PLT operations are routinely conducted on most of the production and injection wells when deemed necessary. Well completion data The well completion data including perforation intervals are carefully recorded. These data are important input to the simulation models and essential for well intervention and other operations. 4D / 4C seismic 4D seismic has previously been used for reservoir monitoring7. It has been very useful on Gullfaks to identify areas where significant gas saturation changes have occurred and to locate fluid communication paths8. This information is tremendously helpful to get robust history match of the simulation models. Eclipse reservoir simulation models can be reformatted to Segy and time converted using a velocity volume. This technique allows a direct comparison of predicted gas saturation changes with 4D seismic response using visualization tools. 3D visualization of the 4D response is extremely useful to plan new wells avoiding areas where increased gas saturation or pressure depletion is observed. The attribute maps showing the averaged oil saturation within the
Tarbert Formation in 1996 and 2005 are compared in Fig. 11. The red color indicates high oil saturation. The 4D inversion results clearly show how the oil is swept over time and where the remaining oil to be found.
Finding smaller infill drilling targets in a mature field is extremely important to improve the overall recovery. This is particularly important for a segmented reservoir like Gullfaks where 4D seismic can improve the level of confidence significantly. 4D seismic has been widely used on Gullfaks to locate undepleted areas. Later drilling had shown that these attempts were mostly successful. So far 14 wells have been drilled based on 4D seismic. Figure 12 shows some of the drilled wells. All wells have hit their target and most of them produced more than expected. Extra oil from 4D seismic is estimated to be nearly 9 MSm3. Tarbert, top Etive, top Cook and top Statfjord are the formations where 4D has been most valuable. Ness, Rannoch and lower part of Statfjord is more difficult. 4D effects have been seen in areas around injectors were the pressure is significance higher than the initial pressure.
Since the remaining targets in Gullfaks are getting smaller and more difficult to identify, it has become essential to push the time-lapse seismic interpretation towards a more quantitative approach that would improve the vertical resolution and provide a better estimate of the remaining oil saturation in different segments. By integrating geophysical data with data from well logs, well production and injection data, as well as the general geological knowledge, this technique can provide the changes in hydrocarbon saturation and pore pressure.
The newly developed inversion technique and the quantitative approach helps to provide answer to unresolved issues. As an example, C-17 has been used as water injector in Tarbert and Ness since 1993 except for a period of few months in 2004 when 207 MSm3 gas was injected. Shortly after the gas injection, increased gas production was observed in several wells. The incremental oil production in these wells was less than expected and even water production increased in some of the wells. In two years period, only 35% of the injected gas was back produced. If the remaining gas had displaced oil, it should have contributed to 0.43 MSm3 of incremental oil, but only about 0.1 MSm3 was observed. The question was where the gas had gone? The answer to this puzzle came when the 4D-seismic from summer 2005 was interpreted. A gas accumulation in Tarbert upflank C-17 and north of B-28 was identified by the seismic data which was not present in the previous 4D data. By the newly developed seismic inversion technique, the amount of gas as well as average fluid saturations was quantified at three selected points (see Fig. 13). Interpretation of 4D data acquired in 1985, 1996, 2003 and 2005 showed decreasing oil saturation at point A, B and C. At the same time, an increasing water saturation trend was observed upto 2003 data, but it fell significantly in 2005 data. The interpreted gas saturation from 2005 data was much higher at point B than point A and C. The amount of gas in the reservoir was about the same as was missing in the wells. It became clear that the injected water had moved along the bedding plane upflank of C-17 and the gas had flooded more or less the same formation and displaced

SPE 113260 7
mainly water. The results were both comforting and surprising.
Considering all the successes with the previously acquired 4D seismic, a plan has been approved to acquire new data in 2008 covering nearly 400 km2 (full fold 2D coverage). Flooding map Saturation maps are created and routinely updated at individual reservoir unit to reflect the current status of the fluid distribution in the reservoir. A multidiscipline reservoir team comprising geologist, geophysicist, petrophysicist, reservoir and production engineers put together various types of data to establish the flooding maps. The data include, among others, structural framework, sedimentogoly, stratigraphy, reservoir description, initial volume, well position, perforation intervals, production and injection volumes, RST and PLT data, time-lapse seismic, simulation models, etc. It has shown to be a useful tool for effective reservoir management. A flooding map on Tarbert 3/2 is shown in Fig. 14. Model building, updating and history matching Geological and simulation models are essential tools for successful characterization of complex reservoirs. Geological model is used to capture and model detailed geological features and properties, while an upscaled reservoir simulation model is tuned in the history matching process to further characterize some of the unresolved issues9. A history matched reservoir simulation model is a useful tool to the reservoir managers for day-to-day decision-making. Updating of the geological and simulation models is necessary when additional data and new understanding of the reservoir is available. A review of the major geological and simulation model building, updating and history matching efforts is given below.
Reasonably accurate representation of faults requires relatively small grid block sizes. A single model with sufficient grid resolution for all Gullfaks reservoirs, i.e., Brent, Cook and Statfjord is practically impossible to handle with the current computer resources available. These reservoirs are mostly isolated from each other except limited communication at a few places. Some of the wells produce from two or three of these reservoirs, but the contribution from each of them can easily be estimated from production logging. Considering these facts, separate models have been built for Brent, Cook and Statfjord.
Number of full-field and sector models has so far been constructed and used on the Brent reservoir. The first modeling and simulation work started in late 80’s / early 90’s. To overcome some discrepancies and limitations in the earlier models, a comprehensive modeling project was launched in 1993. A multidisciplinary team built a detailed geological model in 1993/94 for the eastern part of the field (H and I fault blocks) honoring the structural orientations, realistic fault geometry and observed communication patterns10. The model consisted of 25 layers (3 to 35m thick) and the areal grid resolution was 70x100m in the oil zone and 120x120m in the water zone. The simulation model (same grid resolution as the geological model) was history matched for pressure, produced volumes and water-cut. Fault transmissibility, rock compressibility, relative permeability and horizontal barriers
were the main tuning parameters in the history matching process. The history match was reasonable for Etive, Rannoch and Tarbert, but it was not satisfactory for the Ness Formation.
A more comprehensive project called Gullfaks Optimum Drainage (GOD) was undertaken in 2000-03 to remodel the Brent reservoir. The objective of the modeling was to build state-of-the-art geological and simulation models fit for IOR/EOR studies. A new geological model (structural and sedimentological) gridded to approximately 25 million blocks was constructed11. Various full-field, sector and cross-sectional simulation models were built and upscaled from the geological model. The areal resolution of the grid blocks was approximately 80x100m. The number of layers in three full-field simulation models was 19, 52 and 104. A number of cross-sectional and sector models were constructed with more refined gridding12. The models were variously run in black-oil, compositional or streamline formulations to study different recovery processes.
History matching of the Gullfaks simulation models is a daunting task due to complex fault system and large number of uncertain parameters. The true nature of the fault intensity is difficult to identify due to limited seismic resolution. It has also been observed that some of the smaller faults can be more sealing than some other larger faults. Finding right fluid communication path through this complex fault system is a task of experienced detectives. A large number of simulations are required to identify the sensitive and appropriate history matching parameters. The parameters that are normally tuned during history matching differ from area to area. Some of the most important tuning parameters, which apply to selected areas, regions, layers or the model as a whole, are: (1) fault transmissibility, (2) permeability in different directions, (3) vertical communication, (4) well productivity index, (5) pore volume, and (6) relative permeability (both shape and end-points).
The basic data that are typically history matched include: (1) MDT/RFT pressure data, (2) production / injection history of all phases, (3) bottom-hole flowing pressure, (4) PLT data, (5) tracer breakthrough time, and (6) 4D seismic response.
Significant resources were directed towards history matching of the GOD models. Due to shorter CPU time, the 19-layer black-oil model was mainly used for this purpose. The 52-layer compositional model is now mostly used for IOR/EOR predictions. The history match achieved in the 19-layer black-oil model is also applied to the 52-layer compositional model. The model is very efficient and the CPU time is only about 15 hours for 20 years of history on a single processor. Very good history match has been achieved in oil, water and gas production / injection at the field and platform levels. The production and pressure match at individual well level is also good except for limited number of wells. As an example, the oil production history match at field and platform levels is shown in Fig. 15.
Other Brent models that are frequently used include sector models for I1 and H1 segments. These models are mainly used for special studies, such as, polymer / surfactant and CO2 flooding. A new modeling of the Brent Formation is currently ongoing.
8 SPE 113260
A comprehensive modeling of the Cook Formation was undertaken in 1996-97. Full-field geological and simulations were constructed. The simulation model was history-matched and used for early well planning and predictions. A remodeling of this reservoir was done in 2005-06 and new geological and simulation models were constructed. The geological model consisted of 207 layers and it was upscaled to a 17-layer simulation grid (8 layers in Cook-3 and 9 layers in Cook-2). The full-field models were constructed in such a way so that three isolated regions, namely, Phase-I area (H & G segments), I1 segment and Phase-II area (J & I segments) can be simulated independently or simultaneously. This enables to make detailed simulation in any region of interest at a low cost. The history matching of the new models and prediction work is currently ongoing.
Early full-field modeling of the Statfjord Formation was done in 90’s, but the history matching of the model was difficult and hence it was not widely used. Other early modeling was done in 2002 on K1/K2 segment and in 2004 on I1 segment. A comprehensive new modeling for the whole Statfjord Formation has been conducted in the recent years. Geological and simulation models consisting of 302 and 54 layers respectively have been constructed. In addition to Statfjord Formation, the models also include Sverdrup on the top and Lunde at the bottom. The history matching and prediction work is currently ongoing. Update of resources and reserves The volume in-place is calculated at detailed reservoir unit level in various fluid segments, for example, Tarbert 1A in H1 segment. The values are normally calculated using the geomodel. Therefore, updating of the geomodel with new structure model, property models (porosity, water saturation), fluid contacts, net-to-gross thickness, etc. results in updating of the in-place volume. Uncertainties in different properties are normally represented by range and Monte-Carlo simulation is applied to obtain the low (P90), expected (P50) and high (P10) in-place volumes.
Recoverable reserves are calculated from distributions in production estimates of current and planned wells. Various tools are used to generate input to the reserve estimation and to check the robustness of the calculations. The mostly used techniques are well test analysis, decline analysis, material balance, history-matched simulation models and integrated production optimization. Decline analysis is a simple and robust technique for short-term prediction of depletion wells. However, it is neither reliable for long-term prediction nor appropriate for new wells and cannot be used to assess upside potential, such as, compositional effects, work-over, GOR control, rate control, etc. Reservoir simulation is applied to check the robustness of decline analysis and to make predictions where decline analysis cannot be applied.
Monte-Carlo simulations are performed to account for uncertainties. The production estimates from decline analysis, simulation and other sources taking account of various uncertainties are input as statistical distributions. Risked STOOIP is used as guidance. Monte-Carlo simulation combines different data sources and predicts the low, expected and high reserves.
The resources and reserves are normally updated every
year. The development of resource and reserve over the years on Gullfaks Main Field is shown in Fig. 16. Improved / enhanced oil recovery practices The application of IOR / EOR methods has been a major focus of the reservoir management strategies on Gullfaks. The potential for IOR / EOR processes are evaluated regularly and applied on the field if deemed feasible. Some of the techniques have already implemented which include water injection, water-alternating-gas injection, huff and puff gas injection, drilling and completion of conventional and advanced infill wells, sand control, selective perforation, re-perforation, zone isolation, etc. Applicability of several techniques is evaluated but later discarded. These techniques include aerobic microbial EOR (pilot), gel blocking (pilot), surfactant injection (pilot) and CO2 miscible injection. Potential for some other techniques is currently under evaluation which include polymer assisted surfactant flooding, water diversion, reverse sweep, linked polymer solution (LPS), low saline water (LSW), etc. These techniques are briefly described in the following section. Water injection The main IOR mechanism on Gullfaks is water flooding maintaining the reservoir pressure above bubble point. Water injection was implemented from the start of Gullfaks production and has been given top priority ever since. Laboratory experiments, early production experience and simulation results showed very high recovery potential by massive water flooding. Saturation logs has later confirmed residual oil saturation as low as 5% in heavily flooded areas.
The water influx due to aquifer expansion is not sufficient to get enough pressure support. During the early production period, it became aparent that the process and water injection capacity had to be upgraded in order to optimize oil recovery. As a result, significant upgrading of process and water injection facilities was done in early 90’s. This has helped to achieve a high recovery factor on Gullfaks.
In general, one injector is placed to give pressure support to a number of neighboring producers. Injectors are placed close to the OWC within the same major fault block or communication unit to achieve full voidage replacement in the same reservoir where production takes place. In good homogeneous reservoir like Tarbert, few high capacity injectors (>10000 Sm3/d) are placed to the west far away from the OWC to provide sweep from west to east. This has resulted in a uniform rise of water level, good sweep and delayed water breakthrough. On the contrary, a closer flooding pattern is used in the heterogeneous reservoirs.
Water has been injected in more than 40 wells on Gullfaks and more than 700 MSm3 of water has been injected into the reservoir as per December 2007. Gas- and water-alternating-gas injection A total of 25 wells have so far been used as gas injector. Three of the wells (A-42, A-22 and C-17) have perforations in both Tarbert and Ness. Other wells have dedicated perforations in different reservoir intervals. Tarbert, Ness, Lower Brent, Statfjord and Cook Formations have 7, 4, 7, 5 and 5 gas injectors respectively. Upto October 2007, the amount of total

SPE 113260 9
injected gas is approximately 13.7 GSm3 (6.0, 2.4, 2.5, 1.8 and 1.0 GSm3 in the aforementioned formations respectively). Approximately 70% of the injected gas is back-produced.
Water-alternating-gas (WAG) injections have so far been performed in 7 wells on Gullfaks since the first WAG pilot in 1991. This has contributed to considerable amount of incremental oil. The scope of WAG is somewhat limited due to availability of injection gas. Gullfaks had a gas sale agreement, but the limited transport capacity and less gas sale in low gas-demand season provided opportunity to inject some gas for increased oil recovery without high economic consequence. The gas injection cycle between two water injection periods varied from few days to few months. Water injection periods were typically longer than gas injection periods.
WAG injection on Gullfaks is mostly concentrated in the Brent Formation. The water flooding in the Lower Brent Formations is relatively less effective due to well-known Etive-Rannoch override where water flows rapidly through the lower part of Etive and upper part of Rannoch13. Gravitational segregation of injection gas gives better sweep in the areas not contacted by water. WAG on Gullfaks also helps to maintain oil production during low gas export period and reduces CO2 tax and storage cost. The injection gas is not miscible with the Gullfaks oil. The main mechanisms of incremental oil recovery by WAG are: (1) draining of attic oil, (2) sweeping of other areas not contacted by water, (3) reduction in water-cut and gas lifting of high water-cut wells14. The WAG contribution to incremental oil is estimated to be approximately 10 MSm3. Huff and puff gas injection Huff and puff gas injection technique (cyclic gas injection and oil production) has been applied on 6 wells on Gullfaks. In late 1980’s gas was injected in a producer in Cook Formation mainly for storage and pressure support. The well was shut-in for a period of time before it was back-produced. The production rate increased during back-production and resulted in a much higher oil recovery from the area than expected. The cause for higher oil production was attributed to gas segregation and better drainage of attic oil. In fact, this phenomenon triggered the study of more active gas injection for increased oil recovery. Infill drilling Significant IOR activities on Gullfaks are related to drilling and completion of conventional and advanced infill wells. Extended exploration activity within drilling reach from platforms was conducted in the recent years to identify undrained volumes. These activities were successful to add significant new volumes. Many of these small and large infill targets were drilled which contributed significantly to improve oil recovery. Both conventional and advanced drilling and completion techniques were applied. Advanced drilling included extended reach well up to 10 km long, “designer wells” with multiple reservoir targets and long high angle and/or horizontal sections, multilateral and multipurpose wells, coiled tubing (CT) drilling, through tubing rotary drilling (TTRD) and underbalanced drilling. Advanced completion included monobore well design, down-hole
instrumentation and control system (DIACS) and expandable liners.
As the field matures, drilling small undrained pockets at a low cost is an essential way to improve recovery. This trigged to initiate a project “Let One Hundred Wells Flow” to identify, map and drain small oil pockets15. Many small targets were identified. CT and TTRD techniques were applied to reach the targets at a very low cost. Ten TTRD wells were drilled in the period 1997-2005. A good number of conventional sidetracts was also done every year. All three rigs have been continuously engaged in drilling since 2006.
Except the early wells, most of the wells on Gullfaks were completed with monobore well design where the 7” liner was directly connected to a 7” tubing to the surface. This had simplified the access to the well for gravel packing, well intervention and sidetracking operations, which resulted in less time for each well intervention operation and hence more frequent intervention operations and infill drilling.
Smart well technology has been used since 1998 and a total of 5 wells on Gullfaks Main Field have been completed with DIACS. This allows controlling the inflow and hence production from individual reservoir units in commingled wells. As a result, the recovery from low permeable reservoirs has increased. The feasibility for DIACS in injection wells is currently under investigation. Hydraulic fracturing of low permeable reservoirs As stated previously, the water flooding in Lower Brent creates Etive-Rannoch override. To reduce flow through Etive and hence improve overall sweep, the producers are normally perforated in Rannoch and communication to Etive is established by propped hydraulic fracturing. This technique is called Indirect Vertical Fracture Completion or IVFC. Some 36 fracture jobs in 20 wells have so far been performed to date. This technique reduces sand production from highly unconsolidated Etive Formation16. Sand control The highly productive reservoir sands are poorly consolidated and experienced sand production after water breakthrough. Since 1988 sand control measures have been undertaken in most of the production wells in these sands. Gravel packing was the mostly used technique for sand control. Several gravel packed wells were later stimulated. The cost involved in gravel packing was high mainly due to rig occupancy. To reduce the dependency on drilling rig, a separate snubbing rig was installed. The operating cost for the snabbing unit was minor compared to drilling rig. At the same time, the drilling rig was free to drill other wells.
Two types of chemical sand control methods were also applied on several wells with some success. These included injection of resin slurries in perforation tunnels and direct injection of consolidating chemicals in the formation.
Sand screens and pre-packed screens are now mostly used due to their effectiveness and cost. Selective perforation, re-perforation and zone isolation In order to increase oil recovery from low permeable zones and to overcome sand production problem in the high permeable, less consolidated sands, the original strategy was
10 SPE 113260
to focus on selective perforation in consolidated sands. The oil in the surrounding high permeable sands was produced through these perforations. Other techniques to improve sweep efficiency was to select perforation and re-perforation intervals of the new and existing wells respectively based on current reservoir characterization and dynamic data from neighboring wells. These techniques helped to achieve high overall sweep efficiency.
Mechanical zone isolation was also applied successfully to improve recovery. Water and/or gas breakthrough occurred in most of the producers. Shutting-off of the high water/gas producing intervals by mechanical plugs (straddles) has been very useful to drain more oil from less-drained intervals. The prospective candidates were under constant surveillance. PLTs were frequently run in these wells to identify worst offended intervals and help making management decisions. Zone isolation in injection wells had also been carried out to effectively change the injection pattern and thereby improve overall sweep efficiency. An impressive number of well intervention operations have been performed on Gullfaks over the years. Fig. 17 shows different types of jobs carried out per year since 1997. GOR management One important IOR practice on Gullfaks is to prioritize low GOR wells. The wells that produce at a very high GOR are normally given less priority, chocked back or even shut. Prioritizing low GOR wells is helpful to recover more oil, specially, from relatively less depleted areas under the current limitations on the platforms. Aerobic microbial EOR A pilot test on aerobic microbial EOR (MEOR) was conducted in 2006 on an isolated segment (segment I1) (see Fig. 5). The reasons to select this segment were: (1) the area was water flooded for several years and the water-cut in the main producer (A-36) was at a stable level of 97%. This would enable observation of MEOR effect quite easily. Reduced injectivity due to change in skin, reduced sea water fraction, less water-cut and increased circulation time for injection water were expected as a result of microbial activity. A reduction in water-cut by 5% within one year of operation was set as criteria for positive MEOR effect, (2) the distance between the producer and the water injector (A-41B) was favorable, (3) the injector was perforated in the oil zone giving possibility for the bacteria to have access to both water (nutrients, oxygen) and oil, (4) A-41B was perforated deeper than A-36 and hence it was most likely that the mobilized oil would be transported to A-36.
The MEOR pilot was designed to inject 6000 Sm3/d of water in A-41B with 850 l/d nitrate/phosphate solution and 98 ml/min air injection (at atmospheric pressure). The pilot was conducted according to plan with insignificant deviations.
The result from MEOR pilot was not very successful but the pilot provided some valuable lessons and insights. No MEOR response was observed on the water-cut or the production profiles from the wells in the pilot area. A-41B did not show any injectivity loss. The possible reasons can be summarized as follows: (1) existing bio-film in the injector might have affected the establishment of a new bio-film
needed for the aerobic process. A high level of H2S was present in the area as a result of long time water flooding. This had possibly reduced oil saturation in the area prior to MEOR pilot due to an anaerobic MEOR process. Laboratory experiments had shown that both sulphate and nitrate reducing bacteria reduced water relative permeability in the same order as aerobic bacteria. They also reduced oil saturation, but not as efficiently as aerobic bacteria. A significant anaerobic growth of bacteria might have already resulted in enhanced sweep before the MEOR pilot. Further, the added oxygen would have been consumed by oxidation of the old bio-film and not by bacterial growth on oil, (2) Water flooding in general is very effective on Gullfaks. Due to extensive water flooding, the residual oil saturation could have reached a very low value, (3) due to Etive-Rannoch override effect, the contact between injection water containing nutrients and oxygen and remaining oil might have been limited causing no MEOR effect. Surfactant injection High permeabily (1–10 Darcy), low oil viscosity (≈ 1.5 cp), relatively low reservoir temperature (≈ 70°C), low salinity of the formation water (≈ 42000 ppm) and moderate to low clay content (5–10%) of Gullfaks sands are favorable for enhanced oil recovery by surfactant or polymer-assisted surfactant flooding (PASF). A single well pilot test (A-15) with surfactant alone was performed during the first half of 1992. The surfactant was successfully injected without any special treatment of the injection water, and the test confirmed that residual oil was mobilized by the surfactant17. The residual oil saturation measured by SWCT method (applying ethyl formate as the reactive tracer) before and after the treatment showed that between 40 and 70% of the waterflood residual oil was mobilized over an interval of 9m in the well. The method has not been implemented at a larger scale, but more studies are currently ongoing, specially, on PASF. Polymer assisted surfactant flooding PASF was studied on Gullfaks in mid 90’s18. Experimental and simulation work was performed to evaluate the potential for PASF. The experimental work comprised core-flooding at different temperatures, pressures, and GOR with a branched sulphonate and xanthan. More than 70% of the waterflood residual oil was recovered. The main conclusion was that the crude-oil price was not high enough for the PASF process to be economically attractive.
Given the fact that the current oil price is high, new studies have been initiated to revisit the PASF potential on the Gullfaks Main Field. Increased oil recovery potential by PASF has been simulated on a limited area. The preliminary results show 3-5% extra oil recovery by this method (Fig. 18). CO2 miscible injection A feasibility study of a large-scale miscible CO2-WAG (MWAG) was conducted in 2002-03. Since the associated gas is immiscible at reservoir conditions and enriching the gas by imported intermediate components deemed too expensive, the focus was diverted towards CO2 injection. A series of PVT experiments and fluid studies showed the minimum miscibility pressure (MMP) of CO2 to be below the bubble point pressure

SPE 113260 11
of 230 bar19. This was much lower than the prevailing reservoir pressure of approximately 300 bar (initial pressure 310 bar). Two Peng-Robinson EOS models with 7 and 10 pseudo components and one SRK EOS with 8 pseudo components were developed and tuned to CCE, CVD, swelling and MMP experiments. However, the Peng-Robinson EOS models were not used because they predicted higher miscible recovery despite they matched experimental data well.
The modeling of the CO2 flooding was done by a series of 2D cross-sectional and 3D sector and full-field models of various grid resolution and run on various formulations, i.e., black-oil, compositional, streamline front tracking and streamline tracer models. A 19-layer (10-60m layer thickness) full-field black-oil model was first history matched and used for water-flood prediction. Then a 104-layer (2m layer thickness) model run on streamline front tracking mode was used to identify MWAG target area, well location, well type and perforation intervals, to calculate connected hydrocarbon pore volume for each MWAG injection location and extract 2D cross-sectional and 3D sector models to study detailed displacement process. Six 2D cross-sectional models were extracted and refined to 12 and 2 meters horizontally and vertically and ran on compositional formulation. Tracer adsorption, timing parameters and solvent efficiency curves for different slug sizes and injection rates were obtained from these models. A 3D sector model with representative dipping was run in streamline front tracking mode to quantify areal sweep efficiency. The results from these models were then fed to a 3-layer full-field model representing the three main reservoir units. The model was up-scaled from the 104-layer model and was run in streamline tracer mode to simulate the effect of miscible displacement at full-field level.
The simulation results showed that the MWAG potential for Brent reservoir with 5 million tons CO2 injection per year over a period of 10 years was approximately 22 and 28 MSm3 to 2020 and 2030, respectively. However, a full-field compositional simulation involving a 52-layer full-field model later predicted an MWAG potential almost half of the value obtained from streamline simulation.
The MWAG project was not implemented on Gullfaks due to marginal economy and high risk. The source of 5 million tons CO2 per year was not readily available. Gel blocking and water diversion (LPS, bright water, Na-silicate) The overall sweep efficiency achievable by normal water injection is moderate at water breakthrough depending upon reservoir heterogeneity. After water breakthrough, the water mainly moves through the shortest and easiest paths leaving behind a large bypassed oil volume. Residual oil saturation in the primary flooded areas is in the range of 10-20%, but it may be 30-50% in the non-primary flooded areas. In water diversion techniques, water soluble chemicals are injected in the reservoir to reduce permeability of the water channels and thereby, establishing new water paths and hence better sweep at micro and macro scales. Linked polymer solution or LPS (polymer and cross linker), bright water (polymer and organic cross linker) and Na-silicate (quartz dissolved in NaOH) are
effective methods to block water production and divert injection water.
LPS is a gel aggregate (commonly referred to as colloidal dispersion gel) containing partially hydrolyzed polyacrylamide (HPAM) at low concentration (300-600 ppm) and cross linking agent aluminum citrate (AlCit)20. The ratio of HPAM/AlCit is 10:1 to 40:1. The aggregates act as resistance to water flow and thus divert injection water into unswept areas.
Bright water is a solution of polymer and surfactant. At a certain temperature, the solution triggers a lumping (popping) process. The lumps block pore throats diverting injection water into poorly swept zones21. For this process to be successful, a temperature gradient between injector and producer must exist.
In Na-silicate process, the quartz is dissolved in NaOH which forms a glass like solution of pH = 10-12. It is injected at a concentration of 0.3-0.5%, but higher concentration can be used if needed. The pore space is sealed by trapping of binary ions and recrystallization of quartz by neutralizing the solution (pH = 7).
Two wells have been successfully treated with silicate on Gullfaks, one (B-5) in July 1993 and the other (A-13) in September 1994. More than 5000 m3 of gelant solution was injected in a high water-cut zone in B-5. The well lifetime increased by 1.5 years, water-cut reduced from over 80% to about 70%, oil rate increased from about 450 Sm3/d to over 700 Sm3/d22. The second well was treated with more than 4000 m3 of gelant solution which also resulted in reduced water-cut and increased oil rate from the Rannoch Formation23. Low saline water (LSW) Improved oil recovery by low saline water injection has received much attention in the recent years. Both laboratory experiments and field tests indicate that water flooding with LSW can improve oil recovery significantly24. The mechanism of improved oil recovery by LSW is not well understood and the effect is field specific. Laboratory experiments have shown that the brine compositions, the extent of dilution, and the fluid and rock properties are all sensitive to the process. Laboratory tests performed on Gullfaks cores are highly encouraging. Further studies and possible pilot test is under consideration. Reverse sweep In a stacked fluvial channel system, such as Gullfaks, the stratigraphic sweep by water is affected by clay content at pore scale to facies association scale. Prolonged water injection in the same direction leaves behind large unsweep volume at different scales. By reversing the direction of injection (and production), the unsweeped oil volumes outside the established water (and gas) channels may be contacted, mobilized and produced. The technique consists of injecting water (or gas) for a prolonged period and then changing the direction of flooding by moving the injection point to get a different drainage direction, e.g., moving the injection point from west to south or north of the producer(s).
The injection and production experiences in few of the Lower Brent wells in H1 and I1 segments indicate that
12 SPE 113260
considerable amount of oil has been mobilized and produced by changing the direction of water injection. Systematic studies are currently ongoing to identify more candidates and to develop a comprehensive strategy for reverse sweeping. Future Considerations Gullfaks ambitions project (GAP) An ambition was set in 2004 for the Gullfaks asset team to recover 400 MSm3 of oil and 30 GSm3 of rich gas from the Gullfaks Main Field. This corresponds to an oil recovery factor of nearly 70%. Keeping this in mind, the GAP project was initiated in 2006 as part of Statoil’s corporate initiative to explore new methods, to find and concretize additional recoverable volumes and remain in the forefront of cutting-edge technologies.
As part of this initiative, the following tasks are to be performed: (1) reservoir characterization and modeling of new Brent, Cook and Statfjord geological and simulation models, (2) evaluation of open and cased hole log data and identification of remaining oil, (3) evaluation of relative permeability curves, (4) evaluation of WAG process, historical data and profitability, (5) possibility for WAG on GFB (implemented on GFA & GFC), (6) study of water based EOR methods (surfactant, polymer, PASF, LPS, LSW, etc.), (7) re-evaluation of CO2 flooding, specially, updip CO2 injection, (8) study of temperature effect of injection water, etc. Gullfaks towards 2030 project In order to maximize the value of the Gullfaks Field, a project called Gullfaks towards 2030 was initiated in 2005. The purpose of the project is to identify critical elements of the Gullfaks infrastructures and resources and to devise a strategy for future operations so that the lifetime of Gullfaks can be extended to 2030. The main tasks of the project are: (1) strengthening of Gullfaks platform facilities for longer lifetime, (2) modification and replacement of drilling equipment, (3) implementation of low pressure production, (4) measures to reduce operating cost, for example, the use of compact technology, etc.
Numerous scenarios are being studied which include a wide range of variables, such as, alternative production scenarios, possibility and timing of outphasing of platforms and satellites, timing of blowdown of reservoirs, gas sales and re-injection alternatives, possibility for low pressure production, and so on. Discussion Thorough knowledge of the geologic structure, rock properties, fluid type and main recovery mechanisms are required to adopt a technically sound reservoir management strategy. The reservoir managers must constantly monitor the state and performance of the reservoir and make necessary changes in the management strategy which is simple, cost effective, conserve reservoir energy and adaptable to emerging technology. Adoptation of five reservoir management principles have led to maximum economic recoveries: (1) conservation of energy; (2) early implementation of simple strategies; (3) sustained and systematic collection of data; (4) continuous application of improved recovery technologies, and
(5) long term retention of staff in multi-disciplinary teams25. Gullfaks reservoir management strategies fulfill all
important management principles. Much emphasis was given for early collection of relevant geologic and reservoir data in order to make a reservoir framework and to devise a simple reservoir management strategy. To minimize risk and to optimize overall field development, a two-phase development plan was chosen, a limited number of wells were pre-drilled and early production experiences were effectively used. This greatly helped to revise surface facilities and development strategy. The initial strategy was to develop the Brent reservoir first starting from the highly productive Lower Brent Formations (Etive and Rannoch). The development would then continue sequentially upward, i.e., Ness and Tarbert Formations respectively. Early wells revealed a thicker and better Tarbert Formation. At the same time the Lower Brent wells showed sand production problem. As a result, the development of the Tarbert and Statfjord Formations was accelerated and sand control measures were put in place in the Lower Brent wells.
The principle of conservation of energy was applied from the very beginning by installing injection facilities and drilling injection wells. These are examples of early implementation of simple strategies to conserve energy. So far the reservoir pressure is maintained close to the initial pressure by water and gas injection. High water and gas producing intervals were shut regularly to avoid excessive gas and water productions. Selective perforation of wells, pressure support in individual fault compartments are also examples of simple strategies.
Much emphasis was given on systematic and sustained collection of relevant data. Extensive 3D and 4D seismic, core and well log, RFT/MDT pressure, RST, PLT, well completion and production/injection data were systematically collected and well-documented. Data collection efforts were always directed towards areas where additional knowledge was needed. For the whole operating life of the field, all these data were routinely used for better reservoir characterization, exploring new possibilities, updating geological and simulation models and so on. All these efforts resulted in progressive improvement of the reservoir management strategies.
Continuous application of improved recovery technologies has been a major focus of the reservoir management strategies. Water injection, WAG, selective perforation, hydraulic fracturing, mechanical isolation of high water/gas producing intervals, water blocking by chemical gels, sand control, surfactant and aerobic microbial pilot tests, infill drilling of conventional and advanced wells are some of the examples of improved recovery practices. Gullfaks has been in the forefront of development and exploitation of new and immerging technologies. 4D seismic data, coiled tubing and through tubing drilling, designer wells, smart wells, etc. has been tremendously useful to achieve a high recovery factor.
The Norwegian Petroleum Directorate (NPD) has an award for improved oil recovery in order to recognizing licenses, companies, projects or individuals that have created additional value on the Norwegian continental shelf through brave actions and plans. In 2005, the Gullfaks license won this prestigious award for its implementation of IOR methods on Gullfaks. Current reservoir engineering efforts have continued
SPE 113260 13
to be in the forefront of technology and several new projects have recently been initiated to find new possibilities, to produce 400 MSm3, and to extend Gullfaks lifetime to 2030. Conclusions 1. Production strategy on Gullfaks is based on sound
reservoir management principles. 2. Best practice reservoir management has led to nearly
doubling of reserves on the Gullfaks Main Field compared to the initial estimates in 1986.
3. Despite extensive faulting and uncertainties in reservoir parameters, the sound reservoir management practices have led to an ambitious goal of recovering 70% of the in-place oil volumes from the major sands in Tarbert, Etive and Nansen Formations.
4. A good partnership of Norwegian companies with shared values and goals for the field has made it possible to implement successful data gathering program, bold drilling and workover practices and improved oil recovery measures.
5. Systematic collection of geological, petrophysical, well completion, production/injection, fluid movement, pressure change and other data over the years have shown to be a great tool for effective reservoir management.
6. Uncertainties have been managed to a great extent by phased development and effective use of early well experiences.
7. Application of various improved recovery methods has increased oil recovery significantly. The methods include 4D seismic, water injection, WAG, infill drilling, smart well technology, tracers, selective perforation, mechanical zone isolation, water blocking by gels, sand control and hydraulic fracturing.
8. Surfactant and polymer assisted surfactant flooding shows good potential on Gullfaks.
9. Aerobic microbial pilot tests has not been successful, but has provided new insights.
Acknowledgment The authors gratefully thank the Gullfaks field operator, StatoilHydro ASA and the partner Petero for permission to publish this paper. The authors would also like to thank all colleagues in StatoilHydro who have directly or indirectly contributed to this paper. Special thanks to Petter Eltvik and Carl Frederik Eek-Jensen for reviewing the manuscript. References 1. Tollefsen, S., Graue, E. and Svinddal, S.: “The Gullfaks Field
Development: Challenges and Perspectives,” paper SPE 25054 presented at the European Petroleum Conference held in Cannes, France, 16 - 18 November 1992.
2. Agustsson, H., Strønen, L.K. and Solheim, O.A.: “The Gullfaks Field: Creating Value through Multidisciplinary Reservoir Management,” paper OTC 10378 presented at the 1999 Offshore Technical Conference held in Houston, Texas, 3-6 May 1999.
3. El Ouair, Y., Buland, A., Osdal B. and Furre, A-K.: “Improving drainage interpretation using a new Bayesian inversion,” paper presented at the 67th Mtg.: EAGE, 2005.
4. Instefjord, R. and Berg, E.: “Reservoir Monitoring Using Time-Lapse Saturation Logs and 4D Seismic Improves Drainage Understanding in the Gullfaks Field,” paper SPE 50667 presented
at the 1998 SPE European Petroleum Conference held in Haag, The Netherlands, 20-22 October 1998.
5. Unneland, T. and Haugland, T.: “Permanent Downhole Gauges Used in Reservoir Management of Complex North Sea Oil Fields,” SPE Production Facilities, August 1994.
6. Cubillos, H., Torgersen. H, Chatzichristos, C., Kleven, R, Dugstad, Ø and Galdiga, C.: “Integrated Approach – Key for Successful Interwell Tracer Project,” paper presented at the Offshore Mediterranean Conference and Exhibition in Ravenna, Italy, 28-30 March 2007.
7. Elde, R. M., Haaland, A. N., Ro, H. E., Ystad, B. And Zachariassen, E.: “Troll West - Reservoir Monitoring by 4D Seismic,” paper SPE 65154 presented at the SPE European Petroleum Conference held in Paris, France, 24–25 October 2000.
8. Todnem, A.C., Arnesen, L. and Gaasø, R.: “4D Seismic and Through Tubing Drilling and Completion Wells Extend Life on the Gullfaks Field,” paper SPE 92551 presented at the SPE/IADC Drilling Conference held in Amsterdam, The Netherlands, 23–25 February 2005.
9. Agarwal, B., Hermansen, H., Sylte, J. E. and Thomas, L. K.: “Reservoir Characterization of Ekofisk Field: A Giant, Fractured Chalk Reservoir in the Norwegian North Sea-History Match,” SPE Reservoir Evaluation & Engineering 3 (6), December 2000.
10. Aabø, A., Espevold, M. and Svinddal, S.: ”An Integrated Approach to History Matching: A Case Study of the Brent Group in the Eastern Part of the Gullfaks Field,” paper SPE 35539 presented at the European 3-D Modeling Conference held in Stavanger, Norway, 16-17 April 1996.
11. Jacobsen, T., Agustsson, H., Alvestad, P., Kaas I., Opdal, S.T. and Stønen, L.K.: “Identification and Modeling of Remaining Reserves in the Gullfaks Field,” poster SPE 65412 presented at the Europec conference held in Paris, France, 24-25 October 2000.
12. Agustsson, H., and Grinestaff, G.H.: “A Study of IOR by CO2 Injection in the Gullfaks Field, Offshore Norway,” paper SPE 89338 presented at the SPE/DOE Fourteenth Symposium on Improved Oil Recovery held in Tulsa, Oklahoma, 17-21 April 2004.
13. Ånes, H.M., Haga, O., Instefjord, R. and Jacobsen, K.G.: ”The Gullfaks Lower Brent Waterflood Performance,” paper presented at the 6th European Symposium on Improved Oil Recovery held in Stavanger, Norway, 21-13 May 19991.
14. Instefjord, R. and Todnem, A.C.: “10 Years of WAG Injection in Lower Brent at the Gullfaks Field,” paper SPE 78344 presented at the SPE 13th European Petroleum Conference held in Aberdeen, U.K., 29-31 October 2002.
15. Vikane, E., Samsonsen, B. and Lorentzen, K.E.: “Through Tubing Infill Drilling as a Method for Increased Oil Recovery on the Gullfaks Field,” paper IADC/SPE 39358 presented at the 1998 IADC/SPE Drilling Conference held in Dallas, Texas, 3-6 March 1998.
16. Bale, A., Owren, K. and Smith, M.B.: “Propped Fracturing as a Tool for Sand Control and Reservoir Management,” paper SPE 24992 presented at the Eoropean Petroleum Coference held in Cannes, France, 16-18 November, 1992.
17. Nordbotten, A., Maldal, T., Gilje, E., Svinddal, S. and Kristensen, R.: “Performance of a Single Well Surfactant Tracer Test in the Gullfaks Field, Norway.” paper presented at the Eighth European Symposium on IOR, Vienna, Austria, 15-17 May 1995.
18. Maldal, T., Gilje, E., Kristensen, R. Kårstad, T. Nordbotten, A. Schilling, B.E.R. and Vikane, O.: “Evaluation and Economical Feasibility of Polymer-Assisted Surfactant Flooding for the Gullfaks Field, Norway,” SPE Reservoir Evaluation & Engineering, April 1998.
19. Al-Assi, A.A., Willhite, G.P., Green, D.W. and McCool, C.S.: “Formation and Propagation of Gel Aggregates Using Partially

14 SPE 113260
Hydrolyzed Polyacrylamide and Aluminum Citrate,” paper SPE 100049 presented at the 2006 SPE/DOE Symposium on Improved Oil Recovery held in Tulsa, Oklahoma, 22-26 April 2006.
20. Pritchett, J., Frampton, H., Brinkman, J., Cheung, S., Morgan, J., Chang, K.T., Williams, D. and Goodgame, J: “Field Application of a New In-Depth Waterflood Conformance Improvement Tool,” paper SPE 84897 presented at the SPE International Improved Oil Recovery Conference in Asia Pacific held in Kuala Lumpur, Malayasia, 20-21 October 2003.
21. Lund, T.A.T., Berge, H.I., Espedal, S., Kristensen, R., Rolfsvåg, T.A. and Stømsvik, G.: “The Technical Performance and Results from a Large Scale Na-silicate Gel Treatment of a Production Well on the Gullfaks Field,” paper presented at the 8th European Symposium on IOR, Vienna, Austria, 15-17 May 1995
22. Rolfsvåg, T.A., Jakobsen, S.R. and Lund, T.A.T.: “Thin Gel Treatment of an Oil Producer at the Gullfaks Field: Results and Evaluation,” paper SPE 35548 presented at the European Production Operations Conference and Exhibition held in Stavanger, Norway, 16-17 April 1996
23. Zhang, Y., Xie, X., and Morrow, N.R.: “Waterflood Performance by Injection of Brine With Different Salinity for Reservoir Cores,” paper SPE 109849 presented at the 2007 SPE Annual Technical Conference and Exhibition held in Anaheim, California, 11–14 November 2007.
24. Robertson, E.P.: “Low-Salinity Water flooding To Improve Oil Recovery—Historical Field Evidence,” paper SPE 109965 presented at the 2007 SPE Annual Technical Conference and Exhibition held in Anaheim, California, 11–14 November 2007.
25. Ezekwe, J.N.: “Applied Reservoir Management Principles with Case Histories,” paper SPE 84148 presented at the SPE Annual Technical Conference and Exhibition held in Denver, Colorado, 5-8 October 2003.
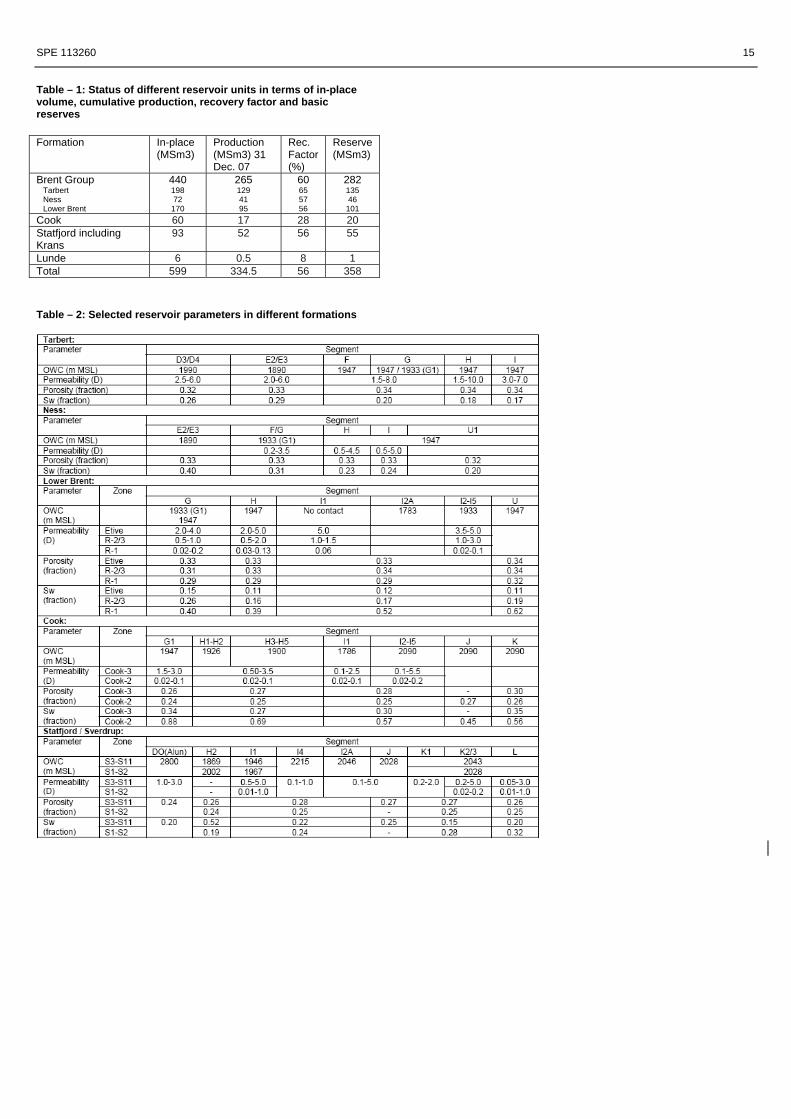
SPE 113260 15
Table – 1: Status of different reservoir units in terms of in-place volume, cumulative production, recovery factor and basic reserves Formation In-place
(MSm3) Production (MSm3) 31 Dec. 07
Rec. Factor (%)
Reserve (MSm3)
Brent Group Tarbert Ness Lower Brent
440 198 72
170
265 129 41 95
60 65 57 56
282 135 46
101 Cook 60 17 28 20 Statfjord including Krans
93 52 56 55
Lunde 6 0.5 8 1 Total 599 334.5 56 358 Table – 2: Selected reservoir parameters in different formations
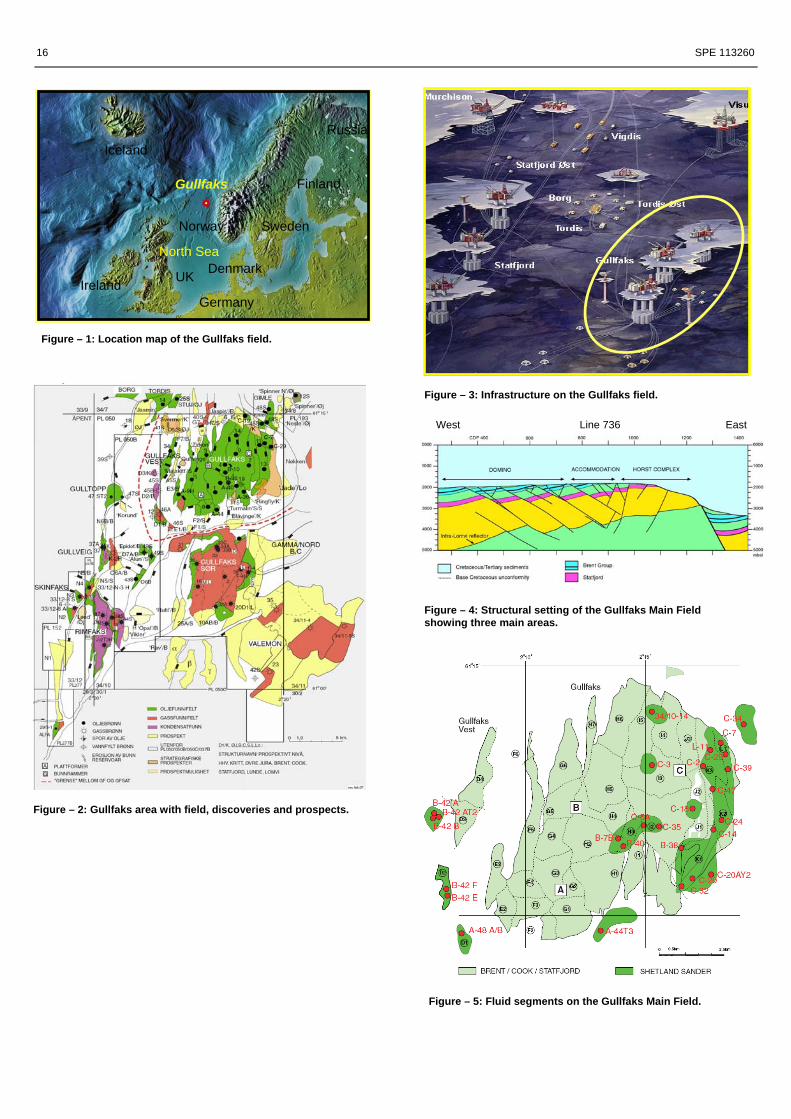
16 SPE 113260
Gullfaks
Iceland
Ireland UK
North Sea
Norway Sweden
Denmark
Germany
Finland
Russia
Figure – 1: Location map of the Gullfaks field.
Figure – 2: Gullfaks area with field, discoveries and prospects.
Figure – 3: Infrastructure on the Gullfaks field.
Figure – 5: Fluid segments on the Gullfaks Main Field.
Figure – 4: Structural setting of the Gullfaks Main Field showing three main areas.
West Line 736 East

SPE 113260 17
Figure – 6: Lithostratigraphy of the Gullfaks Main Field.
Surface seismic 1985, 1996, 1999, 2003
OBS acquired in 2001
OBS acquired In 2003
Shadow area
Figure – 7: Area coverage of different seismic surveys on Gullfaks.
5/89 5/92 5/93 8/94 6/95 7/97 7/07
1868
1881
1895
1908
1922
1935
1948
Figure – 8: RST saturation log taken in B-8 well in 1989, 1992, 1993, 1994, 1995, 1997 and 2007 (light and deep blue colors represent formation water and injection water (sea water) respectively.
0.0
0.1
0.2
0.3
0.4
0.5
0.6
0.7
0.8
0.9
1.0
Dec-88 Sep-91 Jun-94 Mar-97 Dec-99 Sep-02 May-05 Feb-08
Oil
satu
ratio
n (f
ract
ion)
1942 1930 1912 1895 1883
Figure – 9: Oil saturation development over time at five intervals in B-8 well shown by red vertical lines in Fig. 8.

18 SPE 113260
0
10000
20000
30000
40000
50000
60000
70000
80000
07.05.1990 31.01.1993 28.10.1995 24.07.1998 19.04.2001 14.01.2004
Kon
sent
rasj
on n
g/l e
ller B
q/l
0
500
1000
1500
2000
2500
3000
3500
4000
Type 1 Type 2 Type 3 Type 4
Figure – 10: Four types of response curves from water tracers.
Figure – 14: Flooding map on Gullfaks Tarbert-3/2.
X Potential new well location cancelled
Well B-4A successfully drilled in 1999
Well C-26AT2 drilled in 2003
Well C-15C drilled 2003
Well A-29A successfully drilled in 2003
Well B-15AT4 successfully drilled 2003
Well C-44A successfully drilled early 2001
Well A-21A successfully drilled early 2000
Well B-41A successfully drilled late 2000
Well C-43T2 successfully drilled in 2004
Well A-46T2 drilled mid-2000
After 1996 survey After 1999 survey
After 2001 survey After 2003 survey
Figure – 12: Some of the drilled wells based on 4D seismic. Other drilled wells based on 4D response are B-26AT5, B-27AT2, A-7B and C-9AT3 (not shown).
Point B Point A
Point C
Figure – 13: 4D seismic response showing an upflank gas accumulation around C-17. Quantitative analyses of fluid saturations are done at point A, B, and C.
Figure – 11: Attribute maps showing averaged oil saturation within the Tarbert Formation in 1996 (left) and 2005 (right). The red color indicates high oil saturation.

SPE 113260 19
12/86 08/89 05/92 02/95 11/97 08/00 05/03 01/06 10/080
75.0x10
81.0x10
81.5x10
82.0x10
82.5x10
Oil
prod
uctio
n to
tal (
SM3)
E300HIST5 FOPTH FOPT GOPTH GOPTField history Field production GFA history GFA productionGFB history GFB production GFC history GFC production
Figure – 15: Oil production history match at field and platform levels for the Brent model.
230 240211210
230257
284309 317319 321325332342352355357358
530 540564
540
510502
452478
538522
560574 579 588585 581582587582581582583
599
0
100
200
300
400
500
600
700
1980
1981
1982
1983
1984
1985
1986
1987
1988
1989
1990
1991
1992
1993
1994
1995
1996
1997
1998
1999
2000
2001
2002
2003
2004
2005
2006
2007
2008
2009
2010
2011
2012
2013
2014
2015
2016
2017
2018
2019
2020
Olje
(MSm
³)
0
100
200
300
400
500
600
700
Historie Basis profil Reserver STOOIP
Figure – 16: Development of STOOIP and recoverable oil reserves on the Gullfaks Main Field over the years.
0
20
40
60
80
100
120
1997 1998 1999 2000 2001 2002 2003 2004 2005 2006
Year
No.
of j
obs
Snub/RASSandcyclonCTWL tractorWirelinePumping
Figure – 17: Different types of well intervention operations carried out on Gullfaks per year since 1997.
Figure – 18: Single well PASF potential obtained from limited area simulation.
Well oil production rate (Sm3/d)