spc softw are automatic data collection so simple … · automatic data collection so simple the...
TRANSCRIPT

Automat ic Da ta Co l lec t ion So S imple The Graphs Jus t Appear
DATA COLLECTION/ANALYSIS SOFTWARE
S P C S O F T W A R E
QC-CALC is a fully automatic data collection and Statistical Process Control (SPC) software interface for all in-process andafter-process inspection. The automatic database creation, data collection, and data display have been fine-tuned to make theinterface so automatic the graphs just appear. Not one keystroke is needed! When data collection and analysis have to be assimple as possible, QC-CALC is the only logical choice.
QC-CALC is divided into 2 parts that can be purchased together or separately:
QC-CALC Real-Time – Data CollectionQC-CALC Real-Time is used to collect and display measure-ment results from all CMMs, Video CMMs, and in-processinspections without operator intervention. You can createreports and export the data to spreadsheets, databases, andother SPC programs automatically. This means you cantransfer data from all of your measurement machines to anySPC package just by using a single program!
QC-CALC SPC – Historical SPC AnalysisWhat state is your process in? Is it in an ideal state or on thebrink of chaos? QC-CALC SPC can help you answer thesequestions. This is a complete SPC package that analyzes thedata QC-CALC Real-Time collects. Use QC-CALC SPC’s chartsand reports to constantly monitor your process to keep it incontrol.
QC-CALC is perfect for:
• The small shop that has 1 inspection machine – All of yourquality assurance needs can be satisfied with a singleprogram.
• The larger company that has multiple inspection machinesnetworked – Data from multiple inspection machines maybe saved into a single file on the server, and you can runreports from an office computer to keep the interruptionson the inspection machine to a minimum.
• Fulfilling corporate requirements – A Site License combinedwith maintenance and support gives you one solution forall machines currently at your site and for future purchases.QC-CALC can satisfy the corporate requirements by writingthe data to your SQL Server or Oracle database.
• Working together with QC-Gage to give a complete solution –Use QC-Gage to collect data from your hand-held, non-automatic gages and pass the results to QC-CALC tocomplete the inspection process.
• Monitoring what is happening on the shop floor – TheMonitoring option in QC-CALC SPC allows you to monitorthe inspection of parts on all machines in real-time toquickly catch if your process changes.
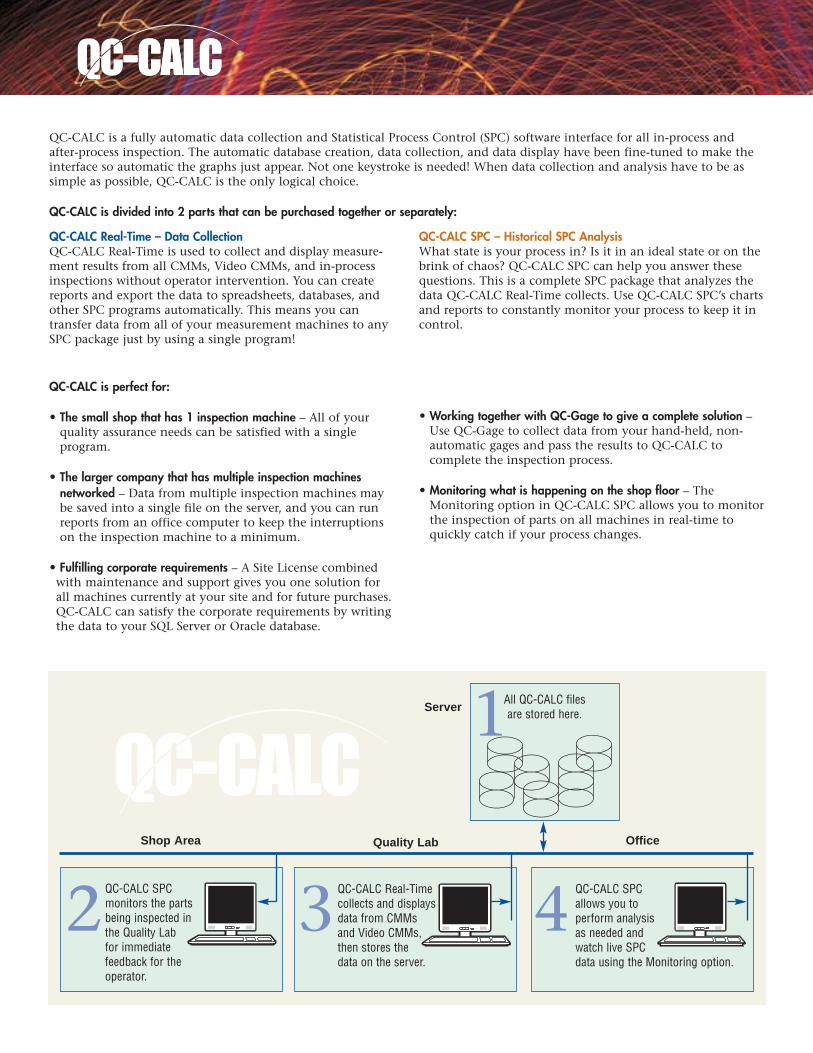
Shop Area Quality Lab Office
ServerAll QC-CALC files are stored here.
QC-CALC Real-Time collects and displaysdata from CMMsand Video CMMs,then stores the data on the server.
QC-CALC SPC allows you to perform analysis as needed andwatch live SPC data using the Monitoring option.
QC-CALC SPCmonitors the partsbeing inspected inthe Quality Lab for immediatefeedback for theoperator.
1
2 3 4

QC-CALC Real-Time offers an advanced view ofyour process. Users can easily view a variety ofgraphs to quickly analyze a part or feature, orview all the features at once. From QC-CALCReal-Time you can:
• Quickly print reports• Save data in other formats• Perform many data analysis functions• Continue to automatically collect data while
performing these functions
QC-CALC Real-Time is One Common Interface for All
QC-CALC Real-Time – Data Collection
D A T A C O L L E C T I O N / A N A L Y S I S S O F T W A R E
Real-Time
Machines Measure &Create Inspection Results
Results are Exported & ReportedTired of dealing with
inspection data?
Let QC-CALC Real-Timedo the work for you!
Oracle, SQLServer, &
ODBCConnections
Q-DAS,VisualSPC,Minitab, &Lighthouse
SPC
Real-Time ReportsSMT Line
Video
All CMMs
QC-CALC Real-Time is used to collect and displaymeasurement results from all CMMs and VideoCMMs without operator intervention. You cancreate reports and export the data to spread-sheets, databases, and other SPC Programs auto-matically. This means you can transfer data fromall of your measurement machines to any SPCpackage using one program!
This is the first program to provide one interfacefor all machines and one interface for all outputs.Our goal is to make your data collection seamlessno matter what equipment you purchase and nomatter what SPC program your company uses asa standard.

Reporting – QC-CALC Real-Time Reporting allows you to printthe following reports manually, or automatically withoutoperator intervention:
Report Formats – The Real-Time and SPC Reports can be printedto the following file formats:
Email Reports – Manually or automatically attach your reports toan email message. This is useful when you want to be notifiedwhen your process goes out of control or tolerance.
Exporting – QC-CALC Real-Time Exporting allows you to exportthe data manually, or automatically without operatorintervention. The following formats are supported:
Trace Fields – Extra non-measurement data (we call Factors) canbe automatically added from the Real-Time screen.
Dimension Filtering – You can now create and save differentcombinations of Dimensions to display and quickly choosebetween the different filters in order to see the critical featuresyou care about.
Record Filtering – Record filtering is now available in QC-CALCReal-Time, so you can show just the data you are interested in atthe moment. A dynamic filter is also available that will changeits criteria based on the record that has just arrived.
Calculated Dimensions – You now have the ability to adddimensions to the database that are calculated based on otherdimensions. You can convert from inches to millimeters byentering the calculation, or add in an offset.
Archiving – The Archiving feature can be set to automaticallycopy any records that have not previously been archived to thearchive folder. This creates another copy of the data in adifferent location for backup or archival purposes.
Real-Time
• Access• Excel• SQL Server• Oracle
• ASCII Text File• Q-DAS• VisualSPC• Minitab
Parts are Inspected Numbers Collected Numbers are Plotted and Analyzed PloParts are Made
• First Article – 1 Piece• First Article – 5 Piece• Stat Summary• Raw Data
• Plot Report• Single-Part Gage Report (P/T Ratio)• Multi-Part Gage Report (P/T Ratio)• Gage Report Tabular Form
• PDF• Excel • HTML• XML • Enhanced Metafile (EMF)
• MIME HTML• Rich Text Format (RTF)• JPEG• Bitmap (BMP)• TIFF
• Lighthouse SPC• DataPage
Monitoring many processes can be time consuming. Let QC-CAL

Manual Dimensions – The Manual dimensions give you the abilityto enter measurements that do not come from the inspectionmachine. These values are plotted like all other dimensions andwill also appear in a grid at the bottom of the screen. This gridis used as the entry area.
Assignable Cause – Assignable Causes and Corrective Actions areadded by right-clicking the plots.
Affixed Windows – QC-CALC Real-Time’s informational and dataentry windows are now permanently affixed to a certainlocation to avoid the confusion of floating windows.
Pre-Control – Pre-control is a technique that is used to detectshifts or upsets in the process that may result in the productionof nonconforming units. The three pre-control zones are set atfixed percentages of the Tolerance.
Range Charts – Range charts are used to display the range of thepoints, in each subgroup, plotted over time. They are displayeddirectly underneath the Average Plots on the Real-Time Plotsscreen.
Sigma Lines on Plots – 1, 2, and 3 Sigma zones can be representedon the Plots by either lines or colored areas.
Trend Analysis – Use any of the Trend Analysis tests below tomonitor your process and have 1 or more actions trigger auto-matically (report, log file, assign Cause or Corrective Action, ordisplay the trend on the plot)
Trends are depicted as thick lines superimposed on the plots asshown above.
ots are Filtered Trends are Monitored Exception Reports are Printed Reports are Emailed to QC Manager
QC Mngr
C Real-Time do the work by alerting you when exceptions occur.
• Drift Trend• Stratification• Mixtures
• Point Outside 3 Sigma• Instability Tests• Cp, Cpk Exceptions

Gage R & R WizardInspection data is useless without first proving the reliabilityof the measurement system on which it is collected. A GageRepeatability and Reproducibility (GR&R) study doesn’t haveto be a painful process. With our new Gage R&R Wizard, wehelp you setup the study, guide you through it, warn you ofpotential problems, and help you analyze the results.
Setting up a Gage R&R study – Before beginning a Gage R&RStudy, the Wizard will help you through a simple setupprocess. You have the ability to specify the following detailsin each study:
• Number of Parts, Trials and Operators in the study• Operator Names• Measurement Order of Parts and Operators• Save the study to use later
Let QC-CALC Guide you through your study – With QC-CALC’sguidance, you never need to worry about all of the combi-nations of Part, Trial, and Operator numbers. The next partfor you to measure is clearly displayed at the bottom of theReal-Time screen, and QC-CALC takes care of the rest.
GR&R Estimate – No one wants to wait until the end of astudy to find out how their gage is performing. Now QC-CALC provides you with an estimated GR&R value that isupdated throughout the study. This allows you to save timeand money by stopping a study where one or more featuresare having a serious problem. The estimated GR&R value isprinted in the graph of each feature.
Analyze the Results – We include a concise report that allowsyou to quickly locate any features that are problem areas forthe machine. You can flag any GR&R values that are over acertain percentage in red.
Prolink Corporation
148 Eastern Blvd • Glastonbury, CT 06033
Phone: (860) 659-5928 Fax: (860) 633-7309
Email: [email protected]
www.ProlinkSoftware.com
Real-Time

CAPTAIN OF INDUSTRY (A) POUNDS DESK TOP (B) FOR BETTER QC (CHIEF INSPECTOR HAS CONCEALED HOT WATERBOTTLE (C) UNDER DESK BLOTTER) PRESSURE OF FIST ON BLOTTER CAUSES WARM WATER TO SPRAY ON WILTEDROSE (D) WHICH BLOOMS – CAUSING HUMMING BIRD (E) TO HOP OFF PERCH (F) AND HOVER OVER BLOSSOMTHUS FANNING WIND CHIMES (G) CAUSING THEM TO RING – WAKING SLEEPING DOG (H) WHO – THINKING IT’S THEDOORBELL RUNS TO SEE WHO’S THERE – THUS TURNING TREADMILL (I) WHICH CAUSES CUPS TO SCOOP UP SEEDS(J) AS BELT (K) BEGINS TO TURN – THROWING SEEDS TO HUNGRY DUCK (L) WHO FLAPS HIS WINGS FOR JOYCAUSING CHUTE (M) TO TIP DOWN ALLOWING CANNON BALL (N) TO FALL WHICH IN TURN PULLS STRING ATTACHEDTO TRIGGER WHICH FIRES GUN (O) SHOOTING BULLET WHICH HITS MOVING TARGET (P) WHICH SENDS SIGNAL TOPRODUCTION LINE TO REJECT – REWORK – OR OK PRODUCT! -HAL ROGERS WITH SALUTE TO RUBE GOLDBERG
QC-CALC SPC – Historical SPC Analysis
D A T A C O L L E C T I O N / A N A L Y S I S S O F T W A R E
What state is your process in? Is it in an idealstate or on the brink of chaos? QC-CALC SPC canhelp you answer these questions. This is a com-plete SPC package that analyzes the data QC-CALC Real-Time collects. Use QC-CALC SPC’scharts and reports to constantly monitor yourprocess to keep it in control.
QC-CALC SPC offers a wide variety of functions toaid your analysis. Clear graphics and informativescreens give you the power to make on-the-spotdecisions. QC-CALC SPC gives you a precise pic-ture of how your production line is performing.
SPC

Reporting Across Multiple Files – Using the reporting functionalityin conjunction with the Grouping capabilities enables you toprint one report displaying data from different files.
Control Charts• Xbar & Range• Xbar & Sigma• Median & Range• Individual & Range• Indiv. & Moving Range• Moving Avg. & Range• Bivariate Analysis
Process Charts• Process Capability (Cpk)• Histogram Analysis• Probability Plots• Pareto Analysis• Correlation & Regression • Raw Data w/ Outlier Detect
Attribute Charts• C Chart• Np Chart• P Chart• U Chart
Miscellaneous Reports• Statistical Summary• Raw Data • First Article• Non-Conformance• Multi-Piece First Article
Grouping – If you’ve ever inspected parts using CMMs, VideoCMMs, and hand gages, you understand the problems asso-ciated with creating a concise summary report from multipledata sources. Now you can open multiple files at the same timeto create a full report across inspection equipment. Using QC-CALC SPC, you can join and name a Group of files and createreports that include data from all these files. Each file is dis-played in a grid or as plots similar to QC-CALC Real-Time.
Monitoring – Monitoring allows you to watch the data live onone computer as parts are being inspected using QC-CALC Real-Time on another. As your CMM runs, QC-CALC Real-Time isupdating its live screens while QC-CALC SPC displays the samedata in another location. This means you have the ability to seethe condition of your inspected parts in real-time from youroffice or maybe at the machining center. You can monitor a sin-gle file, a Group of files, or the inspection machine itself. Youcan see the data in either live plots or in spreadsheet form.
Data Sorting – Sorting enables you to arrange values in an EditData screen into either ascending, descending, or in the orderthat the records were received. You can sort using any columnas a criteria.
Password Protection – The flexible options that make QC-CALCSPC and QC-CALC Real-Time so easy to use can be passwordprotected to eliminate accidental changes.
Language Support – Currently, QC-CALC SPC and QC-CALCReal-Time are configurable to 6 languages:
• English • French • German• Italian • Spanish • Swedish
SPC

Quick Switching for Record Filters – The Select Filter window canalways stay on the screen enabling you to quickly switchbetween record filters you have created.
View Menu – QC-CALC SPC offers 3 different views dependingon the level of user at the machine. • Basic – Limits your abilities to only the bare necessities for
data analysis.• Advanced – Offers you full access to all functions of QC-CALC
SPC.• Custom – Allows your administrator to choose exactly which
menus are right for their users.
Quick Stats – This option enables you to view stats for a selectedgroup of points in the active database file. Simply highlight thepoints you would like stats for and the pop-up screen will showthe information.
Custom Report Generation & Output – QC-CALC’s flexibility indata acquisition and charting carries through to its reportgeneration and output capabilities. A complete WYSIWYGreport designer lets you create and edit your own reporttemplates to satisfy the most difficult reporting needs. Forexample, you can:
• Define the types and contents of the reports to be generated• Generate reports with single or multiple graphs per page• Print reports in color for presentation quality analysis
Database Maintenance – All of the basic functions necessary forremoving unwanted data and combining databases are providedin QC-CALC SPC.• Merge (combine two databases)• Purge (remove all data)• Compact (Removes deleted records)• Restructuring the database (add or remove field items)

QC-SortUsed in conjunction with QC-CALC Real-Time, QC-Sortquickly identifies any bad parts on a multiple part fixture.This makes it easy for your operators to locate and removethe bad parts.
QC-Sort is adjustable and easily configured to display thephysical layout of your parts as they are fixtured. It doesn’tmatter how many features are inspected, if any feature on apart is out of specification that part is considered a bad part.QC-Sort displays the corresponding rectangle for that part inred. All good parts are displayed in green.
QC-AuditQC-Audit gives you the ability to adjust the out ofspecification values after remeasuring parts. QC-CALC Real-Time receives the data directly from your inspectionmachine, then sends all the out of specification values toQC-Audit. Once QC-Audit receives the values, the operatorthen remeasures the features that were out of specificationand enters the new reading. The correct values are then sentback to QC-CALC Real-Time and the database is updated.
Record Filtering Filtering allows you to choose the data that is pertinent toyour reporting needs and eliminate unwanted data. You canestablish filters for the corporate business and shop levels.This makes it possible to standardize the filters company-widethereby standardizing all reports.
Filter Items:• Actual Data Values• Number of Fails• Date & Time Values• Factor Values• Record Numbers
SPC
Prolink Corporation
148 Eastern Blvd • Glastonbury, CT 06033
Phone: (860) 659-5928 Fax: (860) 633-7309
Email: [email protected]
www.ProlinkSoftware.com
Date Filter Items:• Today/Yesterday• This/Last Year• This/Last Month• This/Last Week

QC-Gage is a full-featured data collection programfor use with hand-held gages. The software allowsinspectors to enter measurement data by keyboardor through a direct connection to one or moregages. It displays this data both graphically and intable form, and automatically interfaces with QC-CALC Real-Time. By using QC-Gage and QC-CALC Real-Time, you can identify and isolate out-of-conformance parts or suppliers.
Quick Launch Buttons - You can create buttons toquickly open and run Spec Plans and even includepictures of the part for easy button selection.
Direct Interface to QC-CALC Real-Time – QC-Gageallows you to choose the number of parts toinspect in each session. Once the session isfinished QC-Gage automatically passes the data to QC-CALC Real-Time for display and analysis.
Expandable and Flexible – QC-Gage stores gagedefinitions in external files so you can add newgages without upgrading the software. Prolink isconstantly adding new gage definitions free ofcharge.
Easy to Setup and Use – QC-Gage provides thetools and flexibility you need to easily managedata for virtually any type of part. Using the setupwizard, you quickly construct a specification plan(Spec Plan) that includes a part diagram, cus-tomized instruction, and your own trace fielddetails. During inspection, you make meas-urements as prompted with the ability to re-inspect any values.
Spec Plan Creation – Each spec plan you create is acomplete definition of the part to be inspectedand the process used to inspect the part. You cancreate as many spec plans as needed to supportthe variety of parts you inspect.
QC-Gage allows you to include the following foreach spec plan you create:
• Your description of the part to be inspected• The order of parts vs. features measured• The number of parts to be inspected in a session• Non-measurement data fields (such as Lot
Number, Operator, etc.)• A separate audit file to save inspection results • Text and pictures instruct the user what to do next• Definitions for each feature to be measured
Measurement Feature Definition – When writing anew spec plan, you define each feature in detail.When the spec plan is run, QC-Gage displays theinstructions given for each feature along with anoptional picture. The data is plotted in a graph,which is scaled to the given Nominals andTolerances.
You can include the following information whensetting up a feature definition:
• Operator instructions• A picture for reference• A descriptive label• Nominal and tolerance values• Units of measurement• Number of decimal places• Data source (COM port or keyboard entry)• Offset value to adjust your readings

Live Professional Technical Support• No answering services or machines – We are dedicated to
providing live expert technical support. We have refused tofollow the trend in today’s software industry of automatedtechnical support services.
• Online technical support resources available – If you havequestions or problems you can access our website to usetroubleshooting links, download online manuals, and get up-to-date information concerning QC-CALC software updates.
Prolink CorporationProlink is a growing company that offers easy to use datacollection and analysis software. Our goal is to increase yourawareness of process problems in order to save time andmoney. The key is obtaining the data without adding costand reporting the analysis in a timely manner.
Many other SPC packages perform the same analysisfunctions but none offer the ease of use that has been ourcornerstone. We have listened to your needs and tailored thesoftware based on what we have heard. Since 1983 we havebeen committed to providing a quality software program, no-hassle technical support, and business partnerships that last.
QC-CALC™ is a trademark of Prolink Corporation. Windows© is a registered trademark of Microsoft Corporation. © 2002. Prolink Corporation
Prolink Corporation
148 Eastern Blvd • Glastonbury, CT 06033
Phone: (860) 659-5928 Fax: (860) 633-7309
Email: [email protected]
www.ProlinkSoftware.com
Distributed By:
The Run Screen – The QC-Gage Run Screen is an easy to useinterface that walks an inspector through all the steps nec-essary to inspect a part. As each new feature is measured,specific instructions and a picture for that feature are shown.
When all measurements have been taken the operator isprompted for any non-measurement data. After all infor-mation has been entered, the data is automatically sent toQC-CALC Real-Time for graphing and analysis.
Readings collectedthis session
Picture of Part being measured
Feature specific notes area
Current part andfeature number
Graph to displaygage readings
Area to enter new readings
Non-measurementdata area