spatially explicit assessment of coastal vulnerability ... workshop vafeidis.pdf · spatially...
TRANSCRIPT

Spatially explicit assessment of Spatially explicit assessment of coastal vulnerability – The DIVA-coastal vulnerability – The DIVA-
Med toolMed tool
Nassos VafeidisNassos Vafeidis
Institute of GeographyInstitute of GeographyChristian-Albrechts Christian-Albrechts University KielUniversity Kiel

PlanPlan
Background of the DIVA modelling toolBackground of the DIVA modelling tool Coastal databases and representation of Coastal databases and representation of
coastal spacecoastal space Application and further development of Application and further development of
DIVA within the CIRCE projectDIVA within the CIRCE project MetricsMetrics Future research needsFuture research needs

DDynamic and ynamic and InInteractive teractive AsAssessment of National, sessment of National, Regional and Global Vulnerability of Regional and Global Vulnerability of CoastCoastal Zones al Zones
to Climate Change and Sea-Level Riseto Climate Change and Sea-Level RiseThe DINAS-COAST project (EU / IGBP-LOICZ)The DINAS-COAST project (EU / IGBP-LOICZ)
The ConsortiumPotsdam Institute for Climate Impact Research, Germany (Co-ordinator)Flood Hazard Research Centre, Middlesex University, UKWL|Delft Hydraulics, The NetherlandsThe Centre for Marine and Climate Research, Hamburg University, GermanyThe Free University of Amsterdam, The Netherlands

The Dynamic and Interactive The Dynamic and Interactive Vulnerability Assessment Vulnerability Assessment (DIVA) Tool(DIVA) Tool
Main product/deliverable of DINAS-COASTMain product/deliverable of DINAS-COAST A dynamic, interactive and flexible A dynamic, interactive and flexible
assessment toolassessment tool A CD-ROM that includes: Models, GUI and A CD-ROM that includes: Models, GUI and
databasedatabase It enables consistent and comparative It enables consistent and comparative
analyses of mitigation and adaptation analyses of mitigation and adaptation policies for a range of emission, s-e and policies for a range of emission, s-e and other scenariosother scenarios
User friendly, low requirements so that it User friendly, low requirements so that it can be used by policy makers everywhere in can be used by policy makers everywhere in the worldthe world
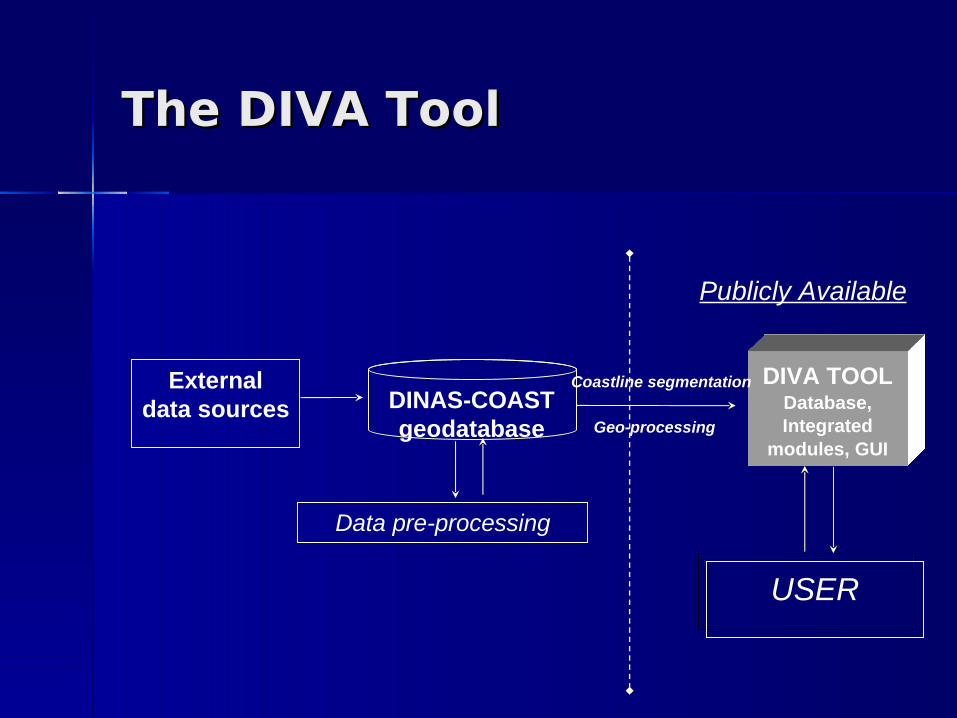
The DIVA ToolThe DIVA Tool
External data sources DINAS-COAST
geodatabase
Data pre-processing
DIVA TOOL Database, Integrated
modules, GUI
USER
Coastline segmentation
Geo-processing
Publicly Available

Schematic view of the Schematic view of the operation of the DIVA tooloperation of the DIVA tool

Limitations for global-scale Limitations for global-scale vulnerability analysisvulnerability analysis
Lack of consistent evaluations of Lack of consistent evaluations of coastal vulnerability at global scalecoastal vulnerability at global scale
Lack of tools and data that address the Lack of tools and data that address the information needs for international information needs for international climate policyclimate policy
Existing data are not directly Existing data are not directly accessible by researchers and policy accessible by researchers and policy makersmakers
Lack of a coherent and non-fragmented source of data input at a global scale

ConsiderationsConsiderations
Representation of coastal space - Representation of coastal space - data modeldata model
Particularities of coastal Particularities of coastal Geographic Information SystemsGeographic Information Systems
Physical & socio-economic dataPhysical & socio-economic data Dynamic nature of the coast – Dynamic nature of the coast –
database updating and upgradingdatabase updating and upgrading

DIVA database for impact DIVA database for impact and vulnerability analysis to and vulnerability analysis to SLRSLR
Global database of physical and socio-Global database of physical and socio-economic parameters of the coasteconomic parameters of the coast
Available at Available at http://www.civil.soton.ac.uk/DIVAhttp://www.civil.soton.ac.uk/DIVA
Fundamentally different structure from Fundamentally different structure from other global databasesother global databases
Make data available to users with low-Make data available to users with low-specification hardwarespecification hardware
Make data available to users with non-Make data available to users with non-specialised softwarespecialised software

Examples of datasetsExamples of datasets
Coastline vectorCoastline vector Elevation, BathymetryElevation, Bathymetry PopulationPopulation Wetland Wetland
characteristicscharacteristics Subsidence/upliftSubsidence/uplift Tidal rangeTidal range World RiversWorld Rivers


SEGID CPC
WMP
S1 S10 S100 S1000 BRF
5106 0 0 0.412 0.512 0.612 0.712 0.000
5115 0 0 0.514 0.655 0.803 0.956 0.000
5120 4 0 0.319 0.419 0.519 0.619 1.000
5132 0 0 0.630 0.758 0.891 1.027 1.000
5166 5 0 0.965 1.087 1.213 1.341 0.100
5167 5 0 0.891 1.020 1.152 1.288 1.000
5202 0 0 0.775 0.875 0.975 1.075 1.000
5168 0 0 1.303 1.427 1.554 1.685 1.000
5169 0 0 0.921 1.055 1.194 1.338 1.000
5171 5 0 1.209 1.410 1.627 1.856 1.000
5172 0 0 1.266 1.408 1.556 1.709 1.000
5173 0 0 1.340 1.490 1.648 1.812 1.000
5175 5 0 1.224 1.388 1.563 1.745 1.000
5177 5 0 1.165 1.306 1.454 1.606 1.000
5178 5 0 0.967 1.130 1.303 1.483 1.000
5179 5 0 1.020 1.192 1.375 1.567 1.000
5180 5 0 1.151 1.316 1.490 1.672 1.000
5181 5 0 1.158 1.299 1.445 1.597 1.000
5203 0 0 1.478 1.578 1.678 1.778 1.000
5204 0 0 0.354 0.454 0.554 0.654 1.000
5218 0 0 0.493 0.593 0.693 0.793 1.000
5221 0 0 0.414 0.514 0.614 0.714 0.000
5265 4 0 0.465 0.565 0.665 0.765 1.000
5266 4 0 0.359 0.459 0.559 0.659 1.000
5267 4 0 0.400 0.500 0.600 0.700 1.000

Estimated People Flooded (per Estimated People Flooded (per year) by surges in 2000year) by surges in 2000


Eastern EuropeEastern Europe
Sand loss totalSand loss total People actually floodedPeople actually flooded
Relative sea-level riseRelative sea-level riseTotal adaptation costTotal adaptation cost

CIRCE – Climate Change and CIRCE – Climate Change and Impact Research: The Impact Research: The Mediterranean EnvironmentMediterranean Environment
Integrated Project – EU FP6Integrated Project – EU FP6 59 Participants59 Participants Economic Impacts – WP10.6, Sea-Level Economic Impacts – WP10.6, Sea-Level
RiseRise Develop DIVA-MedDevelop DIVA-Med
– Updated databaseUpdated database– Improved algorithmsImproved algorithms
Provide an assessment of SLR impacts in Provide an assessment of SLR impacts in the Med & input for CGE modelthe Med & input for CGE model

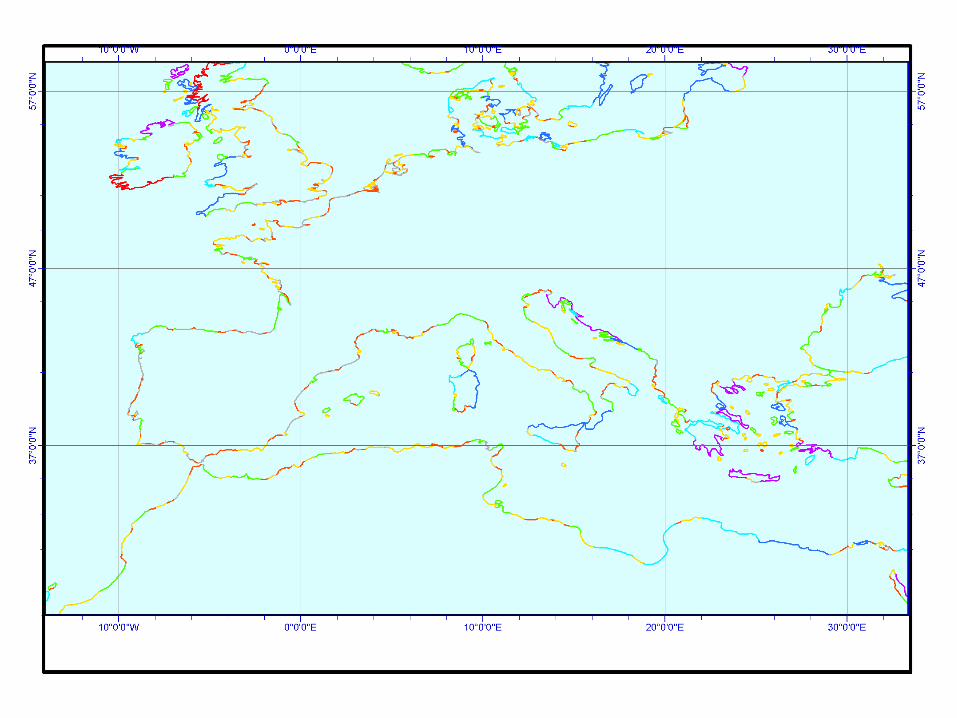
Mediterranean BasinMediterranean Basin
AlbaniaAlbania AlgeriaAlgeria CyprusCyprus EgyptEgypt FranceFrance GreeceGreece ItalyItaly IsraelIsrael LebanonLebanon MaltaMalta SpainSpain Syrian And Arab Syrian And Arab
RepRep TunisiaTunisia TurkeyTurkey
MoroccoMorocco Libyan Arab Libyan Arab
JamahiriyaJamahiriya YugoslaviaYugoslavia Bosnia and Bosnia and
HerzegovinaHerzegovina CroatiaCroatia SloveniaSlovenia MonacoMonaco
CountriesCountries

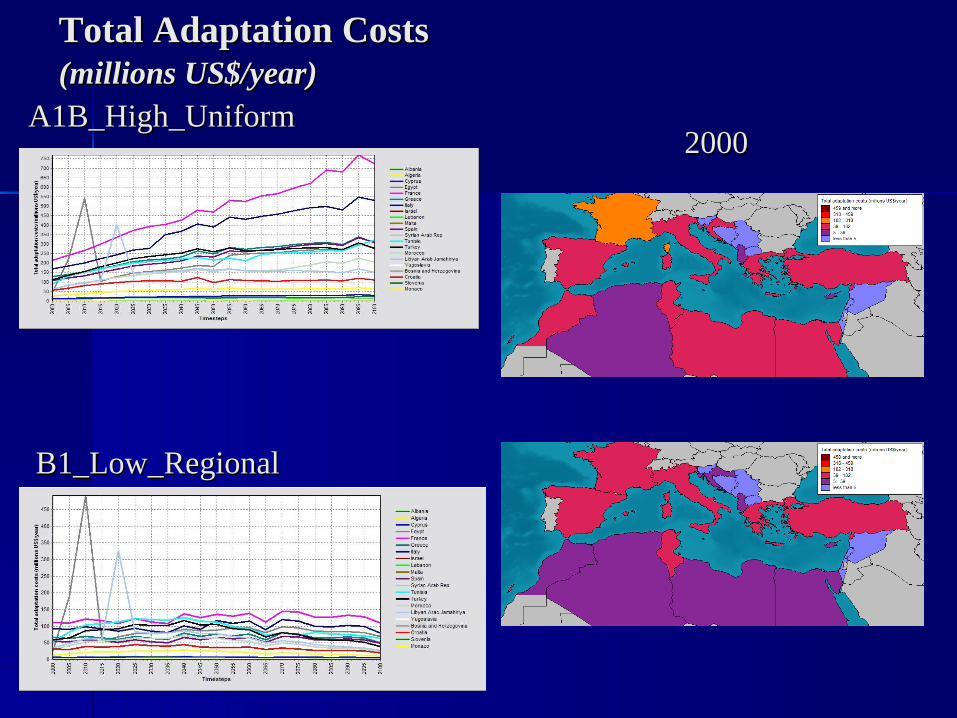
Total Adaptation CostsTotal Adaptation Costs (millions US$/year)(millions US$/year)
A1B_High_UniformA1B_High_Uniform
B1_Low_RegionalB1_Low_Regional
20002000

Metrics for exposure analyses and Metrics for exposure analyses and impact assessmentimpact assessment
Exposure assessmentExposure assessment Impact assessmentImpact assessment ApplicationsApplications Issues of concernIssues of concern
Nicholls et al., 2006, OECD reportNicholls et al., 2006, OECD report

Assessment methodsAssessment methods
Exposure metrics – threatened Exposure metrics – threatened resources assuming no adaptation, GIS resources assuming no adaptation, GIS analysis (with or without scenarios)analysis (with or without scenarios)
Impact metrics – residual impacts after Impact metrics – residual impacts after adaptation responses under relevant adaptation responses under relevant climatic and socio-economic scenarios climatic and socio-economic scenarios and appropriate decision-making and appropriate decision-making approaches (e.g. cost-benefit)approaches (e.g. cost-benefit)
Threshold metrics – (or tipping-point Threshold metrics – (or tipping-point analysis)analysis)

Exposure metrics (for long-Exposure metrics (for long-term sea-level rise)term sea-level rise)
Metric Units
Land area at risk Threatened area (absolute: km2, or relative impact: % available area)
People at risk Number of people (absolute or relative impact: % population)
Ecosystems at risk Threatened area of ecosystems (km2)
Economic value at risk Monetary value (absolute: monetary value or relative impact: % GDP)
Infrastructure at risk Inventory approach (e.g., threatened transport corridors)
Cultural / Heritage at risk Inventory approach (e.g., threatened UNESCO World Heritage sites)

Areas below 10-m elevationAreas below 10-m elevation

Land area below various Land area below various contourscontours
(a)
(b)
(c)

The Thames EstuaryThe Thames Estuary

Flooding in the Thames EstuaryFlooding in the Thames Estuary
Land: 257,077 hectaresLand: 257,077 hectares Population: 2,250,000 peoplePopulation: 2,250,000 people Household places: 1,008,000Household places: 1,008,000 Property losses (2001 prices), Mean Property losses (2001 prices), Mean
house-price in the affected areas: house-price in the affected areas: £183,504£183,504
Triggered further analysis (Dawson et Triggered further analysis (Dawson et al., 2005) and discussions regarding al., 2005) and discussions regarding the planning and design of the the planning and design of the upgrades for the Thames Barrierupgrades for the Thames Barrier


Relative distribution of exposed Relative distribution of exposed land within 10-m of present sea-land within 10-m of present sea-
levels (Stern regions)levels (Stern regions)

Relative Distribution of Exposed Population Within 10-m of Present Sea Levels, by Stern Region

0
100
200
300
400
500
600
700
0 1 2 3 4 5 6 7 8 9 10
metres above mean high water
mill
ions
of
peop
le
0
1
2
3
4
5
6
7
mil
lions
of
squa
re k
ilom
eter
s,tr
illio
ns o
f do
llars
Population, LandScan
Population, GPW3
Area
GDP, PPP
GDP, MER
Observed coastal Observed coastal distributionsdistributions
area, population and GDParea, population and GDP

Impact metricsImpact metrics
Metric Units
Land area loss Lost area (absolute: km2, or relative impact: % available area)
People displacement Number of people (absolute or relative impact: % population). Cost of displacement (absolute: monetary value or relative impacts: % GDP)
Ecosystems loss/change Threatened area of ecosystems (km2). Cost of losses/changes (absolute: monetary value or relative impacts: % GDP)
Economic value loss Monetary loss (absolute costs in monetary terms or relative costs: % GDP)
Human infrastructure loss Inventory of losses (e.g., list of disrupted transport corridors)
Cultural/Heritage loss Inventory of losses (e.g., list of lost UNESCO World Heritage sites)
Adaptation Costs Monetary cost (absolute costs in monetary terms or relative costs: % GDP)

FUND (coastal module) - Analysis of FUND (coastal module) - Analysis of extreme sea-level riseextreme sea-level rise
Tol, 2002; Anthoff et al., 2006

Protected coast under Protected coast under different cost factorsdifferent cost factors
Issues of concernIssues of concern
Optimistic socio-economic scenarios – overemphasise our capability to adapt.
Benefit-cost implies proactive protection – historical experience shows most protection is reactive.
Will more frequent coastal disasters reduce assets at risk (coastal abandonment) – triggering a cycle of decline?
This raises the possible role of thresholds in response to sea level rise, but these issues are poorly understood.

Future researchFuture research
Coastal DatabasesCoastal Databases– Work at larger cartographic scales, nested Work at larger cartographic scales, nested
databases? Deltas, hotspots (nested elements)databases? Deltas, hotspots (nested elements)– Explore links between scales, identify the Explore links between scales, identify the
processes that dominate at different scalesprocesses that dominate at different scales Develop novel tools for risk and vulnerability Develop novel tools for risk and vulnerability
assessment operating at various scalesassessment operating at various scales Identify data and information requirements – Identify data and information requirements –
redefine the role of EO for coastal research at redefine the role of EO for coastal research at all scalesall scales
Thank you!Thank you!
Nassos VafeidisNassos Vafeidis
Institute of GeographyInstitute of Geography
Christian-Albrechts University KielChristian-Albrechts University Kiel
GermanyGermany
[email protected]@geographie.uni-kiel.de