spatial synchrony propagates through a forest food web via
TRANSCRIPT
Ecology, 90(11), 2009, pp. 2974-2983 © 2009 by the Ecological Society of America
Spatial synchrony propagates through a forest food web via consumer-resource interactions
KYLE J. HAYNEs, 1•6 ANDREW M. LIEBHOLD,2 ToDD M. FEARER,3 Gu1MING WANG,4 GARY W. NoRMAN,5
AND DEREK M. JoHNSON 1
'Department of Biology, University of Louisiana, P.O. Box 42451, Lafayette, Louisiana 70504 USA 2 USDA Forest Service, Northern Research Station, 180 Canfield Street, Morgantown, West Virginia 26505 USA
3 Arkansas Forest Resources Center, School of Forest Resources, University of Arkansas, P.O. Box 3468, Monticello, Arkansas 71656 USA
4Department of Wildlife and Fisheries, Mississippi State University, Box 9690, Mississippi State, Mississippi 39762 USA 5 Virginia Department of Game and Inland Fisheries, P.O. Box 996, Verona, Virginia 24482 USA
Abstract. In many study systems, populations fluctuate synchronously across large regions. Several mechanisms have been advanced to explain this, but their importance in nature is often uncertain. Theoretical studies suggest that spatial synchrony initiated in one species through Moran effects may propagate among trophically linked species, but evidence for this in nature is lacking. By applying the nonparametric spatial correlation function to time series data, we discover that densities of the gypsy moth, the moth's chief predator (the whitefooted mouse), and the mouse's winter food source (red oak acorns) fluctuate synchronously over similar distances ( ~ 1000 km) and with similar levels of synchrony. In addition, we investigate the importance of consumer-resource interactions in propagating synchrony among species using an empirically informed simulation model of interactions between acorns, the white-footed mouse, the gypsy moth, and a viral pathogen of the gypsy moth. Our results reveal that regional stochasticity acting directly on populations of the mouse, moth, or pathogen likely has little effect on levels of the synchrony displayed by these species. In contrast, synchrony in mast seeding can propagate across trophic levels, thus explaining observed levels of synchrony in both white-footed mouse and gypsy moth populations. This work suggests that the transfer of synchrony among trophically linked species may be a major factor causing interspecific synchrony.
Key words: Erythrobalanus; food web; gypsy moth; indirect effect; Lymantria dispar; mast seeding; Moran effect; nucleopolyhedrosis virus, NPV; Peromyscus leucopus; red oak acorn; regional stochasticity; white-footed mouse.
INTRODUCTION
In 1953, Patrick Moran proposed that spatially correlated, exogenous effects on population growth can synchronize fluctuations among spatially disjunct populations with similar density-dependent structure (Moran 1953). In the following decades, many empirical and theoretical studies have explored the ability of this process, known as the Moran effect, to explain observations of spatial synchrony in a diversity of study systems (e.g., Grenfell et al. 1998, Bj~rnstad et al. 1999, Hudson and Cattadori 1999, Koenig 2002, Peltonen et al. 2002). Moran effects are generally considered to be caused by the direct effects of weather on the survival and reproduction of individual species. Until Cattadori et al.'s (2005) study, there was little consideration of the possibility that exogenous effects may indirectly synchronize a given species by influencing the abundance of
Manuscript received 12 September 2008; revised 4 February 2009; accepted 9 February 2009. Corresponding Editor: W. D. Koenig.
6 E-mail: [email protected]
resource or consumer species. Cattadori et al. (2005) found that weather synchronized populations of grouse not by directly affecting the survival or reproduction of the grouse, but indirectly by influencing its interactions with a gastrointestinal parasite. Since this discovery, theoretical studies using two-patch (Ripa and Ranta 2007) or metapopulation models (Abbott 2007) have shown that spatial synchrony of a focal species ( due to a Moran effect) may be transferred to a second species via a trophic interaction. Consumer-resource interactions were shown to promote spatial synchrony prior to Cattadori et al.'s (2005) work, but predominantly in the context of a predator that synchronizes prey populations by dispersing among localized prey outbreaks (Y denberg 1987, Ims and Steen 1990).
For many food webs, the task of determining whether spatial synchrony spreads among species via consumerresource interactions would be daunting. Spatial synchrony of the constituent species can also be generated by Moran effects acting on each species or by dispersal of iudividuals between populations (Ims and Steen 1990, Hanski and Woiwod 1993). It is not clear how one would use observational data on population fluctuations
2974
November 2009 SPATIAL SYNCHRONY IN FOOD WEBS 2975
to discern the synchronizing mechanism, and experiments isolating these effects may be impractical (but see Huitu et al. 2005). Furthermore, large-scale spatiotemporal data sets of single species, much less multiple species, are rare. One approach to exploring the consequences of the spread of synchrony among species via consumer-resource interactions would be to combine empirical analysis of patterns of synchrony with mechanistic food web modeling.
The gypsy moth (Lymantria dispar L.) and its natural enemies in North America represent an ideal study system to explore interactions between Moran effects and synchronization via consumer-resource interactions. Gypsy moth outbreaks are known to occur with moderate levels of synchrony over several hundred kilometers (Peltonen et al. 2002, Bjj>jrnstad et al. 2008). Largely because of the widespread forest defoliation associated with gypsy moth outbreaks, the natural history and population dynamics of the gypsy moth and its natural enemies have been studied extensively (reviewed in Elkinton and Liebhold 1990). The gypsy moth's population dynamics appear to be strongly influenced by both generalist rodent predators and a viral pathogen (a nucleopolyhedrosis virus, NPV). Moreover, a mechanistic model of interactions between these species generates periodic outbreaks of gypsy moths with behavior similar to that observed in nature (Dwyer et al. 2004).
We used large-scale spatiotemporal data sets to compare patterns of spatial synchrony in the fluctuations of the gypsy moth, the gypsy moth's chief predator (the white-footed mouse, Peromyscus leucopus Rafinesque), and the primary winter food source of the white-footed mouse (acorns). In addition, we used a simulation model to evaluate whether synchrony in these species can be explained by Moran effects acting on a single species and synchronization diffusing across the food web via consumer-resource interactions. Our results suggest that synchrony in mast seeding of red oaks caused by regional stochasticity is a major cause of synchrony in white-footed mouse, gypsy moth, and NPV populations.
METHODS
Study system
Gypsy moth population cycles are thought to be driven primarily by their interactions with specialist pathogens such as NPV (Dwyer et al. 2004 ). The disease caused by NPV has been observed in North America since the early 1900s (Glaser and Chapman 1913, Doane 1970). Virus-induced mortality increases rapidly with increasing gypsy moth density and ultimately terminates gypsy moth outbreaks (Elkinton and Liebhold 1990). Whereas specialist pathogens are implicated in generating gypsy moth cycles, the timing of the onset of outbreaks may be mainly influenced by generalist rodent predators (Elkinton and Liebhold 1990, Elkinton et al. 1996; Bjj>jrnstad et al., in press). When gypsy moth
population density is low, predation on pupae by generalist rodents (primarily the white-footed mouse) is the largest source of mortality and principle determinant of gypsy moth population growth. Gypsy moth populations are most likely to increase toward outbreak levels if predator densities are low. In the eastern United States, populations of the white-footed mouse crash approximately every 4--6 years (Wolff 1996, Elias et al. 2004). These mouse population oscillations are attributed, in part, to mast seeding (i.e., synchronous production of large crops of seeds) in oaks; mice are dependent on acorns for overwinter survival (Elkinton et al. 1996, Wolff 1996, Jones et al. 1998, Elias et al. 2004, Clotfelter et al. 2007).
Patterns of synchrony in acorns, mice, and gypsy moths
Time series data derived from several field studies (Table I, Fig. I) conducted in eastern deciduous forest were used to explore patterns of spatial synchrony in acorn production, white-footed mouse populations, and gypsy moth populations. Because acorns of the Erythrobalanus_ subgenus (hereafter red oaks) are particularly critical for the winter survival and density of granivorous rodents (Shimada and Saitoh 2006), we used acorn time series in which the acorns were all or predominantly red oak. We used the fraction of forest defoliated within 64 X 64 km quadrats (n = 70) as a proxy for gypsy moth density (Peltonen et al. 2002, Johnson et al. 2006). Levels of defoliation were obtained by analyzing annual aerial defoliation survey maps from the northeastern United States over a period of 31 years (1975-2005). These maps were digitized and represented as sequential raster layers in a geographical information system. Analyses here were restricted to regions designated as part of the 1975 "generally infested area" in USDA gypsy moth quarantine regulations (U.S. Code of Federal Regulations, Title 7, Chapter III, Section 301.45). Data from areas more recently infested by the gypsy moth were not included in our analysis because they have only a short history of defoliation. We also excluded any quadrats in which fewer than three defoliation events were detected. Additional details of the methods used to quantify defoliation levels are found in Liebhold et al. (1997) and Johnson et al. (2006).
We evaluated the manner in which the synchrony in acorns and gypsy moths declined with increasing distance between study locations using the nonparametric correlation function (NCF; Bjj>jrnstad et al. 1999). We obtained confidence intervals for the correlation functions using bootstrap resampling based on 1000 iterations. The number of white-footed mouse time series was too small (n = 5) to compute the NCF, hence the synchrony-distance relationship in mice was evaluated using linear regression. Because sampling procedures varied from study to study, correlation functions calculated based on the raw data would likely introduce bias. Therefore, the time series were standardized (after

2976 KYLE J. HA YNES ET AL. Ecology, Vol. 90, No. 11
TABLE I. Description of time series data sets of red oak (Erythrobalanus) acorn, white-footed mouse (Peromyscus leucopus), and gypsy moth (Lymantria dispar) populations in the United States.
Location
Red oak acorns North Carolina Pennsylvania Pennsylvania Missouri Maryland Maine Virginia and Maryland
White-footed mice Vermont Ohio Virginia Pennsylvania Maine
Gypsy moths Northeastern USA
No. locations
I I I 1 I 1
36
70t
t Number of 64 X 64 km forest quadrats.
log transformation) such that each had a mean of O and a standard deviation of 1.
Modeling environmental stochasticity
The effects of environmental stochasticity on the synchrony of acorn production and populations of the white-footed mouse, gypsy moths, and NPV were simulated in a one-dimensional landscape of 300 discrete patches (neighboring patches separated by 5 km). Environmental stochasticity was modeled based on temperature and precipitation observations coincident with the range of the gypsy moth in North America (Peltonen et al. 2002). Temperature and precipitation influence gypsy moth densities (Elkinton and Liebhold 1990) and are considered to be the chief environmental conditions influencing spatial and temporal patterns of mast seeding (Koenig et al. 1999, Koenig and Knops 2000, Kelly and Sork 2002). Because the relative importance of temperature and precipitation to the full suite of species in this system are unknown, the model was parameterized such that the correlation in simulated weather matched the average of the correlations of these two variables. The average of the correlations of temperature and precipitation did not approach l for adjacent quadrats (Peltonen et al. 2002). Thus, we modeled total stochastic variation in the population growth rate of species x in patch i in year t, represented by Vx,i,t, as the mixture rLx,i,t + (l - r)Rx,i,t, where Lx,;,1
and Rx,i,, represent local and regional stochasticity, respectively, and r is the relative importance of local vs. regional stochasticity. The variables Lx,;,, and Rx,i,t are both zero-mean, random normally distributed variables with variance ( cr2) arbitrarily set at 0.1. The ratio oflocal to regional stochasticity, which is controlled by r, was set at 30%:70% to match the observed level of spatial correlation in weather (Peltonen et al. 2002). The values
Time period
1962-1973 1968-1994 1974-1986 1981-1988 1986-1996 1983-2002 1972-2000
1979-1994 1973-1995 1979-1993 1979-1999 1984-2005
1975-2005
Data source
Beck (1977) Cogan (1995) Drake (1995) Sork et al. (1993) Healy et al. (1999) Elias et al. (2004) Fearer et al. (2008)
Brooks et al. (I 998) Lewellen and Vessey (1998) Wolff (1996) Merritt et al. (2001) Elias et al. (2004)
Johnson et al. (2006)
representing local (Lx,;, 1) and regional (Rx,;,,) stochasticity were drawn separately for acorns, mice, gypsy moths, and pathogens because it is not known whether identical weather conditions would have the same or even similar effects on the growth of these populations.
Following Abbott (2007), the regional component of stochasticity in weather acting on species x patch i in year twas modeled as Rx,i,t = Ex,,(i), where Ex,h) is the ith element of a multivariate zero-mean, normally distributed random variable with variance-covariance matrix C. The covariance in stochasticity acting on patches i and j in year t decreases with distance (d;,) according to the equation C(i, j) = cr2exp(-gd;,), where g is a constant that controls the rate at which the covariance decays with distance. We approximated observed levels of synchrony in actual weather data (June mean temperature and June precipitation; Peltonen et al. 2002) from the gypsy moth's range by setting the covariance decay parameter, g, to 0.00125. This resulted in a close match between the nonparametric correlation functions estimated from simulated stochasticity (ev) and the mean of the nonparametric correlation functions for temperature and precipitation.
To mimic the periodic nature of fluctuations in the production of red oak acorns (Appendix A), acorn dynamics were modeled using a spatially extended stochastic second-order log-linear model (Royama 1992):
X;,, = ~o + (1 + ~,)X;,,-1 + ~2Xi,1-2 + Vx,i,t· (1)
The variable X;,, = log(A;,,), where A;,1 is the abundance of acorns at patch i in year t. The intercept term, ~0, was set to 3.3 because the resulting periodicity of gypsy moth populations in model simulations closely matched the periodicity of natural populations. The parameters ~, and ~2 represent the strength of density dependence at

November 2009 SPATIAL SYNCHRONY IN FOOD WEBS 2977
• Mouse sites
• Acom sites
'1
I Jj •
I \
/'
I 1
0 125 250 1000 km ·--==---=::JI----======== .. ---500 750
FIG. I. Source locations of red oak acorn (Erythroba/anus), white-footed mouse (Peromyscus /eucopus), and gypsy moth (Lymantria dispar) abundance data sets. For each forest quadrat (black outlined squares), the percentage of forest canopy defoliated was used as a proxy of gypsy moth abundance in a given year. Areas defoliated by gypsy moths between 1975 and 2005 are marked in brown.
time lags of one and two years, respectively. To mimic the magnitude and five-year period of fluctuations in acorn abundance we set p1 and P2 at 0.6 and -0.9, respectively.
Because numerical responses of generalist mammal predators to increases in gypsy moth abundance are highly constrained (Elkinton and Liebhold 1990), we assumed that gypsy moth abundance had no effect on the population growth of the mice. Based on statistical analysis of a 13-year data set on acorn and white-footed mouse density (Wolff 1996), Schauber (2001) found that the density of white-footed mice was most parsimoniously modeled as a linear function of acorn density (see also Clotfelter et al. 2007). More complex models with density-dependent effects on mouse population growth provided only slightly better fits. than the simple linear regression model. Thus, we modeled mouse density (Mu) as
M;,1 = ( q + mA;,,-1 )exp( Vx,i,t). (2)
We used Schauber's (2001) empirical estimate for the regression coefficient (m = 0.6). However, because we found that model runs using the empirical estimate of the intercept (7.28) resulted in predator densities so high
that the gypsy moth did not exhibit outbreaks, we set q = 0. The r2 values of the relationship between acorn density and mouse density produced from trial runs of the model (r2 = 0.84 ±: 0.02 [mean ±: SE], n = 10) corresponded closely with Schauber's (2001) empirical estimate of r2 = 0.79.
To model interactions between gypsy moths, whitefooted mice, and NPV, we spatially extended a model developed by Dwyer et al. (2004 ). The fraction of larval gypsy moths infected by NPV, /(N;,,, Z;,,), varies with larval and pathogen density in patch i in year t (N;,, and Z;,1, respectively) according to
{ 1 }~ 1 -J(N;,,,Z;,,) = 1 +k [N;,,f(N;,,,Z;,,) +Z;,,] (3)
where k is the inverse squared coefficient of variation of the transmission rate (Dwyer et al. 2004). The density of larvae surviving to the pupal stage in patch in year t is then
Nf,, = AN;,,[1 -I(N;,,,Z;,1)] (4)
where A is the gypsy moth's finite rate of increase. The density of pathogens in patch i in year t + 1 is given by

2978 KYLE J. HAYNES ET AL. Ecology, Vol. 90, No. 11
1.0
0.8
0.6
0.4
§ 0.2
~ ~ 0.0
8-0.2 -0.4
-0.6
-0.8
-1.0
0 200 400 600 800 1000 1200 1400 1600 1800
Distance (km)
FIG. 2. The spatial correlation function of red oak acorn density data. The upper and lower lines represent 95% bootstrap confidence intervals.
Zi.1+1 = ¢Ni,,I(Ni,1, Zi,,), where ¢ is the between-season growth rate of the pathogen (Dwyer et al. 2004). Accounting for local and regional stochasticity, the full model of virus dynamics is then
Zi,1+1 = ¢Ni,,I(Ni,1,Zi,1)exp(vx,i,1). (5)
To model predation of gypsy moth pupae by whitefooted mice we use a type II functional response (Elkin ton et al. 2004, Schauber et al. 2004) instead of the type III functional response assumed by Dwyer et al. (2004 ). The instantaneous rate of predation for the type II model is given by Mi_,ac/(c + N[,,) and the per capita probability of escaping predation is exp(-Mi_,acl'lt/(c + N!,,)), where N!,, is given in Eq. 4 (Bjprnstad et al., in press). Here, l'lt is the duration of the pupal stage ( - I 0 d), and a and c are constants determining the predator's maximum attack rate and half-saturation point. The functional response for which the maximum predation rate (=l - exp(-aM/2)) and the half saturation point occur at the same prey densities that they do in Dwyer et al.'s (2004) type III functional response, but having type II form is given by ab(2 + v3)Mi,,/2[N[,, + b(2 + y])], where c = b(2 + y]) (Bjprnstad et al., in press). Our model of adult gypsy moth dynamics (including local and regional stochasticity) is then
, { ab(2 + v3)M;,, } N;,1+1 = N;,,exp - [ ] exp(vx,;,,). (6)
2 N[, + b(2 + vJ)
We used values for the parameters in Eqs. 3-6 that are similar to estimates derived from field experiments (Elkinton et al. 1996, Dwyer et al. 2004; k = 1.06, a = 0.98, b = 0.05, "A = 74.6, and ¢ = 21.33). To prevent extinctions of populations and to mimic the magnitude of density fluctuations observed in gypsy moth popula-
tions in nature, we set minimum allowable densities of 0.1 and 0.0001 for gypsy moths and NPV, respectively.
Due to the limited mobility of gypsy moths (females are flightless in North American populations) and mice, dispersal of these species is not likely to explain observations of synchrony in gypsy moths over broad geographic areas (Peltonen et al. 2002). In addition, although the rate of spread of NPV appears to exceed that of ballooning gypsy moth larvae (Dwyer and Elkinton 1995), pilot modeling studies indicated that dispersal of NPV did not have a synchronizing effect on gypsy moth populations (K. J. Haynes, unpublished data). Therefore, dispersal was not included in our model.
Initial densities for each species were drawn from random normal distributions, and the model was run for 150 generations. To reduce the influence of transient dynamics resulting from initial conditions, the first 50 years of data from each time series were discarded prior to statistical analysis of the time series. Then, to evaluate the impacts of the spread of Moran-effect-induced synchrony through ecological interactions, we systematically removed the effects of regional stochasticity from one species at a time by setting the relative importance of regional stochasticity (1 - r) to zero and the relative importance of local ·stochasticity to I. For each replicate simulation of the model, we evaluated ho·w synchrony in each species declined with increasing distance between patches using the nonparametric correlation function (Bjprnstad et al. 1999).
RESULTS
Spatial synchrony in acorn, mouse, and gypsy moth dafa
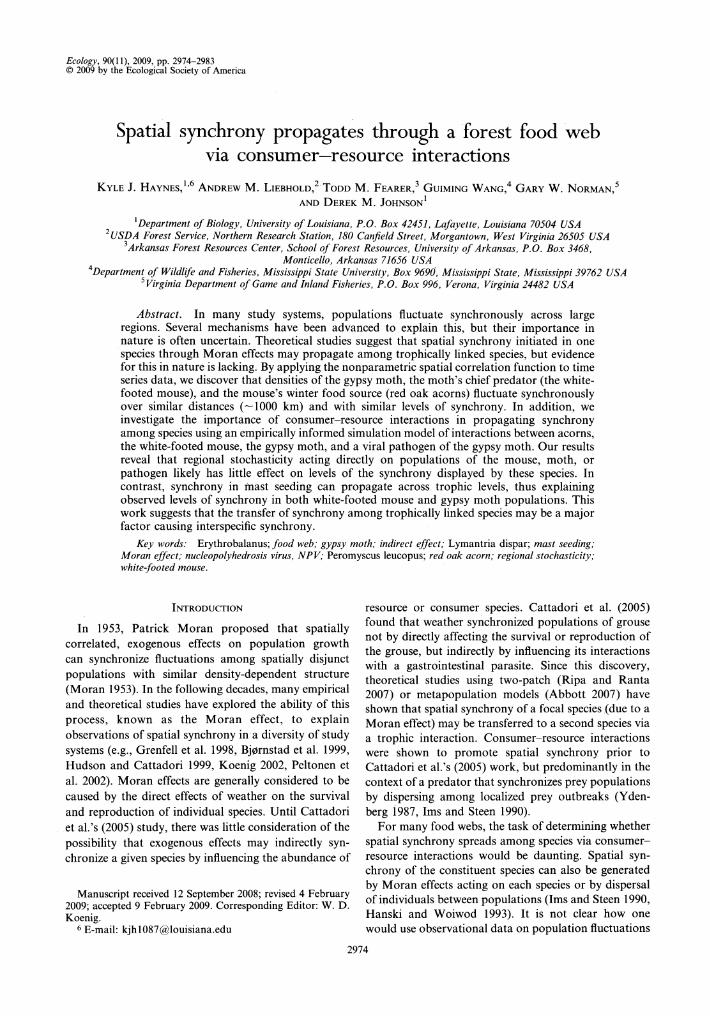
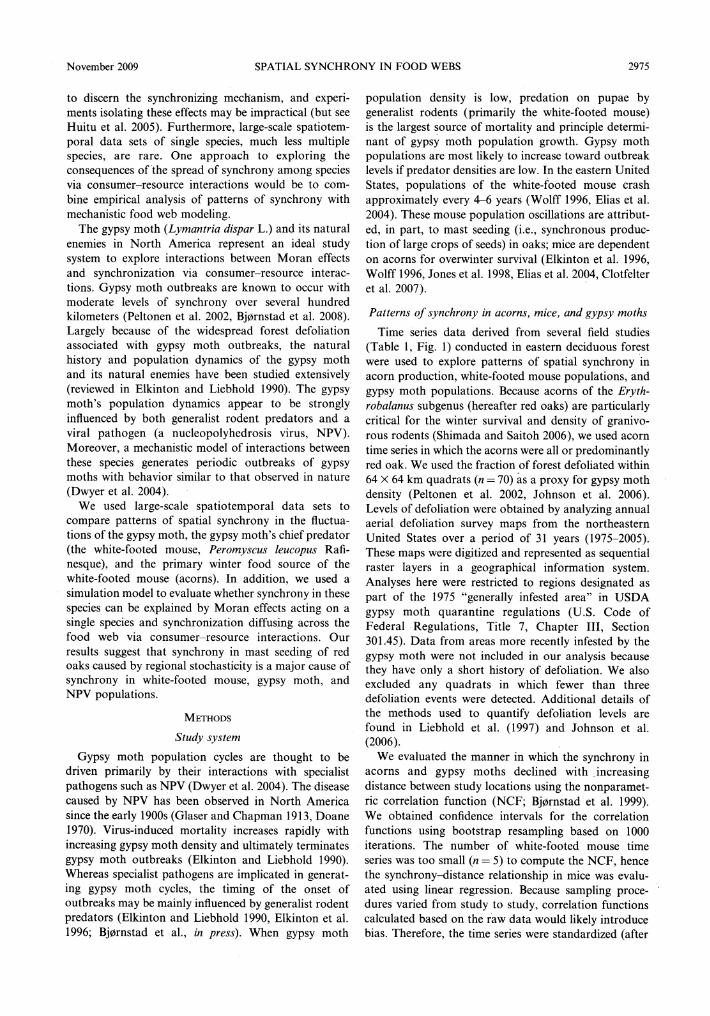
Spatial synchrony generally decreased with increasing lag distance at each trophic level (Figs. 2-4 ). Whereas spatial synchrony of the white-footed mouse appeared to decline linearly with increasing lag distance (correlation= -0.0007 X distance (km)+ 0.62, P = 0.006, n = IO, r 2 = 0.64), the rapid declines in the synchrony of the acorn and gypsy moth data at short distances were followed by slowly declining or steady levels of synchrony (Figs. 2 and 4 ). Synchrony appeared to increase with increasing lag distance in the acorn data at lag distances > 1000 km, but there was substantial uncertainty at these long lag distances (Fig. 2). The lag distances at which the spatiotemporal correlation declined to O did not differ strongly among species. For both acorns and the mouse, the correlation declined to Oat lag distances of -1000 km (Figs. 2-3), though for the acorns the correlation was not significantly different from O for lag distances >500 km (Fig. 2). Spatiotemporal correlations in the gypsy moth data were >0 over the full range of observed lag distances 0-960 km and significantly greater than O up to a lag distance of -900 km (Fig. 4).
Levels of synchrony in the acorn and mouse data were very similar for lag distances < 1000 km. The gypsy moth showed higher levels of synchrony than both acorns and the white-footed mouse; however, the
November 2009 SPATIAL SYNCHRONY IN FOOD WEBS 2979
0.6
0.4 C: 0 '5i 0.2
~ 0 0.0 (.)
-0.2
-0.4
-0.6 +---~--~--,---~--~---I 200 400 600 800 1000 1200 1400
Distance (km)
FIG. 3. Relationship between population synchrony (correlation) and distance estimated from white-footed mouse data. The upper and lower lines represent 95% confidence intervals.
confidence intervals for all three correlation functions overlapped extensively.
Spatial synchrony in simulated populations
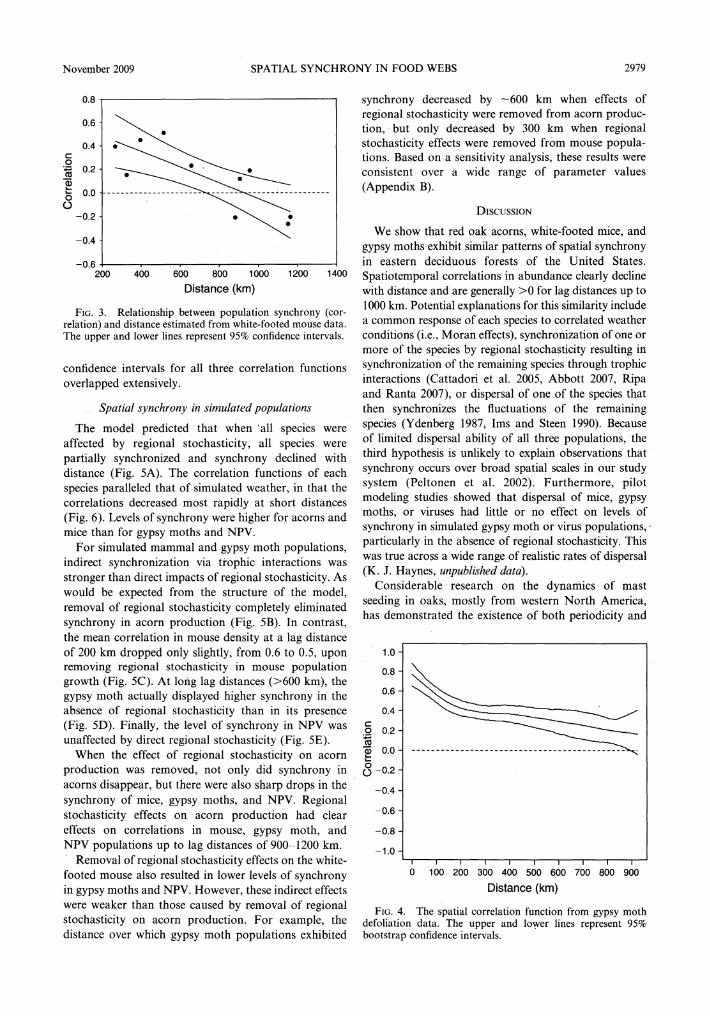
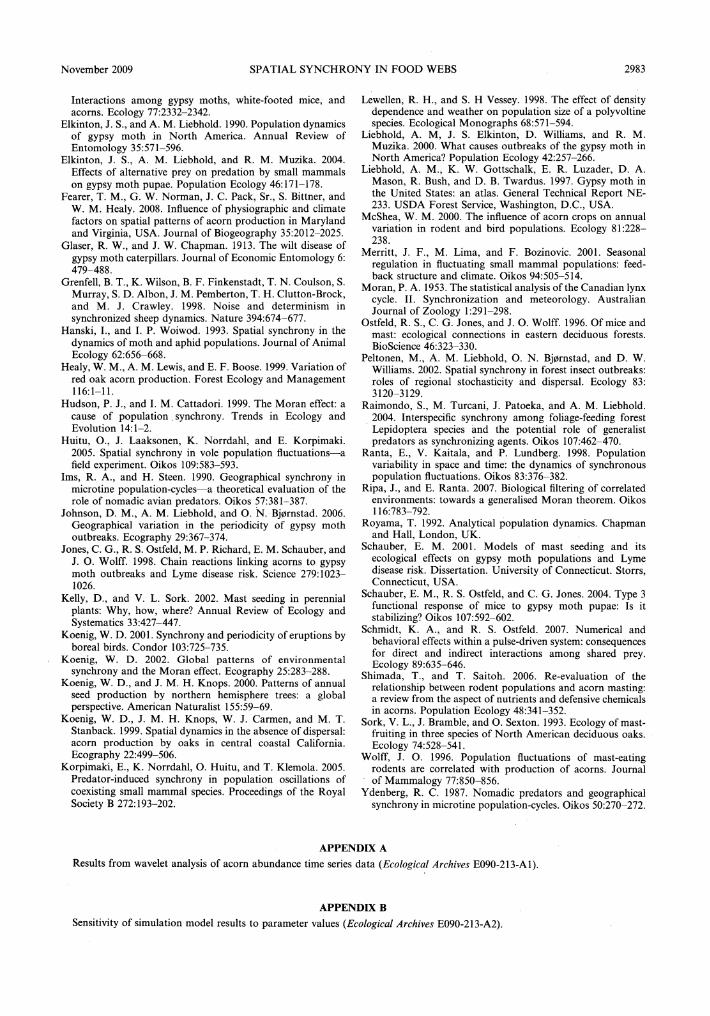
The model predicted that when 'all species were affected by regional stochasticity, all species were partially synchronized and synchrony declined with distance (Fig. SA). The correlation functions of each species paralleled that of simulated weather, in that the correlations decreased most rapidly at short distances (Fig. 6). Levels of synchrony were higher for acorns and mice than for gypsy moths and NPV.
For simulated mammal and gypsy moth populations, indirect synchronization via trophic interactions was stronger than direct impacts of regional stochasticity. As would be expected from the structure of the model, removal of regional stochasticity completely eliminated synchrony in acorn production (Fig. SB). In contrast, the mean correlation in mouse density at a lag distance of 200 km dropped only slightly, from 0.6 to 0.5, upon removing regional stochasticity in mouse population growth (Fig. SC). At long lag distances (>600 km), the gypsy moth actually displayed higher synchrony in the absence of regional stochasticity than in its presence (Fig. SD). Finally, the level of synchrony in NPV was unaffected by direct regional stochasticity (Fig. SE).
When the effect of regional stochasticity on acorn production was removed, not only did synchrony in acorns disappear, but there were also sharp drops in the synchrony of mice, gypsy moths, and NPV. Regional stochasticity effects on acorn production had clear effects on correlations in mouse, gypsy moth, and NPV populations up to lag distances of 900-1200 km.
Removal of regional stochasticity effects on the whitefooted mouse also resulted in lower levels of synchrony in gypsy moths and NPV. However, these indirect effects were weaker than those caused by removal of regional stochasticity on acorn production. For example, the distance over which gypsy moth populations exhibited
synchrony decreased by -600 km when effects of regional stochasticity were removed from acorn production, but only decreased by 300 km when regional stochasticity effects were removed from mouse populations. Based on a sensitivity analysis, these results were consistent over a wide range of parameter values (Appendix B).
DISCUSSION
We show that red oak acorns, white-footed mice, and gypsy moths exhibit similar patterns of spatial synchrony in eastern deciduous forests of the United States. Spatiotemporal correlations in abundance clearly decline with distance and are generally >O for lag distances up to 1000 km. Potential explanations for this similarity include a common response of each species to correlated weather conditions (i.e., Moran effects), synchronization of one or more of the species by regional stochasticity resulting in synchronization of the remaining species through trophic interactions (Cattadori et al. 2005, Abbott 2007, Ripa and Ranta 2007), or dispersal of one of the species that then synchronizes the fluctuations of the remaining species (Y denberg 1987, Ims and Steen 1990). Because of limited dispersal ability of all three populations, the third hypothesis is unlikely to explain observations that synchrony occurs over broad spatial scales in our study system (Peltonen et al. 2002). Furthermore, pilot modeling studies showed that dispersal of mice, gypsy moths, or viruses had little or no effect on levels of synchrony in simulated gypsy moth or virus populations, · particularly in the absence of regional stochasticity. This was true across a wide range of realistic rates of dispersal (K. J. Haynes, unpublished data).
Considerable research on the dynamics of mast seeding in oaks, mostly from western North America, has demonstrated the existence of both periodicity and
C:
1.0
0.8
0.6
0.4
O 0.2 ~ ~ o.o· 0 (.) -0.2
-0.4
-0.6
-0.8
-1.0
0 100 200 300 400 500 600 700 800 900
Distance (km)
FIG. 4. The spatial correlation function from gypsy moth defoliation data. The upper and lower lines represent 95% bootstrap confidence intervals.

2980 KYLE J. HAYNES ET AL.
A) All affected by regional stochasticity
1·0 ~Acorns 0.6
~--------~
0.2
- 0.2
- 0.6
- 1.0 '-r---.--.....--,--,---,.,--.,.....-,--'
C 0 -~
1.0
0.6
0.2
- 0.2
- 0.6
- 1.0
1.0
0.6
0.2
~ - 0.2 0 () - 0.6
B) Regional stochasticity removed from acorns
Acorns
C) Regional stochasticity removed from mice
Mice
Mice
D) Regional stochasticity removed from gypsy moths 1.0
0.6
0.2
- 0.2
- 0.6
Acorns
- 1.0 ..... ~-..-...... ~--..-...... ~
E) Regional stochasticity removed from viruses 1.0
............... Acorns
0.6 ~
0.2
- 0.2
- 0.6
- 1 .0 ..... --.--.....--,--,---,.-.,......,.....~
-
-=
Gypsy moths
Gypsy moths
Gypsy moths
Gypsy moths
Gypsy moths
0 400 800 1200 0 400 800 1200 0 400 800 1200
Distance (km)
Ecology, Vol. 90, No. 11
Viruses
Viruses
- cs::::
Viruses
Viruses
Viruses
0 400 800 1200
F1G. 5. The spatial correlation functions estimated from models with (A) regional stochasticity affecting each species, (B) no regional stochasticity affecting acorns, (C) no regional stochasticity affecting white-footed mice, (D) no regional stochasticity affecting gypsy moths, and (E) no regional stochasticity affecting the pathogen. The upper and lower lines represent 95% bootstrap confidence intervals.

November 2009 SPATIAL SYNCHRONY IN FOOD WEBS 2981
spatial synchrony in oak mast seeding (Koenig et al. 1999, Koenig and Knops 2000, Kelly and Sork 2002). Many of these same studies have identified regional stochasticity as the cause of synchrony in mast seeding. There also is considerable evidence that resource pulses created by mast seeding have profound effects on a variety of organisms inhabiting oak-dominated forests. Organisms whose population levels are known to track oak mast production include populations of seed-eating rodents, deer, and birds (Wolff 1996, McShea 2000, Elias et al. 2004, Clotfelter et al. 2007, Schmidt and Ostfeld 2007). In addition to the direct effects of mast seeding on the dynamics of consumer populations, additional information indicates that mast seeding indirectly influences the dynamics of populations trophically linked to mast consumers. For example, whitefooted mice numerically respond to fluctuations in mast abundance; consequently mast dynamics indirectly affect populations of gypsy moths (prey of Peromyscus) and ticks (parasites of Peromyscus) (Elkin ton et al. I 996, Ostfeld et al. 1996, Jones et al. 1998). Though the importance of mast seeding on consumer dynamics has been well documented, there has been little previous investigation of mast seeding effects on synchrony of consumer populations.
Our simulations suggest that synchrony in mast seeding of red oaks caused by regional stochasticity is an important cause of synchrony in the white-footed mouse, gypsy moth, and even NPV populations. When the regional stochasticity acting on acorns was removed, spatial synchrony in the remaining species all but disappeared regardless of whether they themselves experienced regional stochasticity. The presence or absence of regional stochasticity directly affecting gypsy moths or NPV had little influence on levels of synchrony in these species. Though removal of regional stochasticity affecting white-footed mouse populations reduced synchrony of mouse, gypsy moth, and NPV populations, this effect was less pronounced than the effect of regional stochasticity on acorn production. Thus, we show that indirect effects of regional stochasticity acting directly on acorn production are a major factor underlying the spatial synchrony of these trophically linked species. Evidence of synchronous food crops promoting synchrony in small mammals is present in other study systems (Korpimaki et al. 2005, Bowman et al. 2008). However, this is the first study to provide both empirical and theoretical evidence that synchrony initiated by regional stochasticity may be disseminated widely throughout a food web, ultimately affecting species occupying a diversity of roles (e.g., herbivores, predators, pathogens).
For a given species, the extent to which population fluctuations are synchronized by regional stochasticity is known to depend on the nature of that species' densitydependent dynamics. Whereas the spatial synchrony of populations whose growth is governed by linear dynamics should exactly match the synchrony of environmental
1.0
0.8 C 0 ·~ 0.6
~ 0.4 0 0
0.2
0.0 0 200 400 600 800 1000 1200 1400
Distance (km)
F1G. 6. The spatial correlation function estimated from simulated weather conditions. The upper and lower lines represent 95% bootstrap confidence intervals. The correlation function of the simulated weather conditions closely matches that of temperature and precipitation data for the gypsy moth's range in North America (see Peltonen et al. 2002: Fig. 2).
conditions (Moran 1953), the synchrony of populations governed by nonlinear dynamics may be greater or lower than the correlation of environmental conditions (Grenfell et al. 1998, Ranta et al. 1998, Bj(llrnstad 2000). The complexities of nonlinear population growth may explain why simulated gypsy moth and NPV populations could not be synchronized by direct regional stochasticity. However, this cannot explain why regional stochasticity had only moderate effects on the synchrony of white-footed mouse populations. Mouse density was modeled as a linear function of acorn density, which was itself produced by a linear autoregressive model. However, because mouse population growth was also affected by acorn production, as in nature (Schauber 2001, Elias et al. 2004), synchrony in the simulated mouse population was less dependent upon regional stochasticity than on a synchronous acorn crop.
Because synchrony in the fluctuations of NPV was minimally increased by the direct effects of regional stochasticity, the gypsy moth could not have been synchronized through the host~pathogen interaction. Simulated populations of the white-footed mouse were synchronized via their interaction with synchronous acorn crops, and this set the stage for the synchrony in mouse populations to be transferred to gypsy moths and, in turn, NPV. In our simulations, gypsy moth populations only escaped from low density and began to outbreak during certain "windows of opportunity" in which mouse densities were low, a finding consistent with empirical data (Elkinton et al. l 996, Liebhold et al. 2000). Predation by rodents is known to be a major factor influencing the growth of low-density gypsy moth populations, and it is thought that sufficiently dense populations of rodents are capable of preventing gypsy moth outbreaks (Elkinton and Liebhold 1990, Liebhold et al. 2000). Furthermore, the hypothesis that a poor acorn crop can lead to low mouse density and, in turn, increase the likelihood of a gypsy moth outbreak was supported by Liebhold et al.'s (2000) study showing a significant lagged correlation between acorn density and forest defoliation.

2982 KYLE J. HA YNES ET AL. Ecology, Vol. 90, No. 11
For a given lag distance, spatial synchrony in the empirical data was generally stronger in the gypsy moth and white-footed mouse than in acorns. In the simulated data, on the other hand, the gypsy nioth displayed lower levels of synchrony than the mouse or acorns. This discrepancy may have arisen due to differences in the spatial extent of the sample units between the data sets. Gypsy moth defoliation was measured in 64 km2
quadrats, whereas acorn and mouse densities were measured in much smaller plots. Using large quadrats can mask spatial variation occurring at smaller spatial scales, thus increasing spatial autocorrelation among sample units (Bellehumeur et al. 1997, Dungan et al. 2002). Alternatively, the discrepancy in levels of synchrony among species could be explained by the manner in which we modeled the effects of regional stochasticity on each component of the food web. We assumed that each species was equally affected by weather. However, it is possible that the gypsy moth is particularly susceptible to weather-driven changes in population growth rate, which would likely increase the synchronizing effect of regional stochasticity. In addition, because it is not known whether identical weather conditions would have similar effects on the population growth of each species, the values representing local and regional stochasticity were drawn separately for acorns, mice, gypsy moths, and pathogens. If, in fact, weather events have correlated effects on different species in this food web, impacts of weather on population growth and synchrony may be compounded across a food web. The direct effects of weather on the population growth and synchrony of a given species may be reinforced by correlated, weather-driven effects on consumer or resource species. Evaluation of this hypothesis will require future theoretical investigation.
Recent theoretical models have been pivotal in demonstrating the potential for regional stochasticity to indirectly influence spatial synchrony among species embedded within food webs (Abbott 2007, Ripa and Ranta 2007). In this vein, our study is the first to use an empirically informed mechanistic model to show that Moran effects and subsequent diffusion of synchrony to other species via consumer-resource interactions may be the primary mechanisms underlying patterns of spatial synchrony observed in a real study system. How commonly synchrony diffuses through consumer-resource interactions in other food webs is an open question. Given that interspecific synchrony has been observed in several different taxa (e.g., birds, small mammals, insects; Koenig 2001, Raimondo et al. 2004, Huitu et al. 2005, Korpimaki et al. 2005), further exploration of the diffusion of synchrony through food webs represents a promising avenue of research.
ACKNOWLEDGMENTS
Special thanks to Steve Vessey, Malcolm Hunter, Joe Merritt, and Jerry Wolff for sharing rodent data sets. We thank Gino Luzader for preparing Fig. l and managing the gypsy moth defoliation database. Juanita Constible provided
comments on a draft of the manuscript. This research was funded by a USDA-NRI Grant (2006-35306-17264) to Derek Johnson.
LITERATURE CITED
Abbott, K. C. 2007. Does the pattern of population synchrony through space reveal if the Moran effect is acting? Oikos 116: 903-912.
Beck, D. E. 1977. Twelve-year acorn yield in Southern Appalachian oaks. Research Note SE-244. U.S. Department of Agriculture, Forest Service, Southeastern Forest Experiment Station, Asheville, North Carolina, USA.
Bellehumeur, C., P. Legendre, and D. Marco~te. 1997. Variance and spatial scales in a tropical rain forest: changing the size of sampling units. Plant Ecology 130:89-98.
Bjfllrnstad, 0. N. 2000. Cycles and synchrony: two historical 'experiments' and one experience. Journal of Animal Ecology 70:353--353.
Bjfllrnstad, 0. N., R. A. Ims, and X. Lambin. 1999. Spatial population dynamics: analyzing patterns and processes of population synchrony. Trends in Ecology and Evolution 14: 427-432.
Bjfllrnstad, 0. N., A. M. Liebhold, and D. M. Johnson. 2008. Transient synchronization following invasion: revisiting Moran's model and a case study. Population Ecology 50: 379-389.
Bjfllrnstad, 0. N., C. Robinet, and A. M. Liebhold. In press. Geographic variation in North American gypsy moth population cycles: subharmonics, generalist predators and spatial coupling. Ecology.
Bowman, J., R. D. Phoenix, A. Sugar, F. N. Dawson, and G. Holborn. 2008. Spatial and temporal dynamics of small mammals at a regional scale in Canadian boreal forest. Journal of Mammalogy 89:381-387.
Brooks, R. T., H. R. Smith, and W. M. Healy. 1998. Smallmammal abundance at three elevations on a mountain in central Vermont, USA: a sixteen-year record. Forest Ecology and Management 110:181-193.
Cattadori, I. M., D. T. Haydon, and P. J. Hudson. 2005. Parasites and climate synchronize red grouse populations. Nature 433:737-741.
Clotfelter, E. D., A. B. Pedersen, J. A. Cranford, N. Ram, E. A. Snajdr, V. Nolan, and E. D. Ketterson. 2007. Acorn mast drives long-term dynamics of rodent and songbird populations. Oecologia 154:493-503.
Cogan, R. D. 1995. Project annual job report: acorn production study. Pennsylvania Game Commission, Harrisburg, Pennsylvania, USA..
Doane, C. C. 1970 .• Primary pathogens and their role in the development of an epizootic in the gypsy moth. Journal of Invertebrate Pathology 15:21-33.
Drake, W. E. 1995. Evaluation of an approach to improve acorn production during thinning. Pages 429-441 in M. B. Edwards, editor. Proceedings of the Eighth Biennial Southern Silvicultural Research Conference. General Technical Report SRS-1. USDA Forest Service, Washington, D.C., USA.
Dungan, J. L., J. N. Perry, M. R. T. Dale, P. Legendre, S. Citron-Pousty, M.-J. Fortin, A. Jakomulska, M. Miriti, and M. S. Rosenberg. 2002. A balanced view of scale in spatial statistical analysis. Ecography 25:626-640.
Dwyer, G., J. Dushoff, and S. H. Yee. 2004. The combined effects of pathogens and predators on insect outbreaks. Nature 430:341-345.
Dwyer, G., and J. S. Elkinton. 1995. Host dispersal and the spatial spread of insect pathogens. Ecology 76:1262-1275.
Elias, S. P., J. W. Witham, and M. L. Hunter. 2004. Peromyscus leucopus abundance and acorn mast: population fluctuation patterns over 20 years. Journal of Mammalogy 85:743-747.
Elkinton, J. S., W. M. Healy, J.P. Buonaccorsi, G. H. Boettner, A. M. Hazzard, H. R. Smith, and A. M. Liebhold. 1996.
November 2009 SPATIAL SYNCHRONY IN FOOD WEBS 2983
Interactions among gypsy moths, white-footed mice, and acorns. Ecology 77:2332-2342.
Elkinton, J. S., and A. M. Liebhold. 1990. Population dynamics of gypsy moth .in North America. Annual Review of Entomology 35:571-596.
Elkinton, J. S., A. M. Liebhold, and R. M. Muzika. 2004. Effects of alternative prey on predation by small mammals on gypsy moth pupae. Population Ecology 46:171-178.
Fearer, T. M., G. W. Norman, J. C. Pack, Sr., S. Bittner, and W. M. Healy. 2008. Influence of physiograph.ic and climate factors on spatial patterns of acorn production in Maryland and Virginia, USA. Journal of Biogeography 35:2012-2025.
Glaser, R. W., and J. W. Chapman. 1913. The wilt disease of gypsy moth caterpillars. Journal of Economic Entomology 6: 479-488.
Grenfell, B. T., K. Wilson, B. F. Finkenstadt, T. N. Coulson, S. Murray, S. D. Albon, J.M. Pemberton, T. H. Clutton-Brock, and M. J. Crawley. 1998. Noise and determinism in synchronized sheep dynamics. Nature 394:674-677.
Hanski, I., and I. P. Woiwod. 1993. Spatial synchrony in the dynamics of moth and aphid populations. Journal of Animal Ecology 62:656-668.
Healy, W. M., A. M. Lewis, and E. F. Boose. 1999. Variation of red oak acorn production. Forest Ecology and Management 116:1-11.
Hudson, P. J., and I. M. Cattadori. 1999. The Moran effect: a cause of population synchrony. Trends in Ecology and Evolution 14:1-2.
Huitu, 0., J. Laaksonen, K. Norrdahl, and E. Korpimaki. 2005. Spatial synchrony in vole population fluctuations-a field experiment. Oikos 109:583-593.
Ims, R. A., and H. Steen. 1990. Geographical synchrony in microtine population-cycles-a theoretical evaluation of the role of nomadic avian predators. Oikos 57:381-387.
Johnson, D. M., A. M. Liebhold, and 0. N. Bj0rnstad. 2006. Geographical variation in the periodicity of gypsy moth outbreaks. Ecography 29:367-374.
Jones, C. G., R. S. Ostfeld, M. P. Richard, E. M. Schauber, and J. 0. Wolff. 1998. Chain reactions linking acorns to gypsy moth outbreaks and Lyme disease risk. Science 279: 1023-1026.
Kelly, D., and V. L. Sork. 2002. Mast seeding in perennial plants: Why, how, where? Annual Review of Ecology and Systematics 33:427-447.
Koenig, W. D. 2001. Synchrony and periodicity of eruptions by boreal birds. Condor 103:725-735.
Koenig, W. D. 2002. Global patterns of environmental synchrony and the Moran effect. Ecography 25:283-288.
Koenig, W. D., and J. M. H. Knops. 2000. Patterns of annual seed production by northern hemisphere trees: a global perspective. American Naturalist 155:59-69.
Koenig, W. D., J. M. H. Knops, W. J. Carmen, and M. T. Stanback. 1999. Spatial dynamics in the absence of dispersal: acorn production by oaks in central coastal California. Ecography 22:499-506.
Korpimaki, E., K. Norrdahl, 0. Huitu, and T. Klemola. 2005. Predator-induced synchrony in population oscillations of coexisting small mammal species. Proceedings of the Royal Society B 272:193-202.
Lewellen, R. H., and S. H Vessey. 1998. The effect of density dependence and weather on population size of a polyvoltine species. Ecological Monographs 68:571-594.
Liebhold, A. M, J. S. Elkinton, D. Williams, and R. M. Muzika. 2000. What causes outbreaks of the gypsy moth in North America? Population Ecology 42:257-266.
Liebhold, A. M., K. W. Gottschalk, E. R. Luzader, D. A. Mason, R. Bush, and D. B. Twardus. 1997. Gypsy moth in the United States: an atlas. General Technical Report NE-233. USDA Forest Service, Washington, D.C., USA.
McShea, W. M. 2000. The influence of acorn crops on annual variation in rodent and bird populations. Ecology 81:228-238.
Merritt, J. F., M. Lima, and F. Bozinovic. 2001. Seasonal regulation in fluctuating small mammal populations: feedback structure and climate. Oikos 94:505-514.
Moran, P.A. 1953. The statistical analysis of the Canadian lynx cycle. II. Synchronization and meteorology. Australian Journal of Zoology 1:291-298.
Ostfeld, R. S., C. G. Jones, and J. 0. Wolff. 1996. Of mice and mast: ecological connections in eastern deciduous forests. BioScience 46:323-330.
Peltonen, M., A. M. Liebhold, 0. N. Bj0rnstad, and D. W. Williams. 2002. Spatial synchrony in forest insect outbreaks: roles of regional stochasticity and dispersal. Ecology 83: 3120-3129.
Raimondo, S., M. Turcani, J. Patoeka, and A. M. Liebhold. 2004. Interspecific synchrony among foliage-feeding forest Lepidoptera species and the potential role of generalist predators as synchronizing agents. Oikos 107:462-470.
Ranta, E., V. Kaitala, and P. Lundberg. 1998. Population variability in space and time: the dynamics of synchronous population fluctuations. Oikos 83:376-382.
Ripa, J., and E. Ranta. 2007. Biological filtering of correlated environments: towards a generalised Moran theorem. Oikos 116:783-792.
Royama, T. 1992. Analytical population dynamics. Chapman and Hall, London, UK.
Schauber, E. M. 2001. Models of mast seeding and its ecological effects on gypsy moth populations and Lyme disease risk. Dissertation. University of Connecticut. Storrs, Connecticut, USA.
Schauber, E. M., R. S. Ostfeld, and C. G. Jones. 2004. Type 3 functional response of mice to gypsy moth pupae: Is it stabilizing? Oikos 107:592-602.
Schmidt, K. A., and R. S. Ostfeld. 2007. Numerical and behavioral effects within a pulse-driven system: consequences for direct and indirect interactions among shared prey. Ecology 89:635-646.
Shimada, T., and T. Saitoh. 2006. Re-evaluation of the relationship between rodent populations and acorn masting: a review from the aspect of nutrients and defensive chemicals in acorns. Population Ecology 48:341-352.
Sork, V. L., J. Bramble, and 0. Sexton. 1993. Ecology ofmastfruiting in three species of North American deciduous oaks. Ecology 74:528-541.
Wolff, J. 0. 1996. Population fluctuations of mast-eating rodents are correlated with production of acorns. Journal of Mammalogy 77:850-856.
Ydenberg, R. C. 1987. Nomadic predators and geographical synchrony in microtine population-cycles. Oikos 50:270-272.
APPENDIX A
Results from wavelet analysis of acorn abundance time series data (Ecological Archives E090-213-Al).
APPENDIXB
Sensitivity of simulation model results to parameter values (Ecological Archives E090-2I3-A2).