spatial optimization of best management practices … · spatial optimization of best management...
TRANSCRIPT

Spatial Optimization of Best Management Practicesto Attain Water Quality Targets
Erica J. Brown Gaddis & Alexey Voinov & Ralf Seppelt &Donna M. Rizzo
Received: 30 September 2012 /Accepted: 19 December 2013 /Published online: 20 March 2014# Springer Science+Business Media Dordrecht 2014
Abstract Diffuse nutrient loads are a common problem in developed and agricultural water-sheds. While there has been substantial investment in best management practices (BMPs) toreduce diffuse pollution, there remains a need to better prioritize controls at the watershed scaleas reflected in recent US-EPA guidance for watershed planning and Total Maximum DailyLoad development. We implemented spatial optimization techniques among four diffuse sourcepathways in a mixed-use watershed in Northern Vermont to maximize total reduction ofphosphorus loading to streams while minimizing associated costs. We found that within acapital cost range of 138 to 321USD ha-1 a phosphorus reduction of 0.29 to 0.38 kg ha−1 year−1,is attainable. Optimization results are substantially more cost-effective than most scenariosidentified by stakeholders. The maximum diffuse phosphorus load reduction equates to1.25 t year−1using the most cost-effective technologies for each diffuse source at a cost of$3,464,260. However, 1.13 t year−1 could be reduced at a much lower cost of $976,417. This isthe practical upper limit of achievable diffuse phosphorus reduction, above which additional
Water Resour Manage (2014) 28:1485–1499DOI 10.1007/s11269-013-0503-0
Electronic supplementary material The online version of this article (doi:10.1007/s11269-013-0503-0)contains supplementary material, which is available to authorized users.
E. J. B. Gaddis (*) :A. VoinovGund Institute for Ecological Economics, University of Vermont, 617 Main Street, Burlington, VT 05405,USAe-mail: [email protected]
R. SeppeltDepartment of Computational Landscape Ecology, UFZ - Helmholtz Centre for Environmental Research,Permoserstr.15, 04318 Leipzig, Germany
D. M. RizzoSchool of Engineering, University of Vermont, 219 Votey Hall, 33 Colchester Avenue, Burlington, VT05405-0156, USA
Present Address:E. J. B. GaddisSWCA Environmental Consultants, 257 East 200 South, Suite 200, Salt Lake City, UT 84111, USA
Present Address:A. VoinovFaculty of Geo-Information Science and Earth Observation (ITC), University of Twente, P.O. Box 6, 7500AA Enschede, The Netherlands

spending would not result in substantially more phosphorus reduction. Watershed managerscould use solutions along the resulting Pareto optimal curve to select optimal combinations ofBMPs based on a water quality target or available funds. The results demonstrate the power ofusing spatial optimization methods to arrive at a cost-effective selection of BMPs and theirdistribution across a landscape.
Keywords Optimization.Watershedmanagement.Bestmanagementpractices .BMPs.Diffusepollution
1 Introduction
Diffuse (or nonpoint source) pollution represents an aggregation of pollution that comes, ofteninadvertently, from activities spread across the landscape including urban stormwater, agriculturalrunoff, and erosion. Quantification of diffuse sources and pollutant transport mechanisms arechallenging at the watershed scale due to difficulties in monitoring diffuse loads, the variety offactors (natural and human) that affect pollutant mobilization, and the complex pollutant pathwayfrom sources to receiving waters. There is a need to improve prioritization of diffuse pollutioncontrols at the watershed scale as funding is limited and pollution continues to increase.
Optimization algorithms provide a useful tool for developing cost-effective watershed plansto attain specific water quality targets, c.f. Seppelt (1999). Environmental simulation modelingwith an application in optimization, generated under defined goals (e.g. a pollutant loadreduction target) and specific constraints (e.g. available funds), can be incorporated into atailored management plan (Seppelt 2000; Holzkämper and Seppelt 2007, and Eichhorn et al.2012).
The optimization of management practices in a watershed context has been well explored(Randhir et al. 2000; Cerucci and Conrad 2003; Srivastava et al. 2002, 2003; Veith et al. 2003;Nikkami et al. 2002; Azzaino et al. 2002; Chang et al. 2009; Liu et al. 2011; Hsieh and Yang2007). Recently, critical watershed source areas have been identified using spatial data as aproxy for landscape processes (Qiu 2009; Trevisan et al. 2010). There is a trade-off betweenproblem complexity and computer run-time associated with all optimization efforts. Forexample, in our model simulations, the CPU runtime for a single 5-year simulation took 6 hand 45 min on an 8 node (64 bit) Opteron cluster in 2006. While run times will continue toimprove, complete enumeration of the optimization problem posed in our study would require1648,568 (16 unique combinations over 48,568 cells in the largest of the subwatersheds). Thesimulation model run-time is often reduced by eliminating or simplifying one or more level(s)of complexity such as the number of areas available for optimization, spatial neighborhoodeffects, the number of pollutant transport processes or sources (e.g. storm water only; Hsiehand Yang 2007), or the simulation time frame (e.g. a specific hydrologic event such as a 5-yearstorm; Srivastava et al. 2003). In some cases, optimization routines are tested on hypotheticalrather than actual watersheds (Chang et al. 2009). Recent developments in computer softwareand data processing have expanded the use of optimization to simulation models that captureprocesses over both space and time. In this regard, spatial optimization holds excitingopportunities for watershed management.
The approach presented in this paper spatially optimizes BMPs over a watershed tomaximize reduction of phosphorus loading to streams while minimizing costs. This approachbenefits from the complex interactions captured by a raster-based landscape simulation model,while reducing the optimization problem by pre-running whole watershed scenarios. Theapproach was tested on the St. Albans Bay watershed in Northern Vermont as part of a
1486 E.J.B. Gaddis et al.
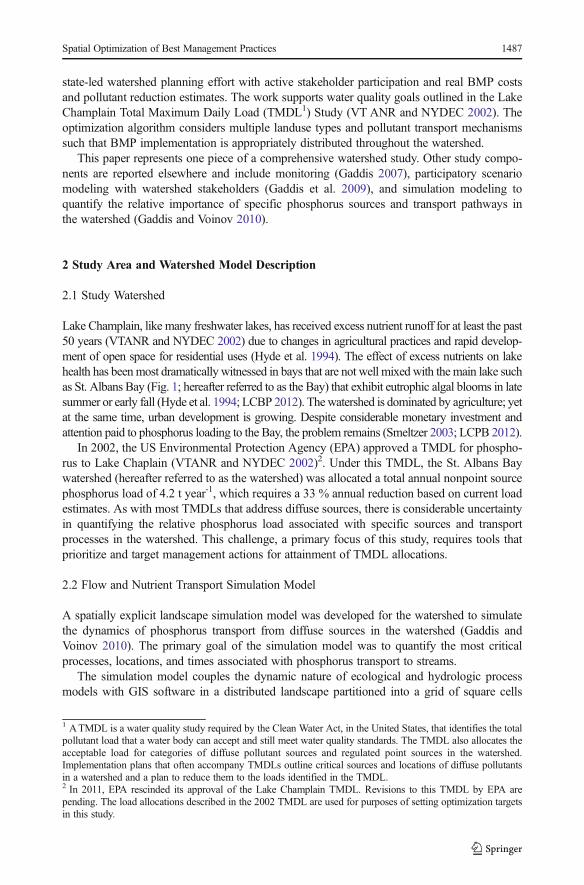
state-led watershed planning effort with active stakeholder participation and real BMP costsand pollutant reduction estimates. The work supports water quality goals outlined in the LakeChamplain Total Maximum Daily Load (TMDL1) Study (VT ANR and NYDEC 2002). Theoptimization algorithm considers multiple landuse types and pollutant transport mechanismssuch that BMP implementation is appropriately distributed throughout the watershed.
This paper represents one piece of a comprehensive watershed study. Other study compo-nents are reported elsewhere and include monitoring (Gaddis 2007), participatory scenariomodeling with watershed stakeholders (Gaddis et al. 2009), and simulation modeling toquantify the relative importance of specific phosphorus sources and transport pathways inthe watershed (Gaddis and Voinov 2010).
2 Study Area and Watershed Model Description
2.1 Study Watershed
Lake Champlain, like many freshwater lakes, has received excess nutrient runoff for at least the past50 years (VTANR and NYDEC 2002) due to changes in agricultural practices and rapid develop-ment of open space for residential uses (Hyde et al. 1994). The effect of excess nutrients on lakehealth has beenmost dramatically witnessed in bays that are not well mixed with themain lake suchas St. Albans Bay (Fig. 1; hereafter referred to as the Bay) that exhibit eutrophic algal blooms in latesummer or early fall (Hyde et al. 1994; LCBP 2012). Thewatershed is dominated by agriculture; yetat the same time, urban development is growing. Despite considerable monetary investment andattention paid to phosphorus loading to the Bay, the problem remains (Smeltzer 2003; LCPB 2012).
In 2002, the US Environmental Protection Agency (EPA) approved a TMDL for phospho-rus to Lake Chaplain (VTANR and NYDEC 2002)2. Under this TMDL, the St. Albans Baywatershed (hereafter referred to as the watershed) was allocated a total annual nonpoint sourcephosphorus load of 4.2 t year-1, which requires a 33 % annual reduction based on current loadestimates. As with most TMDLs that address diffuse sources, there is considerable uncertaintyin quantifying the relative phosphorus load associated with specific sources and transportprocesses in the watershed. This challenge, a primary focus of this study, requires tools thatprioritize and target management actions for attainment of TMDL allocations.
2.2 Flow and Nutrient Transport Simulation Model
A spatially explicit landscape simulation model was developed for the watershed to simulatethe dynamics of phosphorus transport from diffuse sources in the watershed (Gaddis andVoinov 2010). The primary goal of the simulation model was to quantify the most criticalprocesses, locations, and times associated with phosphorus transport to streams.
The simulation model couples the dynamic nature of ecological and hydrologic processmodels with GIS software in a distributed landscape partitioned into a grid of square cells
1 ATMDL is a water quality study required by the Clean Water Act, in the United States, that identifies the totalpollutant load that a water body can accept and still meet water quality standards. The TMDL also allocates theacceptable load for categories of diffuse pollutant sources and regulated point sources in the watershed.Implementation plans that often accompany TMDLs outline critical sources and locations of diffuse pollutantsin a watershed and a plan to reduce them to the loads identified in the TMDL.2 In 2011, EPA rescinded its approval of the Lake Champlain TMDL. Revisions to this TMDL by EPA arepending. The load allocations described in the 2002 TMDL are used for purposes of setting optimization targetsin this study.
Spatial Optimization of Best Management Practices 1487

(Fig. 2). The complete model captures four diffuse phosphorus transport processes: surfaceerosion, tile drainage, dissolved phosphorus in surface runoff, and road sand wash-off.Modules for hydrology, erosion, sediment, plant growth and phosphorus transport weredeveloped or modified from the Hydro-Ecological Modules Library (Voinov et al. 2004) usingStella software (Version 9). Parameter inputs to the five modules include:
& spatial inputs at a 30 m grid cell scale (e.g., slope, drainage network, landuse, soil);& time series data (e.g. meteorology, timing of fertilizer and road sand application);& landuse dependent parameters (e.g. impervious cover, fertilizer rates, crop production);& soil dependent parameters (e.g., soil phosphorus concentration, soil porosity);& and constants related to process such as erosion, hydrology, vegetative growth, and
phosphorus dynamics.
The parameter configurations were handled using the Spatial Modeling Environment(Maxwell and Costanza 1997; Maxwell 1999; Costanza and Voinov 2004) software (Fig. 2).A daily timestep was selected because more than half of the nutrient pollution is delivered tothe lake during a small percentage of the year in a few large storms or with snowmelt runoff(Jordan-Meille et al. 1998). See Gaddis and Voinov (2010) for additional discussion on thesimulation model set-up, calibration, uncertainties and results.
2.3 Summary of Simulation Model Results
The simulation model outputs are user-defined maps of a variable at a given timestep (e.g.5 years) or daily time-series output for a variable at a particular location on the landscape. For
0 1 2 3 4 5 60.5
Kilometers
Hydrology and DrainageStormwater Drainage to StreamsStormwater to WWTPTile Drained AreasMonitoring StationWatershed OutletStreams
St. Albans Bay
StevensBrookGuayland
Brook
Rugg Brook
Mill River
JewettBrook
%N
%%%
Fig. 1 Maps showing the location of St. Albans Bay in the Lake Champlain Basin (a) and the hydrology andsubwatersheds draining to St. Albans Bay (b). The total watershed area is 12,500 ha and 30 % of the area is in theStevens Brook subwatershed, the focus of the optimization study
1488 E.J.B. Gaddis et al.
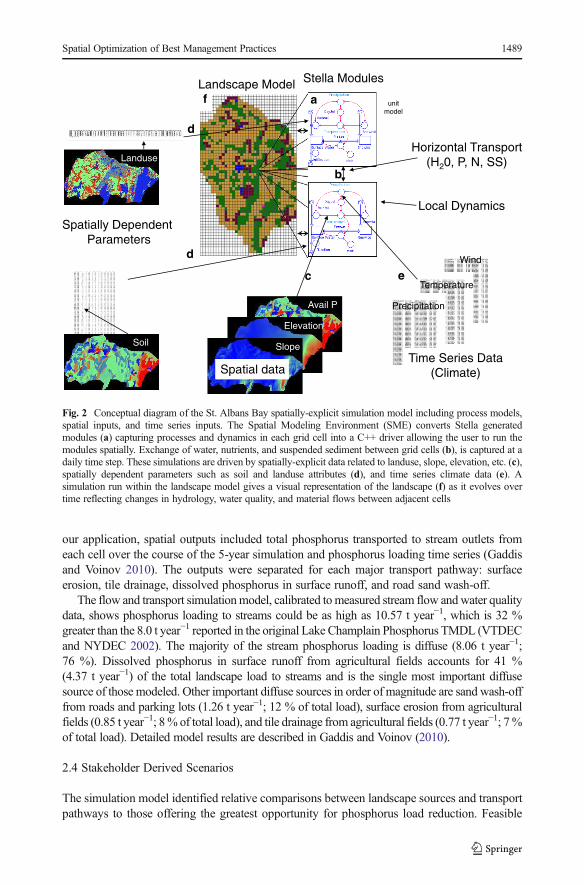
our application, spatial outputs included total phosphorus transported to stream outlets fromeach cell over the course of the 5-year simulation and phosphorus loading time series (Gaddisand Voinov 2010). The outputs were separated for each major transport pathway: surfaceerosion, tile drainage, dissolved phosphorus in surface runoff, and road sand wash-off.
The flow and transport simulationmodel, calibrated tomeasured stream flow andwater qualitydata, shows phosphorus loading to streams could be as high as 10.57 t year−1, which is 32 %greater than the 8.0 t year−1 reported in the original Lake Champlain Phosphorus TMDL (VTDECand NYDEC 2002). The majority of the stream phosphorus loading is diffuse (8.06 t year−1;76 %). Dissolved phosphorus in surface runoff from agricultural fields accounts for 41 %(4.37 t year−1) of the total landscape load to streams and is the single most important diffusesource of those modeled. Other important diffuse sources in order of magnitude are sand wash-offfrom roads and parking lots (1.26 t year−1; 12 % of total load), surface erosion from agriculturalfields (0.85 t year−1; 8% of total load), and tile drainage from agricultural fields (0.77 t year−1; 7%of total load). Detailed model results are described in Gaddis and Voinov (2010).
2.4 Stakeholder Derived Scenarios
The simulation model identified relative comparisons between landscape sources and transportpathways to those offering the greatest opportunity for phosphorus load reduction. Feasible
Avail P
Elevation
Slope
Spatial data
Temperature
Wind
Precipitation
Time Series Data(Climate)
Horizontal Transport(H20, P, N, SS)
Local Dynamics
Landuse
Soil
Spatially Dependent Parameters
Stella ModulesLandscape Modela
b
c
d
d
e
f unitmodel
Fig. 2 Conceptual diagram of the St. Albans Bay spatially-explicit simulation model including process models,spatial inputs, and time series inputs. The Spatial Modeling Environment (SME) converts Stella generatedmodules (a) capturing processes and dynamics in each grid cell into a C++ driver allowing the user to run themodules spatially. Exchange of water, nutrients, and suspended sediment between grid cells (b), is captured at adaily time step. These simulations are driven by spatially-explicit data related to landuse, slope, elevation, etc. (c),spatially dependent parameters such as soil and landuse attributes (d), and time series climate data (e). Asimulation run within the landscape model gives a visual representation of the landscape (f) as it evolves overtime reflecting changes in hydrology, water quality, and material flows between adjacent cells
Spatial Optimization of Best Management Practices 1489
phosphorus control options were developed with stakeholder input for each process identifiedas significant. Control options ranged from structural changes implemented on a centralizedscale (e.g., stormwater treatment) to behavioral changes of individual homeowners andfarmers, such as changing fertilizer application rates. The simulation model assessed a varietyof whole watershed scenarios proposed by stakeholders to reduce phosphorus load to streamsin the short-term (5-years) and long-term (15-years) (Online Resource 1; Gaddis et al. 2009).The short-term scenarios are included for comparative purposes in the optimization results thatfollow.
3 Spatial Optimization of BMPs for Diffuse Sources
The water quality optimization problem for the watershed reconciles two, opposing goals. Thefirst aims to maximize phosphorus load reduction to surface waters. The second aims tominimize capital expenditures for BMPs used to reduce phosphorus load. The Lake ChamplainPhosphorus TMDL aims to reduce diffuse phosphorus load to the Bay by 3 t year−1 (VTANRand NYDEC 2002). If we select this as a constraint, we could then optimize for the costs.Alternatively, since, the Vermont Agency of Natural Resources had allocated $625,000 toimproving water quality in the Bay in the 2004 Clean and Clear Action Plan (VTANR 2004),we might consider the funding to be the constraint, and optimize for the load reduction.Instead, we use an unconstrained multi-objective optimization approach to combine objectivesusing a user-defined weight to create a heuristic balance between the water quality goals andthe economic constraints. A similar approach has been successful in solving other spatialoptimization problems (Rizzo and Dougherty 1996; Seppelt and Voinov 2002). We focus oncapital costs because calculations are straightforward and more water quality funding is readilyavailable for project capital costs. However, the method could be applied to amortizedoperation and maintenance costs.
The optimization method described below was first applied to the Stevens Brookwatershed, a subwatershed within the St. Albans watershed that includes the majority ofSt. Albans City as well as a large agricultural area. The importance of the fourphosphorus transport processes (surface erosion, dissolved phosphorus in surface runoff,tile drainage, and road sand wash-off) is captured in the variety of landuses and landscapeconditions present in Stevens Brook. The subwatershed represents 30 % of the entirewatershed area and 27 % of the total phosphorus load to the Bay. Stevens Brookwatershed is representative of the landuse distribution in the entire St. Albans watershedwith approximately half of the land in agricultural uses, a quarter as forested, and onefifth as developed.
3.1 Formalization of the Optimization Problem
The Stevens Brook watershed is represented by a set of gridded cells. For each cell, there are16 combinations of BMPs, BMPm (m=1,…,16), that could be employed to reduce phosphorustransport to streams. The most cost-effective BMPs for reducing phosphorus load from each ofthe four modeled transport processes were preselected for each landuse type and transportpathway combination (see Section 3.2 for BMP effectiveness and costs). BMPs, which addresseach of the four processes individually, comprise the first 4 possible BMP options. Theremaining 12 options represent all combinations of these 4 BMPs, including a “no implemen-tation” option. Sixteen map pairs were produced, one pair for each combinations of BMPs,representing both annual phosphorus load reduction Pm (g cell−1 year−1) and total capital costs
1490 E.J.B. Gaddis et al.
Cm(dollar cell−1)3. Phosphorus load reduction maps show results using 5-year simulations and
post-processed to account for flow distance from streams. Cost estimates were derived fromthe scenario modeling phase in collaboration with watershed stakeholders that had access tocost information (Gaddis et al. 2009). The costs were divided among the total number of cellsassociated with a particular watershed landuse type. Net overlap in phosphorus reduction orcost associated with solutions that yield multiple BMPs was considered in the phosphorus loadand cost maps resulting in more cost-effective BMP groupings. Thus, the local optimizationtask for each cell, z, in the watershed W, can be described as follows:
maxm¼1;…;16
Fm zð Þ for z∈W ð1Þ
where Fm(z) is the objective function defined as:
Fm zð Þ ¼ Pm zð Þ−λCm zð Þ ð2Þm is the particular combination of BMPs applied at cell z for a specific landuse-transport
process combination (e.g. road sand wash-off from urban areas or surface erosion fromagricultural fields). As P(z) and C(z) are incommensurable in units, we introduce λ whichrepresents the reciprocal of the shadow costs in average grams reduced per year per capital cost(g year−1 dollar−1), i.e. expected phosphorus load reduction per dollar spent. Varying λ leads todifferent optimal solutions depending upon the weighting or desired tradeoffs between costsand phosphorus load reduction. The local optimal combination of BMPs for each grid cellvaries for each λ, and each solution is associated with a specific cost and load.
As λ changes, the total watershed phosphorus load reduction, P, and the total associatedcost, C, are calculated for each solution by summing the total cost and phosphorus reducedassociated with the set of watershed interventions over each cell, z, in the watershed, W.
P ¼X
z∈WP zð Þ
C ¼X
z∈WC zð Þ ð3Þ
A suite of optimal solutions was generated for 25 values of λ, ranging from 0.01 to 109.This range results from the different orders of magnitude in units selected for costs (dollarcell−1) and load reduction (g cell−1 year−1). Each λ generates an optimal combination ofinterventions across the urban and agricultural landscape of the Stevens Brook watershed, andhas an associated cost and total phosphorus load reduction as well as optimal BMP allocationmaps (Fig. 3; Online Resource 3). These solutions illustrate the range of options available towatershed managers depending on available funds. A graph of P and C values illustrates thebounds of expected phosphorus reduction for a given expenditure (Fig. 3). Each solutioninforms decision makers as to where, in the landscape, implementation will be most cost-effective.
3.2 Phosphorus Reduction and Cost Maps
Optimal BMPs for a given landuse and phosphorus transport process were pre-selected toachieve the most phosphorus reduction for the least cost. An array of BMP options was
3 Note: All costs are given in 2006 USD. Although the costs values are relatively old, the study is comparativeand therefore unit consistency is the most important concern for costs. Recent changes in unit costs associatedwith inflation may change the absolute costs but do not affect the shape of the pareto curve.
Spatial Optimization of Best Management Practices 1491

considered for each landuse and transport pathway combination in consultation with stake-holders. The rationale for each selected BMP combination is described below and in OnlineResource 2. Selected BMPs range from commonly-used practices (i.e., infiltration basins forerosion control in urban areas) to innovative technologies (e.g. EAF steel slag barriers tocontrol dissolved phosphorus from agricultural fields). Some transport pathways are assumedto occur only on specific landuse types (e.g. tile drained fields); therefore, BMPs are notidentified for all landuses for all transport pathways in Online Resource 2.
3.2.1 Surface Erosion
The most cost-effective practice for reducing surface erosion on agricultural land was riparianbuffers and filter strips down gradient of cells with high surface erosion; buffers were assumedto reduce particulate phosphorus by 84 % (Watzin et al. 2003). Scenario modeling estimated a6.7 % net reduction of phosphorus loading to streams accounting for this transport pathway(Gaddis 2007). The $150 per acre cost associated with vegetative riparian buffers was anestimated minimum for installation (personal communication with Kathy Hakey, NRCSSeptember 2005), which equates to $6.06 per cell. This cost does not include land costs orthe opportunity costs of converting land from agriculture to conservation.
The most cost-effective practices for reducing surface erosion on developed lands areBMPs that retain water during storms. We assumed 90 % of the rainfall would be retainedin the landscape per storm; the Vermont Stormwater manual (VTANR 2002) defines this as the
Road sand Washoff
Dissolved P Runoff
Surface Erosion
Tile drainage Bioinfiltration in city
Sediment Traps
Instream Diversion Pond
Road Sweepers Agricultural Buffers
Optimum AOptimum B
Optimum COptimum D
Optimum E
0
0.2
0.4
0.6
0.8
1
1.2
1.4
$0 $200,000 $400,000 $600,000 $800,000 $1,000,000 $1,200,000
Ave
rag
e P
ho
sph
oru
s L
oad
Red
uce
d (
mT
P/y
ear)
Total Watershed Cost (USD)
Whole Watershed Treatments for Individual Phosphorus PathwaysOptimization ScenariosStakholder derived Scenarios (whole watershed)
Optimum A Optimum B Optimum C Optimum D Optimum E
Fig. 3 Summary of full optimization modeling results. Plot of the Pareto frontier space of phosphorus loadreduction versus costs locating the considered optimized landscapes as well as the Pareto frontier that translatesinto several spatially explicit locations of BMPs shown in the maps. The maps show optimal watershedintervention combinations for specific landuses at varying costs and reductions of diffuse phosphorus load andare detailed in Online Resource 3
1492 E.J.B. Gaddis et al.

water quality volume. The associated phosphorus load reduction, if implemented watershedwide, would reduce loading to streams by 0.5 % (Gaddis 2007). On residential lands, the mostcost-effective decentralized practice is a grass swale, which could be installed for $0.49m-2 ofimpervious cover (RAN 2005). For all other forms of developed landuses, infiltration basins arethe most cost-effective and can be installed for $2.11 m−2 of impervious cover (RAN 2005).
The resulting phosphorus load reductions and costs for the respective developed andagricultural landscape simulations are combined to create comprehensive maps representingthe best pre-selected interventions on all landuses.
3.2.2 Tile Drainage
The BMP selected for reducing phosphorus from tile drains was “EAF steel slag barriers forsurface runoff P reduction”. This technology, under development in 2007 at the University ofVermont, uses electric arc furnace steel slag (EAFSS), which is an industrial by-product fromsteel production, to chemically adsorb and precipitate dissolved phosphorus. The EAFSS isplaced in filter units in field ditches or streams that receive both tile drainage and surface runofffrom adjacent fields. Phosphate is retained through chemical adsorption and precipitationreactions with calcium and iron oxides present in the EAFSS (Drizo et al. 2006). Thecombined annual phosphorus load reduction from tile drainage and surface runoff wasassumed to be 40 % for this technology (personal communication with Aleksandra Drizo,University of Vermont, May 11, 2006). The material cost of implementing the BMP across thewatershed was estimated at $134,000, which equates to $0.026 per gram of phosphorus loadcalculated by dividing $134,000 by the total phosphorus load from tile drainage and surfacerunoff in agricultural areas of the watershed (5.19 t year−1). In addition, the tile drained designcost of $120,000 for the watershed (estimated to be 25 farms) equates to $6.04 per cell whendivided across all tile-drained cells in the watershed. Thus, the estimated EAFSS installationcost per cell is:
Ctd zð Þ ¼ 0:026*Ltd zð Þ þ 6:04 ð4Þwhere, Ctd(z) is the installation cost in cell z and Ltd is the phosphorus load from tile drains (gcell−1 year−1), a spatial output from the simulation model. The disaggregation of the costestimates across individual cells represents our assumptions on how cost might reasonably bedistributed across the landscape based on the cell-specific phosphorus loading estimatesproduced with the simulation model.
3.2.3 Dissolved Phosphorus in Surface Runoff
The “EAF steel slag barriers for surface runoff P reduction” BMP selected for reducingphosphorus surface runoff from agricultural landuses again assumes a 40 % phosphorusreduction. Capital costs for implementation across the watershed are estimated using (4) andthe phosphorus load from dissolved runoff, Lds, for cells that are not tiled. The design costs fortiled cells are assumed to be spread equally between surface and tile drained pathways; thus,the design costs have been reduced by 50 % to $3.02 per cell for those cells.
Cds zð Þ ¼ 0:026*Lds zð Þ þ 3:02 ð5Þ
The BMP selected for reducing dissolved phosphorus in surface runoff from developedlanduses is the elimination of phosphorus fertilizers used on lawns and gardens. Totalphosphorus load reduction to streams was estimated at 0.25 % over 5 years using scenario
Spatial Optimization of Best Management Practices 1493
modeling (Gaddis et al. 2009). The cost for replacing typical commercial fertilizers withphosphorus free fertilizers is estimated to be $0.23 m−2 of lawn based on the differential costsof phosphorus-free fertilizer, assumed to be $29.95 for 116 m−2 of lawn and commercialfertilizer, assumed to be $15.99 for 465 m−2 of lawn, based on published fertilizer costs in2006. The cost per cell for this change is based on the average area of lawn in each cell, aparameter with landuse specific values.
Again, the phosphorus load reduction and costs for the respective developed and agricul-tural landscape simulations are combined to create watershed-wide maps representing the bestpre-selected intervention for all landuses.
3.2.4 Road Sand Wash-Off
BMPs to reduce road sand wash-off are only applied to roads, parking lots, and commerciallanduses. The most cost-effective BMP was street sweepers that recover up to 74 % of sandapplied to roads during winter storms (USDOT 2006). For St. Albans town and City, thisrepresents an upgrade from the current 33 % and 50 % recovery using existing sweepers. Thecost of purchasing a new sweeper is $170,000, which is spread across all road cells in the townand city for an average cost per cell of $23.30.
3.3 Whole Watershed Solutions
The simulation model was first used to estimate the cost and load reduction attainable for each‘whole watershed’ solution represented by the 16 maps of landuse and transport specific BMPcombinations. These local control optima for each individual transport process as well as allcombinations of transport processes (e.g. tile drainage, tile drainage + surface erosion, tiledrainage + surface erosion + road sand wash-off, etc.) were then compared to scenarios derivedby stakeholders and those derived using the spatial optimization algorithm described below.
3.4 Optimization Algorithm and Software
An optimization algorithm identified the optimal set and spatial configuration of BMPs for eachcell, by maximizing Eq. (2) for each grid cell depending on the weighting of cost versusphosphorus reduction represented by lambda (λ). As this spatial configuration is key for identifyingoptimal solutions, the combinatorial problem is computationally expensive and not solvable byexhaustive search. We thus make use of an optimization code originally developed to maximizewater quality and agricultural yields; see (Seppelt and Voinov 2002, 2003). The optimizedwatershed solutions are the result of a combinatorial search that selects the best combination oflocal cell-by-cell BMP applications. This requires computation of potentially optimum BMPmapsbased on the set of 16 map pairs pre-analyzed and indentified by the watershed simulation model.Given aweighting lambda (λ) spatially optimal placement and combination of BMPs are generatedquickly (see Seppelt and Voinov (2002) for details). Neighborhood effects are captured by thesimulationmodel which generates the phosphorus load reduction to streams associated with BMPsspecific to each landuse and transport pathway combination.
4 Results
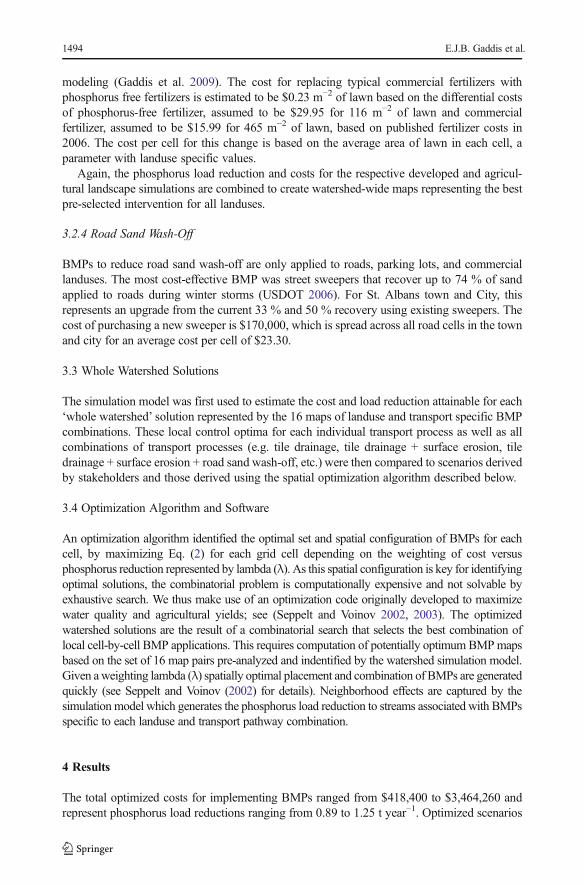
The total optimized costs for implementing BMPs ranged from $418,400 to $3,464,260 andrepresent phosphorus load reductions ranging from 0.89 to 1.25 t year−1. Optimized scenarios
1494 E.J.B. Gaddis et al.

were more cost-effective than the whole watershed scenarios representing landuse-specificinterventions applied to the entire landscape (Fig. 2). The five optima (Fig. 3 and OnlineResource 3) also show changes in spatial patterns of implementation at increasing costs. Foreach landuse, only a subset of BMPs results in meaningful phosphorus load reduction (OnlineResource 2). For example, tile drain BMPs do not apply to the urban landscape. Therefore, notall BMP and landuse combinations are shown on Fig. 3. Regardless of the priority (choice ofλ) assigned to load reduction versus cost, the solutions are considerably more efficient whenthe BMPs are spatially tailored and distributed.
The most expensive scenario includes all interventions implemented across the watershedfor a cost of $3,464,260 and a phosphorus load reduction of 1.25 t year−1. Stevens Brookrepresents one third of the watershed area and phosphorus load to streams; therefore, thisreduction is consistent with the 2.3 to 5 t year−1 load reduction goal for the entire watershed.However, additional optimization work would be required to apply the approach to the entirewatershed. The 1.25 t year−1 load reduction represents the maximum achievable diffusephosphorus reduction for the Stevens Brook watershed. In comparison, the lowest cost asso-ciated with a whole watershed intervention is the treatment of water from agricultural tile drainsat an estimated cost of $33,161, resulting in a phosphorus load reduction of 0.11 t year−1.Solutions to the right of Optimum E (Fig. 3) offer very small gains in phosphorus reductionachieved at a substantial cost. Between Optima A and E, the most cost-effective combinationsoccur on the steep side of the Pareto frontier, which has a sigmoid shape. This means thatmarginal costs for further phosphorus load reduction are lowest in this area of the curve.
Similar spatial patterns are evident for each optimum (Fig. 3). At the optimal costcombination (Optimum A), almost all of the agricultural landscape was selected for “EAFsteel slag barriers for surface runoff P reduction” to address surface runoff; and most of theroads were selected for improved road sweepers (Fig. 4). In Optima B and C, agriculturalbuffers and “EAF steel slag barriers” for both surface runoff and tile drainage P reductionbecome more dominant only to drop off again in Optima D and E as the entire agriculturallandscape is included in the implementation of surface runoff treatment. The lowest priorityagricultural fields for BMPs are pastures with non-clay soils most distant from streams. Nearlyall roads are selected for improved road sweeping under all optima. In the city, the combinationof road sweeping and conversion to phosphorus free fertilizer become a more importantintervention increasing steadily from Optima B to E. The phosphorus free fertilizer interven-tion is first selected on the steep slopes of the city, where runoff is highest, and eventuallyincreases to include all residential, commercial, and industrial cells with lawns (Optimum E).The diversity of selected interventions is highest at a mid-level cost (Optimum C) anddecreases as money is allocated and all agricultural land and roads receive their respectiveoptimal interventions (Fig. 4).
5 Discussion
The optimization routine employed in this study identifies combinations of BMPs across thelandscape that achieve the greatest phosphorus load reduction at the lowest cost. Multiple optimawere discovered using the spatially explicit, multi-objective optimization algorithm. Watershedmanagers could use these results to select optimal combinations of watershed interventions alonga Pareto optimal curve based on a target load reduction or funds available. Each solution couldalso be used to inform where, in the landscape, implementation will be most cost-effectivethrough detailed analysis of the BMP map output with each optimum. The results demonstratethe power of using spatial optimization methods to arrive at a cost-effective distribution of BMPs
Spatial Optimization of Best Management Practices 1495
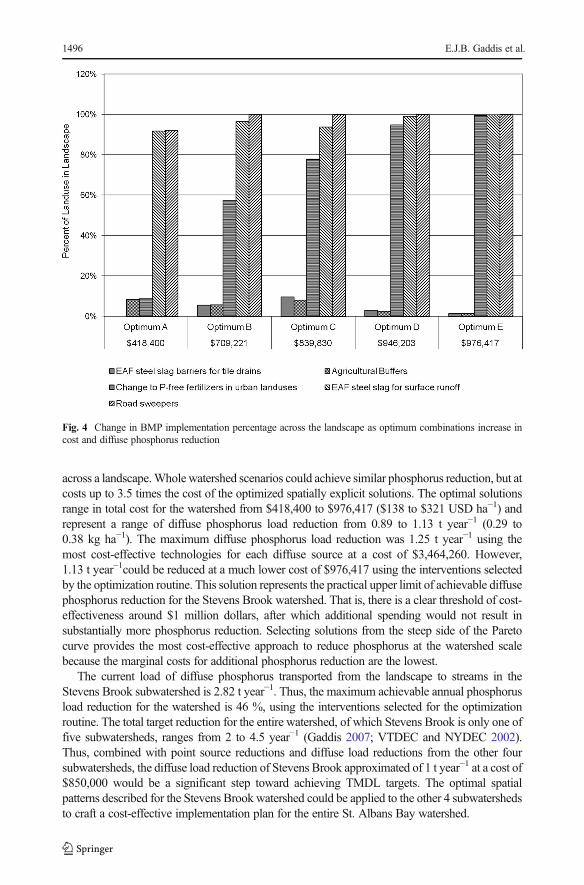
across a landscape.Whole watershed scenarios could achieve similar phosphorus reduction, but atcosts up to 3.5 times the cost of the optimized spatially explicit solutions. The optimal solutionsrange in total cost for the watershed from $418,400 to $976,417 ($138 to $321 USD ha−1) andrepresent a range of diffuse phosphorus load reduction from 0.89 to 1.13 t year−1 (0.29 to0.38 kg ha−1). The maximum diffuse phosphorus load reduction was 1.25 t year−1 using themost cost-effective technologies for each diffuse source at a cost of $3,464,260. However,1.13 t year−1could be reduced at a much lower cost of $976,417 using the interventions selectedby the optimization routine. This solution represents the practical upper limit of achievable diffusephosphorus reduction for the Stevens Brook watershed. That is, there is a clear threshold of cost-effectiveness around $1 million dollars, after which additional spending would not result insubstantially more phosphorus reduction. Selecting solutions from the steep side of the Paretocurve provides the most cost-effective approach to reduce phosphorus at the watershed scalebecause the marginal costs for additional phosphorus reduction are the lowest.
The current load of diffuse phosphorus transported from the landscape to streams in theStevens Brook subwatershed is 2.82 t year−1. Thus, the maximum achievable annual phosphorusload reduction for the watershed is 46 %, using the interventions selected for the optimizationroutine. The total target reduction for the entire watershed, of which Stevens Brook is only one offive subwatersheds, ranges from 2 to 4.5 year−1 (Gaddis 2007; VTDEC and NYDEC 2002).Thus, combined with point source reductions and diffuse load reductions from the other foursubwatersheds, the diffuse load reduction of Stevens Brook approximated of 1 t year−1 at a cost of$850,000 would be a significant step toward achieving TMDL targets. The optimal spatialpatterns described for the Stevens Brook watershed could be applied to the other 4 subwatershedsto craft a cost-effective implementation plan for the entire St. Albans Bay watershed.
Fig. 4 Change in BMP implementation percentage across the landscape as optimum combinations increase incost and diffuse phosphorus reduction
1496 E.J.B. Gaddis et al.

The optimization approach presented in this paper serves to target watershed areas withspecific BMPs and provides a probable cost estimate for TMDL attainment. The resultsprovide watershed managers with information to develop more tailored incentive and com-pensation plans and better direct volunteer efforts. States are increasingly drafting watershedplans as part of TMDL development that follow EPA’s nine criteria for achieving water qualityimprovement and demonstrate TMDL attainability (EPA 2008). The approach described in thispaper directly supports two of the nine criteria and could be used to develop watershed specificimplementation plans. The approach could also be used forwatershed planning in Europe, in supportof the EU water directive that includes river basin planning at the catchment scale (EU 2000).
6 Conclusion
In the United States, TMDLs are required to identify the contribution of specific nonpoint sourcesof pollution to impairedwaters. However, it is difficult to prioritize areas of a watershed or landusetypes for implementation. In practice, nonpoint source control funding provided through agenciesis typically allocated to willing landowners located in watersheds of impaired waters regardless ofwhether the land is in a priority area of the watershed. Recently, the Government AccountingOffice (GAO) evaluated water quality improvement in watersheds with significant expendituresof nonpoint source control funds (GAO 2012). The study found that state programs need to bemore discerning in the selection of water quality funded projects to ensure that they yieldmeasurable water quality improvement (GAO 2012). Watershed level optimization could be usedto better target funds to address the most cost-effective implementation for pollution sources andtransport pathways. To maximize cost-effectiveness, optimization algorithms must account forsources, neighbor effects, and landuse specific implementation costs. Our approach is novel as itfirstly links simulation modeling results derived through a participatory process with landscapeoptimization (Seppelt et al. 2013). It maximizes the information wrapped into the optimizationroutine, while minimizing computer run time by using pre-selected combinations of BMPs andrunning whole watershed scenarios to generate maps used in the optimization algorithm. Theapproach is applicable for any spatially explicit watershed model, including those that are vectorbased or run at larger scales, to analyze diffuse pollution.
The optimization approach described here is applicable to watersheds in which diffusesources are significant contributors of pollution to an impaired water body, in cases wherefunding for BMP implementation is limited, and in watersheds in which varied sources andlandscape factors create interactions that complicate pollutant transport analysis. The approachis strengthened by leveraging initial physics-based simulations of BMP scenarios at thewatershed scale to reduce the size of the combinatorial problem used for follow-on optimiza-tion and could support existing adaptive watershed management and planning efforts.
Acknowledgments We are grateful for funding for this work from the Northeastern States Research Cooper-ative and Vermont ESPCoR. We are especially thankful to the stakeholders who participated and contributedvaluable knowledge, insight, and data to the models and their application to the St. Albans Bay watershed.
References
Azzaino Z, Conrad JM, Ferraro PJ (2002) Optimizing the riparian buffer: Harold Brook in the Skaneateles Lakewatershed, New York. Land Econ 78(4):501–514
Cerucci M, Conrad JM (2003) The use of binary optimization and hydrologic models to form Riparian buffers. JAm Water Resour Assoc 39(5):1167–1180
Spatial Optimization of Best Management Practices 1497

Chang CL, Lo SL, Huang SM (2009) Optimal strategies for best management practice placement in a syntheticwatershed. Environ Monit Assess 153:359–364
Costanza R, Voinov A (eds) (2004) Landscape simulation modeling: a spatially explicit dynamic approach.Springer-Verlag, New York
Drizo A, Forget C, Chapuis RP, Comeau Y (2006) Phosphorus removal by electric arc furnace steel slag andserptentinite. Water Res 40:1547–1554
Environmental Protection Agency (EPA) (2008) Handbook for developing watershed plans to restore and protectour waters. http://www.epa.gov/nps/watershed_handbook/. Accessed 10 September 2012
Eichhorn M, Johst K, Seppelt R, Drechsler M (2012) Model-based estimation of collision risks of predatory birdswith wind turbines. Ecol Soc 17(2):1
European Union (EU) (2000) Directive 2000/60/EC of the European Parliament and of the Council of 23October 2000 establishing a framework for community action in the field of water policy. Short title: EUWater Framework Directive. ht tp:/ /eur-lex.europa.eu/LexUriServ/LexUriServ.do?uri=CELEX:32000L0060:EN:NOT. Accessed 10 September 2012
Gaddis, EJB (2007) Landscape modeling and spatial optimization of watershed interventions to reduce phos-phorus load to surface waters using a process-oriented and participatory research approach: a case study inthe St. Albans Bay watershed, Vermont. Dissertation, University of Vermont
Gaddis EJB, Voinov A (2010) Spatially explicit modeling of land use specific phosphorus transport pathways toimprove TMDL load estimates and implementation planning. Water Resour Manag 24(8):1621–1644
Gaddis EJB, Falk HH, Ginger C, Voinov A (2009) Effectiveness of a participatory modeling effort to identify andadvance community water resource goals in St. Albans, Vermont. Environ Model Softw 25:1428–1438
Government Accounting Office (GAO) (2012) Nonpoint source water pollution: greater oversight and additional dataneeded for key EPAwater program. http://www.gao.gov/assets/600/591303.pdf. Accessed 10 September 2012
Holzkämper A, Seppelt R (2007) A generic tool for optimising land-use patterns and landscape structures.Environ Model Softw 22:1801–1804
Hsieh C, Yang W (2007) Optimal nonpoint source pollution control strategies for a reservoir watershed inTaiwan. J Environ Manag 85:908–917
Hyde K, Kamman N, Smeltzer E (1994) History of phosphorus loading to St. Albans Bay, 1850–1990. LakeChamplain Basin Program. North Hero, Vermont. Technical Report No. 7B
Jordan-Meille L, Dorioz JM, Wang D (1998) Analysis of the export of diffuse phosphorus from a small ruralwatershed. Agronomie 18:5–26
Lake Champlain Basin Program (LCBP) (2012) Lake Champlain State of the Lake Report 2012: LakeChamplain. URL: http://www.lcbp.org/PDFs/SOL2012-web.pdf. Accessed 9/10/12
Liu Y, Zou R, Riverson J, Yang P, Guo H (2011) Guided adaptive optimal decision making approach foruncertainty based watershed scale load reduction. Water Res 45:4885–4895
Maxwell T, Costanza R (1997) An open geographic modelling environment. Simul J 68(3):175–185Maxwell T (1999) A Parsi-model approach to modular simulation. Environ Model Softw 14:511–517Nikkami D, Elektorowicz M, Mehuys GR (2002) Optimizing the management of soil erosion. Water Qual Res J
Can 37(3):577–586Qiu Z (2009) Assessing critical source areas in watersheds for conservation buffer planning and riparian
restoration. Environ Manag 44:968–980RAN (2005) Redesigning the American Neighborhood. Rubenstein School of Environment and Natural
Resources, University of Vermont. http://www.uvm.edu/~ran/ran/. Accessed 22 October 2005Randhir TO, Lee JG, Engel B (2000) Multiple criteria dynamic spatial optimization to manage water quality on a
watershed scale. Trans ASAE 43(2):291–299Rizzo DM, Dougherty DE (1996) Design optimization for multiple management period groundwater remedia-
tion. Water Resour Res 32(8):2549–2561Seppelt R (1999) Applications of optimum control theory to agroecosystemmodelling. Ecol Model 121:161–183Seppelt R (2000) Regionalised optimum control problems for agroecosystem management. Ecol Model 131:121–132Seppelt R, Voinov A (2002) Optimization methodology for land use patterns using spatially explicit landscape
models. Ecol Model 151(2–3):125–142Seppelt R, Voinov A (2003) Optimization methodology for land use patterns - evaluation based on multiscale
habitat pattern comparison. Ecol Model 168(3):217–231Seppelt R, Lautenbach S, Volk M (2013) Identifying trade-offs between ecosystem services, land use, and
biodiversity: a plea for combining scenario analysis and optimization on different spatial scales. Curr OpinEnviron Sustain 5:458–463
Smeltzer E (2003) The phosphorus problem in St. Albans. Vermont Department of Environmental Conservation,Water Quality Division, Waterbury
Srivastava P, Hamlett JM, Robillard PD (2003) Watershed optimization of agricultural best managementpractices: continuous simulation versus design storms. J Am Water Resour Assoc 39(5):1043–1054
1498 E.J.B. Gaddis et al.

Srivastava P, Hamlett JM, Robillard PD, Day RL (2002) Watershed optimization of best management practicesusing AnnAGNPS and a genetic algorithm. Water Resour Res 38(3):1–14
Trevisan D, Dorioz JM, Poulenard J, Quetin P, Combaret CP, Merot P (2010) Mapping of critical source areas fordiffuse fecal bacterial pollution in extensively grazed watersheds. Water Res 44:3847–3860
United States Department of Transportation (USDOT) (2006) Stormwater best management practices in an ultra-urban setting: Selection and monitoring. United States Department of Transportation. www.fhwa.dot.gov/environment/ultraurb/3fs16.htm
Veith TL, Wolfe ML, Heatwole CD (2003) Optimization procedure for cost effective BMP placement at awatershed scale. J Am Water Resour Assoc 39(6):1331–1343
VTANR and NYDEC (2002) Lake Champlain phosphorus total maximum daily load (TMDL). Vermont Agencyof Natural Resources and New York State Department of Environmental Conservation, Waterbury
VTANR (2004) Clean and clear action plan for Missisquoi Bay and St. Albans Bay. Vermont Agency of NaturalResources, Waterbury
VTANR (2002) The Vermont stormwater management manual: volume I - stormwater treatment standards.Vermont Agency of Natural Resources, Waterbury
Voinov A, Fitz C, Boumans R, Costanza R (2004) Modular ecosystem modeling. Environ Model Softw 19:285–304
Watzin MC, Cassell EA, Meals DW (2003) Analyzing effects of conservation practices using network modeling.Rubenstein School of Environment and Natural Resources, University of Vermont. Burlington, Vermont.Final project report to NRCS Watershed Science Institute
Spatial Optimization of Best Management Practices 1499