spatial distribution of dissection index (erosion
TRANSCRIPT
A B S T R A C T
In the present paper, an attempt has been made to study the spatial distributionof dissection index (Erosion Intensity)versus Geomorphological Environment inParkha Watershed.Author have evaluated the morphometric characteristic on thebasis of Survey of India toposheet at 1:50,000 scale .For this detailed study,survey of India toposheet (1:50,000)were used for relief aspect of morphometricparameters. Dissection Index (the roughness of the earth surface) is a ratio betweenrelative relief and absolute relief, consequently its range is a combined result ofvarious geomorphic factors viz. lithology, absolute relief, relative relief, averageslope and drainage density. A quantitative study is designed to investigate theimpact of these factors upon dissection index. The correlation coefficient betweendissection index and aforesaid factors show that absolute relief, relative relief,average slope and drainage density determine positive impact on the growth anddevelopment of varying degree of dissection in Parkha watershed
© 2014 Published by Vidyasagar University. All rights reserved.
Spatial Distribution of Dissection Index (Erosion Intensity)versus Geomorphological Environment in ParkhaWatershed, Central HimalayaRekha Deolia and Anita Pande
Department of GeographyKumaun University Nainital-263001(UK)
A R T I C L E I N F O
Article history:Received 07 January 2014Received in revised form 08August 2014Accepted 17 October2014
*Corresponding AuthorE-mail address : [email protected] (R. Deolia)
Indian Journal of Geography & Environment 13 (2014) 10-22
INDIAN JOURNAL OFGEOGRAPHY AND ENVIRONMENT
VIDYASAGARUNIVERSITY
ISSN:0972-7388Available online : http://vidyasagar.ac.in/journal
Keywords:Dissection index,absolute relief, relativerelief, average slope,drainage density.
1. Introduction
The morphometric characteristics at the watershedscale may hold important information about itsformation and development because all hydrologicand geomorphic processes occur within the watershed(Singh, 1990).Dissection Index (DI) is expressing a ratioof the maximum relative relief to maximum absoluterelief .It is an important morphometric indicator ofthe nature and magnitude of dissection ofterrain.(Singh,S,2002). Morphometric analysis of awatershed present a quantitative description of thedrainage system,which is an important aspect of thecharacterization of watersheds (Strahler, 1964). Theword dissection index itself defines the roughness of
the surface created by numerous valleys or ravines. Itis an important parameter of drainage basin anduseful in the study of the terrain and drainage basindynamics, the stage attained by the stream in thecourse of the evolution of basin concerned. In thisstudy an attempt has been to observe the impact oflithology, relief, average slope and drainage density(Pande and Joshi, 1994).Recently this type of work ishighly considerable of interest by various geographers, Joshi and Patil(2009),Dutta and Sunvendu(2012)Pareta,Kuldeep and Pareta Upasana(2012),Prakasam,C and Biswas,B(2012), Bhunia et al(2012),Tejpal(2013),Gayen et al(2013). The study is based on the quantitative analysis of the
ISSN 0972-7388 Peer-reviewed Journal
Department of Geography and Environment ManagementVidyasagar University, Midnapore-721 102
West Bengal, India
VOLUME : 13 2014

Indian Journal of Geography and Environment, 13 (2014)
Spatial Distribution of Dissection Index (Erosion Intensity) Versus Geomorphological Environment... 1 1
morphometric parameters and reveals some basicaspects of presented area. However in this study areanobody has done this kind of work on this theme.Author believes that the study will provide anopportunity to the researchers for better insight tothis field.
2. The Study Area
The ‘Parkha Watershed’ extends between the latitudeof 290 26’ 31”N and 290 31’ 41”N and the longitude of790 41’ 48”E and 790 45’ 00”E. Encompassing an areaof 80 km2 in lesser Himalaya, the watershed lies inthe SOI topographical sheet of 53 O/10 and 53 O/11(scale 1:50000).The watershed lies in NainitalDistrict and Almora District of Uttarakhand State andconstitutes a part of Kosi –West Ramganga drainagesystem of Central Himalaya.This watershed is under the influence of tectonicfeature, viz. South Almora Thrust (S.A.T.) and structure
the area. As per the Meterological station located inthe watershed the hottest month of June received22.050C temperature while the coldest month Januarygets 4.450C temperature. The maximum rainfallreceived by the month of August (377.6mm) while theminimum rainfall received by the months May andNovember.
3. Methodology
Field based data and MethodsPresent study is an attempt on the basis of DoveNir’s (1957) definition. The ratio between relative reliefand absolute relief is known as dissection index.Further the formula as expounded by him is:
D.I=Rr/Arwhere D.I. is dissection Index, Rr is Relative relief , Aris Absolute relief.The morphometric analysis of the study was carriedout using the survey of India toposheet (1:50,000).The
Fig. 1 : Parkha Watershed Location Map
has played a significant role in the determination ofmorphogenetic nature of hazard zones. The areapossesses classical mixture of different lithologiesincluding the rocks of Ramgarh Group and AlmoraGroup.The altitude of the area ranges between 1200m to 2346 m. The high variation of altitude producesclassical mixture morphological features (broad valleyto sharp spurs and extended ridges). Vegetationdiversity produces variations in the degree and extentof hazardous slope processes. The Himalayan sub –tropical pine forest, oak forest, Rhododendron forestand Deodar forest are the characteristic feature of
entire watershed area is divided into grid of 1 km2.Atotal of 103 grids were made for the morphometriccharacteristic of the study area .With the help ofcontour map the above formula of Dov Nir is appliedand resultant value are grouped into five categories.These categories are <0.05(Very low)dissectionindex,0.05-0.10(Low )dissection index, 0.10-0.15(Moderate)dissection index,0.15-0.20(High)dissection index and >0.20(Very high )dissectionindex.These five categories of dissection index,thecategory 0.10-0.15(Moderate)dissection index acquiresthe maximum area(49.24%)while the category

Indian Journal of Geography and Environment, 13 (2014)
1 2 R. Deolia & A. Pande
<0.05(Very low)dissection index acquire the minimumarea(1.1%).Area of each category is obtained with thehelp of planimeter.Thus placing the computedvalues,the depiction of dissection index is made bydrawing isopleths for the whole area.Absolute reliefrages between 1260m to 2280m where in themaximum area(37.72 %)falls under high reliefzone(1900 to 2000m),while minimum area(6.1 %)isconfined to low relief zone(below 100). Relative relief(Smith, 1935) extends between 20m to 440melevation. Maximum area (52.09%) lies in between(200 to 300m), while minimum area (1.6%) is found invery high relief zone (above 400). Average slope(Wentworth, 1930) varies from 10 to 310.Maximumarea (36.78 %) falls under moderate slope (170 to 210)while minimum area (4.79%) is under low slope zone(below 130).
4. Results and Discussion
The geomorphic impact upon dissection index hasbeen pointed with the help of bivariate frequencyanalysis among dissection index and variousgeomorphic indices. (geology, relative relief, absoluterelief, and slope and drainage density) which statisticalmeasures are shown in Table 1. It is Known that therange of dissection index is measured by resistantlithology where as loose rock are the indication of itsdegree but sometime it is also noticed that in fewcases, opposite phenomena have been observed inwhich the resistant rocks help in the development ofdissection index range and these developmentchecked by loose rock. The tectonic control isresponsible for this observation. The gradient of earthsurface, which is a fundamental feature, is onlyresponsible to make variation in dissection index
Spatial Distribution of Dissection IndexThe regional distribution of dissection index variesfrom north to south and east to west (Fig-2) whichranges between 0.01 to 0.30, thus indicating theimpact of relief, slope, lithology, drainage density andvegetation cover. Table 2 illustrates the regionaldistribution of dissection index in Parkha watershed.Table-2 reveals highest area is covered by the groupof moderate which is 39.39 km2 or 49.24 percent ofthe total area. The lowest dissection index is underthe group of below 0.05 which is 0.88 km2 or 1.1percent of the total area.Due to the different aspects like slope, relative relief,absolute relief, geology, drainage density andvegetation cover the Parkha and its tributaries havethe varying degree of erosion intensity. Consequentlythere is much variation in the attainment of dissection
index in different parts of the basin though the sub-basins lie in almost same altitudinal zones. The impactof various geomorphic properties is observed asevident from the following description:.
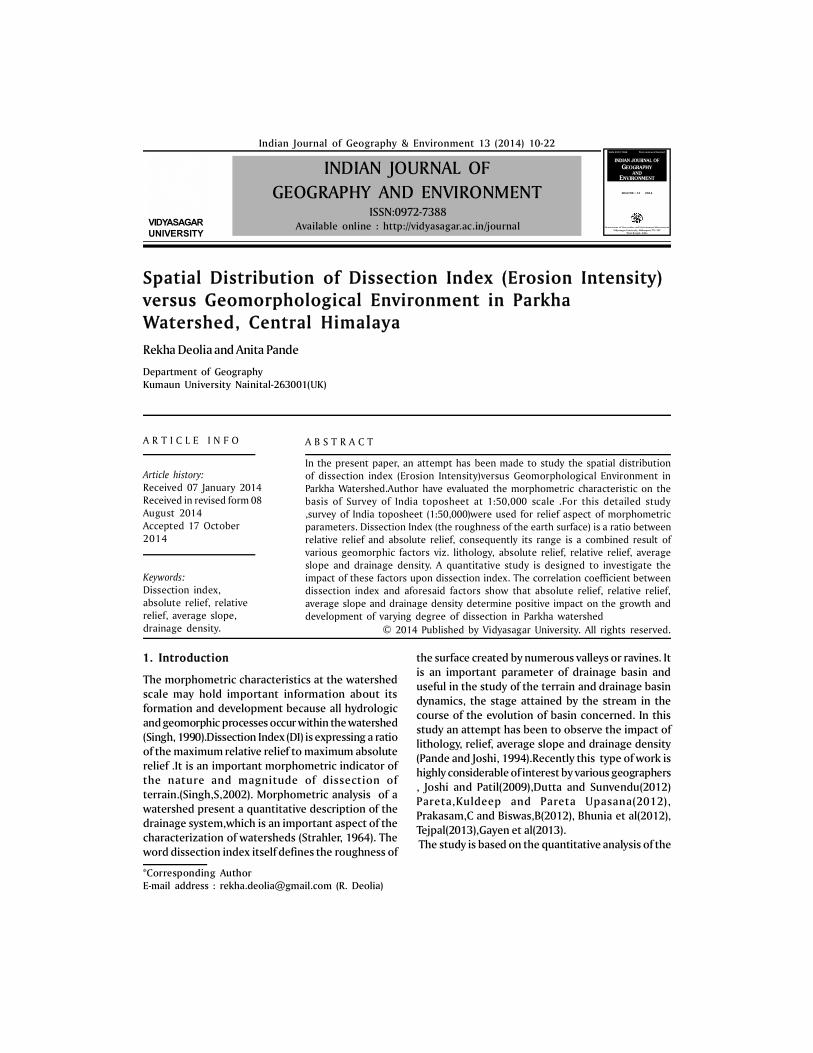
Lithology and Dissection IndexThe Parkha Watershed lies under stratigraphicalunit of lesser Himalaya. Hard metamorphic rocks andlimestone are mainly concentrated in this domain.Thisunit also possesses the old unfossiliferoussedimentary rocks of Palaeozoic and Precamdrianperids,other available rocks are slate, limestone andquartzite.Lesser Himalaya is the area of maximummonsoon-rain,so the numerous streams and rivuletshave created several landforms through erosion. TheLesser Himalayan domain under study area ischaracterized by the rocks of two groups:
(i) Ramgarh Group associated with Nathuakhanformation.
(ii) Almora Group associated with Augen–Gneiss and Saryu-Gumalikhet –MunsiariFormation.
The occurrence of each lithology under differentdissection index groups has been set out in Table 3and the spatial distribution of geology in Parkhawatershed shows in Fig.3.Low dissection index constitutes 11.83km2 of thearea.Saryu-Gumalikhet-Munsiari has the highest (7.50km2) and Augen Gneiss have lowest (0.5 km2) coverageof area in this category.Moderate dissection index has maximum area of38.49 km2.Saryu-Gumalikhet-Munsiari formationcomprising an area of 27.05km2, has maximumcoverage of area Augun Gneiss formation having theminimum area of 3.39km2 of this Index.High dissection index included maximum lithology ofSaryu-Gumalikhet-Munsiari formation covering19.15km2 while Nathuakhan formation constitutesthe minimum area of 2.32 km2.Very high dissection covers 3.82km2 area.Its lithologyis mainly confined to Saryu-Gumalikhet-Munsiari (3.50km2) and AugunGneiss (0.32 km2) formation.The overall analysis indicates that Moderate to Highdissection index covers maximum area, the mainlithology of which is Saryu-Gumalikhet-MunsiariFormation.
Absolute Relief and Dissection IndexThe maximum and minimum occurrence of eachabsolute relief zone under different dissection indexgroups have been set out in Table. 4 and the spatialdistribution of absolute relief in Parkha watershedshows in Fig.5.

Indian Journal of Geography and Environment, 13 (2014)
Spatial Distribution of Dissection Index (Erosion Intensity) Versus Geomorphological Environment... 1 3
Table 1: Parkha Watershed: Geomorpho-Statistical Measures
Table 2: Parkha Watershed: Areal Distribution of Dissection Index
Statistical Parameters Absolute Relief (m)
RelativeRelief(m)
Average Slope(m)
Dissection Index (m)
Mean 1958.40 256.63 18.32 0.14
Median 1984.47 256.88 19.36 0.13
Mode 2034.3 256.16 18 0.14
Range 1020 420 30 0.29
Quartile1 1800.42 209.12 15.59 0.11
Quartile3 222.70 310.35 21.30 0.168
Quartile Deviation 161.14 50.62 2.86 0.029
Coefficient of Quartile Deviation 0.82 0.19 0.15 0.21
Standard Deviation 276.86 78.11 5.14 0.049
Coefficient of Standard Deviation 0.304 0.141 0.28 0.347
Mean Deviation from Mean 181.37 55.192 3.67 0.035
Mean Deviation from Median 204.77 3.59 7.70 0.035
Mean Deviation from Mode 214.50 54.98 3.85 0.044
Coefficient of Mean Deviation from Mean 0.093 0.22 0.20 0.25
Coefficient of Mean Deviation from Median 0.103 0.014 0.39 0.25
Coefficient of Mean Deviation from Mode 0.11 0.21 0.21 0.31
Coefficient of Skewness -0.27 0.006 0.062 0.020
DissectionIndex
Area CumulativeArea km2
Area (%) CumulativeArea (%)
Remark
<0.05 0.88 0.88 1.1 1.1 Very low0.05-0.10 10.72 11.6 13.4 14.5 Low0.10-0.15 39.39 50.99 49.24 63.74 Moderate 0.15-0.20 25.56 76.55 31.95 95.69 High>0.20 3.46 80 4.31 100 Very highTotal 80 100
Table 3: Lithology and Dissection Index
Dissection Index <0.05 0.05-0.10 0.10-0.15 0.15-0.20 >0.20 Total
Geological formation Very low Low Moderate High Very High
Augun-Gneiss - 0.5 3.39 3.31 0.32 7.52
Saryu-Gumalikhet-Munsiari 0.59 7.50 27.05 19.15 3.50 57.79
Nathuakhan 0.49 3.83 8.05 2.32 - 14.69
1.08 11.83 38.49 24.78 3.82 80.00
Indian Journal of Geography and Environment, 13 (2014)
1 4 R. Deolia & A. Pande
Fig.3 Parkha Watershed: Spatial Distribution of Geology

Indian Journal of Geography and Environment, 13 (2014)
Spatial Distribution of Dissection Index (Erosion Intensity) Versus Geomorphological Environment... 1 5
Fig.2 Parkha Watershed: Spatial Distribution of Dissection Index
Indian Journal of Geography and Environment, 13 (2014)
1 6 R. Deolia & A. Pande
Table 4: Absolute Relief and Dissection Index
Absolute Relief(m) <1500
1500-1700
1700-1900
1900-2100 >2100 Total
Dissection Index Remark Low Moderate
Moderate high High Very High
<0.05 Very Low 0.21 - - - 1.46 1.67
0.05-0.10 Low 1.73 - 0.24 2.29 5.76 10..02
0.10-0.15 Moderate 1.99 3.19 7.93 16.9 11.38 41.39
0.15-0.20 High 0.85 3.99 7.91 8.32 3.67 24.74
>0.20 Very High 1.06 0.43 0.69 - - 2.18
5.84 7.61 16.77 27.51 22.27 80.00
Very low dissection index group is highly concentratedon the very high absolute relief area covering 1.46km2 while the lowest concentration is in Low absoluterelief area with 0.21km2.Low dissection index group constitute its maximumconcentration in very high absolute relief, covering5.76km2 while the lowest concentration (0.24km2) isvisible in Moderate high absolute relief area. Otherrelief area also shares this index category throughhaving small area.Moderate dissection index group lies in High absoluterelief area constituting 16.9km2 while the lowest areai.e 1.99km2 lies in the Low absolute relief area. Otherrelief areas also provide a good concentration of thisindex group in comparison to other index categories.High dissection area is found in High absolute reliefarea covering 8.32km2 and the lowest area 0.85km2
lies in Low Absolute area.Very high dissection index group constitute itsmaximum concentration in low Low absolute reliefarea (1.06km2) and lowest area lies in Moderateabsolute relief area (0.43km2).The overall analysis indicates that the High to VeryHigh absolute relief groups play a dominant role (27.51and 22.27 km2) in governing the dissection index.The Low absolute relief group has the lowest degreeof dissection index which shows a positive correlationbetween absolute relief and dissection index. Thestatistical measurement of correlation i.e +0.54confirm this result.
Relative Relief and Dissection IndexThe maximum and minimum occurrence of eachrelative relief zone under different dissection indexgroups have been set out in Table. 5 and the spatialdistribution of Relative relief in Parkha watershed
shows in Fig.4.Very low dissection index group is highly concentratedin low relative relief area having 0.26km2 while thesmallest part of the index is seen in Moderate Highrelief area of 0.07km2.Very high relative area showsan absence of this index category.Low dissection index group covers its maximum areain Moderate relative relief area comprising 7.57km2
while Low relative area possesses the smallest part(0.25km2) of this index category.Moderate dissection index group comprises itsmaximum area of 29.62km2 in Moderate High relativearea and only 0.65 km2 area is seen very high relativearea presenting the lowest concentration of this indexgroup.High dissection index group has maximumconcentration in High relative relief area and minimumconcentration is found in Low relative relief area 0.60km2.Very high dissection index group has maximumconcentration in High relative area (0.83km2) andminimum area (0.44km2) concentration in Low relativerelief area.The overall analysis reflects that the moderate highrelative area dominates strongly (41.15km2) amongall other relative relief areas in reference area to theimpact of relative relief on dissection index. Very lowdissection index category is absolutely absent in veryhigh relative area and very high dissection index groupshows its neutrality in very low and very high relativerelief areas. This shows almost positive relationshipbetween both indices which statistically stands at+0.95.
Average Slope and Dissection IndexThe maximum and minimum occurrence of each

Indian Journal of Geography and Environment, 13 (2014)
Spatial Distribution of Dissection Index (Erosion Intensity) Versus Geomorphological Environment... 1 7
Fig.5 Parkha Watershed: Spatial Distribution of Absolute relief

Indian Journal of Geography and Environment, 13 (2014)
1 8 R. Deolia & A. Pande
Fig.4 Parkha Watershed: Spatial Distribution of Relative relief

Indian Journal of Geography and Environment, 13 (2014)
Spatial Distribution of Dissection Index (Erosion Intensity) Versus Geomorphological Environment... 1 9
Table 5: Relative Relief and Dissection Index
average slope zone under different dissection indexgroups have been set out in Table 6 and the spatialdistribution of Average slope in Parkha watershedshows in Fig.6.Very low Dissection index group its maximum areaunder Gentle slope region 0.98 km2 and minimumarea falls under low slope region of 0.30km2.Moderate,Moderate steep and Steep zones havebeen absolutely ignored by this dissection index.Low dissection index dominates in Moderate slopezone, having an area o 3.56km2.The steep slope zone
has the minimum concentration of this index whichpossesses only 0.59 km2 area. The other slope zonesalso have almost regular distributation of area of thisindex.Moderate dissection index has its maximumconcentration in moderate slope zone where it covers14.52 km2area. Steep slope zone has lowestconcentration of 2.63 km2.High dissection index is typified by the highestconcentration of Moderate slope zone i.e.12.93km2.On the other hand the minimum area of 0.40km2
Table 6: Average Slope and Dissection Index
Table 7: Parkha Watershed: Impact of Drainage Density on Dissection Index
Dissection Index Remark Drainage Density (km/km2)<0.05 Very low 0.850.05-0.10 Low 2.160.10-0.15 Moderate 2.350.15-0.20 High 2.02>0.20 Very high 2.17
Relative relief(m)
<100 100-200 200-300 300-400 >400 Total
Dissection Index
Remark Low Moderate Moderate high High Very high<0.05 Very low 0.26 0.24 0.07 - - 0.570.05-0.10 Low 0.25 7.57 2.46 1.0 - 11.280.10-0.15 Moderate 0.99 5.57 29.62 3.61 0.65 40.440.15-0.20 High 0.60 1.82 9.0 13.66 0.72 25.8>0.20 Very high 0.44 0.64 - 0.83 - 1.91
2.54 15.84 41.15 19.1 1.37 80.00
Slope(0) <13 13-17 17-21 21-25 >25 Total
Dissection Index
Remark Low Gentle Moderate Moderate Steep
Steep
<0.05 Very Low 0.30 0.94 - - - 1.24
0.05-0.10 Low 2.83 3.22 3.56 2.70 0.59 12.9
0.10-0.15 Moderate 2.79 12.72 14.52 6.83 2.63 39.49
0.15-0.20 High 0.40 4.39 12.93 5.64 0.6 23.96
>0.20 Very High 0.24 0.57 0.94 0.60 0.06 2.41
6.56 21.84 31.95 15.77 3.88 80.00

Indian Journal of Geography and Environment, 13 (2014)
2 0 R. Deolia & A. Pande
Fig.6 Parkha Watershed: Spatial Distribution of Average slope
Indian Journal of Geography and Environment, 13 (2014)
Spatial Distribution of Dissection Index (Erosion Intensity) Versus Geomorphological Environment... 2 1
Fig.7 Parkha Watershed: Spatial Distribution of Drainage density

Indian Journal of Geography and Environment, 13 (2014)
2 2 R. Deolia & A. Pande
of this under is covered by low slope zone.Very high dissection index has its maximumconcentration in Moderate slope zone where it covers0.94 km2area.Steep slope zone has lowestconcentration of 0.06 km2.The overall picture clearly portrays that the highestextension of dissection index is visible in moderateslope zone, which constitute 31.95km2 area while thelowest range of dissection index comprises 3.88 km2
is confined to steep slope zone. The very low dissectionindex group is zero in steep slope zone. There is apositive relationship these variables which is indicatedby the correlation value of +0.94 showing a positiverelationship.
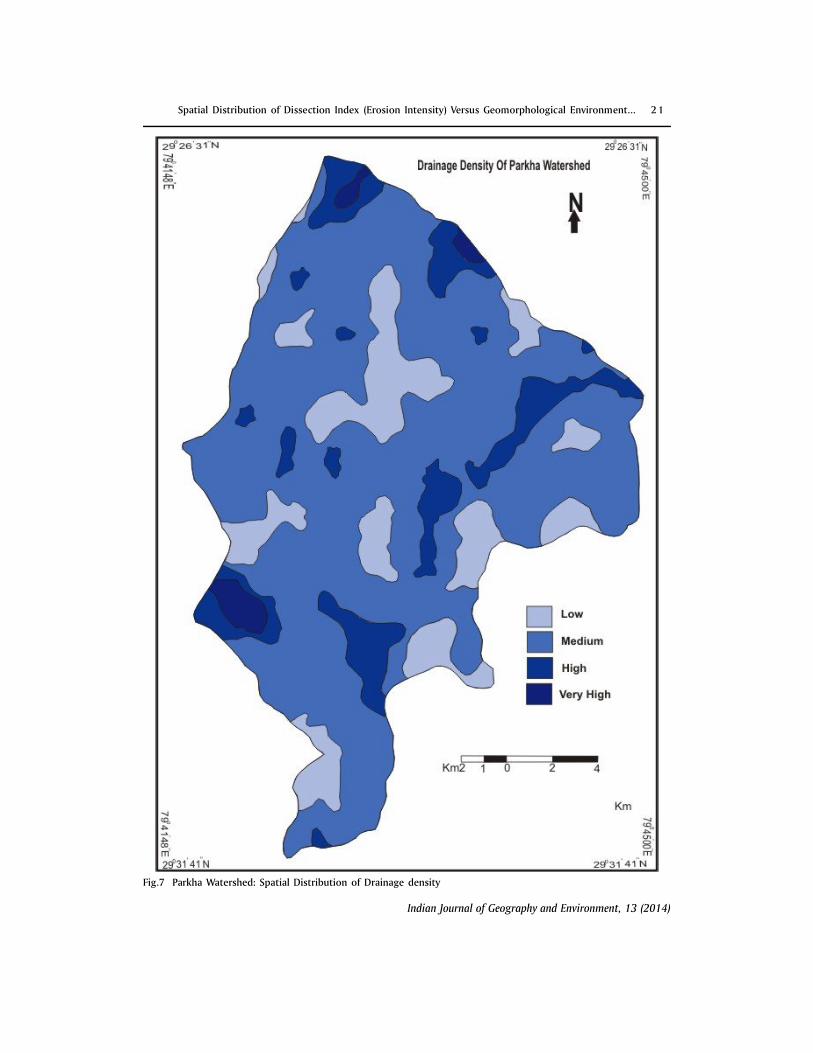
Drainage Density And Dissection IndexDissection index of any area is affected by its drainagedensity. Generally low dissection index possess lowdrainage index and High dissection index occurs inthe places of high drainage density. But this positiverelationship seems to disappear in those dissectionindex areas where others controls the area in place ofdrainage density. In this condition the role of drainagedensity becomes less than other factors to influencedissection index (Table.7). The spatial distribution ofDrainage Density in Parkha watershed shows in Fig.7.The maximum value of drainage density i.e.2.35 km/km2 is attained by moderate dissection index areaswhile the very low dissection index covers minimumrange of drainage density i.e.0.85 km/km2.
5. Conclusion
Lithology has effectively influenced the range ofdissection index.Lithological analysis concluded thatModerate to High dissection index covers maximumarea and the main lithology of which is Saryu-Gumalikhet-Munsiari Formation.The lowest area is covered by verylow dissection index, the lithology of it is NathuakhanFormation. Absolute relief has a positive impact upondissection index not a perfect one. Higher groups ofabsolute displays high dissection index. Relative reliefdetermines a positive impact upon dissection indexalthough perfect one. Slope analyses have a positiveimpact upon dissection index although not a perfectone. The Moderate slope corresponds to highdissection index while Steep slope leads to lowdissection index. Drainage density has a positive impactupon dissection index.
References
Bhunia, Gouri Sankar, Samanta Sailesh and PalBabita(2012): Quantitative Analysis of reliefCharacteristics using Space technology, InternationalJournal of Physical and Social Sciences,Vol-2,Issue 8pp.350-365
Dove Nir (1957): The ratio of relative and absolute altitudeof Mt.Camel.Geog.Rev.47 pp 564- 569.
Dutta Shyamal and Roy Suvendu (2012): Determinationof erosion surface and stage of evolution of Sangradrainage basin in Giridh district, Jharkhand, India,International Journal of Geomatics andGeosciences.Vol 3 No.1,pp 63-73
Gayen Sumita,Bhunia Gauri Sankar and Shit PravatKumar(2013):Morphometric Analysis of Kangshabati- Darkeswar Interfluves Area in West Bengal,Indiausing ASTER DEM and GIS Techniques, Geology &Geosciences, Vol-2,Issue-4, pp 2-10
Joshi Suhas G,and Patil Ashok,T(2009) A Multiplecorrelation between Geomorphic factors and GroundWater Burai Basin ,Shodh,Samikha aur Mulyankan(International Research Journal)Vol.II Issue-7 pp 208-210
Pande, Anita and Joshi, R.C (1994): Geomorphic impactson dissection index: A case study of Upper Saryubasin: Kumaun Himalaya, Geographical Review ofIndia, Vol. 56, No. 4.pp 25-32.
Pareta,Kuldeep and Pareta Upasana(2012): QuantitativeGeomorphological Analysis of a Watershed of RaviRiver Basin,H.P.India,International Journal of RemoteSensing and GIS,Vol-1 pp 41-56
Prakasam,C and Biswas,B(2012):Evolution of GeomorphicResources using GIS technology: A case study ofselected villages in Ausgram Block,Burdwandistrict,West Bengal, India, International Journal ofGeology,Earth and Environmental Sciences, Vol.2,pp.193-205
Singh ,N(1990):Geomorphology of Himalaya river (a casestudy of Tawi basin ),Jay Kay Book House, JammuTawi
Singh, S (Ed.) (2000): Geomorphology(Allahabad) PrayagPustak Bhawan ,pp 642
Smith, G.H. (1935): The Relative Relief of Ohio, Geog.Rev. Vol. 25, pp 272 -284.
Strahler, A.N. (1964). Quantitative geomorphology ofdrainage basin and channel network, Handbook ofApplied Hydrology, pp 39-76.